Abstract
This study evaluates the performance of two-dimensional (2D) detonation simulations against recent experimental measurements for a stoichiometric hydrogen–air mixture at 25 kPa. The validation parameters rely on the average cell size (), the cell size variability (), and the dynamics of both the relative detonation speed (D/DCJ) and the local induction zone length () along the cell cycle. We select Mével 2017’s and San Diego’s chemical models for 2D simulations, after evaluating 13 chemical models with Zeldovich–von Neumann–Döring (ZND) simulations. From this model selection, the effects of nitrogen chemistry and diffusion (Navier–Stokes or Euler equations) are evaluated on the validation parameters. The main findings are as follows: the simulations conducted with the Mével 2017 (with N2 chemistry) model provide the best agreement with (≈17%), while the experimental cell variability () is reproduced within 20% by most simulation cases. This model (Mével 2017 with N2 chemistry) also presents good agreement with both the and D/DCJ dynamics, whereas San Diego’s simulations under-predict them along the cell. Interestingly, the speed decay along the cell length exhibits self-similar behavior across all cases, suggesting independence from cell size variability, unlike the dynamics. Finally, this study demonstrates the minimal impact of the diffusion on the simulation results.
1. Introduction
Hydrogen has emerged as a promising sustainable energy carrier for aviation due to its zero-carbon emissions, high energy density and rapid diffusivity. However, its wide ranging flammability limit (for example, in air, the flammable mixture composition range is 4–74%) and easy detonability introduce additional key challenges in its production, transportation, storage, distribution, and combustion systems [1]. In order to predict the consequences of a major safety hazard such as accidental high pressure H2 release into the atmosphere, the storage unit contamination through air entrainment or flame acceleration in a sufficiently long storage vessel (larger length/diameter ratio) resulting in deflagration-to-detonation transition (DDT) requires further knowledge of the dynamic detonation parameters of such mixtures [2].
The detonation mode of combustion is characterized by a shock wave propagating at a speed of ∼2000 m/s for H2–air mixtures, sustained by the energy released due to combustion. In this process, the combustion is initiated by the compression of the fresh mixture by the shock wave (typically 15–20 times the initial pressure for gaseous mixture [3]), making the detonation wave self-sustaining. This mechanism, wherein burning occurs immediately after compression by a shock, makes detonation an extremely efficient means of extracting energy from fuel [4]. The concept of leveraging this mode of combustion to enhance the thermodynamic efficiencies of conventional engines, which typically operate in deflagration mode, was first proposed by Zel’dovich [5]. Since then, the potential for harnessing the power of detonations has been well established [4,6], but it has only recently attracted significant attention [7], specifically in propulsion systems for aircraft/aerospace applications.
Recent milestones in the rotating engine (RDE) community have strengthened interest in this mode of combustion with several successful ground-level and in-space flight experiments. The longest ground-level experiment (251 s) was achieved in 2023 by NASA’s Marshall Space Flight Center with a LCH4-LOx-fueled RDE [8], while the only in-space (≈150 km altitude) demonstrations of the RDE technology were conducted in 2022 [9] and 2024 [10] with GCH4-GO2-fueled and Lethanol-LN2O RDEs, respectively.
The promise of harnessing detonation is particularly interesting for aerospace applications. Systems such as pulse detonation engines (PDEs) [11,12] and rotating detonation engines (RDEs) [13,14,15,16,17] aim to exploit the inherent high thermodynamic efficiency of detonation [3,6,18] to achieve higher thrust-to-weight ratios in comparison to traditional deflagration-based systems. However, this task comes with significant engineering challenges. The extremely rapid and high-pressure energy release associated with detonations necessitates advanced design strategies to ensure structural integrity [19], cooling requirements [20,21], and operational safety [22]. Consequently, research efforts are concurrently focused on optimizing engine designs that leverage detonation while mitigating the risks of uncontrolled or accidental detonations, especially in the context of hydrogen storage and handling [1,2,22,23,24].
In the classical theory of detonation, as described by the Zeldovich–von Neumann–Döring (ZND) model, a leading shock front compresses the reactive mixture, triggering exothermic chemical reactions in a subsequent finite reaction zone. Although extensive theoretical work has been devoted to explaining detonation phenomena, the ZND model itself is confined to a one-dimensional (1D), steady-state framework. In contrast, high-fidelity simulations that capture the full multidimensional and transient dynamics of detonations are computationally demanding because of the large disparity in time and length scales involved in resolving shock wave propagation and chemical kinetics. As a result, multidimensional (two- or three-dimensional) numerical simulations of detonations have historically been numerically demanding (to cite a few, see refs. [7,25,26,27,28,29,30,31,32,33,34,35]). Advances in numerical methods, such as direct numerical simulation (DNS) [32] and Large-Eddy Simulation (LES) [18,21], have enabled a deeper understanding of the intricate coupling between hydrodynamic shocks and chemical kinetics in detonation waves. Thanks to the advancements in computing power, detailed chemical kinetics models combined with adaptive mesh refinement [32,36] techniques have further refined our understanding of energy release mechanisms and shock front stability, reinforcing the potential of detonation-based combustion systems in aerospace propulsion.
Experimental investigations, such as those using confined geometries and shock tube setups, have demonstrated the critical role of geometry, turbulence, and initial conditions in determining the behavior of hydrogen–air detonations. In the literature, factors such as wall effects and channel configurations [31,37] can significantly affect detonation velocities and cell structures. These insights are crucial for designing propulsion systems where controlled combustion is desired. In addition, advanced diagnostics, such as high-speed imaging [38], schlieren imaging [39], laser-induced fluorescence [40], and combined diagnostics [41,42], have provided valuable insight into the detonation fronts, allowing qualitative and quantitative evaluations. These advancements further bridge the gap between theoretical predictions, numerical validation, and experiments.
Despite advances in theoretical modeling and high-fidelity simulations, our understanding of detonation dynamics remains limited, mainly due to the historical lack of quantitative experimental data for rigorous solver validation beyond the average cell widths (). However, recent experiments on hydrogen detonations [40,41,42,43,44] now provide detailed data, enabling precise experimental–numerical comparisons. These detailed quantitative datasets enhance the predictive capability of computational tools by allowing rigorous solver validation, reducing uncertainties in detonation modeling, and refining the chemical kinetic mechanisms used in simulations. As a result, improved numerical models offer higher confidence for quantitative risk assessments, facilitating safer hydrogen fuel storage, distribution, and combustion system designs for aviation applications. This combined development in experimental validation and high-fidelity simulations strengthens the ability to predict and mitigate detonation risks in hydrogen-powered systems.
In this paper, we investigate stoichiometric H2–air detonations by comparing the cell size metrics, along with the speed and induction zone length dynamics, predicted by our validated open-source OpenFOAM-based [45] solver against experimental data. Although previous studies have examined NOx formation in RDEs [21,46,47] and PDEs [48,49], they focus primarily on emissions rather than the role of nitrogen chemistry in the detonation solution itself. Most hydrogen–air detonation studies treat nitrogen as inert (to name a few, refs. [27,32,33,50,51]), with limited exploration of its impact on the detonation structure. It is also important to emphasize that some dimensionality effect may arise both experimentally [37] and numerically [28]. Based on previous numerical studies [28] and the experimental conditions (i.e., CJ detonations with channel thickness that can accommodate more than three cells), dimensionality effects are expected to play a marginal effect in this study. Therefore, all the simulations that were performed in this study in a 2D rectangular domain have the primary objective of analyzing how nitrogen chemistry and diffusion effects influence key detonation characteristics such as cell size and induction zone length dynamics. Furthermore, this study assesses the influence of the chosen chemical kinetic model along with the role of diffusion (Eulerian vs. Navier–Stokes) on the simulation results.
2. Numerical Methodology
2.1. Governing Equations
In the present study, we perform two-dimensional (2D) numerical simulations of hydrogen detonations for a 2H2+ O2+3.76N2 (stoichiometric hydrogen–air) mixture, at 25 kPa, 300 K. All simulations are performed using an open source OpenFOAM-based solver, reactingPimpleCentralFoam [52,53] in v2012. This solver is validated and verified for its capability in performing detonation simulations [45,54,55], meeting the current state-of-the-art requirements in the literature. We perform simulations considering diffusion (both viscous and heat conduction by using Navier–Stokes equations) and Euler equation solutions to quantify their influence for the mixture under study. In this semi-implicit solver for compressible flows, the convective fluxes are computed using the central-upwind schemes of Kurganov and Tadmor [56]. The governing equations integrated with detailed chemistry for this study are given below in tensorial notation:
Equations (1)–(5) are the differential forms of the governing conservation equations of mass, momentum, species, energy (total enthalpy, form) and ideal gas equation of state, respectively. Here, , T, p, , , , , q and , respectively, denote the number of species, temperature, pressure, density, viscous stress tensor, mass fraction of the species, production rate, energy flux, and heat release rate. The energy flux is the sum of heat diffusion due to thermal conductivity () given by Fourier’s law and diffusion of species with different enthalpies for multi-component mixture . Note that this solver neglects the cross-diffusion effects and assumes a unity Schmidt number () to solver the species diffusion velocities, for all the species. Table 1 summarizes the finite volume numerical schemes employed in our simulations in OpenFOAM notation. The keyword Gauss refers to the finite-volume discretization based on the divergence theorem. Then, the following keywords such as linear and vanAlbada refers to the interpolation and flux-limiting methods used for reconstructing the field values at the cell faces from the cell centers. Furthermore, all the ZND simulations conducted as a part of this study are performed using the MATLAB-based Shock and Detonation Toolbox (SDT) [57].

Table 1.
Numerical schemes used in the simulations.
2.2. Chemical Kinetic Models
As previously indicated, we study a stoichiometric hydrogen–air mixture mixture at 25 kPa and 300 K. We assess several hydrogen–air oxidation models from the literature, some of which were previously studied under detonation conditions as indicated in Table 2. Two quantitative parameters obtained from the ZND simulation, Ng’s cell size ( [58]) and induction zone length (), are compared against the recently reported experimental data [41]. Figure 1a,b summarize this comparison for 13 different kinetic models: Aramco 3.0 [59], Burke 2012 [60], Zhu 2024 [61], Hong 2011 [62], KAUST-Mech 2023 [63], Konnov 2019 [64], Li 2015 [65], Mével 2014 [66], and Mével 2017 (i.e., which is a reduced model of Mével 2009 [67] for H2–air combustion, available in [68,69]), FFCM-2 [70,71], Varga 2015 [72], San Diego 2016 [73], and GRI 3.0 [74]). From Figure 1a, it can be inferred that Mével’s models agree well with the experimental induction zone length at CJ speed, while all the other models predict induction zone length well beyond the experimental uncertainty. For the Ng cell size predictions (see Figure 1b), all the models are beyond twice the experimental mean cell width (that is, the accuracy of the Ng method is a factor of 2 [58]) , while Mével models have the lowest discrepancies and are near the Ng method’s uncertainties. Additional detonation parameters are summarized in Table 2 for each model, as well as the previous usage in detonation studies. The definition employed for estimating the effective activation energy () and the stability parameter () is based on SDT [57]:
Table 2.
Summary of important characteristic length scales for all the chemical models under consideration. Results are obtained with SDT [57]. The parameters are as follows: —induction zone length, —exothermic reaction length (defined as the thermicity half-width [75]), —induction time, —Ng’s correlation based SDT estimation of cell width, —effective activation energy, —stability parameter.
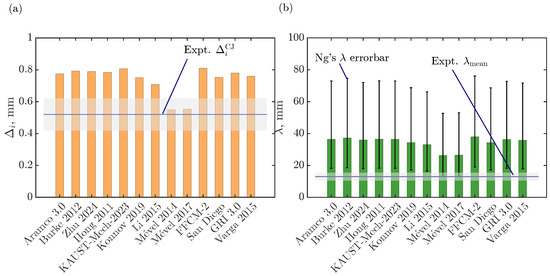
Figure 1.
Quantitative comparison of (a) the induction zone length () and (b) the Ng cell width (), at CJ speed from the ZND solution for various chemical kinetic models with corresponding experimental data [41]. The shaded area corresponds to the experimental uncertainties.
In Equation (6), T and are the temperature and induction time, and these quantities are evaluated at the von Neumann () state, and at the shock speeds perturbed by (i.e., DCJ and DCJ). The in the stability parameter, and in Equation (7) is the exothermic reaction length. In this study, the Mével 2017 and San Diego 2016 models are chosen for the 2D simulations because they effectively represent the entire set of models based on our ZND results (see Figure 1). Based on the effective activation energy in Table 2, the mixture under study is classified as a moderately unstable mixture. In addition to the direct experimental–numerical comparison, both viscous (Navier–Stokes) and inviscid (Euler) simulations are performed to highlight the role of diffusive effects on the solution. This sheds light on the suitable solver to be used for such mixtures. Additionally, the Mével 2017 model is employed with and without its NOx sub-model to assess the impact of NOx chemistry on detonation simulations. Table 3 lists the five cases considered for 2D simulations to address the points outlined above.
Table 3.
List of cases considered for 2D simulations. Here, E refers to Euler, NS stands for Navier–Stokes simulations, and ‘with NOx’ and ‘w/o NOx’ mean ‘with N2 chemistry’ and ‘without N2 chemistry’, respectively.
2.3. Computational Domain and Grid System
All simulations are performed in pseudo-shock-attached frame of reference (p-SFR) under Galilean transformation with a constant relative motion at CJ speed obtained using ZND simulation. Note that this frame of reference is employed in our previous studies [45,54], which show similar results as the classical lab frame of reference while significantly reducing the computational costs (see discussions in [45]). Table 3 indicates the CJ speed in each case for the converged solution. Figure 2 illustrates the schematics of the 2D computational domain initialized with steady-state ZND solution at s, the boundary conditions, and the non-uniform grid system used. The domain is initialized with the fresh gas mixture (2H2 + O2 + 3.76N2 at 25 kPa and 300 K) at CJ speed, entering the domain from the left. We use the circular hot-spots (i.e., region of high pressure and temperature, ten times the initial temperature and pressure) to perturb the initial planar wave. We use slip wall boundary conditions on the top and bottom parts of the domain and zeroGradient boundary condition at the outlet. These boundary conditions are particularly relevant for simulating cellular structures far from the walls, which is in agreement with the experimental data employed in this study. We adopt a uniform grid size starting from the fresh gas and extending to a few induction zone lengths (∼10) behind the shock wave. Then, the grid becomes non-uniform until the outlet with a grid-to-grid expansion ratio of ≃1%. Table 3 also summarizes the domain length and grid specifications, appropriately normalized by the ZND induction length (). Similarly to our previous studies [45,54], these simulation parameters are selected after performing a systematic grid convergence study and a domain independence study to avoid mesh-dependent and mode-locked solutions [33,35,81]. Weng et al. [35] recommend to have 100 of domain length based on their linear stability analysis of detonation mixtures using simplified chemistry. For the present study, we perform simulations with different combinations of domain sizes and find that the solution is independent of the domain length in x-direction for with both chemical models. In the y-direction (), the solution becomes domain independent for with San Diego’s model and for for Mével 2017 model. Similar to our previous studies [45,54], we define the convergence of the solution by monitoring that (i) the wave travels close to the CJ speed with allowed deviation of and (ii) the regularity of the detonation cell size does not change over time. Additionally, based on our previous studies, we confirm that variations in hotspot conditions (position, size, and number) do not significantly affect the cellular structure at sufficiently longer runs (>300 s), as all configurations converge to a similar steady-state solution in the considered weakly unstable mixture.
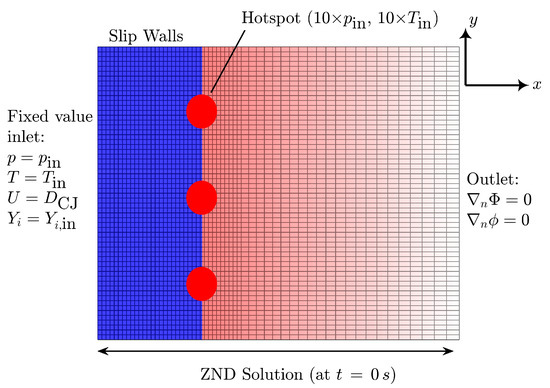
Figure 2.
Schematic illustration of computational domain (not drawn to scale) used in the present study, illustrating also the non-uniform grid system employed (not drawn to scale). The corresponding boundary conditions are indicated in the schematic. Top and bottom boundary conditions are both slip walls.
2.4. Experimental–Numerical Comparison of the Induction Zone
In the context of ZND simulations, the induction zone length () is defined as the distance between the shock front and the point of maximum heat release rate (point of maximum thermicity) [25]. Following this definition, Rojas-Chavez et al. [82] were able to measure from 1D NO-LIF profile evolution in a NO-seeded (2000 ppm) H2–air mixture, by exciting the NO at 225.12 nm, in a rectangular optical detonation duct (see [40,41,82] for details on the experimental setup and measurement procedure of ). With this low concentration, NO tends to be non-reactive in the vicinity of [44,45,82]. For the numerical counterpart, the procedure for measuring in 2D simulations is identical to our previous work on argon diluted H2-O2 mixture [54,83]). Thus, we post-process the numerical 2D fields of temperature, pressure, and species mass fraction using our in-house spectroscopic code KAT-LIF with the same laser excitation wavelength and energy as in the experiments. Details on the spectroscopic code and fluorescence modeling are available in previous studies [54,82,84]. Note that this post-processing step may not be necessary for some chemical models for which the thermicity field can be used directly (see the discussions in the appendix of our previous study [54]).
3. Results and Discussion
This section compares the experimental and numerical results in the following three subsections: (1) comparison of cell size metrics, such as mean cell width () and its variability (); (2) comparison of the induction zone length () dynamics in the cell cycle; and (3) comparison of the relative shock speed decay in the cell cycle. In each case, the effects of the diffusion terms in the numerical solver and the influence of the N2 chemistry on the simulation results are discussed.
3.1. Detonation Cell Size Metrics
Figure 3 illustrates the contours of the normalized detonation speeds (D/DCJ, where D is the local shock speed estimated from the instantaneous shock position () as ), depicting the cellular structure characteristic of detonation waves for various simulation cases. Each contour represents the instantaneous local detonation speed normalized by the CJ speed, allowing for clear visualization of the wave dynamics across the computational domain. In these contour plots, the detonation front propagates from right to left, with the superimposed black solid lines indicating the triple point trajectories at selected time instances. Within a cell, the regions of higher relative speed (D/DCJ > 1) indicate stronger local shocks typically associated with triple-point collisions and Mach stem, while areas of lower speed highlight weaker (incident) shock propagation and expansion regions. The boundaries of the cell reveal the triple point trajectories and their local speed. By comparing these cases, we can visually assess the influence of reactive nitrogen chemistry (N2 chemistry) and diffusive effects (Euler versus Navier–Stokes simulations) on the cellular structures, shock front behavior, and its stability.
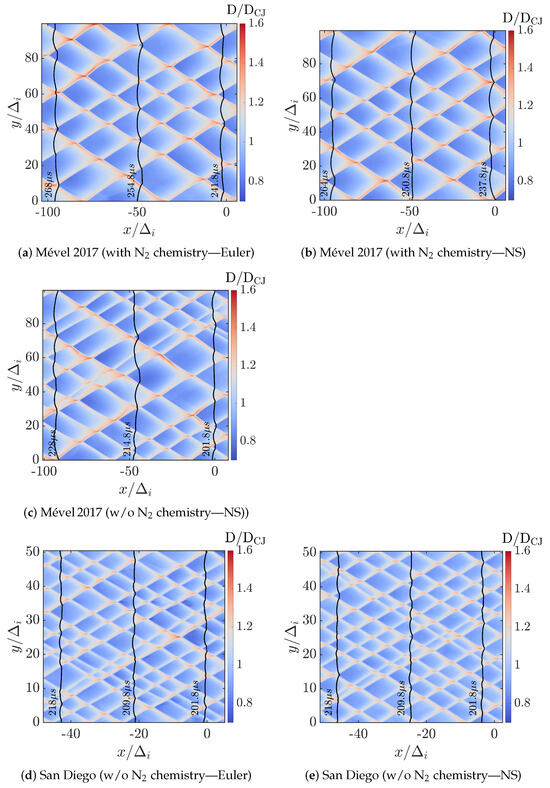
Figure 3.
Contours of relative detonation speeds (D/DCJ) fields illustrating the detonation cells over 20 s after solution convergence (wave propagating from right to left) for all cases. The superimposed black solid lines are the shock fronts at the indicated time instants.
As can be inferred from Figure 3, the overall shock speed ranges from D/DCJ = 0.7 to 1.6, in all the cases studied. This tends to demonstrate the marginal impact of the N2 chemistry and the diffusion effects (i.e., Euler vs. Navier–Stokes) on the speed dynamics, at least for the chemical models and condition considered. The detonation speed decay is further analyzed in Section 3.3.
Table 4 summarizes the quantitative comparison of the mean cell widths () and the cell size variability () between the numerical and experimental data. While the predicted by all the models without N2 chemistry deviates by a factor of 2–3, simulations conducted with Mével 2017’s model with N2 chemistry have the lowest discrepancy (within 20%), for conditions with and without diffusion effects. When the N2 chemistry is removed from Mével 2017, the predicted is significantly reduced (≈−30%) as observed between Figure 3b,c, and deviates from the experimental one. For the cell size variability (), simulations conducted with Mével 2017’s models and N2 chemistry or San Diego’s models (i.e., both without N2 chemistry) reproduce the experimental cell variability within 20%. Taking into account both experimental and numerical uncertainties in , all these simulations are considered to be satisfactorily reproducing the variability of the experimental cell size. As observed previously for , removing the N2 chemistry from Mével 2017 model increases the discrepancies with the experimental results.
Table 4.
Comparison of the detonation cell size metrics between numerical and experimental data. Here, E refers to Euler, NS stands for Navier–Stokes simulations, and ‘with NOx’ and ‘w/o NOx’ mean ‘with N2 chemistry’ and ‘without N2 chemistry’, respectively.
This section reveals that the N2 chemistry is critical for simulating H2–air detonations, at least for the selected chemical models and pressure considered, to have close experimental–numerical agreement of the cell size metrics (that is, and ).
3.2. Experimental vs. Numerical Induction Zone Length Evolution Along the Cellular Cycle
Figure 4 compares the experimental [41] and numerical evolution of over multiple cells as a function of the normalized detonation speed (D/DCJ) for all the cases listed in Table 3. Numerically, ten cells are randomly selected from the ones represented in Figure 3 to extract the evolution of the induction zone over the cell cycle, after KAT-LIF post-processing (see Section 2.4). Experimentally, detection limits in the range of 10 pixels are typically encountered with the NO-PLIF technique, with larger experimental uncertainties in its vicinity. Thus, the observed plateau of induction zones, where = 0.15–0.2 mm, is most probably related to this detection limit and/or the relatively large experimental uncertainties rather than an actual range of constant induction zone. For this reason, experimental induction zone lengths below 0.2 mm and D/DCJ speed above 1.5 are not considered a reliable validation target in the following discussion. For all cases, the numerical data generally follow the expected trend of the induction zone length () dynamics by monotonically decreasing with D/DCJ. Simulations conducted with Mével 2017’s model and N2 chemistry (Figure 4a,b) show reasonable agreement with the experimental data, with a slight under-prediction of the induction zone length at higher D/DCJ. All the other simulations, conducted without the N2 chemistry (Figure 4c–e), show a more noticeable discrepancy in both the range of and the value of for fixed values of D/DCJ. On average, the simulations conducted with San Diego’s model or with Mével 2017’s model without N2 chemistry are underestimating the induction zone lengths. Furthermore, the inclusion of the N2 chemistry makes more sensitive to the D/DCJ variations in the second part of the cycle (see, D/DCJ < 1 in Figure 4a,b).
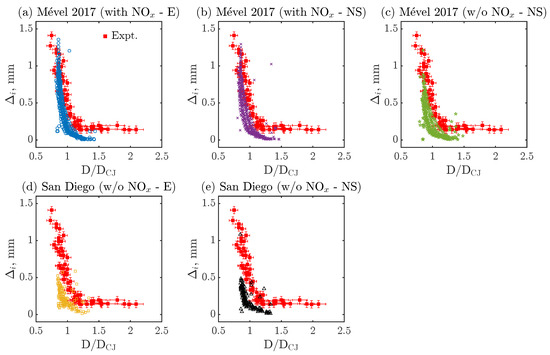
Figure 4.
Quantitative comparison of induction zone length () as a function of normalized detonation speed (D/DCJ) between numerical and experimental data for various chemical models. Here, E refers to Euler, NS stands for Navier–Stokes simulations, and ‘with NOx’ and ‘w/o NOx’ means ‘with N2 chemistry’ and ‘without N2 chemistry’, respectively.
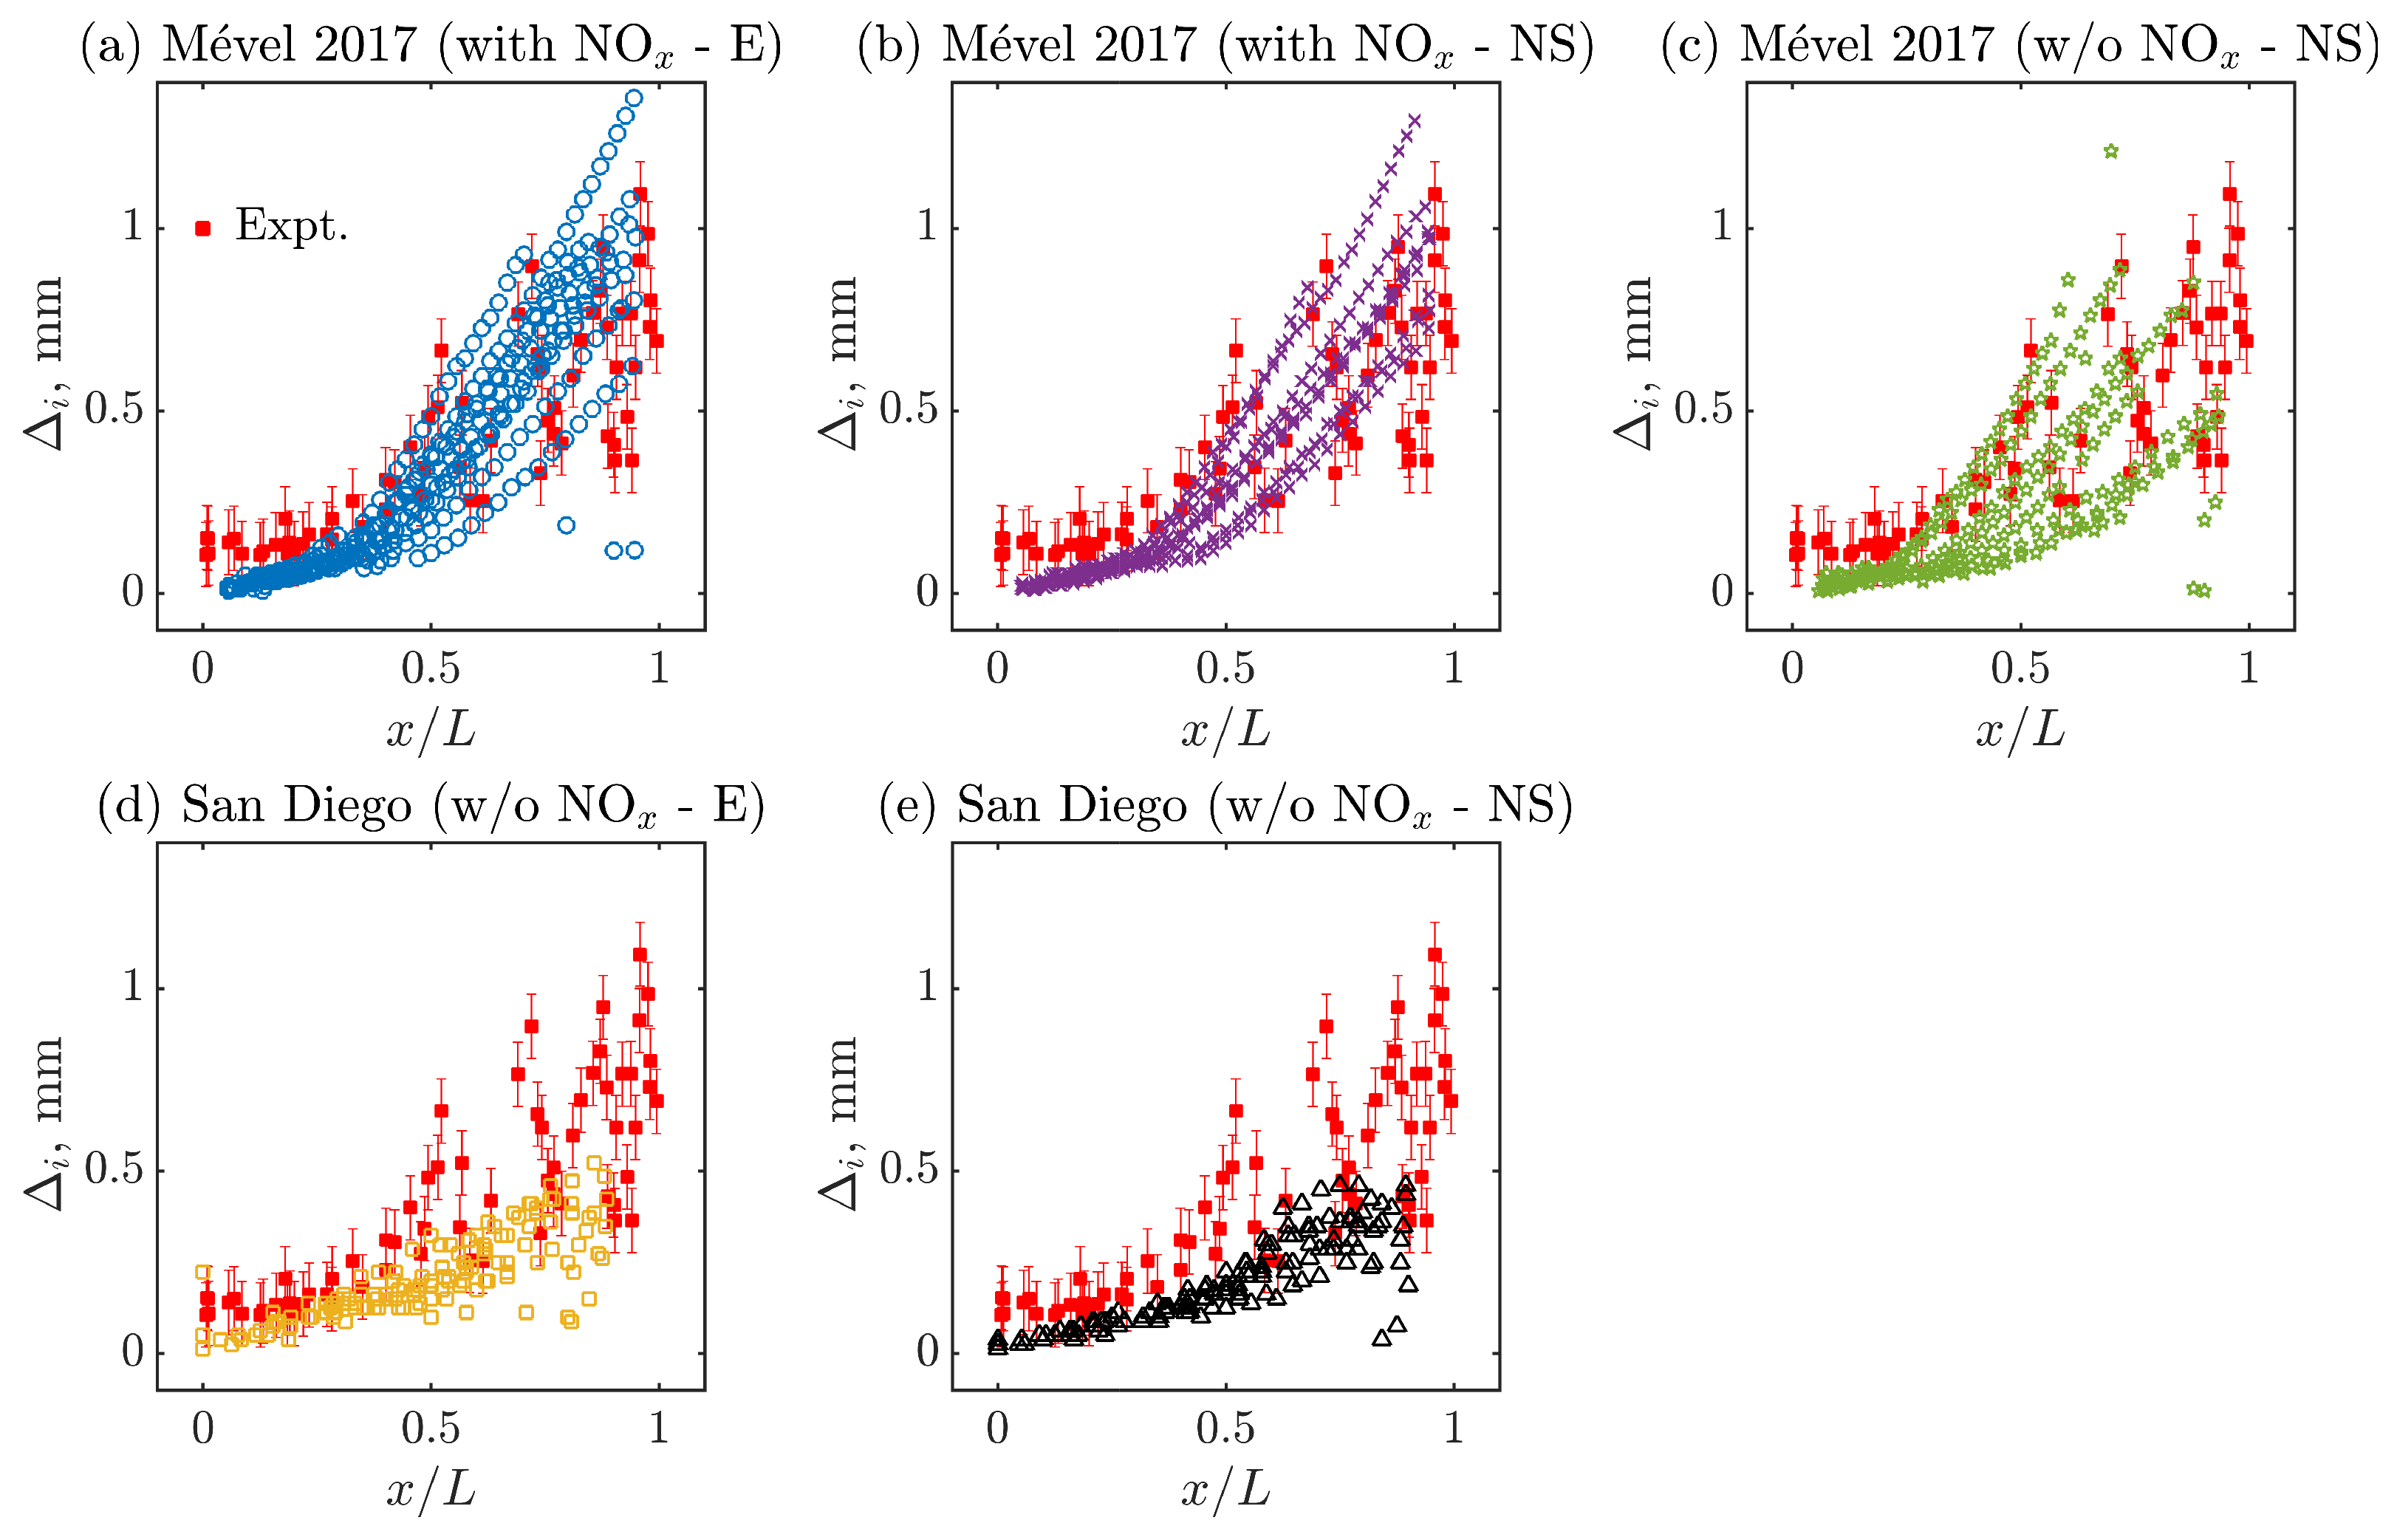
Based on the results of Figure 4, the evolution of the induction zone length is now represented as a function of the normalized cell length () in Figure 5a–e. Once again, the simulations conducted with Mével 2017 model and reactive nitrogen chemistry (N2 chemistry) agree well with the experiment as opposed to the simulations conducted with the chemical models with inert nitrogen chemistry. In addition, a negligible effect of the diffusion is observed, when comparing Figure 5a,b or Figure 5d,e. It must be noted that the scatter of the data is highly correlated with the cell size variability (see Table 4; the higher the variability, the larger the scatter of the data). Such findings are in agreement with the experimental observations between two different mixtures in [41]. Moreover, the evolution of for all cases appears to overlap for the first part of the normalized cell length, then starts to deviate for the second part of the cycle. This transition corresponds to the relative distance () at which the relative detonation speed transits from D/DCJ > 1 to D/DCJ < 1 (see Figure 6). This behavior is consistent among all models but more visible for Mével 2017’s model (see Figure 5a–c) that shows relatively higher cell size variability (). Overall, the inclusion of N2 chemistry improves the experimental–numerical agreement by increasing the cell size variability and dynamics, while no significant effects of the diffusion are found.

Figure 5.
Evolution of induction zone length along the normalized cell length () for all models. Here, E refers to Euler, NS stands for Navier–Stokes simulations, and ‘with NOx’ and ‘w/o NOx’ mean ‘with N2 chemistry’ and ‘without N2 chemistry’, respectively.

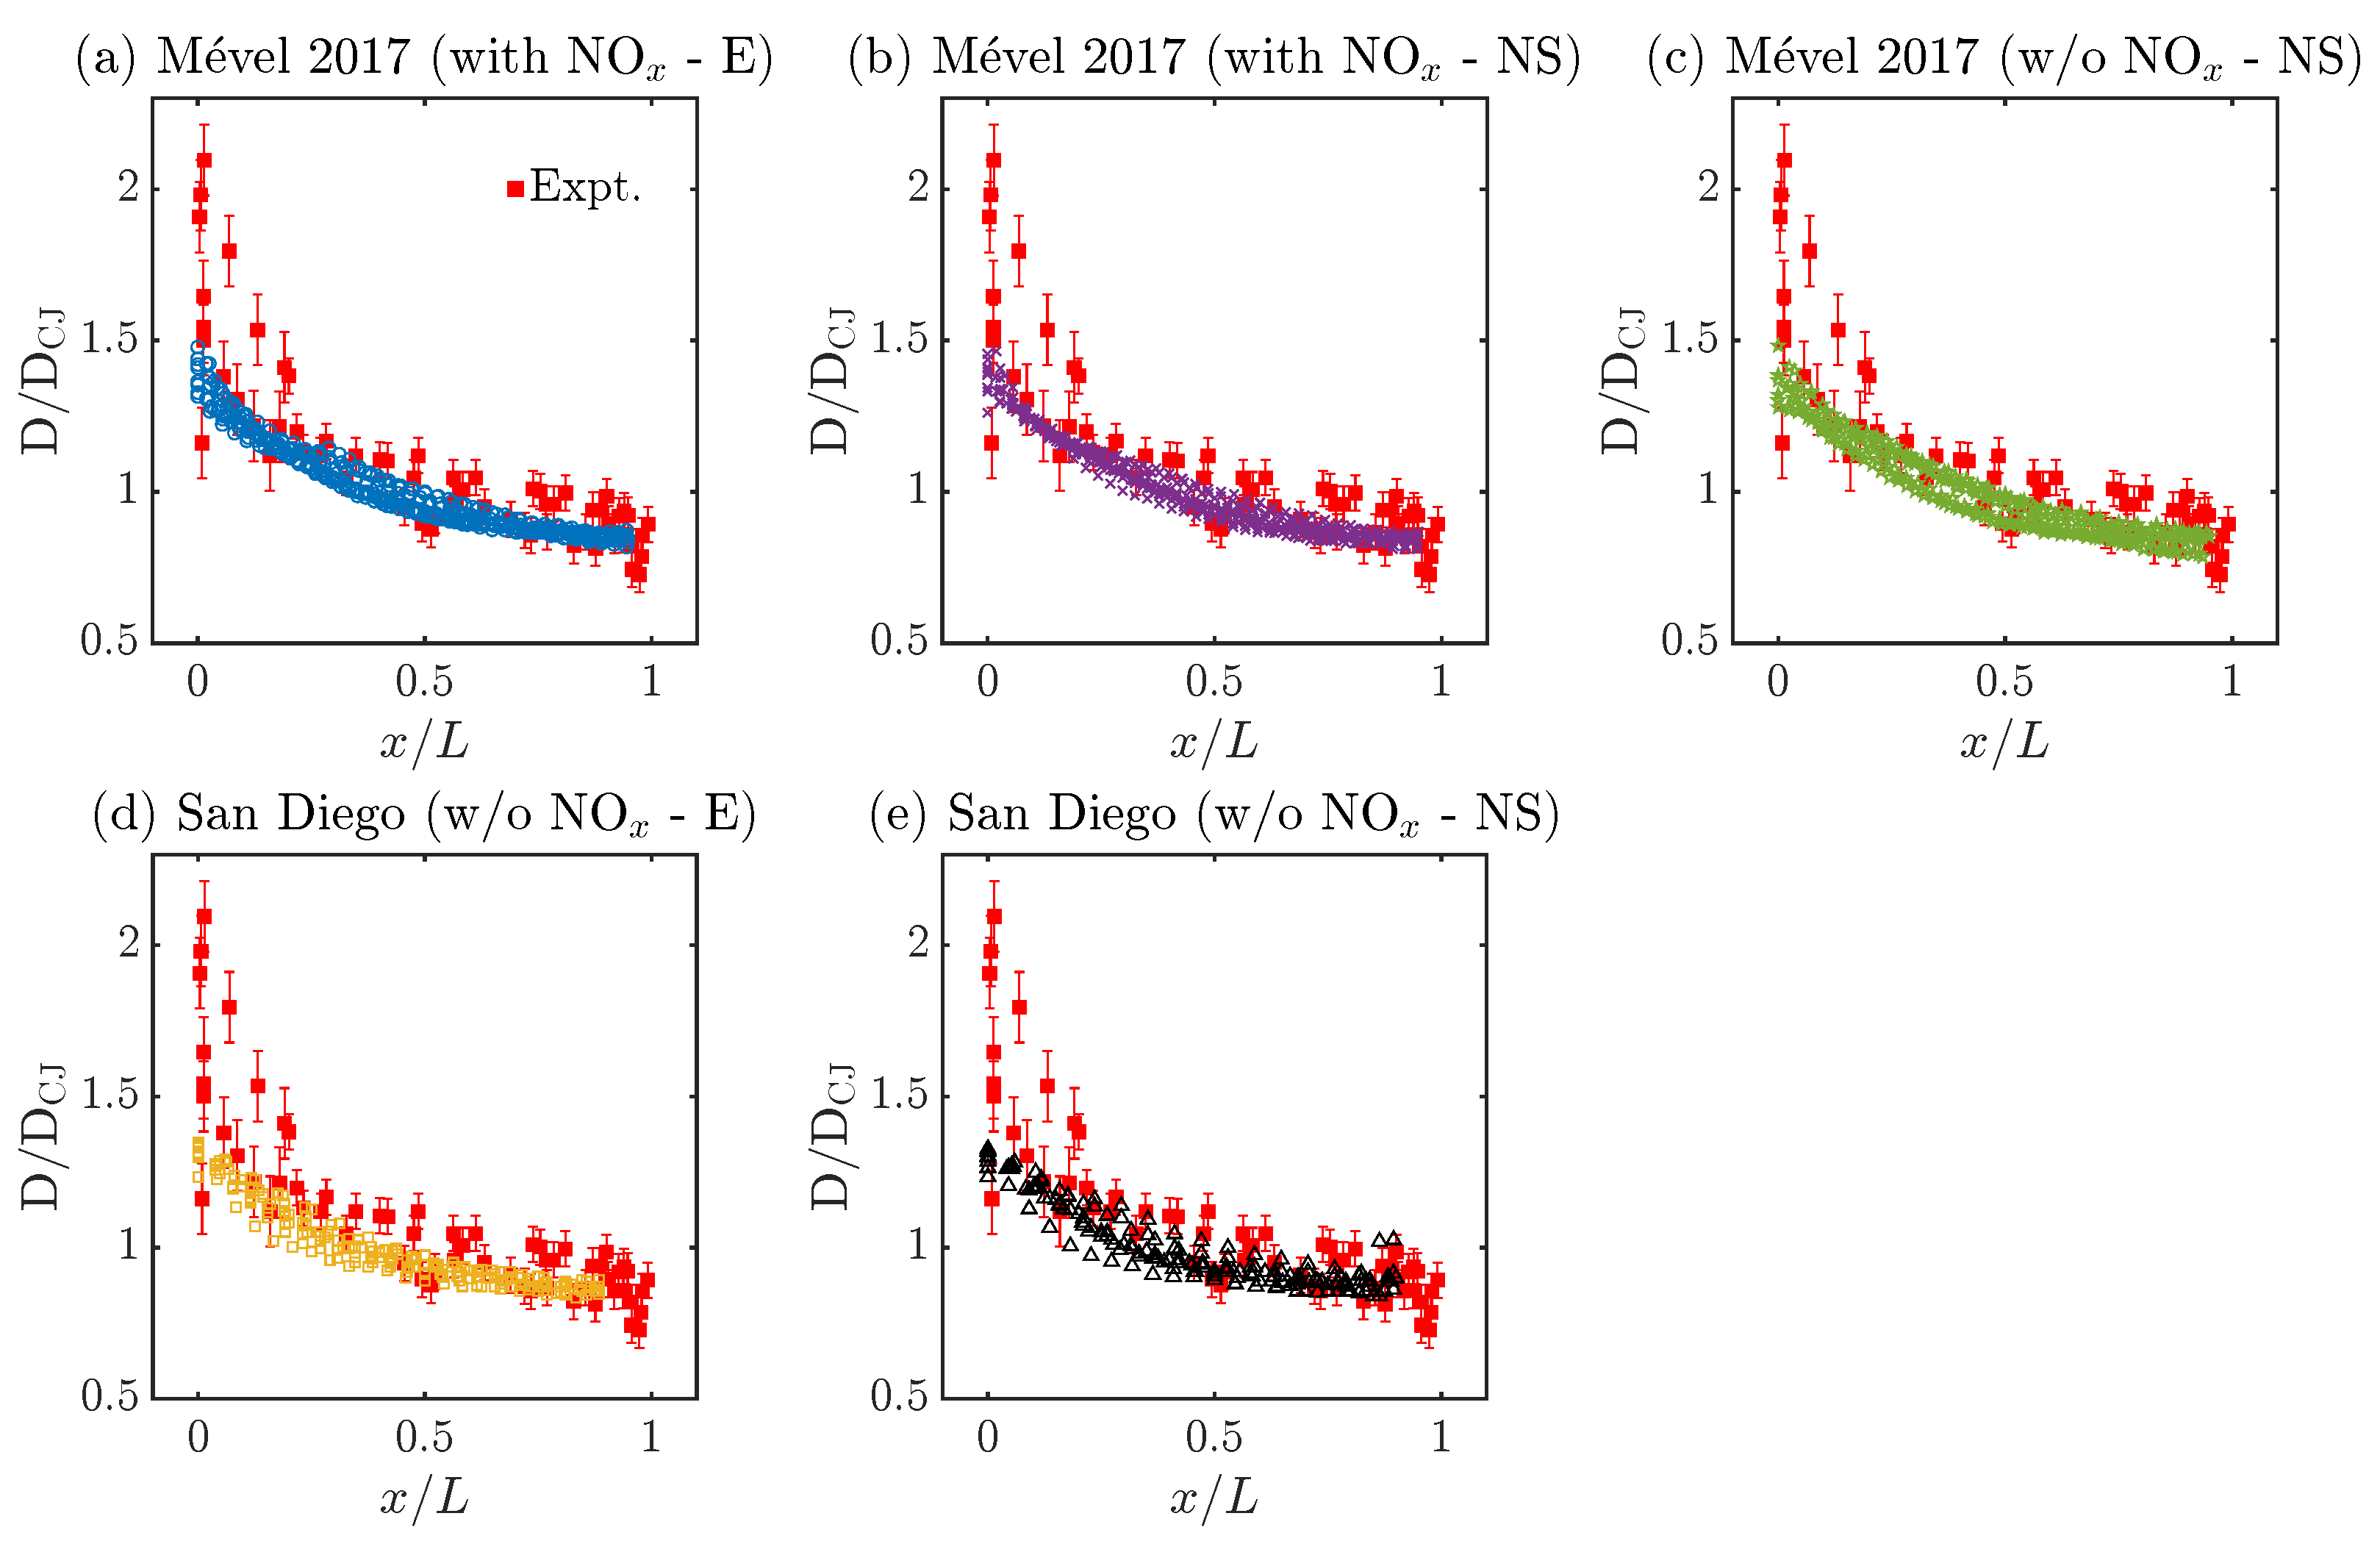
Figure 6.
Evolution of normalized shock speed (D/DCJ) along the cell cycle (). Here, E refers to Euler, NS stands for Navier–Stokes simulations, and ‘with NOx’ and ‘w/o NOx’ mean ‘with N2 chemistry’ and ‘without N2 chemistry’, respectively.
This section demonstrates that the N2 chemistry is essential to reproduce the induction zone dynamics in H2–air detonation, while the role of diffusion is less important. Note that both the Mével 2017 chemical models—with and without the NOx chemistry—exhibit very similar thermodynamic states at the von Neumann and CJ conditions in both ZND and 2D simulations. However, significant differences in the cellular dynamics (Figure 3a,c) and local induction zone lengths (see Figure 4) are observed in the detailed 2D simulations. This indicates that the chemical kinetics associated with N2 chemistry introduce new reaction pathways as discussed in [85] for subsonic combustion, playing a crucial role in defining the cellular structures and induction zone. Also note that the negligible role of diffusion is consistent with the recent results of Watanabe et al. [77] obtained on different mixtures with a different chemical model (Hong 2011 [62]).
3.3. Experimental vs. Numerical Shock Speed Evolution as a Function of Cell Length
Figure 6 illustrates the evolution of the relative detonation speed (D/DCJ) as a function of the normalized cell length (). All simulations agree reasonably well with the experimental speed decay, within or very close to the experimental uncertainties for most of the cell cycle. It should be noted that the shock speed at the beginning of the cell, near , is relatively high for the experimental measurements compared to all the simulation results. The observed discrepancies can be associated with four phenomena: the rather high experimental uncertainties on the speed measurements near the triple point collisions; the indirect experimental measurements of , relying on the conversion of distance between triple points into relative cell lengths for an average cell cycle (see the methodology section in [41]); the numerical methodology employed to analyze the cellular cycle, which tends to neglect points near triple point collisions (see methodology section in [54]); and the different experimental and numerical approaches employed to resolve the average cell cycle, which rely on 40 single-shot measurements (i.e., 40 different cell cycle) and 10 finely resolved cell cycles, respectively. Thus, drawing definitive conclusions on the experimental–numerical accuracy for very short distances (near 0) or high D/DCJ values () seems unrealistic. However, it can be concluded that both chemical models agree well with the experimental observations in terms of the speed decay, regardless of the usage of N2 chemistry or diffusion effects. In fact, all speed profiles collapse onto a single curve with marginal cell-to-cell variabilities. Despite significant variations in the cell sizes, the normalized length scaling reveals a self-similar behavior, suggesting that the speed decay is independent of the cell size variability as opposed to the induction zone dynamics (see Figure 5).
4. Conclusions
In this study, we conducted 2D numerical simulations of a moderately unstable hydrogen–air mixture under stoichiometric conditions using two chemical models: Mével 2017 and San Diego 2016. The simulations were performed in a rectangular domain employing non-uniform grid strategies to optimize computational efficiency. The influence of diffusion effects (Euler vs. Navier–Stokes) and nitrogen chemistry on detonation cell size metrics and the evolution of both the relative detonation speed and the induction zone length over multiple cellular cycles were systematically analyzed and compared against experimental data. The key findings are summarized as follows:
- The comparison between numerical and experimental detonation cell size metrics highlights the crucial role of reactive nitrogen chemistry (i.e., N2 chemistry). The chemical model incorporating reactive nitrogen (Mével 2017 with N2 chemistry) yields mean detonation cell widths of 10.8 mm (Euler) and 10.9 mm (Navier–Stokes), closely matching the experimental mean of 13 mm. In contrast, models treating nitrogen as an inert species (Mével 2017 w/o N2 chemistry and San Diego) significantly underestimate the cell size, predicting values of 7.5 mm and 4.5 mm, respectively. Although the best agreement is obtained for Mével 2017 with the N2 chemistry, its impact on cell variability () is less pronounced. These results suggest that reactive nitrogen chemistry is essential for accurately capturing the average cell structures, but it is less important to capture the cell variability.
- Analysis of the local induction zone length () dynamics as a function of the relative detonation speed (D/DCJ) reveals that the simulations conducted with the Mével 2017 model with reactive nitrogen chemistry effectively reproduces both the range and the trend of over a detonation cell cycle. In contrast, simulations conducted without N2 chemistry tend to systematically under-predict . A similar trend is also observed when is analyzed with respect to the normalized cell length (), which further emphasizes the importance of nitrogen chemistry in accurately capturing H2–air detonation wave dynamics.
- Comparisons between Euler and Navier–Stokes simulations indicate that viscous diffusion and thermal conduction have minimal impact on the detonation structure, irrespective of the chemical model used. This extends the recent observations reported by Watanabe et al. [77] obtained on different mixtures with a different chemical model.
Overall, this study emphasizes the significant impact of chemical kinetic model selection on accurately reproducing detonation characteristics. In particular, considering reactive N2 is crucial for achieving better reproduction of the average cell structure (), cell variability (), and cell dynamics (i.e., speed profile or induction zone evolution over the cellular cycle) in the present condition. As reported in our previous studies on argon-diluted mixtures, multiparameter measurements beyond cell-size metrics are essential for assessing the predictive performance of chemical models in numerical simulation of detonations. In future studies, detailed quantitative comparisons of H2–air detonations should focus on comparing the performance of multiple detailed kinetic models that include N2 chemistry in Eulerian-based simulations rather than employing simplified chemistry, without N2 chemistry, with diffusion effects.
5. Computational Resource Utilization
The summary of the 2D computational grids and the corresponding number of CPU hours for all the cases are summarized in Table 5.
Table 5.
Summary of CPU hours used for performing 2D numerical simulations.
Author Contributions
V.S.: Writing—original draft, Investigation, Data curation, Conceptualization. K.P.C.: Writing—review and editing, Supervision, Investigation, Data curation, Conceptualization. D.A.L.: Writing—review and editing, Supervision, Funding acquisition, Conceptualization. All authors have read and agreed to the published version of the manuscript.
Funding
This work has been supported by the King Abdullah University of Science and Technology through the baseline fund BAS/1/1396-01-01. For computer time, this research used the resources of the Supercomputing Laboratory at King Abdullah University of Science & Technology (KAUST).
Data Availability Statement
The data that support the findings of this study are available from the corresponding author upon reasonable request.
Conflicts of Interest
The authors declare that they have no known competing financial interests or personal relationships that could have appeared to influence the work reported in this paper.
References
- Yang, F.; Wang, T.; Deng, X.; Dang, J.; Huang, Z.; Hu, S.; Li, Y.; Ouyang, M. Review on hydrogen safety issues: Incident statistics, hydrogen diffusion, and detonation process. Int. J. Hydrogen Energy 2021, 46, 31467–31488. [Google Scholar] [CrossRef]
- Ng, H.D.; Lee, J.H.S. Comments on explosion problems for hydrogen safety. J. Loss Prev. Process Ind. 2008, 21, 136–146. [Google Scholar] [CrossRef]
- Wolański, P. Detonative propulsion. Proc. Combust. Inst. 2013, 34, 125–158. [Google Scholar] [CrossRef]
- Kailasanath, K. Review of propulsion applications of detonation waves. AIAA J. 2000, 38, 1698–1708. [Google Scholar] [CrossRef]
- Zeldovich, Y.B. To the question of energy use of detonation combustion. J. Propuls. Power 2006, 22, 588–592. [Google Scholar] [CrossRef]
- Wintenberger, E.; Shepherd, J.E. Thermodynamic cycle analysis for propagating detonations. J. Propuls. Power 2006, 22, 694–698. [Google Scholar] [CrossRef]
- Oran, E.S.; Gamezo, V.N. Origins of the deflagration-to-detonation transition in gas-phase combustion. Combust. Flame 2007, 148, 4–47. [Google Scholar] [CrossRef]
- Osorio, R.J. NASA’s 3D-Printed Rotating Detonation Rocket Engine Test a Success. 2023. Available online: https://www.nasa.gov/centers-and-facilities/marshall/nasas-3d-printed-rotating-detonation-rocket-engine-test-a-success/ (accessed on 28 February 2025).
- Goto, K.; Matsuoka, K.; Matsuyama, K.; Kawasaki, A.; Watanabe, H.; Itouyama, N.; Ishihara, K.; Buyakofu, V.; Noda, T.; Kasahara, J.; et al. Space Flight Demonstration of Rotating Detonation Engine Using Sounding Rocket S-520-31. J. Spacecr. Rockets 2023, 60, 273–285. [Google Scholar] [CrossRef]
- Sato, T.; Matsuoka, K.; Itouyama, N.; Yasui, M.; Matsuyama, K.; Ide, Y.; Nakata, K.; Suzuki, Y.; Ishibashi, R.; Suzuki, S.; et al. Flight Demonstration of Detonation Engine System Using Sounding Rocket S-520-34: Performance of Rotating Detonation Engine Using Liquid Propellants. In Proceedings of the AIAA SCITECH 2025 Forum, Orlando, FL, USA, 6–10 January 2025. Article No. 174. [Google Scholar] [CrossRef]
- Pandey, K.; Debnath, P. Review on recent advances in pulse detonation engines. J. Combust. 2016, 2016, 4193034. [Google Scholar] [CrossRef]
- Kailasanath, K. Recent developments in the research on pulse detonation engines. AIAA J. 2003, 41, 145–159. [Google Scholar] [CrossRef]
- Yi, T.H.; Lou, J.; Turangan, C.; Choi, J.Y.; Wolanski, P. Propulsive performance of a continuously rotating detonation engine. J. Propuls. Power 2011, 27, 171–181. [Google Scholar] [CrossRef]
- Zhou, R.; Wu, D.; Wang, J. Progress of continuously rotating detonation engines. Chin. J. Aeronaut. 2016, 29, 15–29. [Google Scholar] [CrossRef]
- Schwer, D.; Kailasanath, K. Numerical investigation of the physics of rotating-detonation-engines. Proc. Combust. Inst. 2011, 33, 2195–2202. [Google Scholar] [CrossRef]
- Raman, V.; Prakash, S.; Gamba, M. Nonidealities in rotating detonation engines. Annu. Rev. Fluid Mech. 2023, 55, 639–674. [Google Scholar] [CrossRef]
- Xu, X.; Han, Q.; Zhang, Y. Numerical Investigation of the Effect of Equivalent Ratio on Detonation Characteristics and Performance of CH4/O2 Rotating Detonation Rocket Engine. Aerospace 2025, 12, 68. [Google Scholar] [CrossRef]
- Pal, P.; Demir, S.; Kundu, P.; Som, S. Large-eddy simulations of methane-oxygen combustion in a rotating detonation rocket engine. In Proceedings of the AIAA Propulsion and Energy 2021 Forum, Virtual Event, 9–11 August 2021. Paper 3642. [Google Scholar] [CrossRef]
- Wei, H.; Kayser, T.; Bach, E.; Paschereit, C.O.; Bohon, M.D. Comparative Analysis of Total Pressure Measurement Techniques in Rotating Detonation Combustors. J. Eng. Gas Turbine. Power 2024, 146, 111022. [Google Scholar] [CrossRef]
- Sridhara, S.R.; Andreini, A.; Polanka, M.D.; Bohon, M.D. The impact of film cooling on the heat release within a rotating detonation combustor. Appl. Energy Combust. Sci. 2024, 20, 100300. [Google Scholar] [CrossRef]
- Ramanagar Sridhara, S.; Andreini, A.; Polanka, M.D.; Bohon, M.D. LES Investigation of Film Cooling in Rotating Detonation Combustors. In Proceedings of the Turbo Expo: Power for Land, Sea, and Air, London, UK, 24–28 June 2024; American Society of Mechanical Engineers: New York, NY, USA, 2024; Volume 87998, p. V007T11A005. [Google Scholar] [CrossRef]
- Nikitin, V.F.; Mikhalchenko, E.V. Safety of a rotating detonation engine fed by acetylene–oxygen mixture launching stage. Acta Astronaut. 2022, 194, 496–503. [Google Scholar] [CrossRef]
- Middha, P.; Hansen, O.R. Using computational fluid dynamics as a tool for hydrogen safety studies. J. Loss Prev. Process Ind. 2009, 22, 295–302. [Google Scholar] [CrossRef]
- Grüne, J.; Kuznetsov, M.; Lelyakin, A.; Jordan, T. Spontaneous ignition processes due to high-pressure hydrogen release in air. In Proceedings of the International Conference on Hydrogen Safety 2011, San Francisco, CA, USA, 12–14 September 2011. [Google Scholar]
- Lee, J. The Detonation Phenomenon; Cambridge University Press: Cambridge, UK, 2008. [Google Scholar] [CrossRef]
- Watanabe, H.; Matsuo, A.; Chinnayya, A.; Itouyama, N.; Kawasaki, A.; Matsuoka, K.; Kasahara, J. Lagrangian dispersion and averaging behind a two-dimensional gaseous detonation front. J. Fluid Mech. 2023, 968, A28. [Google Scholar] [CrossRef]
- Tsuboi, N.; Katoh, S.; Hayashi, A.K. Three-dimensional numerical simulation for hydrogen/air detonation: Rectangular and diagonal structures. Proc. Combust. Inst. 2002, 29, 2783–2788. [Google Scholar] [CrossRef]
- Crane, J.; Lipkowicz, J.T.; Shi, X.; Wlokas, I.; Kempf, A.M.; Wang, H. Three-dimensional detonation structure and its response to confinement. Proc. Combust. Inst. 2023, 39, 2915–2923. [Google Scholar] [CrossRef]
- Crane, J.; Lipkowicz, J.T.; Shi, X.; Wlokas, I.; Kempf, A.M.; Wang, H. Detonation thermodynamic state statistics: 2D and 3D simulations in hydrogen-oxygen. In Proceedings of the 29th ICDERS, Siheung, Republic of Korea, 23–28 July 2023. Article No. 244. [Google Scholar]
- Mazaheri, K.; Mahmoudi, Y.; Radulescu, M.I. Diffusion and hydrodynamic instabilities in gaseous detonations. Combust. Flame 2012, 159, 2138–2154. [Google Scholar] [CrossRef]
- Xiao, Q.; Sow, A.; Maxwell, B.M.; Radulescu, M.I. Effect of boundary layer losses on 2D detonation cellular structures. Proc. Combust. Inst. 2021, 38, 3641–3649. [Google Scholar] [CrossRef]
- Ullman, M.; Prakash, S.; Barwey, S.; Raman, V. Detonation structure in the presence of mixture stratification using reaction-resolved simulations. Combust. Flame 2024, 264, 113427. [Google Scholar] [CrossRef]
- Taylor, B.; Kessler, D.; Gamezo, V.; Oran, E. Numerical simulations of hydrogen detonations with detailed chemical kinetics. Proc. Combust. Inst. 2013, 34, 2009–2016. [Google Scholar] [CrossRef]
- Choi, J.; Ma, F.; Yang, V. Some numerical issues on simulation of detonation cell structures. Combust. Explos. Shock Waves 2008, 44, 560–578. [Google Scholar] [CrossRef]
- Weng, Z.; Mével, R. Dynamics of detonation cellular structure in linear and nonlinear instability regimes. Proc. Combust. Inst. 2024, 40, 105438. [Google Scholar] [CrossRef]
- Weng, Z.; Mével, R. Implementation of an OpenFOAM solver for shock and detonation simulation at high pressure. Comput. Fluids 2023, 265, 106012. [Google Scholar] [CrossRef]
- Monnier, V.; Rodriguez, V.; Vidal, P.; Zitoun, R. An analysis of three-dimensional patterns of experimental detonation cells. Combust. Flame 2022, 245, 112310. [Google Scholar] [CrossRef]
- Hencel, R.; Abbate, S.; Longer, M.; Cho, K.Y. High-speed imaging of gaseous detonations in rectangular curved channels with representative widths for RDEs. In Proceedings of the AIAA SCITECH 2025 Forum, Orlando, FL, USA, 6–10 January 2025. Paper 170. [Google Scholar] [CrossRef]
- Pintgen, F.; Eckett, C.A.; Austin, J.M.; Shepherd, J.E. Direct observations of reaction zone structure in propagating detonations. Combust. Flame 2003, 133, 211–229. [Google Scholar] [CrossRef]
- Rojas Chavez, S.B.; Chatelain, K.P.; Lacoste, D.A. Two-dimensional visualization of induction zone in hydrogen detonations. Combust. Flame 2023, 255, 112905. [Google Scholar] [CrossRef]
- Alicherif, M.; Rojas Chavez, S.B.; Chatelain, K.P.; Guiberti, T.F.; Lacoste, D.A. Experimental characterization of the cell cycle for multicellular detonations. Combust. Flame 2024, 266, 113553. [Google Scholar] [CrossRef]
- Rojas Chavez, S.; Chatelain, K.P.; Alicherif, M.; Lacoste, D.A. Characterization of detonation waves by simultaneous OH and NO planar laser-induced fluorescence. Appl. Energy Combust. Sci. 2024, 18, 100257. [Google Scholar] [CrossRef]
- Chatelain, K.P.; He, Y.; Mével, R.; Lacoste, D.A. Effect of the reactor model on steady detonation modeling. Shock Waves 2021, 31, 323–335. [Google Scholar] [CrossRef]
- Chatelain, K.P.; Rojas Chavez, S.B.; Vargas, J.; Lacoste, D.A. Towards laser-induced fluorescence of nitric oxide in detonation. Shock Waves 2023, 33, 179–189. [Google Scholar] [CrossRef]
- Sankar, V.; Chatelain, K.P.; Melguizo-Gavilanes, J.; Lacoste, D.A. Validation of high speed reactive flow solver in OpenFOAM with detailed chemistry. OpenFOAM J. 2024, 4, 1–25. [Google Scholar] [CrossRef]
- Van Beck, C.; Raman, V. NOx formation processes in rotating detonation engines. Front. Aerosp. Eng. 2024, 3, 1335906. [Google Scholar]
- Schwer, D.A.; Kailasanath, K. Characterizing NOx emissions for air-breathing rotating detonation engines. In Proceedings of the 52nd AIAA/SAE/ASEE Joint Propulsion Conference, Salt Lake City, UT, USA, 25–27 July 2016. Article No. 4779. [Google Scholar] [CrossRef]
- Djordjevic, N.; Hanraths, N.; Gray, J.; Berndt, P.; Moeck, J. Numerical study on the reduction of NOx emissions from pulse detonation combustion. J. Eng. Gas Turbines Power 2018, 140, 041504. [Google Scholar] [CrossRef]
- Yungster, S.; Radhakrishnan, K.; Breisacher, K. Computational study of NOx formation in hydrogen-fuelled pulse detonation engines. Combust. Theory Model. 2006, 10, 981–1002. [Google Scholar] [CrossRef]
- Oran, E.; Boris, J.; Young, T.; Flanigan, M.; Burks, T.; Picone, M. Numerical simulations of detonations in hydrogen-air and methane-air mixtures. Proc. Combust. Inst. 1981, 18, 1641–1649. [Google Scholar] [CrossRef]
- Heidari, A.; Wen, J.X. Numerical simulation of flame acceleration and deflagration to detonation transition in hydrogen-air mixture. Int. J. Hydrogen Energy 2014, 39, 21317–21327. [Google Scholar] [CrossRef]
- Kraposhin, M.; Bovtrikova, A.; Strijhak, S. Adaptation of Kurganov-Tadmor numerical scheme for applying in combination with the PISO method in numerical simulation of flows in a wide range of Mach numbers. Procedia Comput. Sci. 2015, 66, 43–52. [Google Scholar] [CrossRef]
- Kraposhin, M.V.; Banholzer, M.; Pfitzner, M.; Marchevsky, I.K. A hybrid pressure-based solver for nonideal single-phase fluid flows at all speeds. Int. J. Numer. Methods Fluids 2018, 88, 79–99. [Google Scholar] [CrossRef]
- Sankar, V.; Chatelain, K.P.; Lacoste, D.A. Evaluation of chemical kinetic models for simulations of hydrogen detonations by comparison with experimental data. Appl. Energy Combust. Sci. 2025, 21, 100306. [Google Scholar] [CrossRef]
- Melguizo-Gavilanes, J.; Rodriguez, V.; Vidal, P.; Zitoun, R. Dynamics of detonation transmission and propagation in a curved chamber: A numerical and experimental analysis. Combust. Flame 2021, 223, 460–473. [Google Scholar] [CrossRef]
- Kurganov, A.; Tadmor, E. New high-resolution central schemes for nonlinear conservation laws and convection–diffusion equations. J. Comput. Phys. 2000, 160, 241–282. [Google Scholar] [CrossRef]
- Browne, S.; Ziegler, J.; Bitter, N.; Schmidt, B.; Lawson, J.; Shepherd, J. Numerical Tools for Shock and Detonation Wave Modeling; Technical Report; Explosion Dynamics Laboratory, GALCIT: Pasadena, CA, USA, 2021. [Google Scholar]
- Ng, H.D.; Ju, Y.; Lee, J.H.S. Assessment of detonation hazards in high-pressure hydrogen storage from chemical sensitivity analysis. Int. J. Hydrogen Energy 2007, 32, 93–99. [Google Scholar] [CrossRef]
- Zhou, C.W.; Li, Y.; Burke, U.; Banyon, C.; Somers, K.P.; Ding, S.; Khan, S.; Hargis, J.W.; Sikes, T.; Mathieu, O.; et al. An experimental and chemical kinetic modeling study of 1, 3-butadiene combustion: Ignition delay time and laminar flame speed measurements. Combust. Flame 2018, 197, 423–438. [Google Scholar] [CrossRef]
- Burke, M.P.; Chaos, M.; Ju, Y.; Dryer, F.L.; Klippenstein, S.J. Comprehensive H2/O2 kinetic model for high-pressure combustion. Int. J. Chem. Kinet. 2012, 44, 444–474. [Google Scholar] [CrossRef]
- Zhu, Y.; Curran, H.J.; Girhe, S.; Murakami, Y.; Pitsch, H.; Senecal, K.; Yang, L.; Zhou, C.W. The combustion chemistry of ammonia and ammonia/hydrogen mixtures: A comprehensive chemical kinetic modeling study. Combust. Flame 2024, 260, 113239. [Google Scholar] [CrossRef]
- Hong, Z.; Davidson, D.F.; Hanson, R.K. An improved H2/O2 mechanism based on recent shock tube/laser absorption measurements. Combust. Flame 2011, 158, 633–644. [Google Scholar] [CrossRef]
- Zhang, X.; Yalamanchi, K.K.; Sarathy, S.M. Combustion chemistry of ammonia/C1 fuels: A comprehensive kinetic modeling study. Fuel 2023, 341, 127676. [Google Scholar] [CrossRef]
- Konnov, A.A. Yet another kinetic mechanism for hydrogen combustion. Combust. Flame 2019, 203, 14–22. [Google Scholar] [CrossRef]
- Li, X.; You, X.; Wu, F.; Law, C.K. Uncertainty analysis of the kinetic model prediction for high-pressure H2/CO combustion. Proc. Combust. Inst. 2015, 35, 617–624. [Google Scholar] [CrossRef]
- Mével, R.; Davidenko, D.; Austin, J.; Pintgen, F.; Shepherd, J.E. Application of a laser induced fluorescence model to the numerical simulation of detonation waves in hydrogen–oxygen–diluent mixtures. Int. J. Hydrogen Energy 2014, 39, 6044–6060. [Google Scholar] [CrossRef]
- Mével, R.; Javoy, S.; Lafosse, F.; Chaumeix, N.; Dupré, G.; Paillard, C.E. Hydrogen–nitrous oxide delay times: Shock tube experimental study and kinetic modelling. Proc. Combust. Inst. 2009, 32, 359–366. [Google Scholar] [CrossRef]
- Melguizo-Gavilanes, J.; Coronel, S.; Mével, R.; Shepherd, J.E. Dynamics of ignition of stoichiometric hydrogen-air mixtures by moving heated particles. Int. J. Hydrogen Energy 2017, 42, 7380–7392. [Google Scholar] [CrossRef]
- Melguizo-Gavilanes, J.; Boeck, L.R.; Mével, R.; Shepherd, J.E. Hot surface ignition of stoichiometric hydrogen-air mixtures. Int. J. Hydrogen Energy 2017, 42, 7393–7403. [Google Scholar] [CrossRef]
- Zhang, Y.; Dong, W.; Vandewalle, L.; Xu, R.; Smith, G.; Wang, H. Foundational Fuel Chemistry Model Version 2.0 (FFCM-2). 2023. Available online: https://web.stanford.edu/group/haiwanglab/FFCM2 (accessed on 28 September 2024).
- Xu, R.; Dammati, S.S.; Shi, X.; Genter, E.S.; Jozefik, Z.; Harvazinski, M.E.; Lu, T.; Poludnenko, A.Y.; Sankaran, V.; Kerstein, A.R.; et al. Modeling of high-speed, methane-air, turbulent combustion, Part II: Reduced methane oxidation chemistry. Combust. Flame 2024, 263, 113380. [Google Scholar] [CrossRef]
- Varga, T.; Nagy, T.; Olm, C.; Zsély, I.G.; Pálvölgyi, R.; Valkó, É.; Vincze, G.; Cserháti, M.; Curran, H.J.; Turányi, T. Optimization of a hydrogen combustion mechanism using both direct and indirect measurements. Proc. Combust. Inst. 2015, 35, 589–596. [Google Scholar] [CrossRef]
- University of California at San Diego. Chemical-Kinetic Mechanisms for Combustion Applications. 2016. Available online: https://web.eng.ucsd.edu/mae/groups/combustion/research_mechanisms.html (accessed on 28 September 2024).
- Smith, G.P.; Golden, D.M.; Frenklach, M.; Moriarty, N.W.; Eiteneer, B.; Goldenberg, M.; Bowman, C.T.; Hanson, R.K.; Song, S.; Gardiner, W.C., Jr.; et al. GRI 3.0 Mechanism. 1999. Available online: http://combustion.berkeley.edu/gri-mech/version30/text30.html (accessed on 28 February 2025).
- Ng, H.; Radulescu, M.; Higgins, A.J.; Nikiforakis, N.; Lee, J.H.S. Numerical investigation of the instability for one-dimensional Chapman–Jouguet detonations with chain-branching kinetics. Combust. Theory Model. 2005, 9, 385–401. [Google Scholar] [CrossRef]
- Shi, L.; Shen, H.; Zhang, P.; Zhang, D.; Wen, C. Assessment of vibrational non-equilibrium effect on detonation cell size. Combust. Sci. Technol. 2017, 189, 841–853. [Google Scholar] [CrossRef]
- Watanabe, H.; Matsuo, A.; Chinnayya, A.; Itouyama, N.; Matsuoka, K.; Kasahara, J. Lagrangian characterization of induction and reaction timescales in a cellular gaseous detonation. Phys. Fluids 2025, 37, 026106. [Google Scholar] [CrossRef]
- Machida, T.; Asahara, M.; Hayashi, A.K.; Tsuboi, N. Three-dimensional simulation of deflagration-to-detonation transition with a detailed chemical reaction model. Combust. Sci. Technol. 2014, 186, 1758–1773. [Google Scholar] [CrossRef]
- Smith, J.; Schmitt, C.; Xiao, Q.; Maxwell, B. On the nature of transverse waves in marginal hydrogen detonation simulations using boundary layer loss modeling and detailed chemistry. Combust. Flame 2024, 268, 113598. [Google Scholar] [CrossRef]
- Saxena, P.; Williams, F.A. Testing a small detailed chemical-kinetic mechanism for the combustion of hydrogen and carbon monoxide. Combust. Flame 2006, 145, 316–323. [Google Scholar] [CrossRef]
- Shi, X.; Meagher, P.A.; Crane, J.; Dammati, S.S.; Zhao, X.; Poludnenko, A.Y.; Wang, H. On cellular multiplicity of detonations in confined channels. In Proceedings of the 28th International Colloquium on the Dynamics of Explosions and Reactive Systems (ICDERS), Naples, Italy, 19–24 June 2022. Article No. 207. [Google Scholar]
- Rojas Chavez, S.B.; Chatelain, K.P.; Lacoste, D.A. Induction zone length measurements by laser-induced fluorescence of nitric oxide in hydrogen-air detonations. Proc. Combust. Inst. 2023, 39, 2885–2894. [Google Scholar] [CrossRef]
- Sankar, V.; Chatelain, K.P.; Melguizo-Gavilanes, J.; Rojas Chavez, S.B.; Alicherif, M.; Lacoste, D.A. Experimental and Numerical Comparison of Weakly Unstable Detonation using Planar Laser-Induced Fluorescence of Nitric Oxide Imaging. In Proceedings of the 29th ICDERS, Siheung, Republic of Korea, 23–28 July 2023. Article No. 93. [Google Scholar]
- Rojas Chavez, S.B.; Chatelain, K.P.; Guiberti, T.F.; Mével, R.; Lacoste, D.A. Effect of the excitation line on hydroxyl radical imaging by laser induced fluorescence in hydrogen detonations. Combust. Flame 2021, 229, 111399. [Google Scholar] [CrossRef]
- Zhang, Y.; Mathieu, O.; Petersen, E.L.; Bourque, G.; Curran, H.J. Assessing the predictions of a NOx kinetic mechanism on recent hydrogen and syngas experimental data. Combust. Flame 2017, 182, 122–141. [Google Scholar] [CrossRef]
Disclaimer/Publisher’s Note: The statements, opinions and data contained in all publications are solely those of the individual author(s) and contributor(s) and not of MDPI and/or the editor(s). MDPI and/or the editor(s) disclaim responsibility for any injury to people or property resulting from any ideas, methods, instructions or products referred to in the content. |
© 2025 by the authors. Licensee MDPI, Basel, Switzerland. This article is an open access article distributed under the terms and conditions of the Creative Commons Attribution (CC BY) license (https://creativecommons.org/licenses/by/4.0/).