Article

A Deployable Conical Log Spiral Antenna for Small Spacecraft: Mechanical Design and Test

by
Lewis R. Williams
1,*,
Natanael Hjermann
2,
Bendik Sagsveen
2,
Arthur Romeijer
3,
Karina Vieira Hoel
2 and
Lars Erling Bråten
1,2
1
Department of Technology Systems, The University of Oslo, Gunnar Randersvei 19, 2007 Kjeller, Norway
2
Norwegian Defence Research Establishment, Instituttveien 20, 2007 Kjeller, Norway
3
Pulsaart by AGC Glass Europe, Rue Louis Blériot 12, 6041 Gosselies, Belgium
*
Author to whom correspondence should be addressed.
Aerospace 2025, 12(4), 326; https://doi.org/10.3390/aerospace12040326
Submission received: 20 January 2025 / Revised: 31 March 2025 / Accepted: 8 April 2025 / Published: 10 April 2025
(This article belongs to the Special Issue Small Satellite Missions)

Abstract

:
We present the design and manufacturing of a deployable conical log spiral spring antenna for small spacecraft, along with a test campaign to evaluate its suitability for space applications. The conical spring was 45.7 cm in height, with base and apex diameters of 18.9 and 2.8 cm, respectively. The spring had a mass of 0.138 kg and was constructed from a carbon fiber-infused epoxy matrix with an embedded coaxial cable. We conducted dynamic and thermal mechanical analysis to determine the coefficient of thermal expansion and glass transition temperature. The initial 10 compressions of the spring shortened the structure’s overall height, but the change had a negligible effect on the antenna’s radio frequency (RF) performance. Thermal cycling between −70 °C and 80 °C did not cause any damage or deformation to the spring structure. Outgassing tests were conducted in a thermal vacuum chamber, and the total mass loss was 0.03%. We conducted vibration tests representative for a typical launch vehicle, and all natural frequencies remained stable above 250 Hz, while the antenna was stowed, satisfying launch vehicle requirements. Post-test functional checks confirmed that there was no change in antenna functionality. The environmental test results provide confidence that the antenna is suitable for spacecraft applications.

1. Introduction

Small satellites have revolutionized the space industry in the past decade. Large traditional and expensive satellites are now in competition with an increasing number of low earth orbit (LEO) small satellite constellations [1]. The miniaturization of electronics, the use of commercial-off-the-shelf (COTS) components, and developments in manufacturing processes have been key enablers of the success of small satellites [2]. Additionally, SpaceX’s Falcon 9 launch vehicle reduced launch costs to LEO by a factor of 20 after its introduction in 2010 [3], significantly lowering financial barriers to space, which in turn accelerated small spacecraft innovation.
Antennas are key spacecraft components, and the development of innovative antennas for communication, earth observation, and other scientific instruments is critical [2]. RF payloads commonly require a custom antenna solution, such as the deployable Yagi-Uda antenna developed for the Norwegian Space Centre’s NorSat-2 mission [4]. A current challenge when designing small spacecraft antennas is achieving high gain and wide bandwidth [5]. A review of successful small spacecraft missions reveals that narrowband band antennas are predominately used [5], particularly in the ultra-high-frequency (UHF) range (0.3 to 3 GHz). Within the UHF band, the antenna structure can be larger than the available spacecraft structure and may require a deployment mechanism.
A broadband UHF antenna may enable small spacecraft to conduct new applications [6]. For example, an emerging technique for radiometric earth observation between 500 and 1400 MHz [7] shows promise within the Arctic and Antarctic [8,9]. This frequency range is outside of the protected frequency bands for passive sensing [10], and therefore, a broadband antenna is advantageous as it allows some flexibility to change the observation frequency in the event of excessive interference at any given frequency. Furthermore, communication with Internet of Things (IoT) devices, such as LoRa sensor network modules (which have all of their global regional bands within UHF [11]), from a spacecraft opens up a multitude of data relay applications. A single small spacecraft with a broadband antenna may be capable of several applications when paired with a software-defined radio (SDR), such as radiometric measurements of ice sheets combined with communication with IoT sensors collecting in situ data for verification. Other applications include synthetic aperture radar (SAR), where a UHF wideband antenna facilitates foliage penetration [12].
A well-designed, robust, and scalable UHF broadband antenna may allow small spacecraft to conduct new applications without requiring custom antenna development. Research into broadband UHF antennas for small spacecraft is active. Two tightly coupled dipole arrays (TCDAs) are proposed, one with a bandwidth of 80 to 600 MHz [13] and another of 600 to 3200 MHz [14]. These antennas offer impressive ultra-wide bandwidths and dual polarization. They rely on low-profile bending joints to bend and stack printed circuit board (PCB) dipoles, which unfold once in orbit into a large two-dimensional dipole array. One-dimensional folding prototypes have been manufactured.
A wideband patch antenna with a bandwidth of 1.6 to 2.7 GHz is reported [15]. The large bandwidth from a typically narrowband antenna type is achieved by the unique shape of the patch, which enables different areas of the patch to resonate through the frequency range. Scaling this antenna down to the lower UHF frequencies would result in a large patch antenna, which may be difficult to implement on a small spacecraft.
Helical antennas are by nature narrowband antennas. However, a wideband UHF-modified helix is reported [16], operating from 380 to 780 MHz. The antenna has a base diameter of 27 cm and a ground plane of 1.2 m × 1.2 m. Additionally, a quadrifilar helix is reported [17], operating from 250 to 500 MHz. The antenna exhibits significant back lobe intensity, which the author suggests could be reduced by adjusting the ground plane dimensions. Both of these broadband helixes require a large ground plane for operation, which may be impractical for the smallest spacecraft.
The remaining reported antennas are frequency-independent antennas. These antennas maintain stable performance in terms of gain and radiation pattern over large bandwidths [18], making them ideal for broadband applications. Two crossed log-periodic dipole arrays (LPDAs) are proposed, one of which operates from 300 to 600 MHz [19], and the other which operates from 380 to 500 MHz [6]. Both designs consist of an extended boom supporting two arrays of tape spring dipoles perpendicular to each other. A study of structural architectures for deployable wideband UHF antennas [20] concludes that deployable conical log spiral antenna (CLSA) structures are simpler than deployable crossed LPDA antennas. Both antennas are frequency independent and offer circular polarization.
Several concepts of CLSA springs are proposed, operating from 220 to 425 MHz [21], 500 to 1500 MHz [22], and 2.2 to 3.1 GHz [23,24]. Additionally, a design with a copper mesh conductor printed on a flexible substrate is proposed from 300 to 600 MHz [25,26]. We believe that the spring design is the most promising in terms of scalability because the mesh conductor relies on ultra-thin bendable copper mesh, which may scale unfavorably.
As an alternative to broadband antennas, there are numerous examples of UHF multi-band antennas described. A multi-band antenna operates at multiple select frequencies, rather than a single frequency. Reported are helical designs [27,28,29] and some patch arrays [30,31]. Although these designs are useful for operating at multiple frequencies, they are less flexible than broadband antennas in terms of potential applications.
It is not known whether any of the discussed antennas have flight heritage. Limited or no details are given on the design, analysis, and testing of their mechanical structures. Some articles describing antennas for large spacecraft give details on mechanical and environmental testing [32,33], but this is typically omitted in the literature describing small spacecraft antennas. The space environment exposes the structure to temperature cycling, vacuum, atomic oxygen, and radiation. Launch providers impose requirements on the structure in terms of resonant frequencies, structural integrity, and outgassing. Thus, mechanical analysis and testing are crucial for evaluating an antenna’s spacecraft suitability.
This paper presents the design, manufacturing, and environmental test campaign of a carbon composite CLSA spring with an embedded coaxial cable for space applications. Carbon composites have extensive space flight heritage [34] and are suitable for structural antenna components [35]. Manufacturing the antenna from a carbon composite enabled the coaxial cable to be embedded within the structure. This facilitated a simple deployment mechanism because a separate coaxial cable is not required to be deployed in addition to the antenna structure. The proposed antenna is a scalable UHF broadband antenna optimized for small spacecraft. It differs from previous CLSA designs in that it does not require a deployable transmission line to the antenna apex or a ground plane with optimized dimensions to redirect the signal’s main lobe away from the spacecraft. The current article describes the mechanical design, methodologies, and test results. A companion paper [36] details the RF design, methodologies, and test results.
We adopted a New Space approach [1,37] in this research. Large emphasis was placed on rapid prototyping, testing, and development. The intention was to progress the design quickly and within a modest budget—a typical university budget. With reference to space hardware testing guidelines outlined by the European Cooperation for Space Standardization (ECSS) [38] and a typical launch provider’s launch guidelines [39], we conducted a test campaign, addressing both space and launch-environmental conditions on a prototype, along with material testing on sample coupons. We defined the thermal test parameters through simulations and material testing. This approach is a necessary step towards progressing a technology to Technology Readiness Level (TRL) 6 for space hardware development [40]. A prototype tested successfully in a representative laboratory environment is at TRL 6, which is the last step before operational environment testing in space. The aim was to demonstrate through testing that the proposed antenna is suitable for space applications.
This paper is organized as follows: Section 2 outlines the structure design, materials, and manufacturing. Section 3 presents the test results for mechanical and environmental testing, and the findings are summarized in the Conclusion.

2. Manufacturing and Design

2.1. Antenna Design

A typical CLSA has a logarithmically tapering pitch and spiral width, decreasing from the base to the tip. The antenna is frequency independent, meaning that the structure dimensions can be fully defined by angles [18]. Dyson was the first to describe the design procedure for a CLSA [41]. To simplify manufacturing, we chose to design the antenna with a constant spiral width instead of a tapered width. This modification was described by Dyson as a simplified version of a CLSA [42,43,44]. To define the antenna’s geometry, the wrap angle ( θ 0 ), cone angle ( α ), and desired bandwidth are required. The antenna has a cone angle, α = 10°, and a wrap angle, θ 0 = 75°, as seen in Figure 1. These angles correspond to an optimal design for a constant width CLSA design according to Dyson [41]. The bandwidth of the design is from 500 to 1500 MHz. More details on the antenna design and RF performance can be found in the companion paper [36].

2.2. Manufacturing and Materials

Carbon fiber epoxy composite helical springs have a strength-to-weight ratio much higher than that of comparable steel springs and glass fiber epoxy composites [45]. The tailoring of the spring stiffness and the coefficient of thermal expansion (CTE) can be achieved by adjusting the carbon fiber orientations and fiber volume fraction ( V f ) [46,47,48]. Additionally, low-volume custom spring manufacturing is easier with carbon composites compared with steel because it can be performed in-house without specialist machinery. The material is thus suitable for the proposed CLSA spring.
To create the required antenna geometry from a carbon epoxy composite, and to have a stable structure throughout its intended life cycle, we must consider the epoxy cure kinetics and material expansion coefficients. The final properties of the epoxy polymer material are determined primarily during the curing process [49]. To achieve the required geometry, the residual stresses in the material need to be minimized. Residual stresses develop during the epoxy curing process, when a volume shrinkage and an exothermic reaction occur simultaneously [50,51]. The level of residual stress can increase if the reactions are accelerated with external heat, which is common for curing.
A low curing temperature reduces residual stresses in the material. However, the glass transition temperature ( T g ) increases with curing temperature [52]. When T g is exceeded, the epoxy transitions from a glassy, rigid state to a rubbery, viscous state. Thus, a T g greater than the expected operational temperature is required, and a balance must be struck between T g and residual stresses to prevent deformation throughout the life cycle of the component, from manufacturing to its end of life.
The CTE and spring stiffness are dependent on the carbon fiber epoxy matrix. Epoxy resins typically have a uniform CTE between 60 and 80 µm/mK [53]. Carbon fiber has a non-uniform CTE with a value of approximately −1 and 8 µm/mK in the fiber direction and perpendicular to the fiber direction, respectively [54].
A low CTE is required to increase dimensional stability and reduce internal shear stresses within the carbon epoxy matrix. These stresses occur due to the different expansion and contraction rates of the two materials as the temperature varies. A reduction in matrix CTE can be achieved by optimizing the fiber orientation to take advantage of the carbon’s negative CTE and adjusting the fiber volume fraction, V f .
A cross-section cut of the spring is shown in Figure 2. In the center of the spring, there is a Huber+Suhner RG195 A/U (Manufactured by Huber+Suhner, Changzhou, China) coaxial cable with the outer jacket removed. The cable has a center conductor made from silver-plated steel and copper strands with a total radius of 0.15 mm, followed by a solid layer of polytetrafluoroethylene (PTFE) with a radius of 1.26 mm, covered by a braided tube of silver-plated copper strands extending to a radius of 1.55 mm. This is enclosed in a carbon fiber epoxy composite tube with a radius of 2.5 mm. Regarding antenna functionality, it is the braided tube of silver-plated copper strands that carries the current and is the radiating element. The presence of the carbon fiber epoxy composite tube surrounding this is not considered detrimental to RF performance, as a recent study [35] suggests that carbon fiber composites are suitable for structural parts of antennas.
A carbon fiber braided tube was used to surround the coaxial cable and ensure a uniform distribution of carbon fiber. The braided tube and cable assembly were then inserted into a flexible polyvinyl chloride (PVC) tube and molded into shape around an Ultem resin 3D-printed cone that can tolerate the curing temperatures. Epoxy was drawn through the PVC tube using a vacuum pump operating at −0.9 bar, as seen in Figure 3. Once the epoxy was fully drawn through, the spring was cured while mounted on the Ultem mold. After curing, the PVC tube was removed, leaving the finished spring. This process ensured adequate resin penetration and removed trapped air. It was identified as the most suitable method from those presented in [55] due to easy de-molding and high spring quality. The two coaxial cables are soldered together at the apex, and a Kevlar-braided tube and epoxy resin were used to strengthen the soldering point. Kevlar, which is not electrically conductive, was used instead of carbon at the apex, because it is necessary to electrically insulate the two spirals from each other for the antenna to function.
The carbon fiber braided tube was a Dowaksa A38 3K fiber (Manufactured by Dowaksa, Yalova, Turkey) in a two-by-two twill weave pattern with an area mass of 0.4 kg/m2 of weave. The epoxy used was SikaBiresin® CR80 with hardener CH80-2 (Manufactured by Sika Group, Zurich, Switzerland), which has a curing temperature of 80 °C and a glass transition temperature, T g , greater than 90 °C. The low curing temperature resulted in low residual stresses and, thus, no geometrical deformations upon de-molding. Deformations were experienced with other resins that required higher curing temperatures.

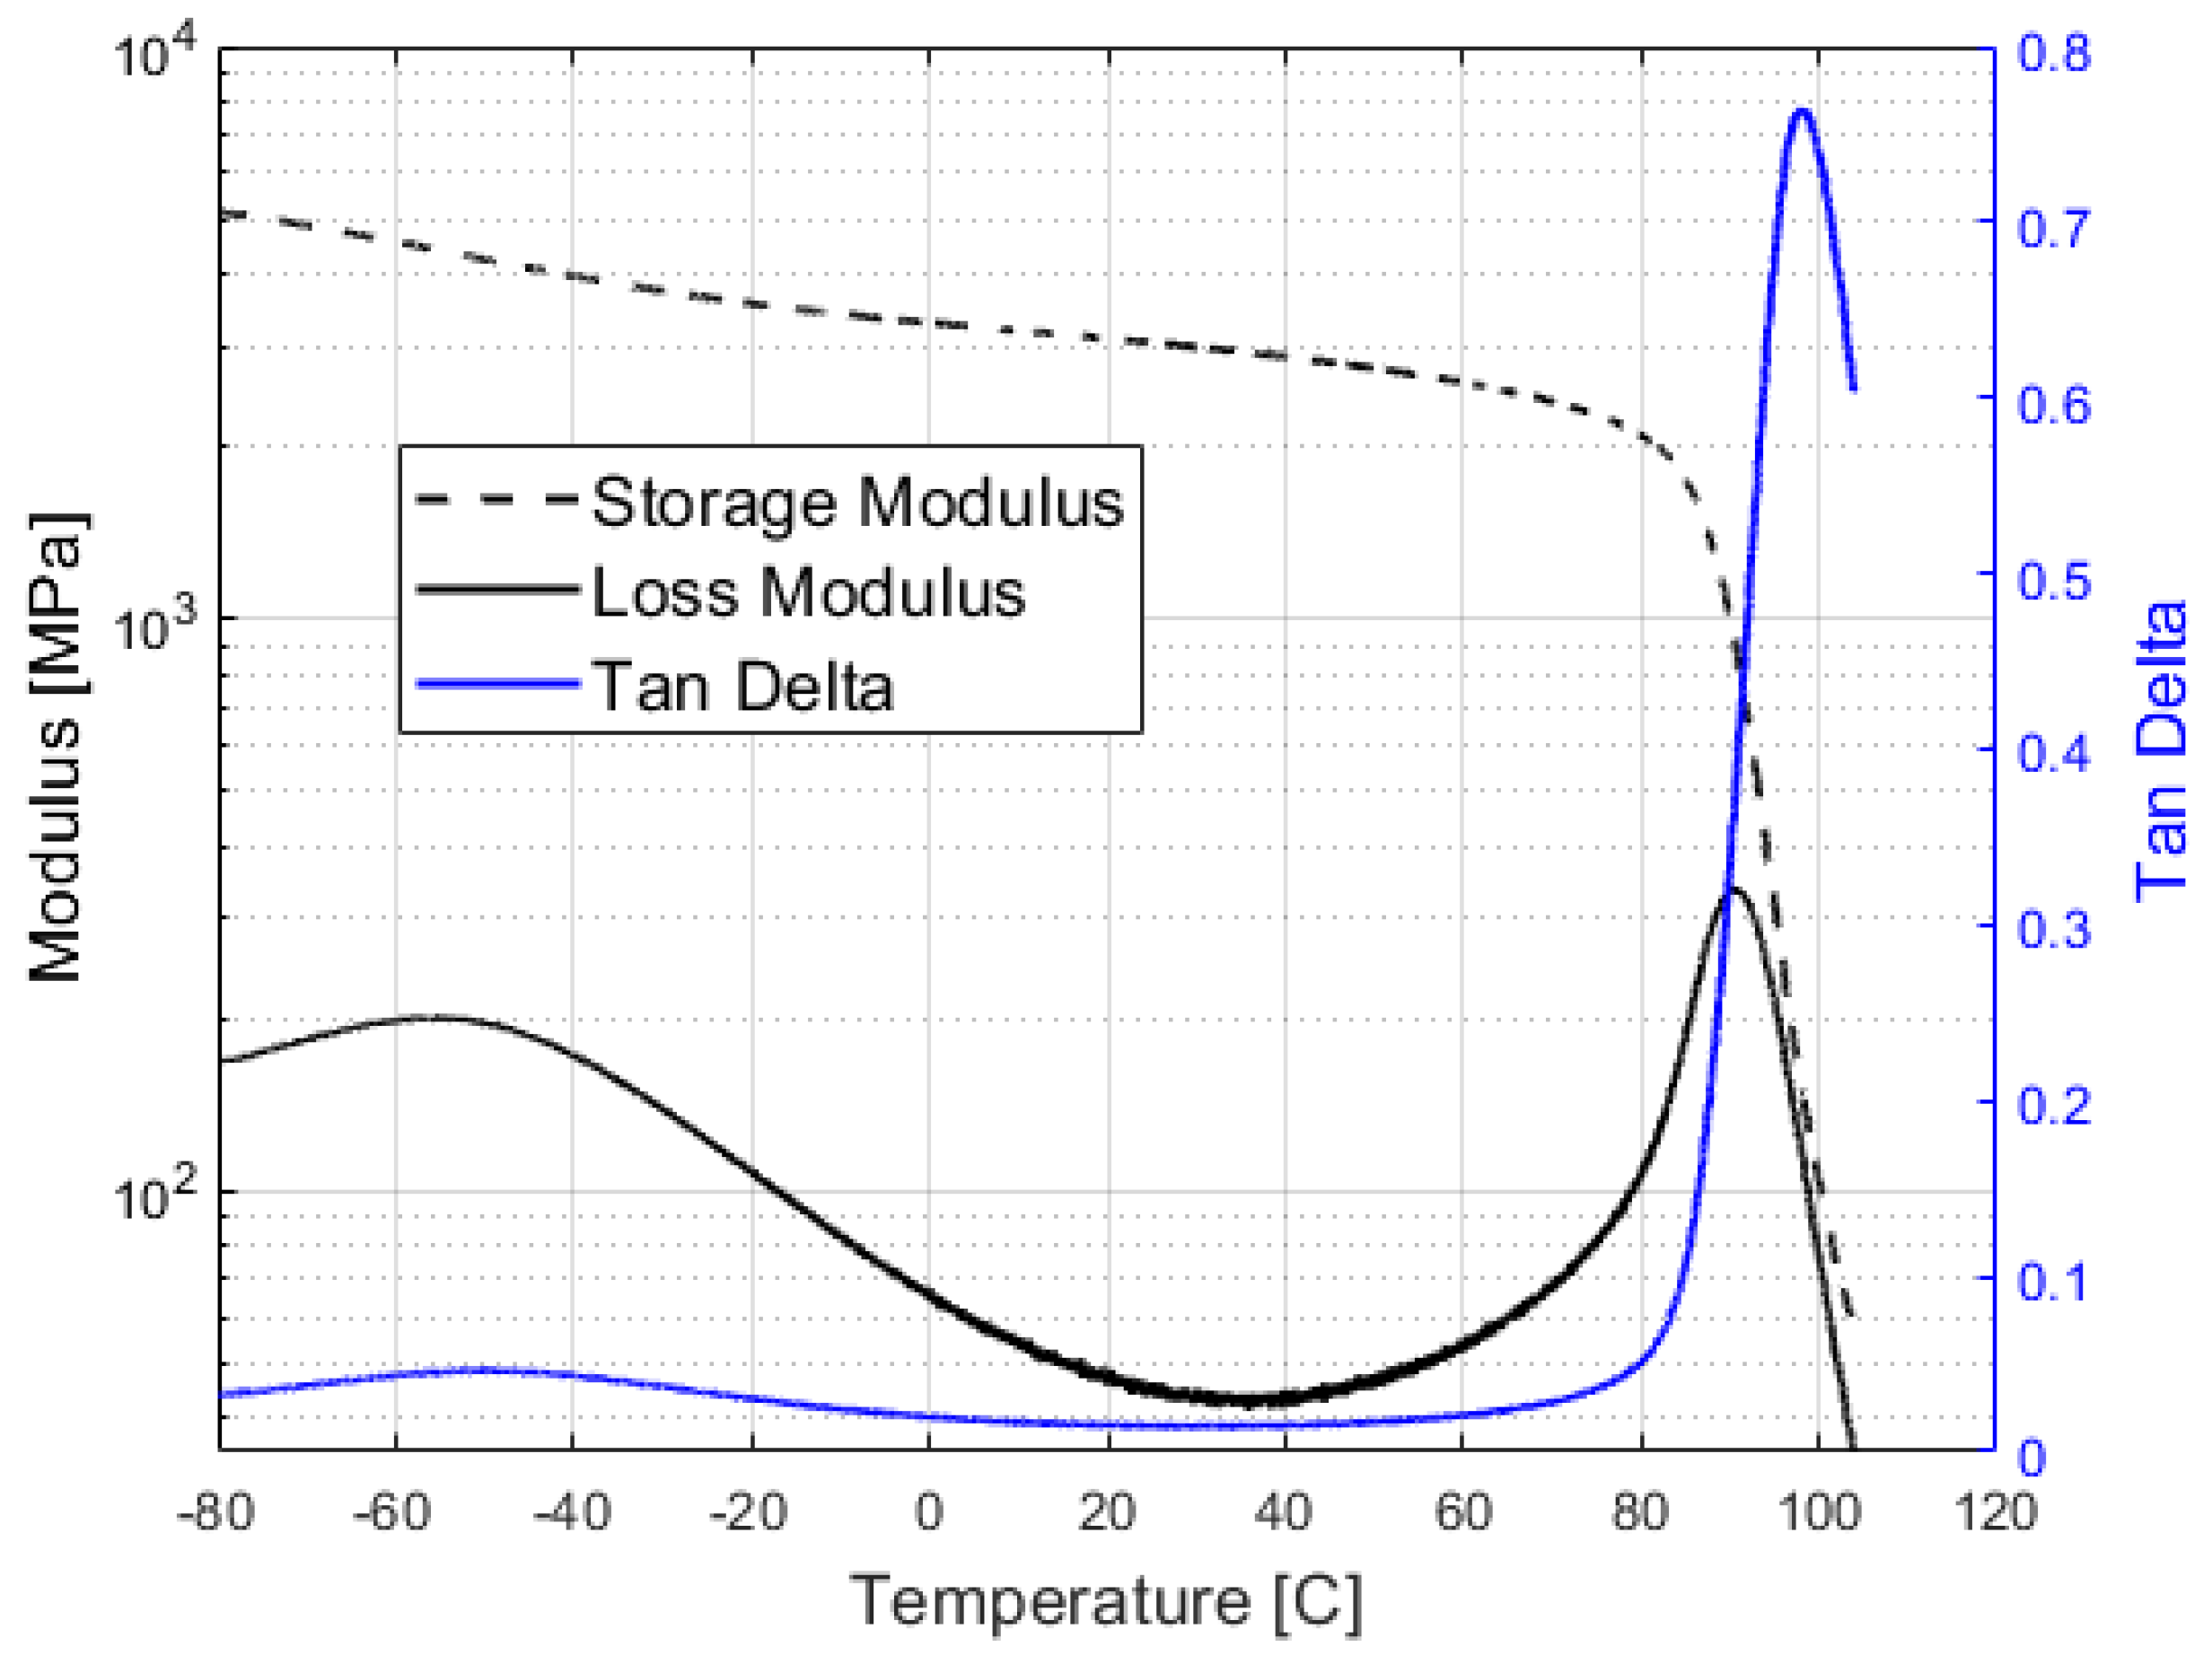
2.3. Epoxy Glass Transition Temperature

To assess the suitability of the epoxy T g for the application, we conducted a spacecraft thermal simulation using Systema Thermica software (Version 4.9.4) developed by Airbus. A 12U cubesat made of aluminum 7075 with a white coating was used for the model, and the antenna model was mounted on it. The system had a mass of 9.1 kg; the emissivity and absorptivity for the satellite were 0.81 and 0.25, respectively, and for the antenna, 0.9 and 0.95, respectively. The conductivity between the antenna and spacecraft was set to 200 W/K/m2, which was estimated based on prior simulation experience. The orbital parameters for a typical small spacecraft were considered, specifically a sun-synchronous orbit at an altitude of 500 km. Two different Local Time of the Ascending Node (LTAN) values were investigated, a near noon/midnight (10:30 a.m./p.m.) and a dawn/dusk (06:00 a.m./p.m.), to make the results more comprehensive. The antenna was always pointing to nadir, and the spacecraft was given a rotation around its own center axis of 8 rev/h.
For both LTAN cases, the maximum temperature on the antenna was 40 °C. The minimum temperatures were −20 °C and −80 °C for the dawn/dusk and noon/midnight LTAN cases, respectively. The apex of the spiral has a high thermal isolation from the spacecraft, and with its low thermal mass, it reaches equilibrium quickly. Thus, we see the highest and lowest temperatures at the apex. The larger temperature gradient for the noon/midnight LTAN case was expected due to the varying solar flux.
The epoxy T g greater than 90 °C is acceptable for the application based on the conducted simulations. Thermal testing is described in Section 3.

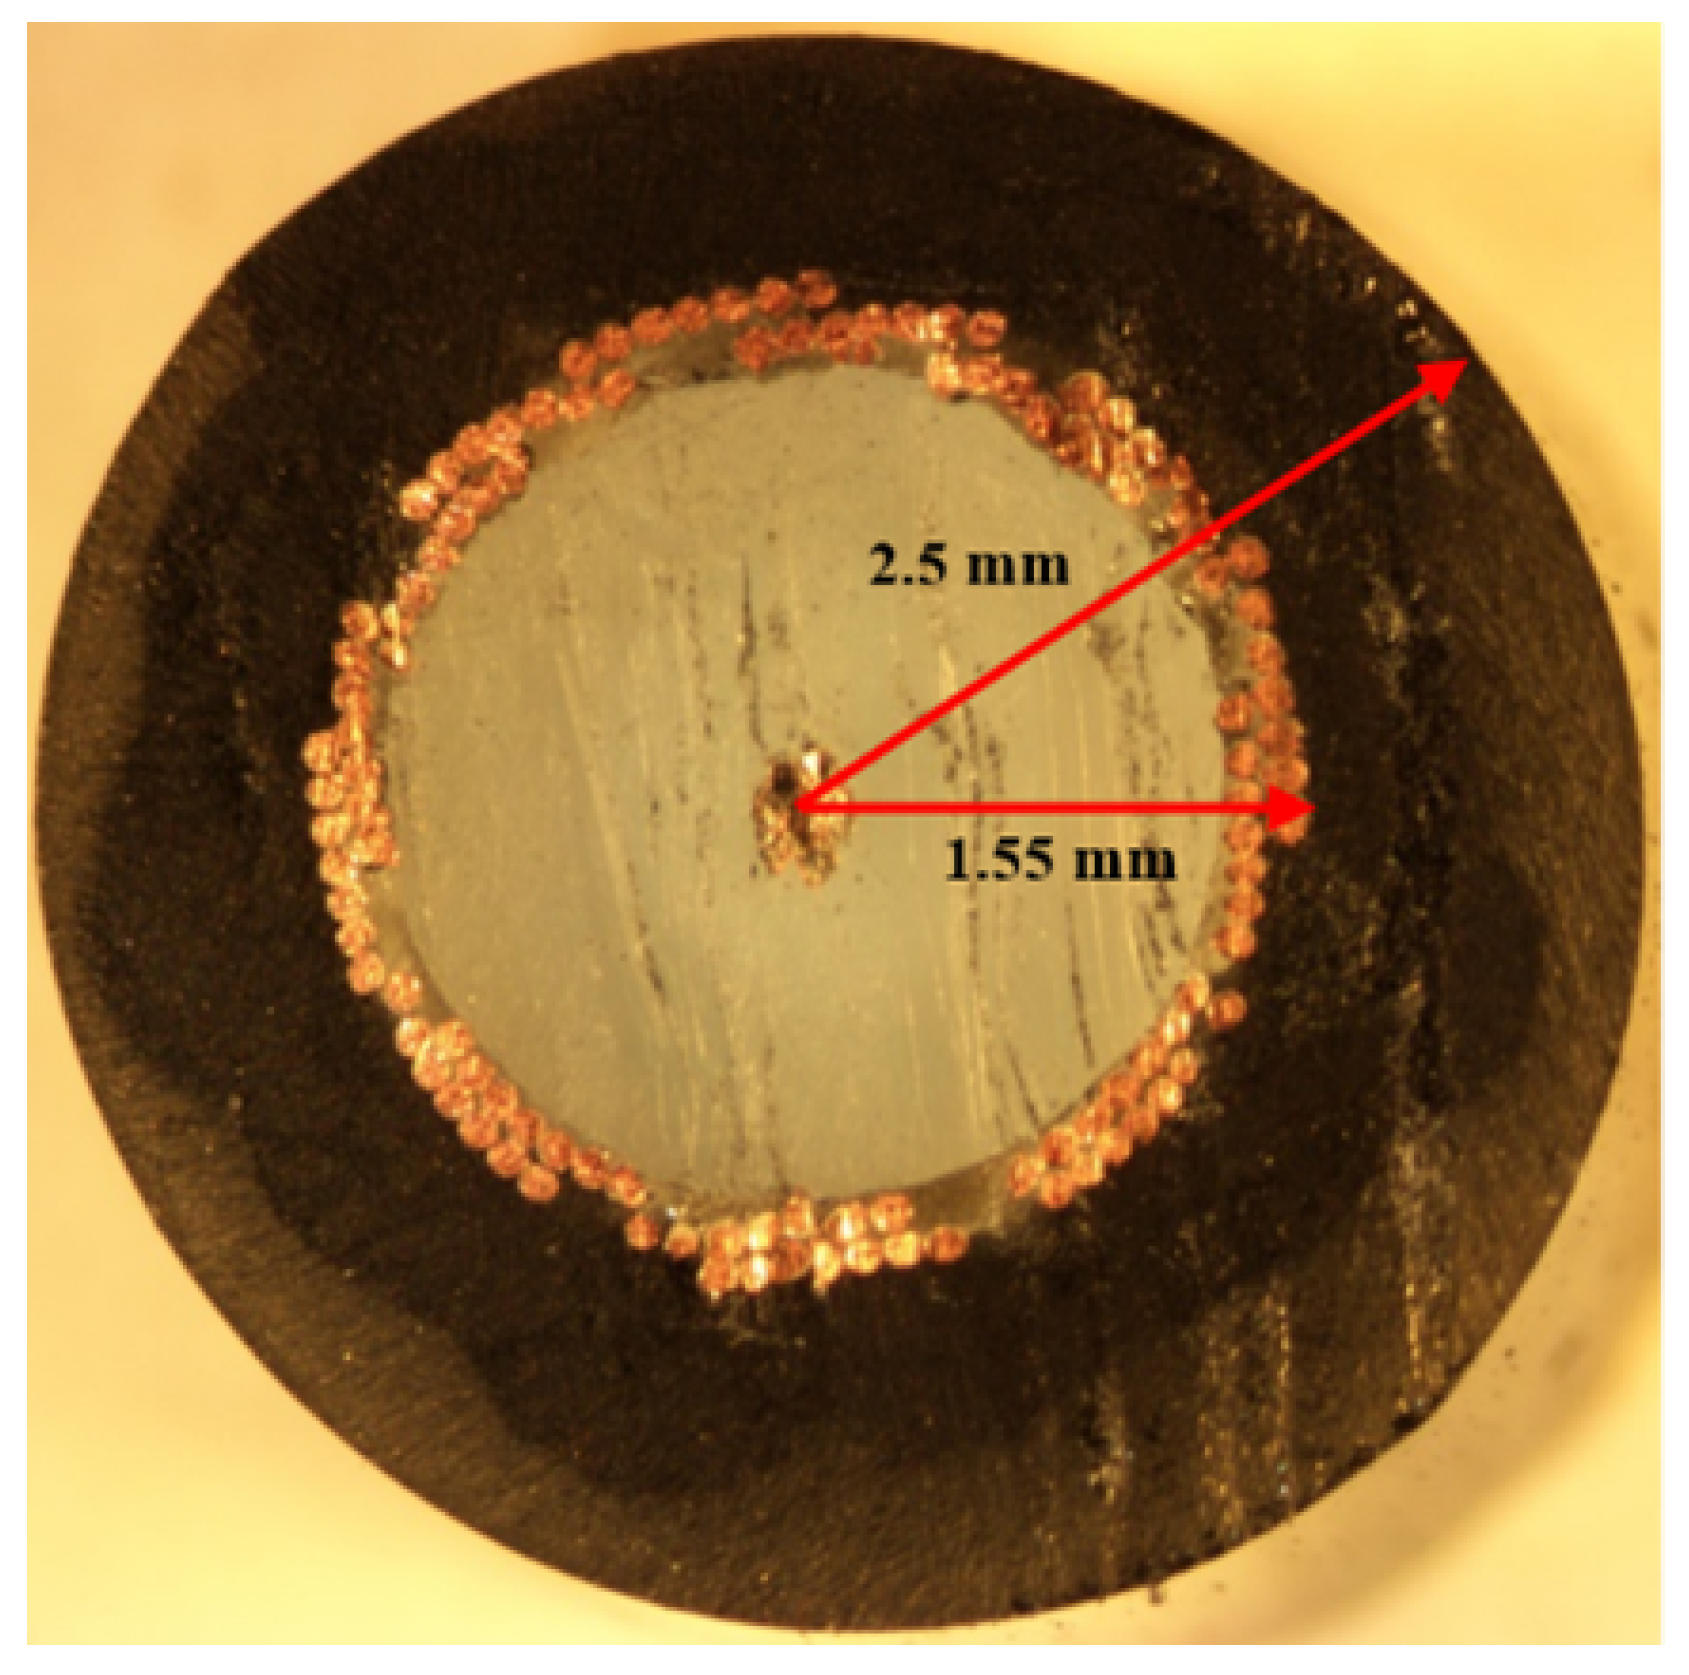
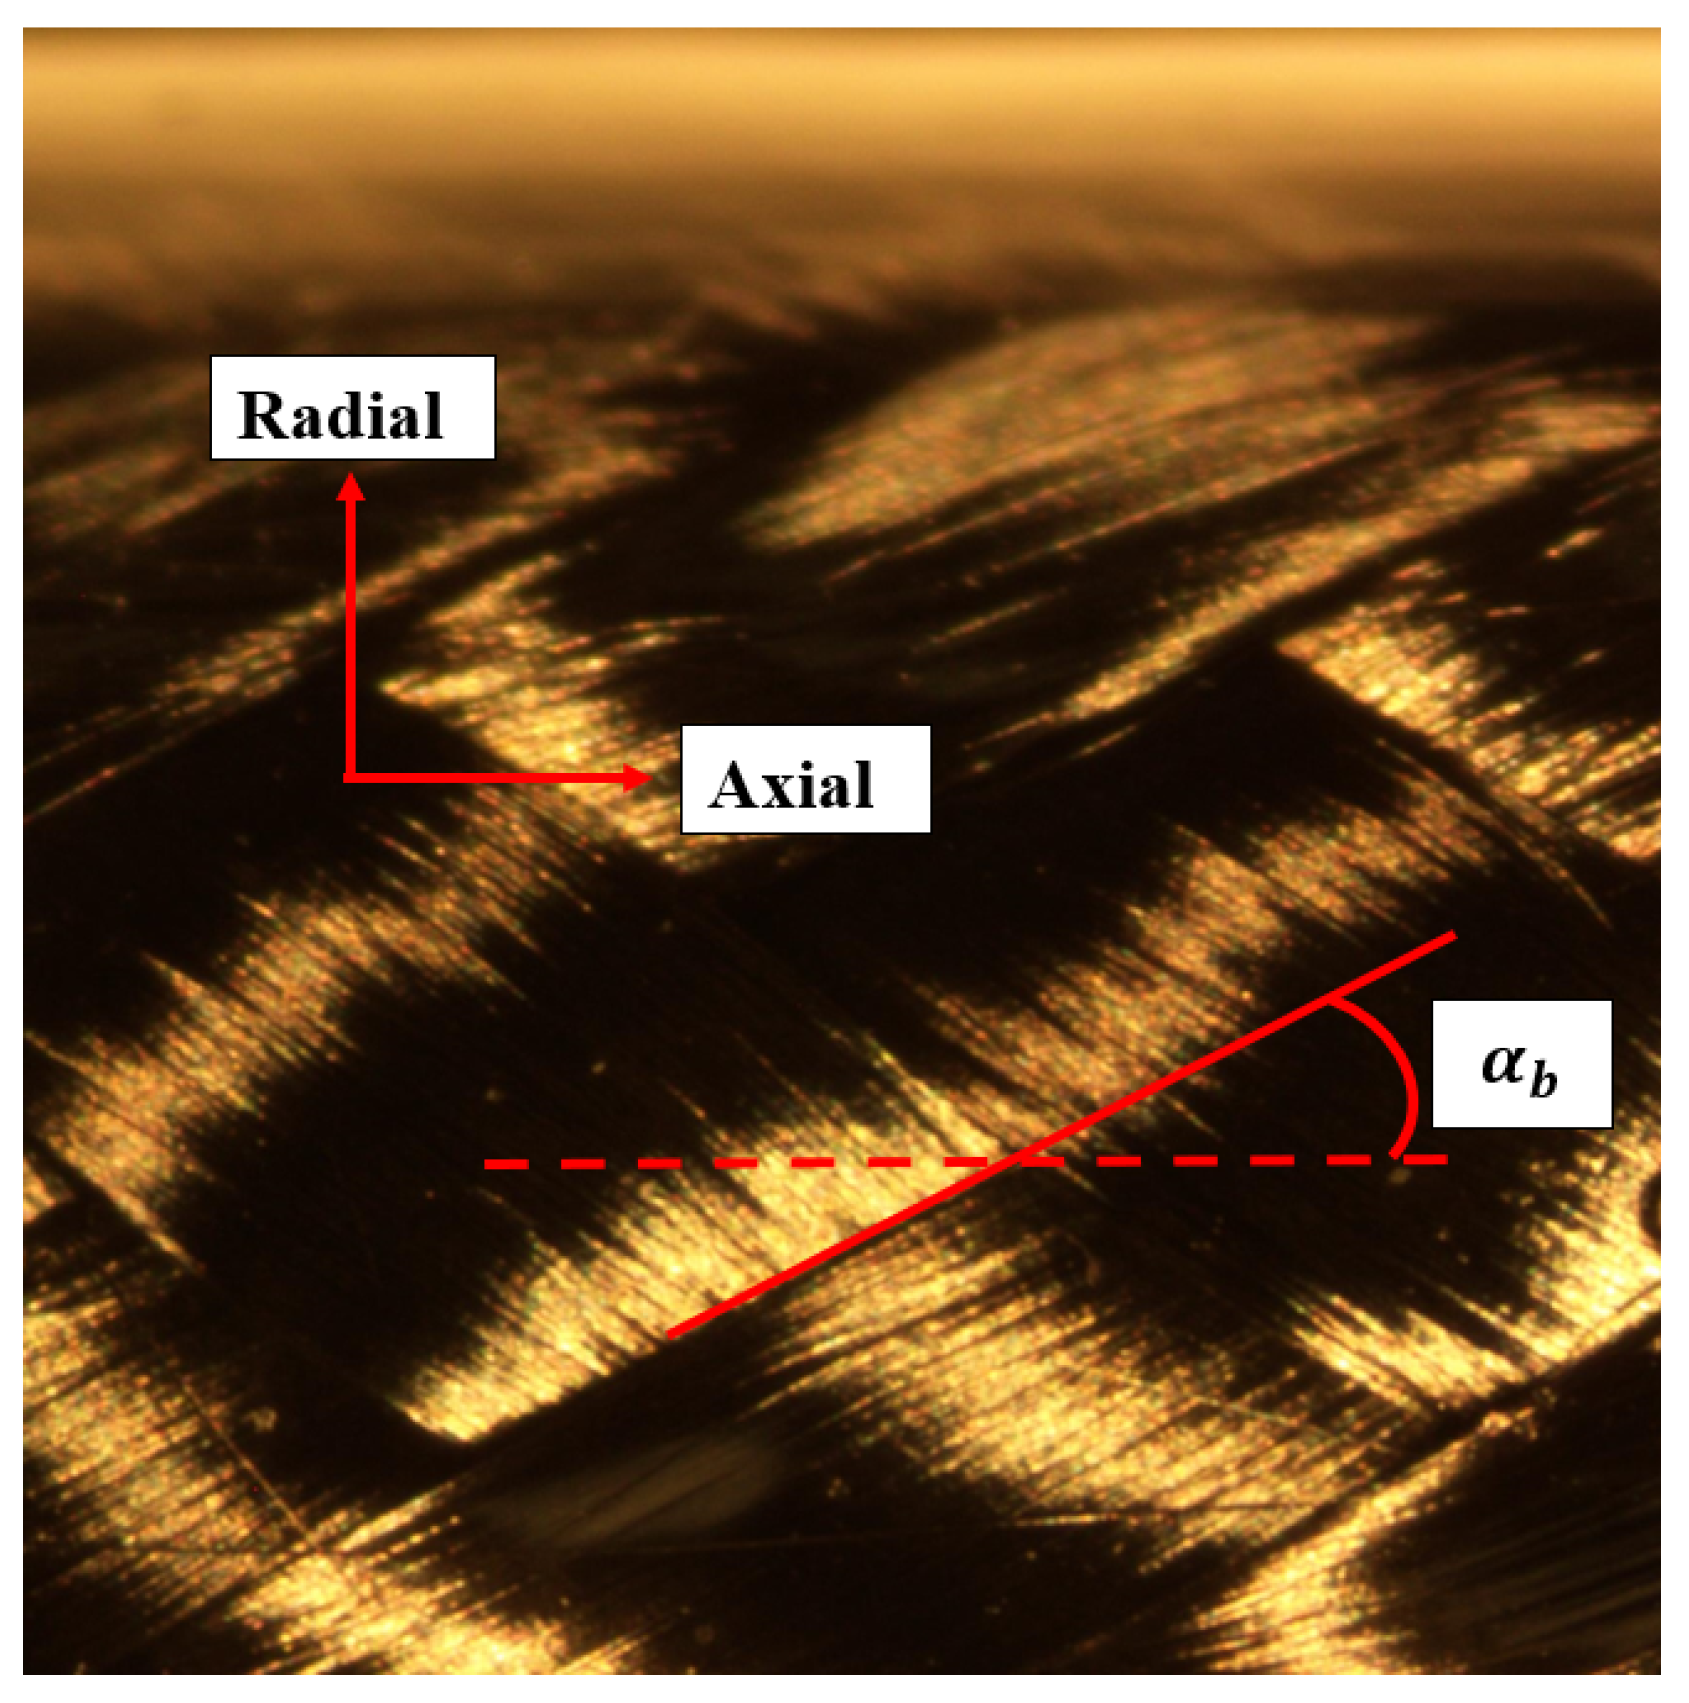
2.4. Carbon Fiber Volume Fraction and Braid Angle

We performed numerical analysis to determine the optimal volume fraction, V f , and braid angle, α b , of the carbon weave for near-zero CTE. However, the manufacturing method requires the carbon and coaxial cable assembly to be fed through a PVC tube, which is subsequently filled with epoxy. This requires a clearance and affects the designers’ control over V f . Similarly, the carbon-braided tube is stretched over the coaxial cable, producing a specific braid angle. Although some flexibility does remain to control the braid angle. To preserve the RF antenna performance, thermal deformation in the axial direction was more undesirable than in the radial direction in this case. Having the braid stretched tightly over the coaxial cable and obtaining the smallest possible braid angle was thus desirable as it resulted in more fibers being oriented axially and, consequently, a reduced CTE in the axial direction due to the negative CTE of carbon in the fiber direction. Figure 4 displays the fiber orientation of a prototype.
The braid angle in Figure 4 is approximately 30°, deviating from the optimal value of 45° expressed in [56]. The carbon fiber volume fraction was measured to be 27%, determined by weighing the wet and dry mass of a test coupon with known volumes of the coaxial cable and PVC tube and a known density of the epoxy. The measured volume fraction is lower than the values presented in [55], all of which are above 45%. Since the designed spring is not intended for conventional load-bearing applications, these variations in design parameters are considered less critical. More importantly, the design achieves a near-zero CTE in the axial direction. The test results for the CTE investigation are discussed in Section 3.

3. Test Methods and Results

The following tests were conducted to evaluate the material and structure suitability for space applications. The methodologies and test results are discussed in the following corresponding subsection:
  • Material property tests using dynamic and thermal mechanical analysis (DMA, TMA) with material samples;
  • Antenna mass properties and spring stiffness;
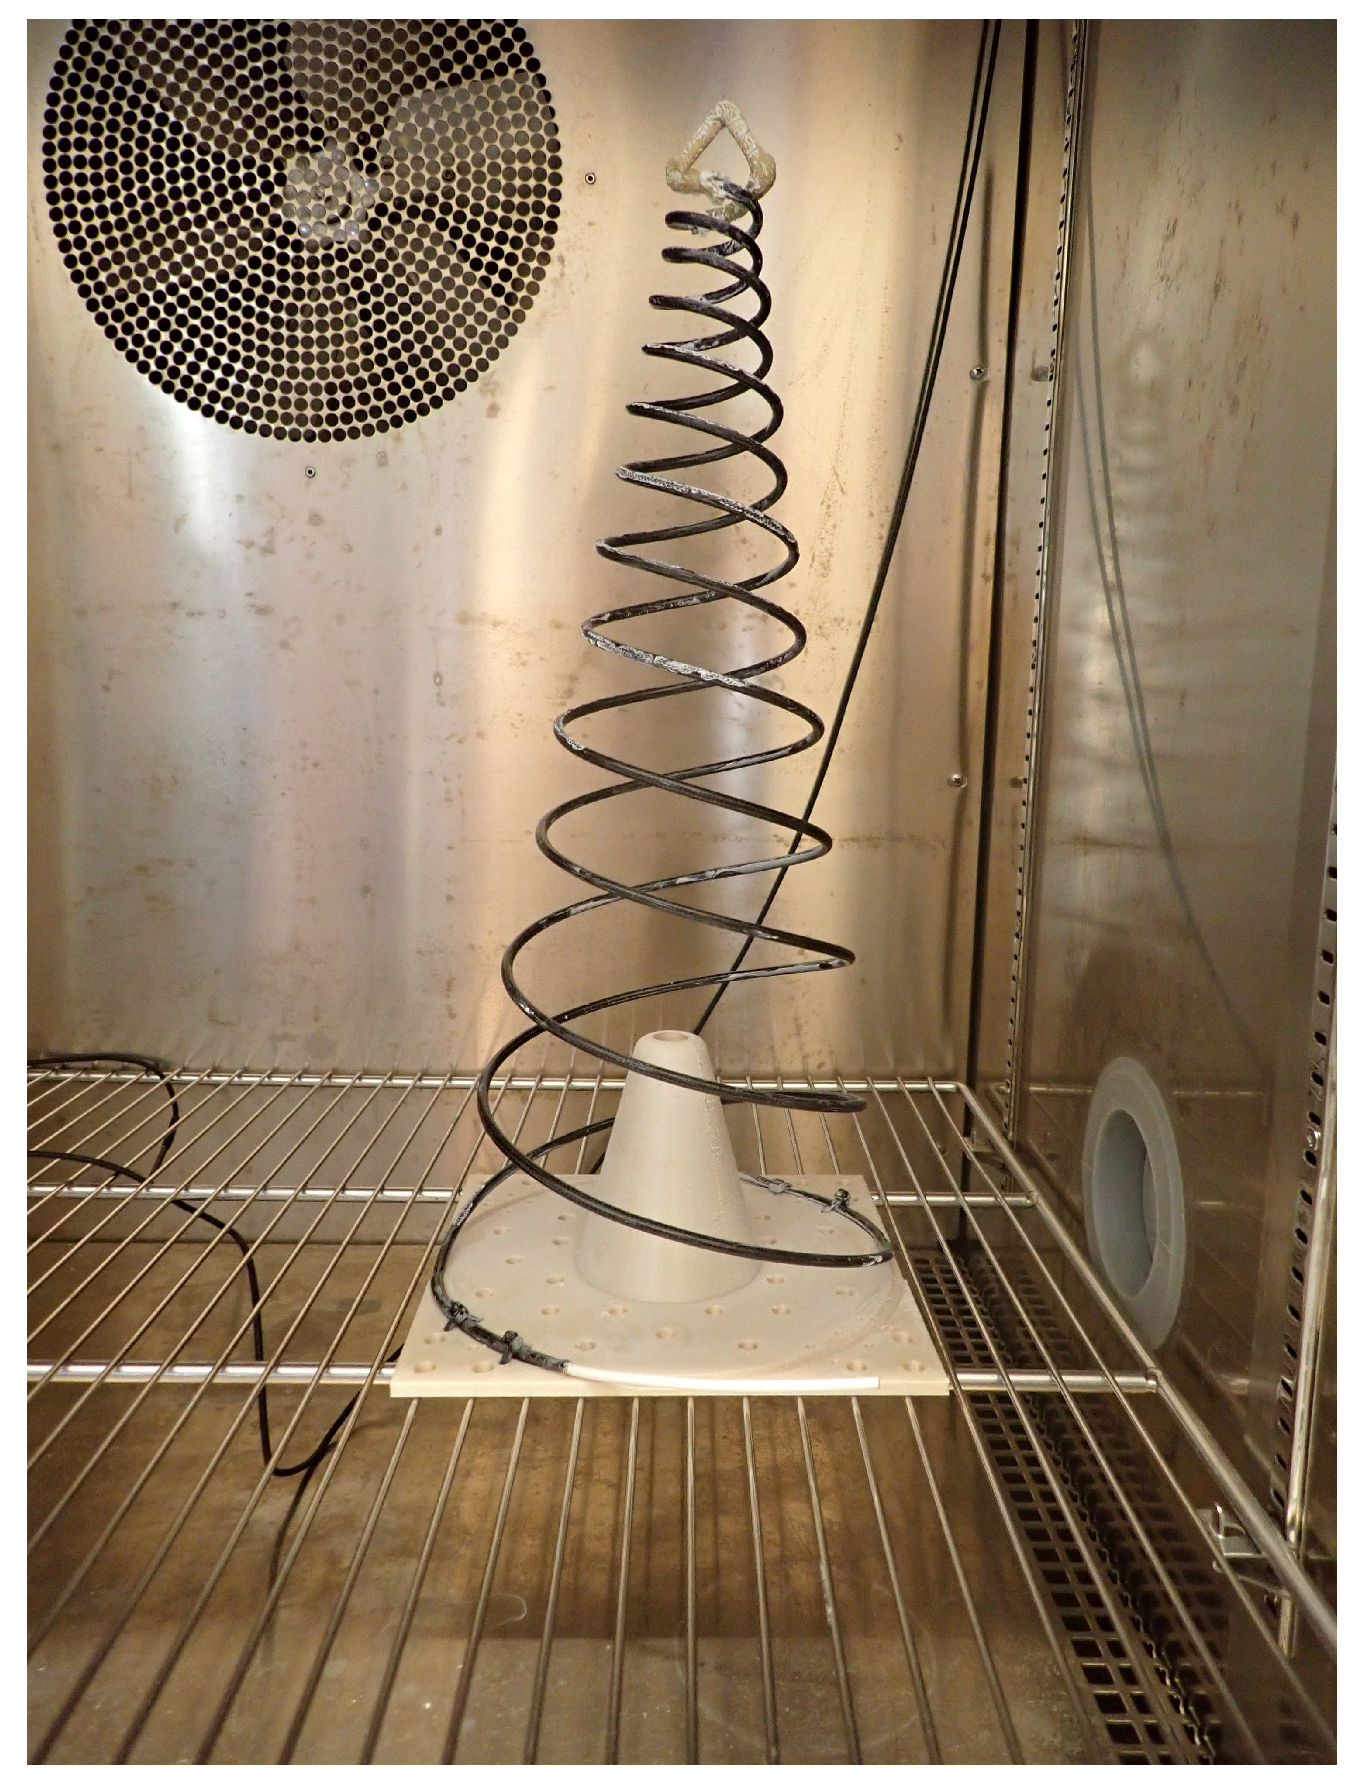
  • Natural frequencies of the extended, free standing spring;
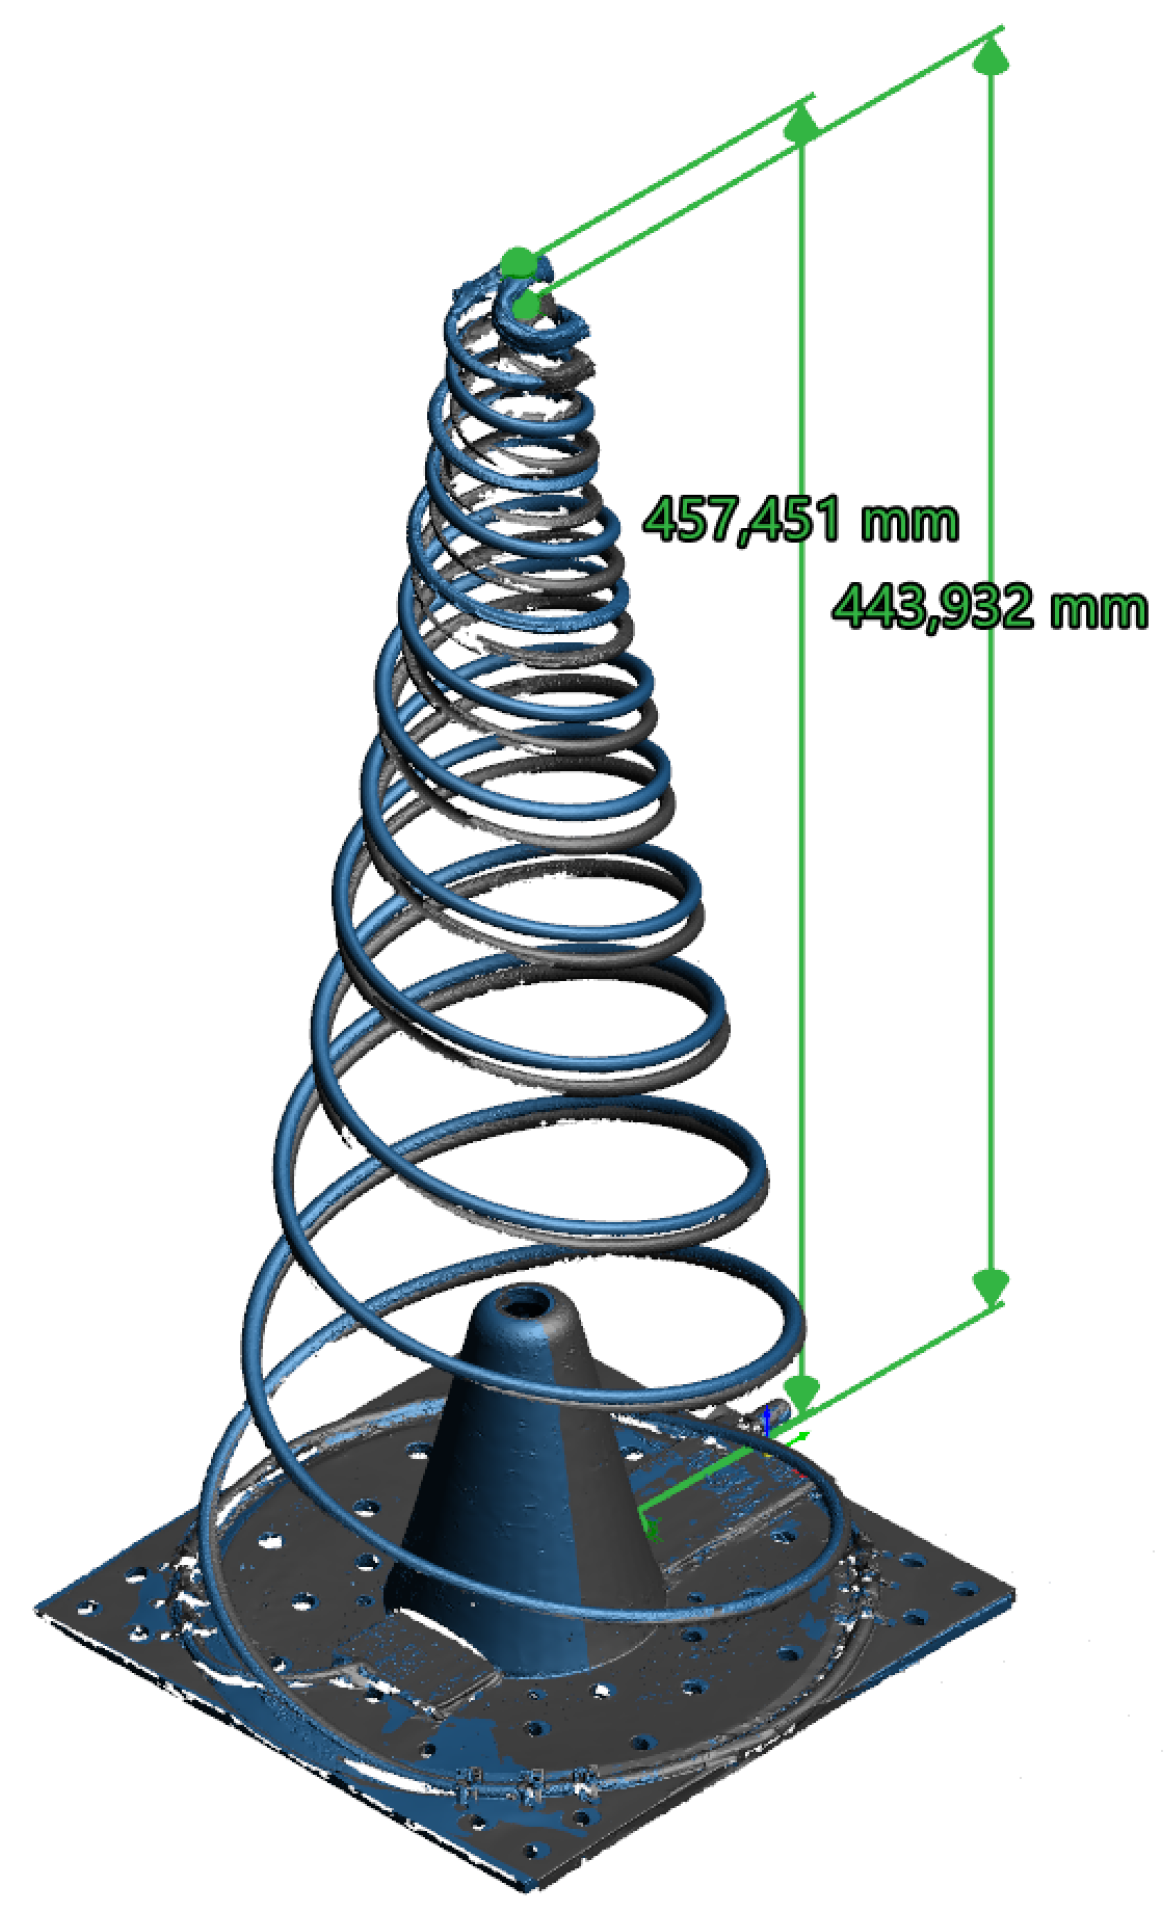
  • Dimensional stability with 3D scans in cold and warm environments—a Go!SCAN 3D camera (Manufactured by CREAFORM/AMETEK, Lévis, QC, Canada) was used;
  • Thermal cycling test in an ambient pressure thermal chamber;
  • Deployment tests with 3D scan deformation assessment, visual inspection, and RF functional tests;
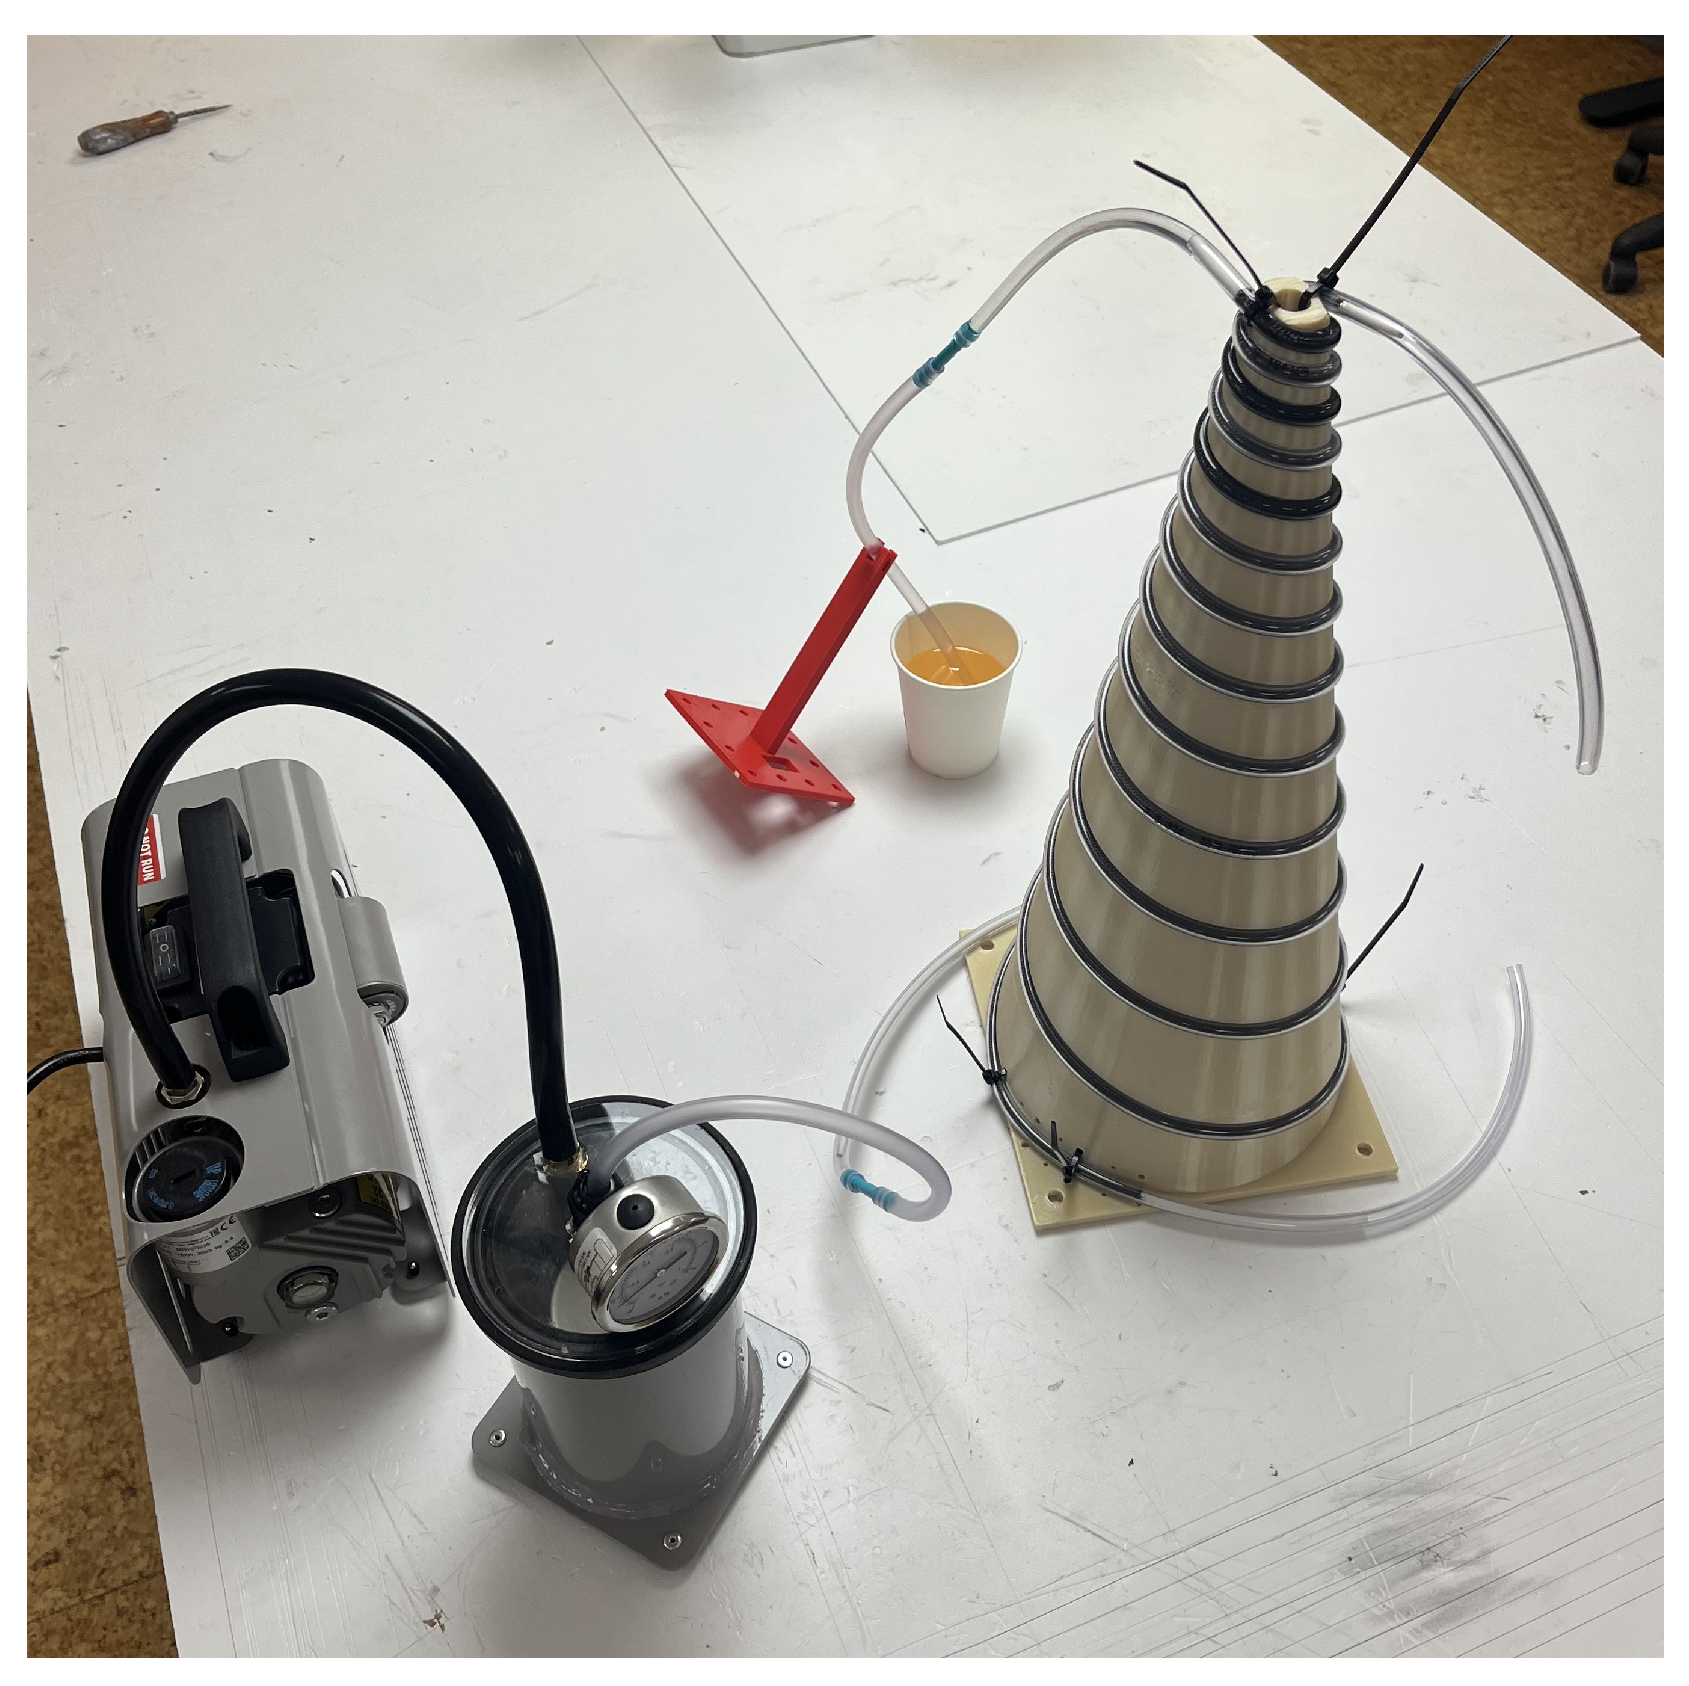
  • Thermal vacuum test to assess outgassing and structural integrity;
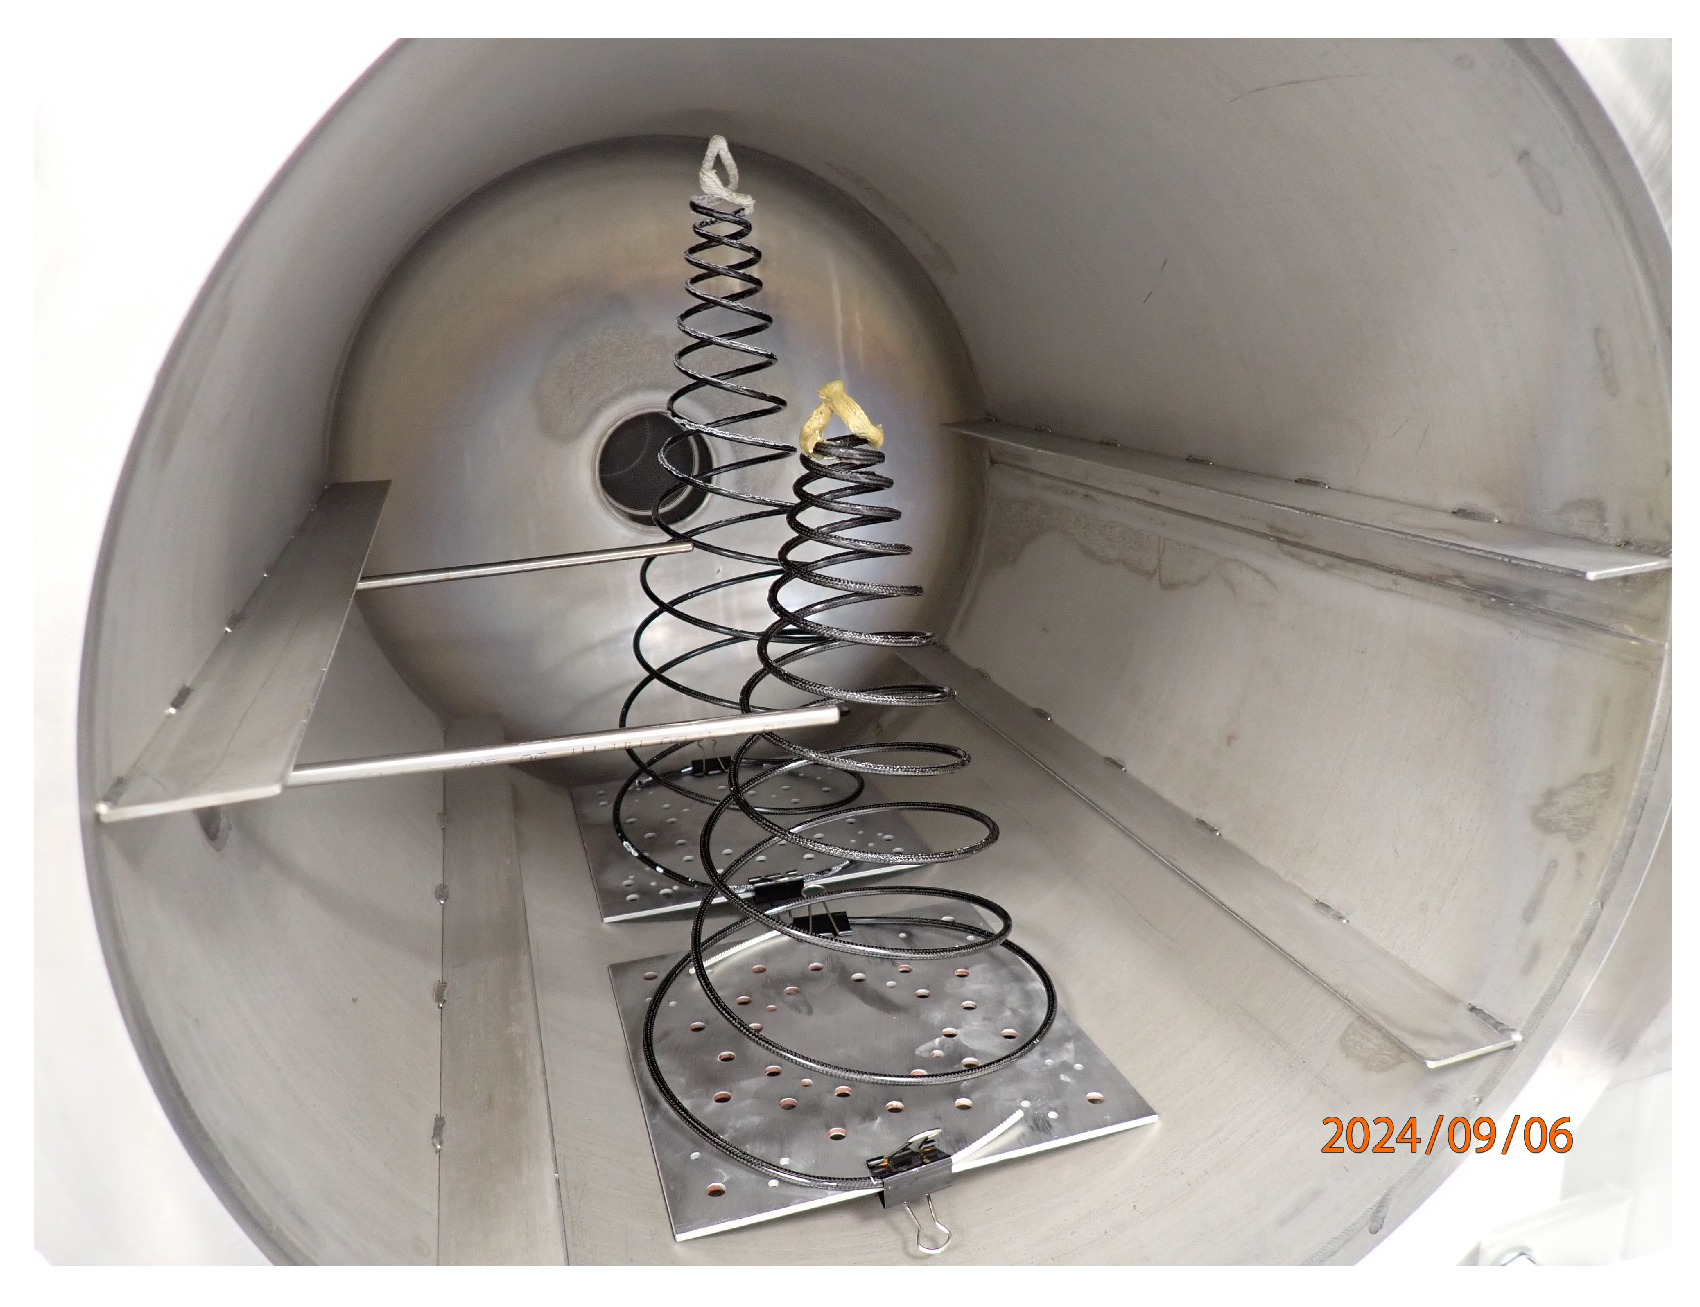
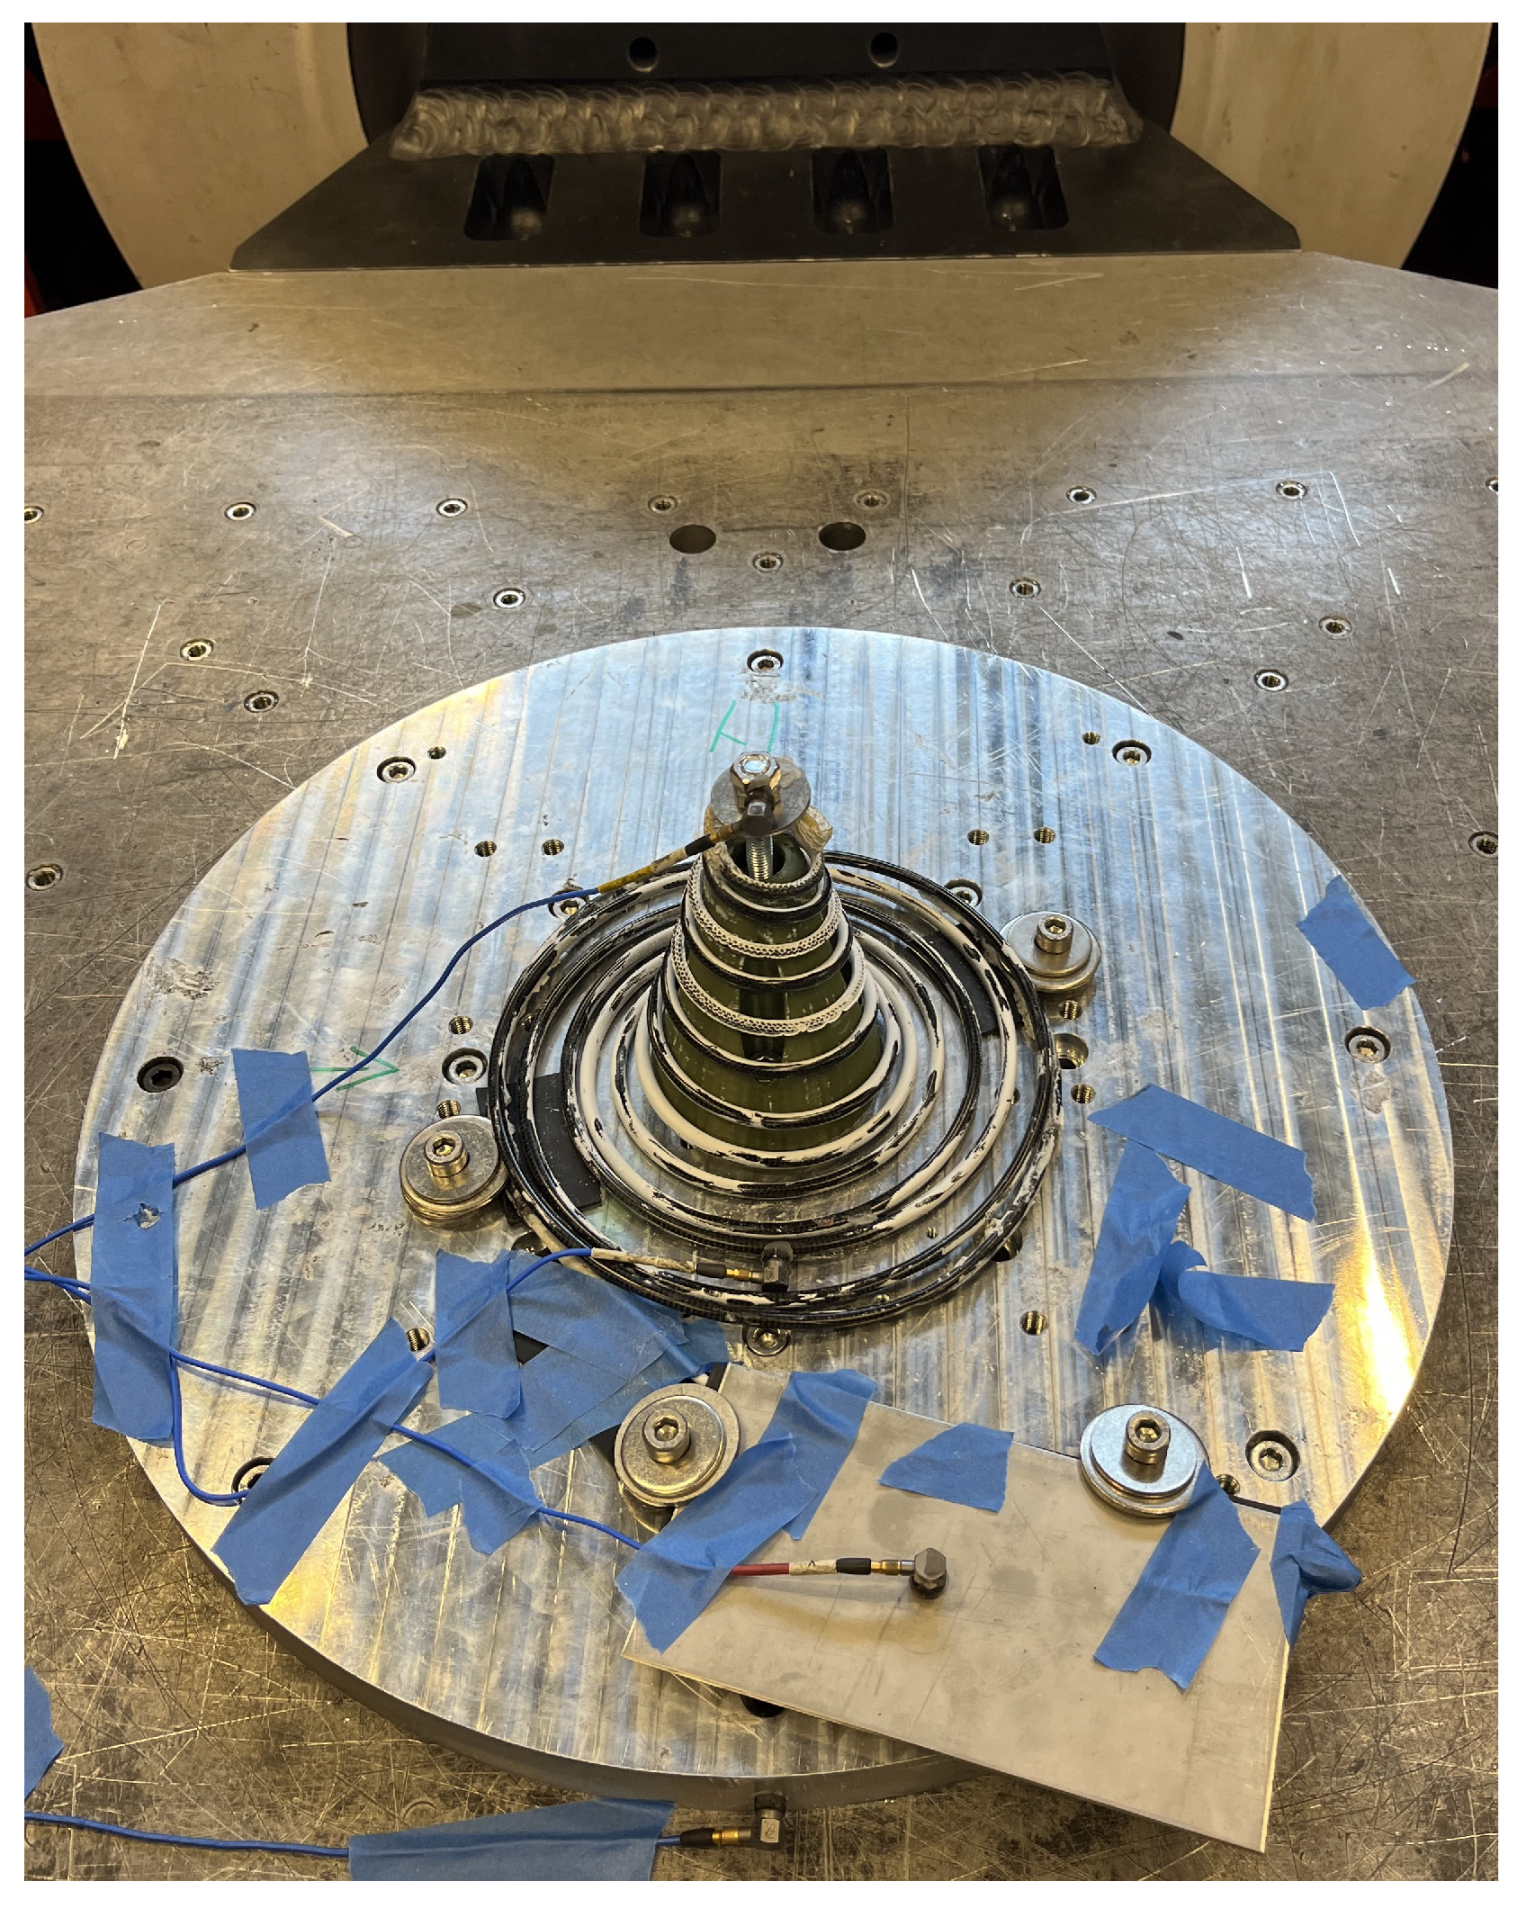
  • Vibration testing with the spring compressed at levels for a typical launch vehicle. SpaceX’s rideshare program [39] levels were used.
The environmental tests were not conducted in a ‘test as you fly’ order, which is conducting the tests in a sequential order that matches a mission profile. Additionally, some tests were excluded from the campaign, such as radiation testing, given that both epoxy resin and carbon fiber exhibit good radiation resistance [57,58]. Testing the effects of atomic oxygen on the structure was also omitted. Although atomic oxygen will reduce the flexural rigidity of the epoxy carbon composite by 5–10% after approximately 20 days in orbit [59], the antenna is not intended to be load-bearing while in operation, so this is not seen as critical. Additionally, oxidation of metallic RF electronic surfaces due to atomic oxygen will be minimized because all RF electronic components are enclosed. Nevertheless, we deem the conducted test campaign suitable to evaluate the antenna’s suitability for spacecraft applications.

3.1. Material Property Test Results

3.1.1. Glass Transition Temperature

The glass transition temperature, T g , and viscoelastic characteristics of the epoxy were measured with a TA Instruments DMA Q800 machine (Manufactured by TA Instruments, New Castle, DE, USA). A sinusoidal stress was applied to a rectangular sample of uniform cross section in a 3-point bending arrangement. The dynamic modulus was obtained over a given temperature range by the measurement of strain. Figure 5 displays the DMA results for a rectangular sample of SikaBiresin® CR80 with hardener CH80-2 cured according to the manufacturer’s recommendations.
The storage and loss moduli displayed in Figure 5 represent the energy stored in the elastic structure and the energy lost due to structure viscosity, respectively. These are often termed elastic and viscous modulus. The Tan Delta is the ratio of the loss modulus to the storage modulus.
The storage modulus is higher than the loss modulus over the entire temperature range, Tan Delta < 1, meaning that the material remains primarily elastic [60]. The Tan Delta increases after approximately 80 °C, meaning that the material begins its transition from a glassy rigid state to a more viscous state. The glass transition temperature, T g , is defined here by the distinctive peak in the loss modulus at 91 °C. Above this temperature, the Tan Delta continues to increase until approximately 100 °C as the material viscosity continues to decrease. However, the change is not sufficient to eliminate the elastic behavior of the material.
The measured T g is higher than the expected operating temperatures by more than a factor of two. SpaceX’s rideshare program [39] states that the maximum launch vehicle fairing temperature during ascent is 92 °C, and the payload temperatures will never exceed this temperature. From the provided fairing temperature curve [39], the fairing temperature exceeds the T g (91 °C) of the epoxy for the last 5 s of ascent before fairing separation. The fairing has an emissivity of approximately 0.9, and the antenna has an absorptivity of around 0.95 (matte black finish). We can thus assume black-body radiative heat transfer between the two. However, the antenna will be in contact with the spacecraft, which has an absorptivity of approximately 0.25. Thus, it will effectively cool the antenna as its temperature will lag further behind the maximum fairing temperature. Additionally, the antenna’s absorptivity can be reduced to 0.25 by spraying the antenna white. A study investigating dummy payload temperatures for several scenarios [61] estimates that payloads would not exceed 40 °C before fairing separation. This analysis and the short time interval for which the fairing temperature may exceed T g give confidence that the epoxy T g is suitable for the launch vehicle.

3.1.2. Coefficient of Thermal Expansion

The CTE of a material sample was determined with a TA Instruments TMA Q400 machine (Manufactured by TA Instruments, New Castle, DE, USA). A probe applies a small force to the sample (0.1 N), and the probe displacement is recorded while subjected to a predetermined temperature sweep. Figure 6 shows the results from TMA testing.
A 5.37 mm2 epoxy cube of SikaBiresin® CR80 with hardener CH80-2 was measured, yielding a CTE of approximately 61 µm/mK up until around 90 °C, at which point the CTE sharply increased due to it surpassing the T g . This result is as expected. For the carbon/epoxy tests, the assembly, as seen in Figure 2, was tested. For the radial test, the entire assembly was used. For the axial test, the center coaxial cable was drilled away, leaving only a sample of a hollow carbon/epoxy tube. This was performed as it was not possible to place the probe onto the carbon/epoxy material in the axial direction without it being in contact with the materials of the coaxial cable.
The radial carbon/epoxy CTE result is lower than that of the epoxy cube, approximately 45 µm/mK. It does, however, follow a similar trend. The outermost layer of the assembly is purely epoxy because a clearance within the PVC tube is required for manufacturing, which is subsequently filled with epoxy. This can be seen in Figure 2: the inner section of the carbon/epoxy layer is a dark black, as opposed to the lighter-colored layer towards the outer perimeter, which is the layer of pure epoxy. The result is lower than that of the epoxy cube due to the lower CTE of carbon fibers, which accounts for a section of the sample’s vertical stackup between the probe and fixture. However, the vertical stackup is dominated by the higher ratio of epoxy to carbon, resulting in a similar CTE trend as the pure epoxy cube. A higher CTE in the radial direction is less critical than in the axial direction, as a change in axial length will change the overall shape of the spring.
The axial carbon/epoxy curve shows a good result with a very low CTE of approximately 4 µm/mK up until approximately 80 °C, at which point the epoxy begins its transition to a viscous state. The carbon fiber exhibits a negative CTE along the fiber direction, and as the epoxy becomes more viscous, it yields to the tendency of the carbon fibers to contract, resulting in a negative dimensional change above 80 °C. The sample used was a 3.64 mm hollowed tube, which gave a CTE of around 270 µm/mK from 82 to 87 °C. This value appears excessively high. Given that the length of each spiral arm is approximately 2 m, a dimensional change of about 0.5 mm/K can be expected at the structural level when temperatures exceed 80 °C. Additionally, it is important to note that the probe applies a compressive force of 0.1 N on the sample, which may have a slight effect on the measurements of this thin-walled sample.

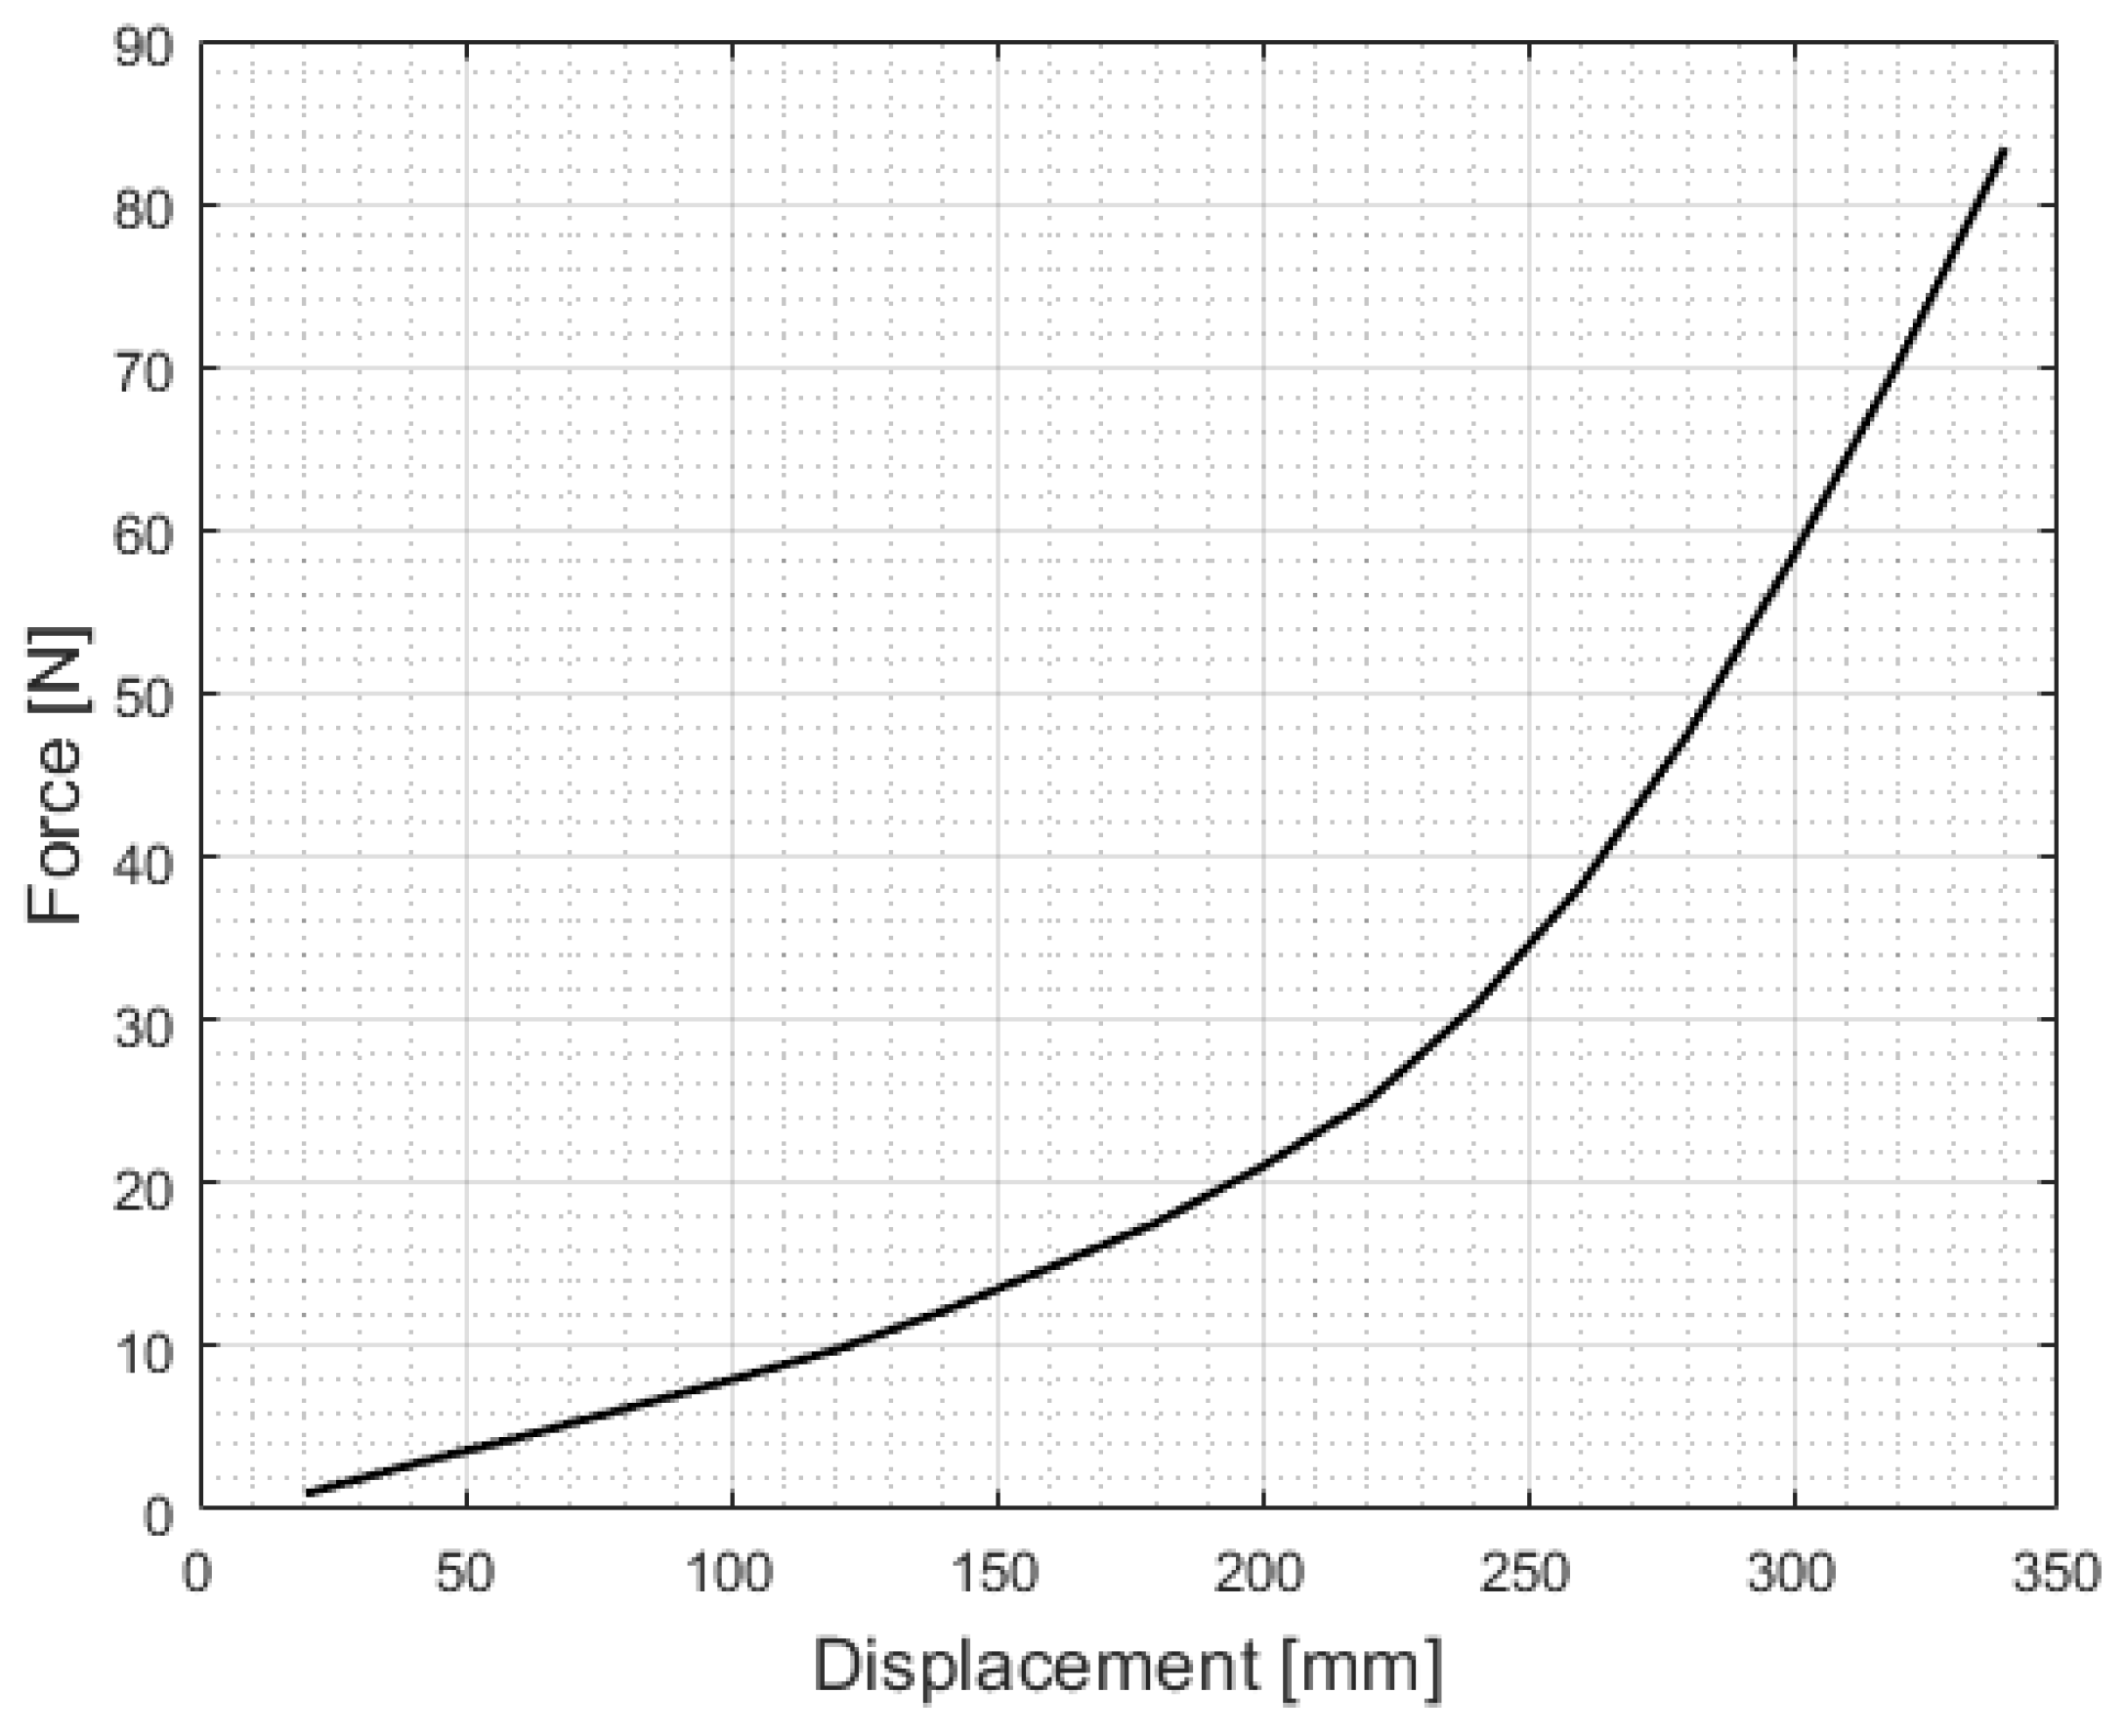
3.2. Mass Properties and Spring Stiffness

The antenna’s mass properties were derived from SolidWorks (Version 2022) modelling and measurements. The modelled mass was 126 g versus the measured mass of 138 g. The reason for the discrepancy is that the SolidWorks model did not include a small extension of the structure at the base of the spiral necessary to attach the antenna to a base plate. The coordinate system and model origin for the mass properties can be seen in Figure 7, and the mass properties in Table 1.
The spring stiffness was measured, and the results can be seen in Figure 8. The displacement is not the entire length of the spring, as the tip of the structure is too stiff to compress without risk of damage. The base plate incorporates a conical seat to accommodate the tip of the structure when compressed, which can be seen in Figure 9. A separate study details a mechanical and RF design trade-off to reduce the stiffness of the spring’s apex [62]. For this design, the force exerted on the satellite upon deployment is approximately 85 N.

3.3. Natural Frequencies of Extended Spring Structure

The natural frequencies of the extended spring structure are of interest. The natural frequency, f, of a system is defined by the following Equation (1):
2 π f = k / m
where k is the structure’s spring stiffness and m is its mass. A system may have several natural frequencies corresponding to the number of degrees of freedom. When an externally driven frequency that matches the natural frequency is applied to the structure, the structure will resonate. Prolonged resonance may damage the structure. Thus, it is desirable to understand the structure’s natural frequencies and understand which driving frequencies are produced by other satellite components, for example, reaction wheels.
We tested the antenna on a vibration table at the Norwegian Defence Research Establishment (FFI) to measure the natural frequencies. The antenna was assembled on an aluminum plate and mounted on a vibration table for testing. A low-level sign sweep (LLSS) was performed, with an amplitude of 0.1 g, sweeping from 5 Hz to 100 Hz at a rate of 0.5 oct/min. The antenna’s response was recorded via video, and the video time was synchronized with the sweep profile to identify the frequency at which the structure visibly resonated. Preliminary analysis indicated that the natural frequencies would fall within the testing range. Accelerometers were not attached as the structure had low stiffness and the accelerometers may have influenced the result. Vibration was applied in the X/Y plane. The measured natural frequencies for the extended spring are presented in Table 2, with the coordinate system referenced in Figure 7.
All natural frequencies for the extended spring structure are below 40 Hz. In a study of spacecraft reaction wheel mechanical disturbance [63], all main mode driving frequencies were above 40 Hz, with the dominant mode at 75 Hz. Thus, the antenna would not resonate due to the operation of reaction wheels. The antenna was stable throughout testing when it was not resonating. Any driving frequencies from the spacecraft platform at the antenna’s natural frequencies should be avoided.

3.4. Temperature Dimensional Stability Test Results

The antenna was initially placed in a cold room at −15 °C and subjected to a 3D scan. It was subsequently heated to 20 °C and scanned again. This procedure aimed to evaluate the structural stability and validate the CTE results presented in Figure 6. Although a temperature variation of 35 °C was relatively modest, the requirement for physical access to the antenna during scanning prevented the use of a thermal chamber.
Based on Figure 6, and assuming that each spiral has a length of 2 m, we anticipated an axial displacement of 8 µm/K, resulting in a total displacement of 0.28 mm per spiral between the two scans at high and low temperatures. The 3D camera used had a measurement resolution of 0.1 mm, according to the manufacturer. To assess the system’s accuracy, we also measured a steel bar under the same conditions, yielding an error of 0.3 mm compared with theoretical calculations based on the CTE. Previous experience at FFI suggests that a measurement error of approximately 0.5 mm is typical. Therefore, our objective was not to determine the precise deformation, but rather to verify whether the difference observed in measurements was within the expected range. The results of the two scans are presented in Figure 9.
As shown in Figure 9, the total height of the antenna differed by 0.14 mm between the two scans. This value is within the expected range, although the measurement accuracy limits preclude full confidence in the exact value. Nevertheless, the test results support the conclusion that the structure exhibits satisfactory temperature-induced dimensional stability and that the measured CTE values are reliable.
Figure 9. Three-dimensional scans of the antenna in a cold room at −15 °C and 20 °C.
Aerospace 12 00326 g009

3.5. Thermal Cycling Test Results

A thermal cycling test was conducted to assess the structural integrity of the assembly, particularly due to the layers of dissimilar materials in contact with one another, and to evaluate the epoxy adhesive after exposure to multiple temperature cycles. The test parameters were defined in accordance with the guidelines outlined in Annex D of ECSS-Q-ST-70-04C [38]. The maximum temperature was adjusted to align with the thermal limits of the epoxy, and the minimum temperature was set based on the capabilities of the test chamber. The test was performed at ambient pressure.
The antenna was cycled between temperatures of −70 °C and 80 °C for a total of 140 cycles within an ACS SU500TC 15 ESS thermal chamber (Manufactured by ACS Angelantoni Test Technologies, Massa Martana, Italy) at FFI. The temperature ramp rate was set at 10 °C per minute, with a dwell time of 5 min at both the maximum and minimum temperatures. Each cycle lasted 40 min. The actual peak temperatures recorded before stabilization were 85 °C at the maximum and −75 °C at the minimum. For the test, the antenna was mounted on a base plate that was 3D-printed from Ultem, as shown in Figure 10.
Post-test visual inspection revealed no signs of damage or deformation. A color map illustrating the geometrical difference between the 3D-scanned models taken before and after the test is shown in Figure 11. The green areas, representing approximately 50% of the data points, correspond to a geometric change within ±0.5 mm, which is the measurement uncertainty of the camera. Around 80% of the data points are within ±1 mm of each other. The purple regions indicate data points that the software could not define due to scan quality and the software model fitting process. Scan quality was lower near the base of the spiral, as the camera could not see through the table. However, when the scanned models were superimposed without the color map, no significant deviations were observed in these regions. Furthermore, defined points were found interspersed within the undefined areas, suggesting that the purple regions represent non-physical software-induced errors rather than actual structural changes. These results provide confidence that the structure remains stable and does not undergo significant deformation during thermal cycling.

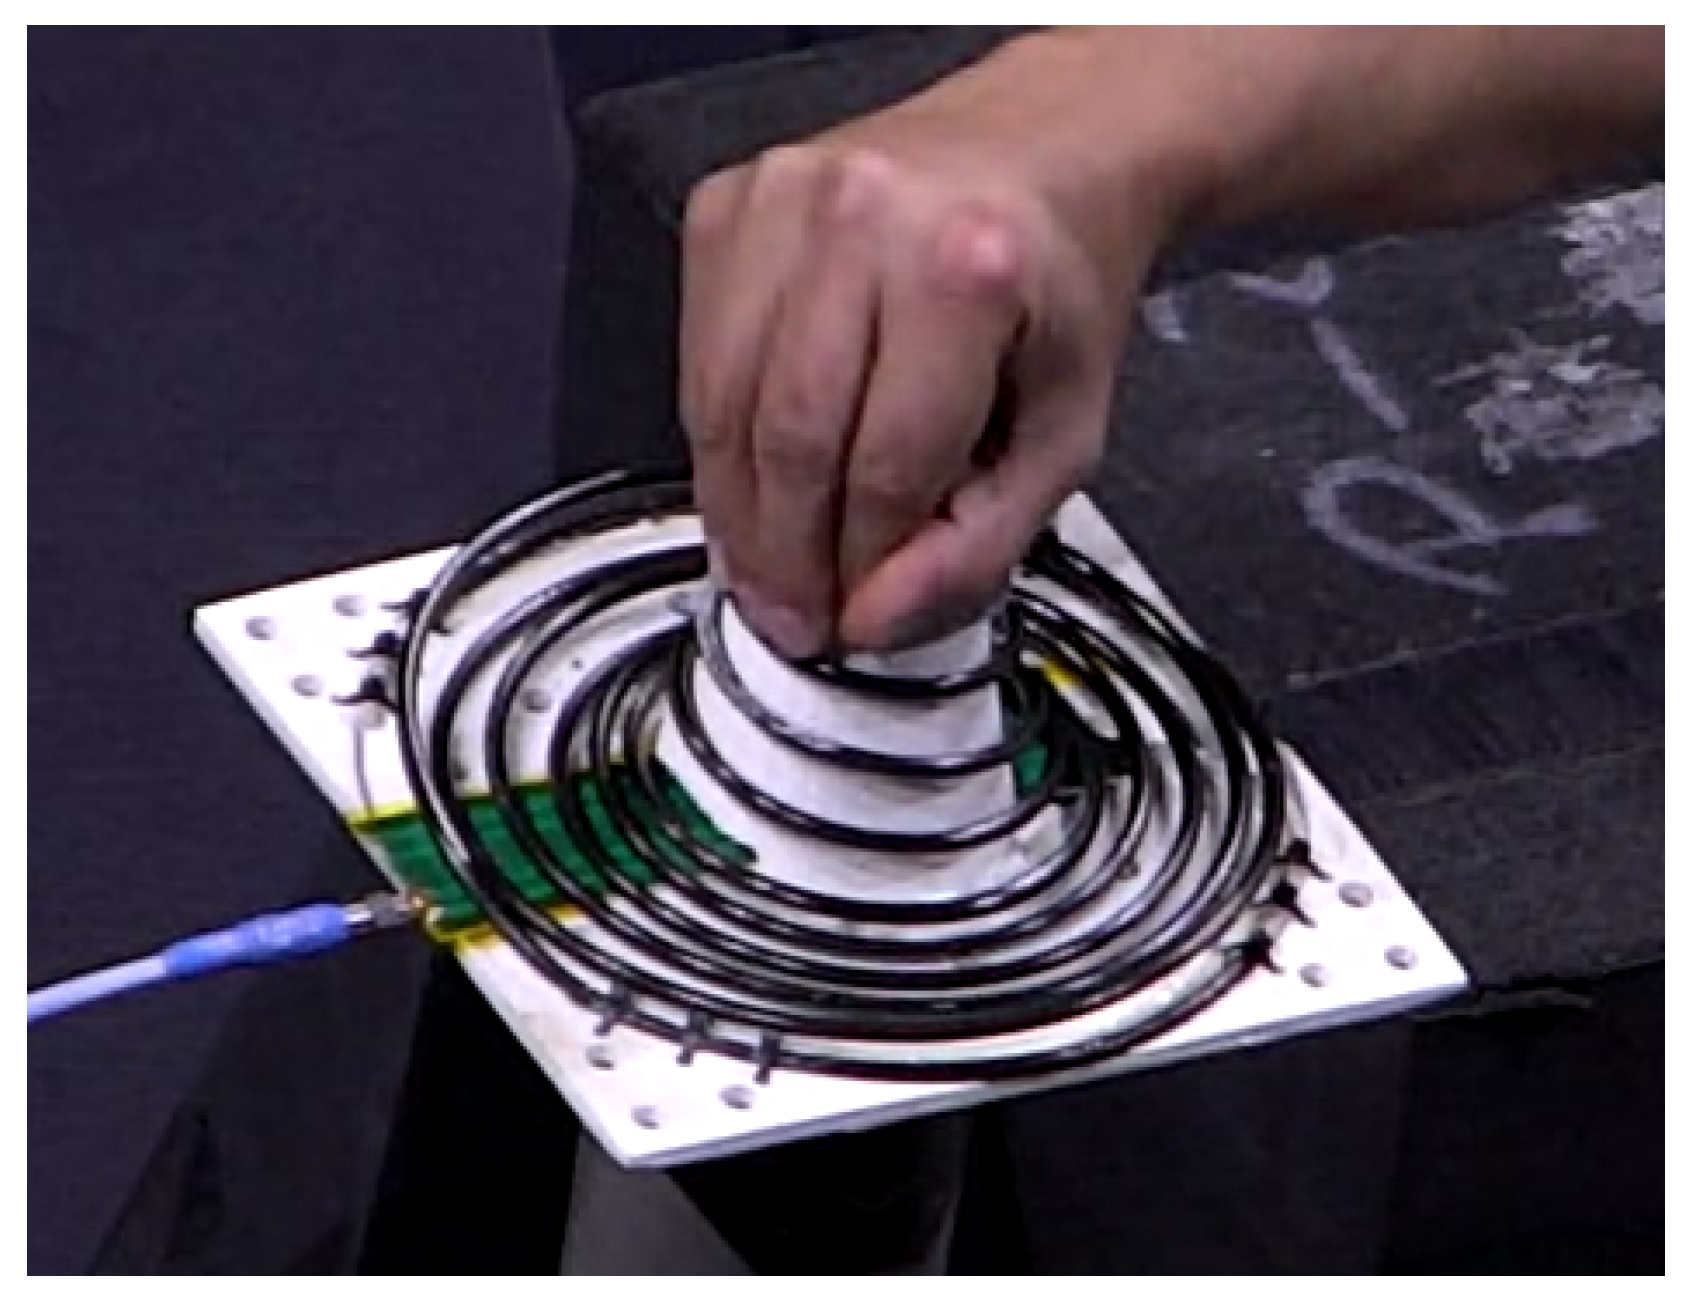
3.6. Antenna Deployment Test Results

The antenna was deployed and retracted 200 times. Prior to and following the deployments, the structure was 3D-scanned, and its RF performance tested. The tests were conducted in a probe array spherical near-field (SNF) range at Pulsaart by AGC Glass Europe in Belgium. During each deployment, the antenna was manually compressed and then released. We have not integrated a hold-down and release mechanism (HDRM). We envisage a burn wire device as a suitable HDRM. The antenna in its compressed state can be seen in Figure 12.
The structure deformation due to the 200 compressions, determined by 3D scanning, can be seen in Figure 13. The antenna contracted by approximately 1.3 cm due to settling during compressions. From testing with other prototypes, we know that the settling deformation occurs within approximately the first 10 cycles, and then it stabilizes. The same settling behaviour has been reported in previous research [64] for carbon helical springs. The deformation is most pronounced towards the tip of the antenna, where it exhibits the highest spring stiffness.
To investigate how the structure deformation affects the RF performance, we compared the realized gain, radiation pattern, and axial ratio before and after the deformation. The measurement of antenna’s realized gain before and after compressions can be seen in Figure 14. The results show that the small change in geometry of the structure had a negligible effect on the antenna’s realized gain.
The measured directivity E-plane radiation pattern before and after compressions is shown in Figure 15 for the center frequency, 1 GHz. The SNF range used for measurements did not test the back lobes, as discussed in [36]. Nevertheless, the results show that the radiation pattern was unchanged due to the slight structure deformation. A comprehensive analysis of the radiation patterns is given in [36].
The measured axial ratios before and after compressions is shown in Figure 16. The axial ratios are given at boresight and ±30° of boresight. At ±30° of boresight, the average values of all phi angles at each frequency are displayed. The results are less than 3 dB across the frequency range, expected of circularly polarized antennas [65]. We can see that the structure deformation had a negligible effect on the axial ratio of the antenna.

3.7. Thermal Vacuum Test Results

A thermal vacuum test was conducted to quantify the mass loss from the antenna structure due to outgassing in a vacuum environment and to ensure its stability under such conditions. In a low earth orbit at 500 km, ultra-high vacuum at approximately 1 × 10⁻¹⁰ mbar is to be expected [66]. The test was carried out using a Löwener thermal vacuum chamber (Manufactured by Löwener Vacuum Technology AB, Stockholm, Sweden) at Kongsberg Defence and Aerospace, which is capable of achieving high vacuum conditions, with the chamber sensor becoming saturated at 1 × 10⁻⁴ mbar. The test was performed to meet typical rideshare contamination requirements [39], which stipulate that the test must be performed in accordance with the ASTM E595-15 standard [67]. According to this standard, the tested pressure does not need to match the expected orbital pressure, as long as the mean free path ( λ ) of gas molecules is longer than the dimensions of the chamber. The mean free path is calculated using the following Equation (2) [68]:
λ = K b T 2 π d 2 p
where the Boltzmann constant K b = 1.380649   ×   10 23 J/K. The gas temperature T = 350 K, corresponding to a test temperature of 80 °C. The particle kinematic diameter d = 3.64   ×   10 10 m, for which the particle nitrogen was used because it is the most numerous in air, and the chamber pressure p = 0.01 Pa, corresponding to 1 × 10⁻⁴ mbar. The calculated mean free path, λ = 0.82 m, is larger than the 0.5 m chamber length; thus, the test meets the standards requirements.
The structure was exposed to high vacuum at 80 °C for a total of 150 h in two cycles. The first cycle was 72 h, and the second 78 h. The mass of the structure was measured before and after each cycle on a scale with a resolution of 1 × 10⁻³ g. The antenna can be seen in the vacuum chamber in Figure 17, and the total mass loss results are shown in Table 3.
Table 3 shows that the structure lost more mass during the first vacuum cycle. This was anticipated. The contamination requirements specify a total mass loss of 1% or less and a collected volatile condensable material (CVCM) of 0.1% or less [39]. We did not collect the material that gassed out, and therefore, our aim was a total mass loss of no more than 0.1%. This was obtained in the second outgassing cycle. We thus conclude that the structure satisfies the requirements for contamination after an initial 72 h bake-out at 80 °C in a vacuum, which complies with the standard ASTM E595-15. A visual inspection after the test showed no signs of structural damage as a result of the vacuum condition.

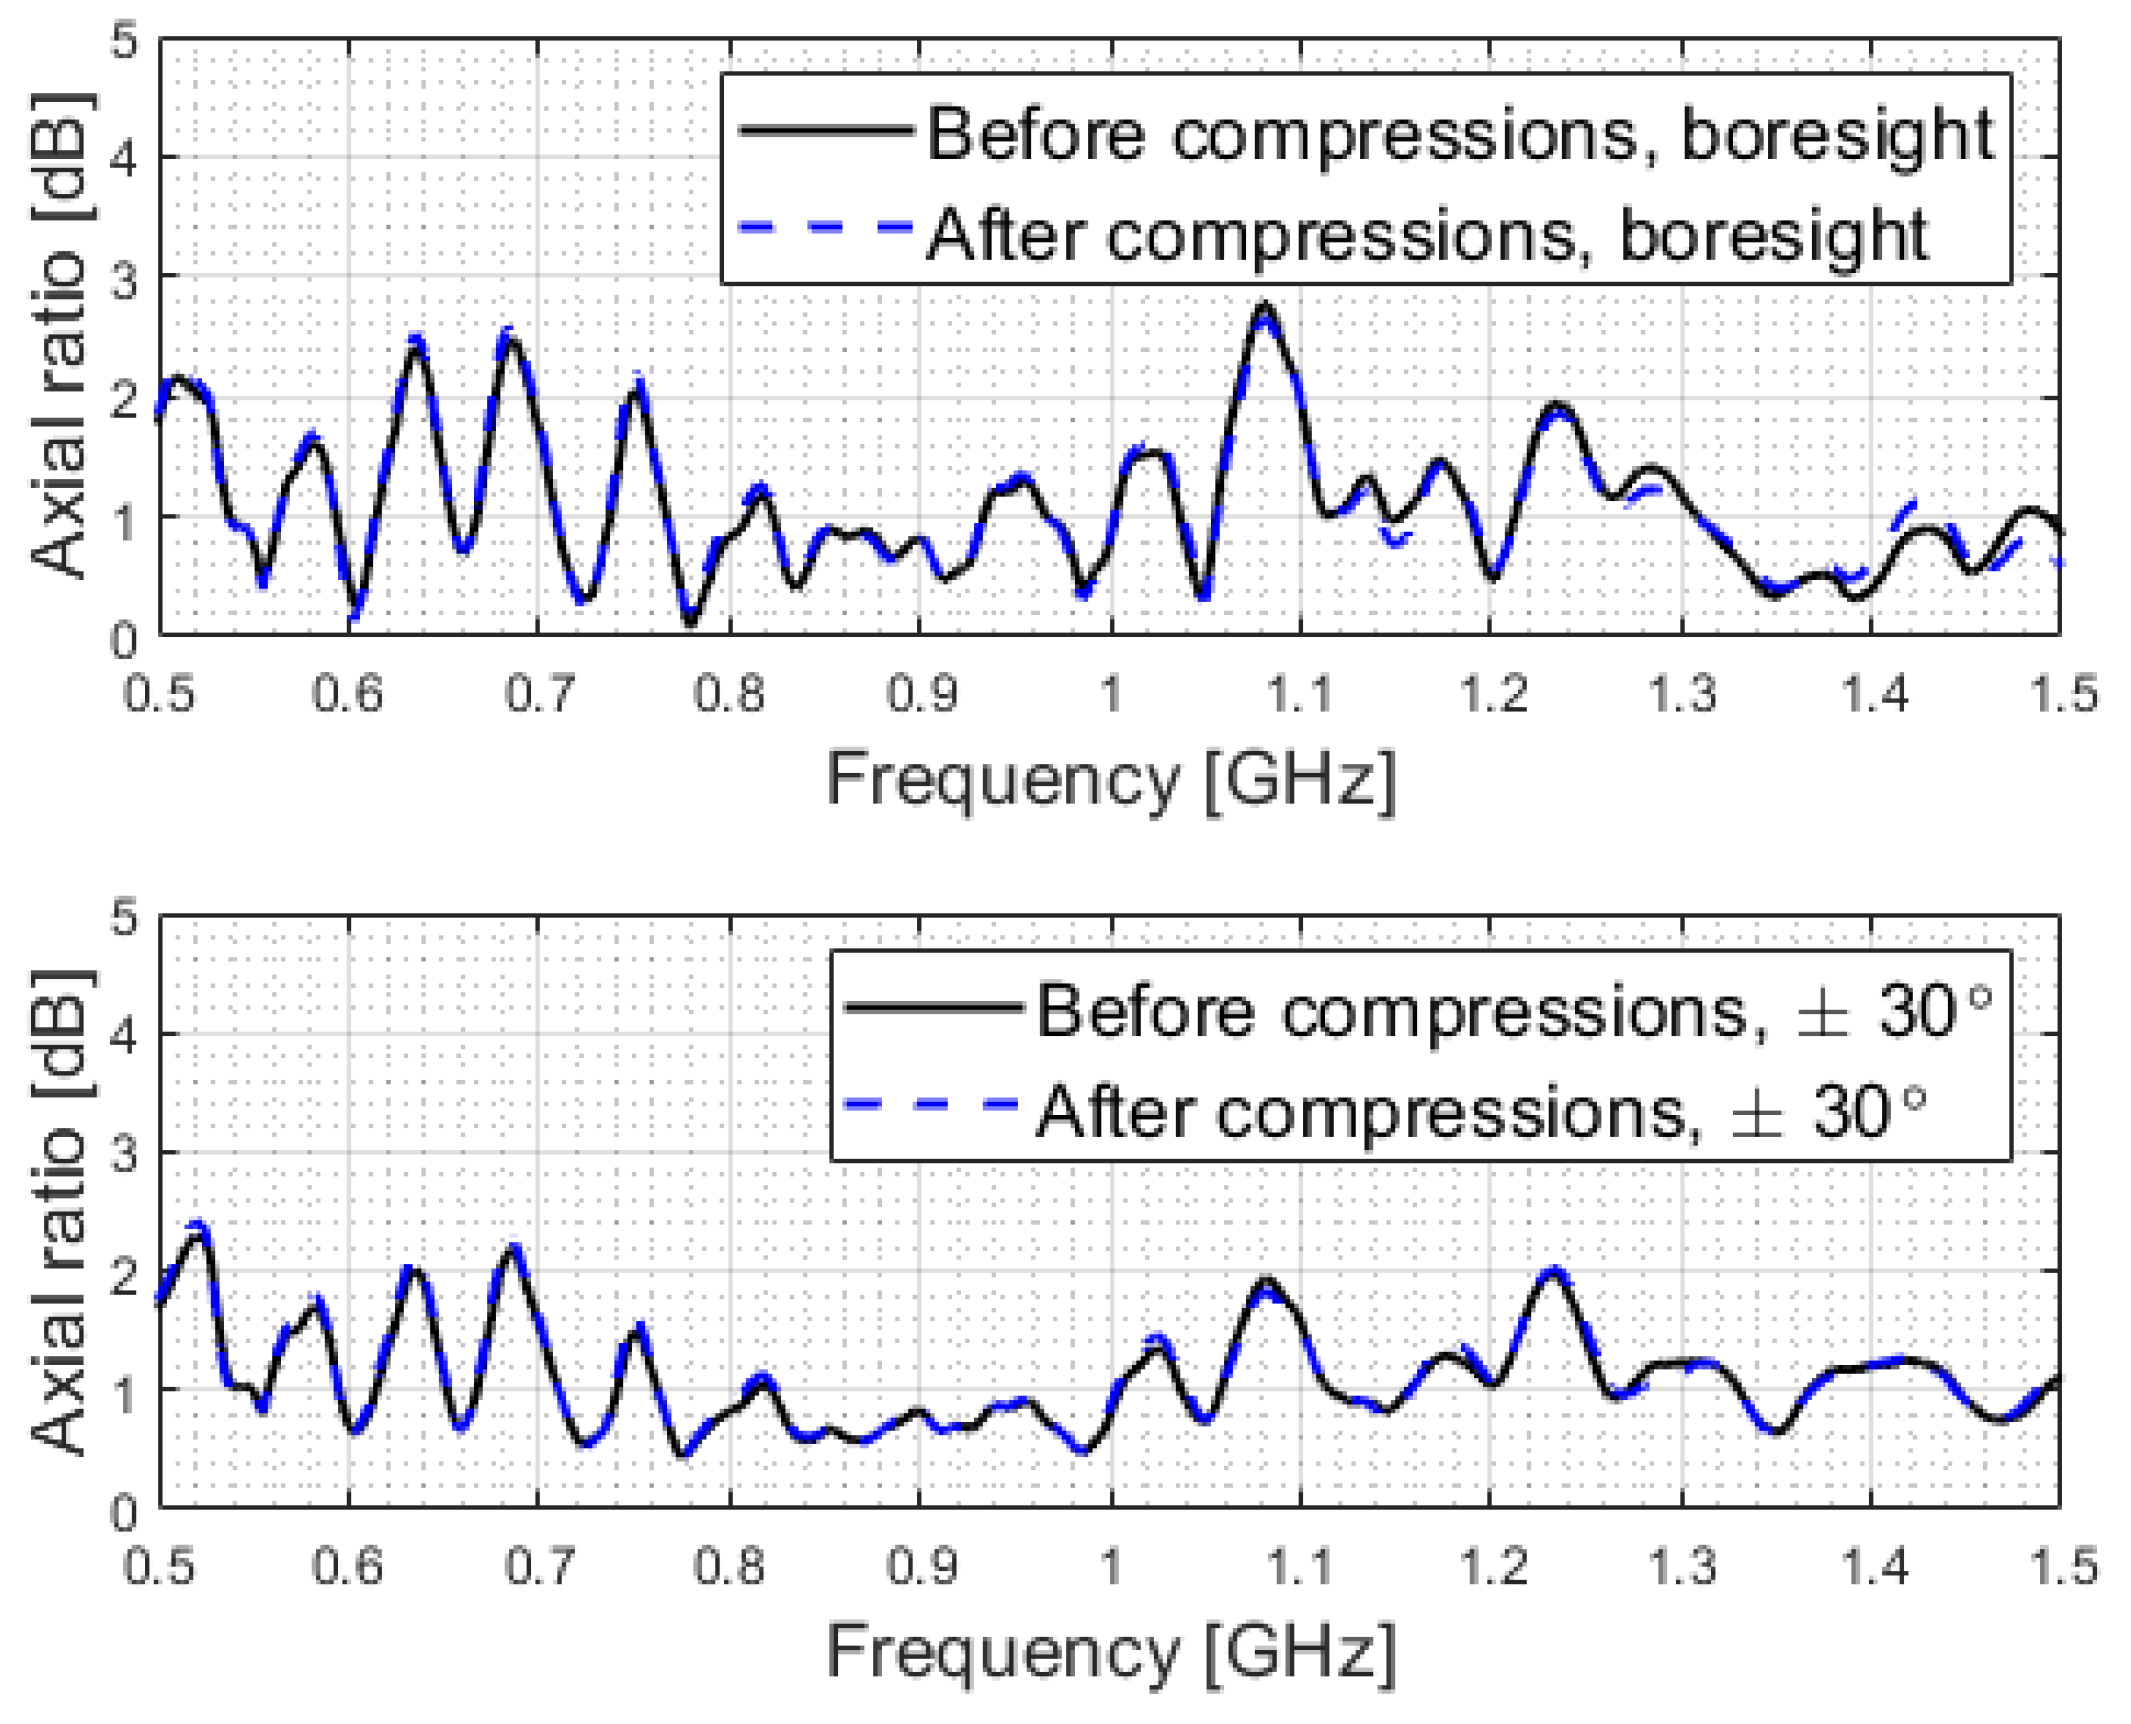
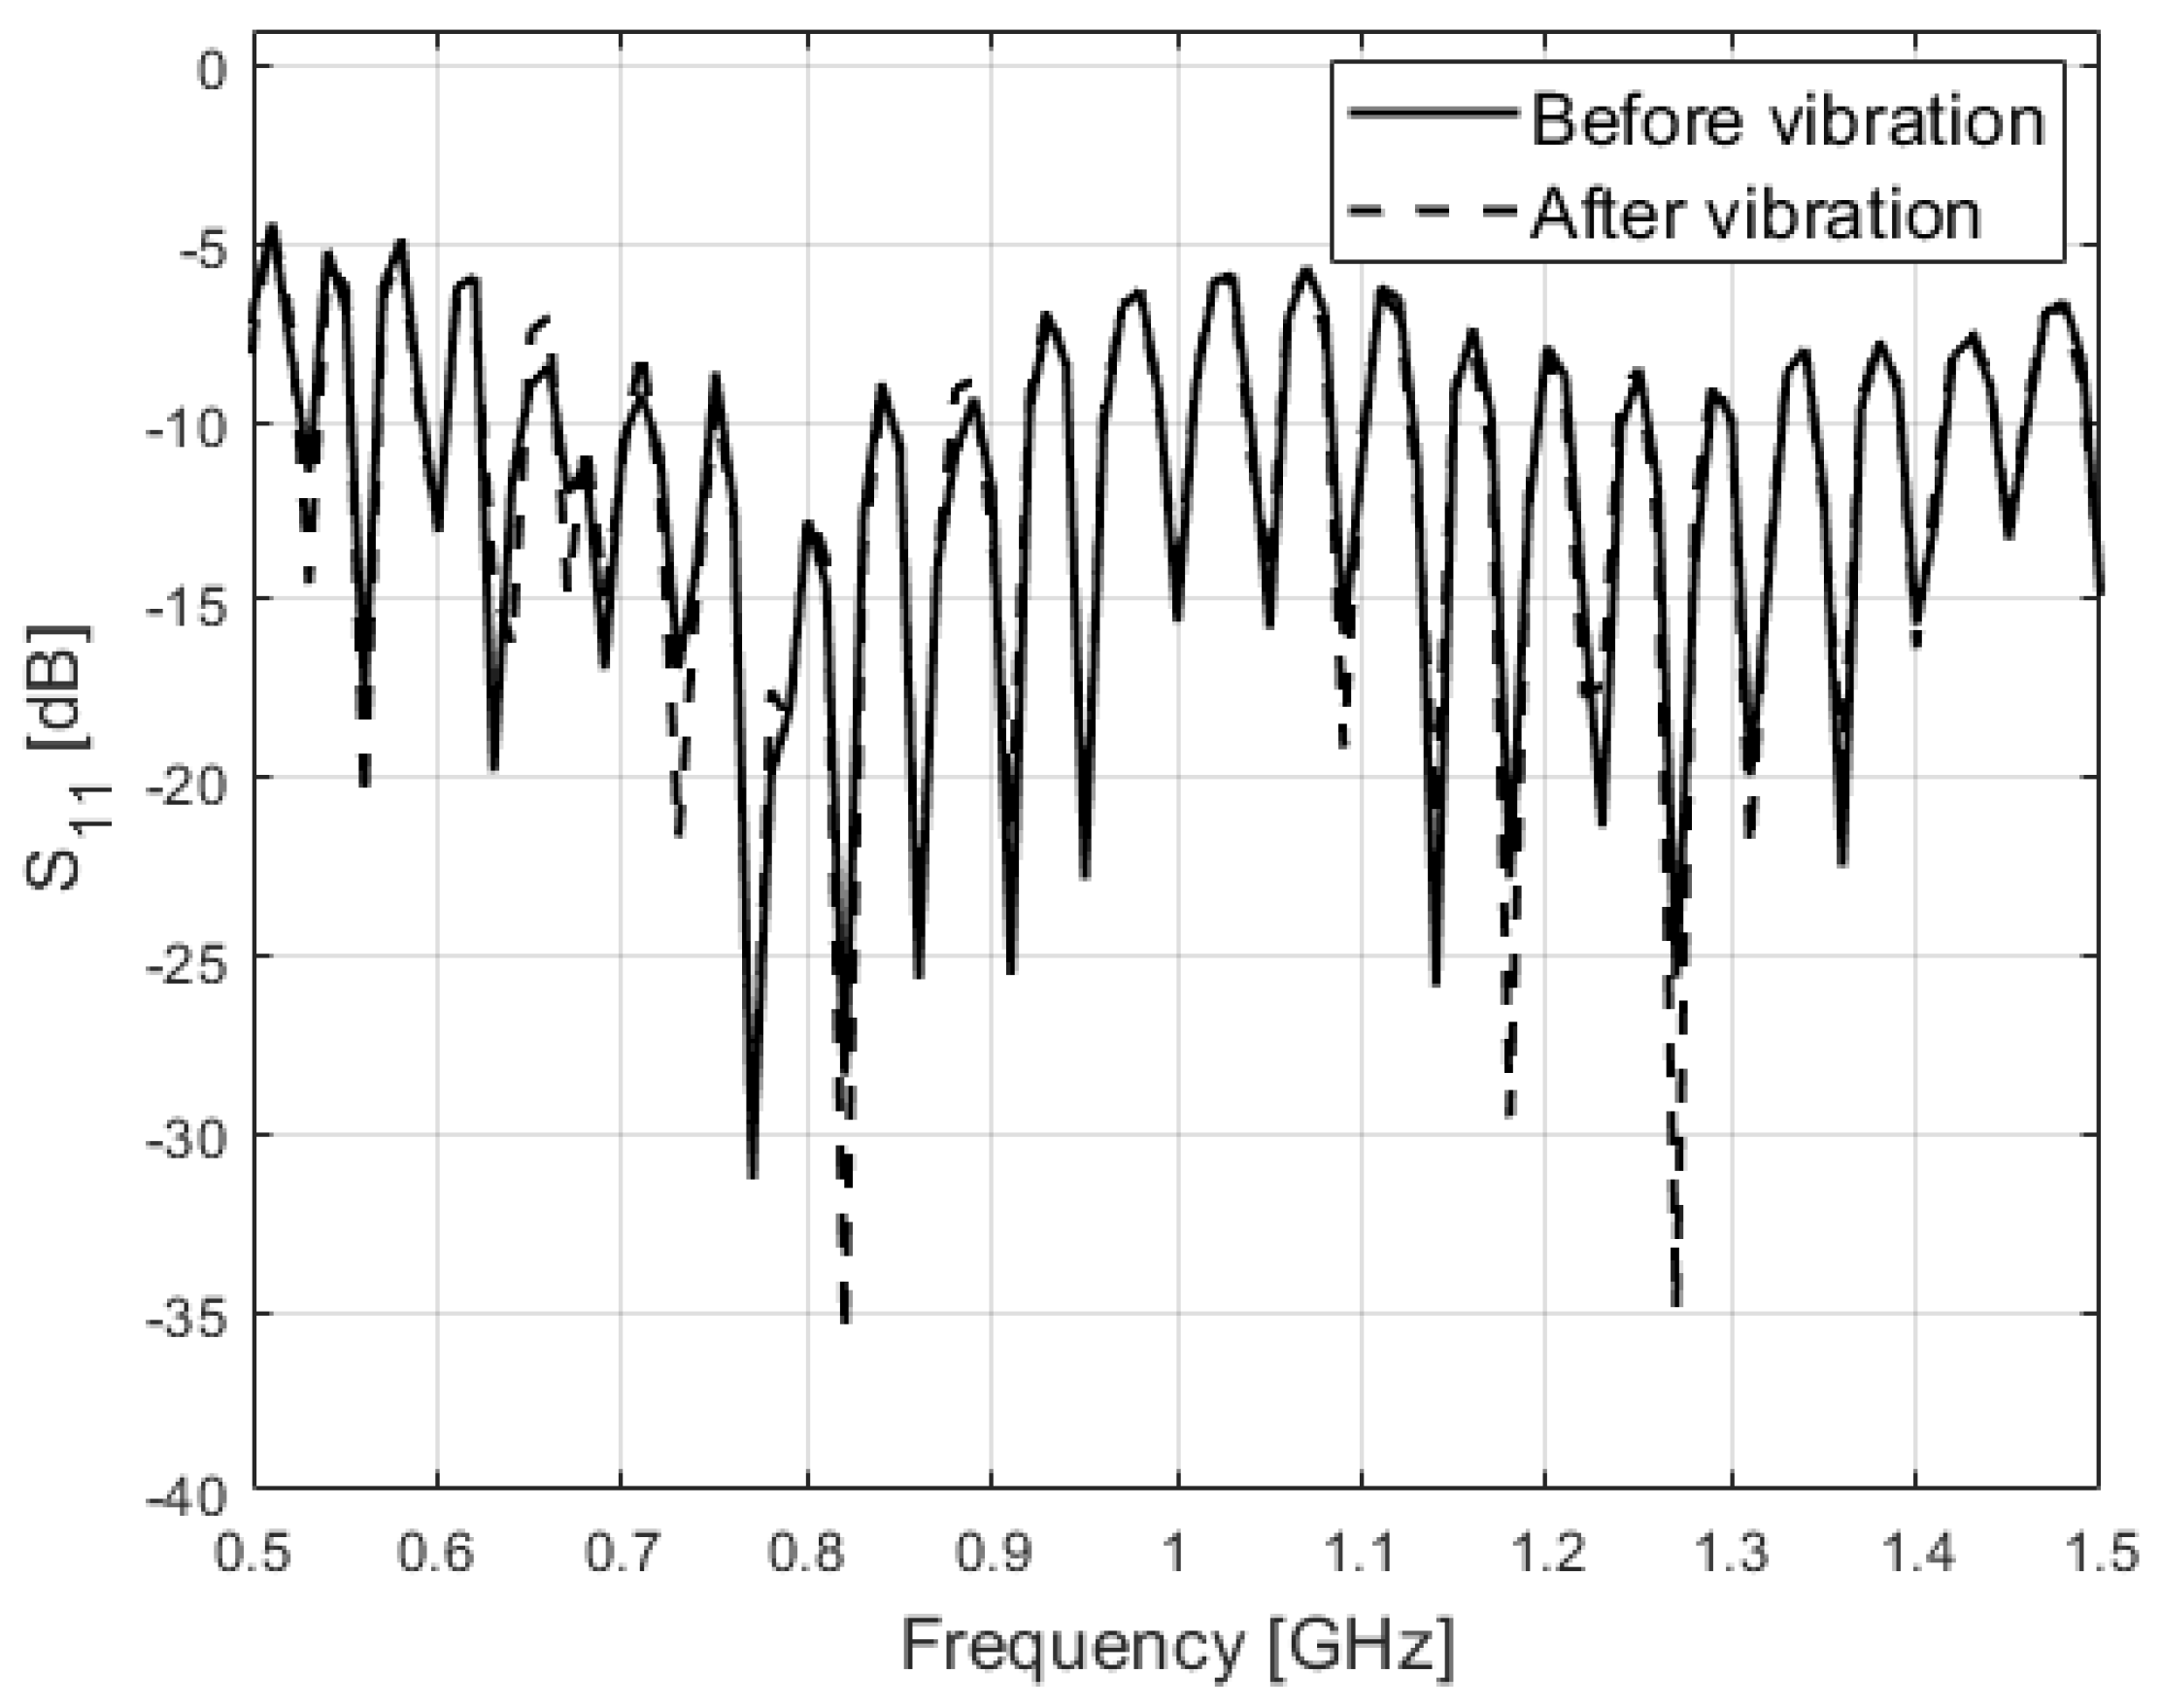
3.8. Vibration Test Results for Compressed Spring

The vibration test was conducted to validate that the compressed antenna structure can endure the launch environment and to confirm that no structural natural frequencies were present within the forbidden range specified by the launch provider [39]. The launch provider’s success criteria for a satellite are (1) all primary modes must be above 40 Hz, (2) the on-axis frequency shift should be less than 10%, and (3) the on-axis amplitude shift should be less than 30% when comparing pre- and post-vibration measurements. We evaluated the antenna against these requirements, in addition to impedance measurements before and after the test, to confirm the antenna functionality. In addition, we did a post-test visual inspection.
The test levels [39] were developed for satellite structures with a quality factor (Q factor) between 10 and 50. A low-level sine sweep (LLSS) was used to evaluate the structure’s main modes. The test sequence was run first in the Z axis, followed by X and then Y. The test was conducted on a vibration table at FFI. The test levels and test sequence can be see in Table 4. The test levels and sequence fulfilled the requirements.
The antenna was mounted onto an aluminum plate with a 3D-printed acrylonitrile styrene acrylate (ASA) conical seat. The RF electronics were also secured to the baseplate, allowing for functionality tests both before and after vibration. Since the HDRM was not part of the design, the spring was compressed and secured to the conical seat using an M8 bolt. The antenna under test is shown in Figure 18.
Single-axis accelerometers were attached to the structure using beeswax. The measured natural frequency varied depending on the placement of the accelerometer on the carbon structure. This variation was due to the differing stiffnesses of the structural components: the apex, the area seated on the cone, and the section connected to the baseplate were all relatively stiff, while the compressed spring exhibited lower stiffness. We identified the least stiff section of the spring in order to determine the lowest main mode natural frequency.
The results for the main modes, amplitudes, and Q factors across all three axes, from the first and last LLSS tests, are presented in Table 5. The main mode frequencies remained stable throughout testing and were all above 40 Hz. The amplitude shift along the Z axis exceeded the requirement by 2.61%. We also tested the second antenna, shown in Figure 17, where the Z axis amplitude shift was found to be 14%. Since these requirements apply to spacecraft, the small deviation in amplitude shift is less concerning at the prototype antenna level. Furthermore, due to its low mass, the antenna is expected to have a negligible impact on the spacecraft test levels. A visual inspection of the antenna after vibration, along with releasing it to its extended length, revealed no mechanical degradation.
The Q factors for all modes were found to be below 10, whereas the tests are designed for equipment with values between 10 and 50. The low Q factors indicate that the antenna possesses inherent damping, which is expected due to the elastic nature of the structure.
A measurement of the antenna’s impedance through the scattering parameter, S11, is shown in Figure 19. The presented S11 results are affected by electrical contact between the antenna and supporting metallic fixtures; here, however, we are only interested in changes due to vibration. The antenna’s impedance had negligible change throughout vibration testing, giving confidence that the RF structural components tolerated the vibration levels.
The vibration test showed that the antenna structure can tolerate the launch vibrations from a typical launch vehicle. The natural frequencies are stable and are high enough so as to not resonate with typical launch-vehicle-driven frequencies.

4. Conclusions

We have presented the design, manufacturing, and environmental tests for a deployable conical log spiral spacecraft antenna. The antenna is designed for 500 to 1500 MHz, is right-hand circularly polarized, and has a realized gain between 3 and 6 dBi. The carbon composite structure provides the spring properties and has an embedded coaxial cable, which is the RF element.
The results confirm that the structure’s glass transition temperature and coefficient of thermal expansion are suitable for a typical low earth orbit (LEO) environment. The natural frequencies of the extended spring are all below 40 Hz, which is compatible with standard reaction wheels. For the compressed spring before deployment, the natural frequencies are all above 250 Hz, which is suitable for a typical launch vehicle. A total mass loss due to outgassing of 0.03%, after an initial 72 h bake-out, complies with typical launch contamination requirements. The structure contracted slightly after several deployment cycles, but that had a negligible effect on the antenna’s RF performance. Thermal testing has shown that the structure is stable during thermal cycling for a representative LEO environment. Additionally, the structure is stable when exposed to vacuum.
The results show that the antenna can tolerate a typical launch vehicle and space environment. The main structural parameters relevant to a spacecraft mission designer are presented. We conclude that the presented composite carbon fiber antenna is suitable for spacecraft applications.

5. Patents

A priority patent application was filed for this work by the University of Oslo in March 2025.

Author Contributions

Conceptualization, L.R.W., L.E.B. and B.S.; methodology, L.R.W., L.E.B., N.H. and B.S.; software, L.R.W. and N.H.; validation, L.R.W., L.E.B., B.S. and N.H.; formal analysis, L.R.W.; investigation, L.R.W., N.H. and B.S.; resources, L.R.W., L.E.B. and A.R.; data curation, L.R.W.; writing—original draft preparation, L.R.W.; writing—review and editing, L.R.W., L.E.B. and B.S.; visualization, L.R.W.; supervision, L.E.B., K.V.H. and B.S.; project administration, L.R.W.; funding acquisition, L.E.B. All authors have read and agreed to the published version of the manuscript.

Funding

This work was supported by the Research Council of Norway (Grant No. 309835), Centre for Space Sensors and Systems (CENSSS).

Data Availability Statement

The data presented in this study are available on request from the corresponding author. The data are not publicly available due to privacy reasons.

Acknowledgments

The authors would like to acknowledge the contribution, time, and effort devoted to this research by the prototype workshop and environmental test laboratory at the Norwegian Defence Research Establishment (FFI). Williams is pleased to acknowledge the contribution of the IMechE Whitworth Senior Scholarship Award in supporting his research.

Conflicts of Interest

The authors declare no conflicts of interest.

References

  1. Pelton, J.N. (Ed.) Space 2.0: Revolutionary Advances in the Space Industry; Springer International Publishing: Berlin/Heidelberg, Germany, 2019. [Google Scholar]
  2. Imbriale, W.A.; Gao, S. (Eds.) Space Antenna Handbook, 1st ed.; Wiley: Chichester, UK, 2012. [Google Scholar]
  3. Jones, H.W. The Recent Large Reduction in Space Launch Cost. In Proceedings of the International Conference on Environmental Systems (ICES), Albuquerque, NM, USA, 8–12 July 2018. NASA Technical Report: 20200001093. [Google Scholar]
  4. Bradbury, L.M.; Diaconu, D.; Molgat Laurin, S.; Beattie, A.M.; Ma, C.; Spydevold, I.S.; Haugli, H.C.; Zee, R.E.; Harr, J.; Udnæs, F. NorSat-2: Enabling advanced maritime communication with VDES. Acta Astronaut. 2019, 156, 44–50. [Google Scholar] [CrossRef]
  5. Abulgasem, S.; Tubbal, F.; Raad, R.; Theoharis, P.I.; Lu, S.; Iranmanesh, S. Antenna Designs for CubeSats: A Review. IEEE Access 2021, 9, 45289–45324. [Google Scholar] [CrossRef]
  6. Costantine, J.; Tawk, Y.; Christodoulou, C.G.; Banik, J.; Lane, S. CubeSat Deployable Antenna Using Bistable Composite Tape-Springs. IEEE Antennas Wirel. Propag. Lett. 2012, 11, 285–288. [Google Scholar] [CrossRef]
  7. Johnson, J.T.; Jezek, K.C.; Macelloni, G.; Brogioni, M.; Tsang, L.; Dinnat, E.P.; Walker, J.P.; Ye, N.; Misra, S.; Piepmeier, J.R.; et al. Microwave Radiometry at Frequencies From 500 to 1400 MHz: An Emerging Technology for Earth Observations. IEEE J. Sel. Top. Appl. Earth Obs. Remote. Sens. 2021, 14, 4894–4914. [Google Scholar] [CrossRef]
  8. Brogioni, M.; Leduc-Leballeur, M.; Andrews, M.J.; Macelloni, G.; Johnson, J.T.; Jezek, K.C.; Yardim, C. 500–2000-MHz Airborne Brightness Temperature Measurements Over the East Antarctic Plateau. IEEE Geosci. Remote. Sens. Lett. 2022, 19, 7001005. [Google Scholar] [CrossRef]
  9. Jezek, K.C.; Johnson, J.T.; Tan, S.; Tsang, L.; Andrews, M.J.; Brogioni, M.; Macelloni, G.; Durand, M.; Chen, C.C.; Belgiovane, D.J.; et al. 500–2000-MHz Brightness Temperature Spectra of the Northwestern Greenland Ice Sheet. IEEE Trans. Geosci. Remote. Sens. 2018, 56, 1485–1496. [Google Scholar] [CrossRef]
  10. Andrews, M.J.; Johnson, J.T.; Brogioni, M.; Macelloni, G.; Jezek, K.C. Properties of the 500–2000-MHz RFI Environment Observed in High-Latitude Airborne Radiometer Measurements. IEEE Trans. Geosci. Remote. Sens. 2022, 60, 5301311. [Google Scholar] [CrossRef]
  11. The Things Network. Frequencies by Country. 2023. Available online: https://www.thethingsnetwork.org/docs/lorawan/frequencies-by-country/ (accessed on 28 March 2023).
  12. Naveena, M.; Singh, D.K.; Singh, H. Design of UHF band UWB antenna for foliage penetration application. In Proceedings of the 2017 IEEE International Conference on Antenna Innovations & Modern Technologies for Ground, Aircraft and Satellite Applications (iAIM), Bangalore, India, 24–26 November 2017; pp. 1–3. [Google Scholar] [CrossRef]
  13. Manohar, V.; Bhardwaj, S.; Venkatakrishnan, S.B.; Volakis, J.L. VHF/UHF Ultrawideband Tightly Coupled Dipole Array for CubeSats. IEEE Open J. Antennas Propag. 2021, 2, 702–708. [Google Scholar] [CrossRef]
  14. Islam, M.R.; Carvalho, M.; Venkatakrishnan, S.B.; Volakis, J.L. Packable and Readily Deployable Tightly Coupled Dipole Array (TCDA) with Integrated Planar Balun. IEEE Open J. Antennas Propag. 2022, 3, 1206–1217. [Google Scholar] [CrossRef]
  15. Abulgasem, S.; Tubbal, F.; Raad, R.; Theoharis, P.I.; Liu, S.; Ali Khan, M.U. A Wideband Metal-Only Patch Antenna for CubeSat. Electronics 2021, 10, 50. [Google Scholar] [CrossRef]
  16. Costantine, J.; Tawk, Y.; Moth, S.; Christodoulou, C.G.; Barbin, S.E. A modified helical shaped deployable antenna for cubesats. In Proceedings of the 2012 IEEE-APS Topical Conference on Antennas and Propagation in Wireless Communications (APWC), Cape Town, South Africa, 2–7 September 2012; pp. 1114–1116. [Google Scholar] [CrossRef]
  17. Costantine, J.; Tran, D.; Shiva, M.; Tawk, Y.; Christodoulou, C.G.; Barbin, S.E. A deployable quadrifilar helix antenna for CubeSat. In Proceedings of the 2012 IEEE International Symposium on Antennas and Propagation, Chicago, IL, USA, 8–14 July 2012; pp. 1–2. [Google Scholar]
  18. Balanis, C.A. Antenna Theory Analysis and Design, 4th ed.; John Wiley & Sons: Hoboken, NJ, USA, 2016. [Google Scholar]
  19. Liu, A.; Lu, J. A UHF Deployable Log Periodic Dipole Antenna: Concept, Design, and Experiment. IEEE Trans. Antennas Propag. 2021, 69, 538–543. [Google Scholar] [CrossRef]
  20. Olson, G.; Pellegrino, S.; Costantine, J.; Banik, J. Structural Architectures for a Deployable Wideband UHF Antenna. In Proceedings of the 53rd AIAA/ASME/ASCE/AHS/ASC Structures, Structural Dynamics and Materials Conference 20th AIAA/ASME/AHS Adaptive Structures Conference 14th AIAA, Honolulu, HI, USA, 23–26 April 2012. [Google Scholar]
  21. Costantine, J.; Tawk, Y.; Ernest, A.; Christodoulou, C.G. Deployable antennas for CubeSat and space communications. In Proceedings of the 2012 6th European Conference on Antennas and Propagation (EUCAP), Prague, Czech Republic, 26–30 March 2012; pp. 837–840. [Google Scholar] [CrossRef]
  22. Williams, L.R.; Hoel, K.V.; Bråten, L.E.; Sagsveen, B. Design and Test of a UHF Deployable Conical Log Spiral Antenna for Small Satellites. In Proceedings of the 18th European Conference on Antennas and Propagation (EuCAP), Glasgow, UK, 17–22 March 2024; pp. 1–5. [Google Scholar]
  23. Ernest, A.J.; Tawk, Y.; Costantine, J.; Christodoulou, C.G. A Bottom Fed Deployable Conical Log Spiral Antenna Design for CubeSat. IEEE Trans. Antennas Propag. 2015, 63, 41–47. [Google Scholar] [CrossRef]
  24. Ernest, A.; Tawk, Y.; Christodoulou, C.G.; Costantine, J. A deployable conical log-spiral antenna design for CubeSat applications. In Proceedings of the 2012 IEEE International Symposium on Antennas and Propagation, Chicago, IL, USA, 8–14 July 2012; pp. 1–2. [Google Scholar]
  25. Costantine, J.; Tawk, Y.; Maqueda, I.; Sakovsky, M.; Olson, G.; Pellegrino, S.; Christodoulou, C.G. UHF Deployable Helical Antennas for CubeSats. IEEE Trans. Antennas Propag. 2016, 64, 3752–3759. [Google Scholar] [CrossRef]
  26. Costantine, J.; Tawk, Y.; Christodoulou, C.G.; Maqueda, I.; Sakovsky, M.; Pellegrino, S. A new UHF deployable antenna for cubeSats. In Proceedings of the 2015 IEEE International Symposium on Antennas and Propagation & USNC/URSI National Radio Science Meeting, Vancouver, BC, Canada, 19–25 July 2015; pp. 1426–1427. [Google Scholar]
  27. Yang, Y.H.; Guo, J.L.; Sun, B.H.; Huang, Y.H. Dual-Band Slot Helix Antenna for Global Positioning Satellite Applications. IEEE Trans. Antennas Propag. 2016, 64, 5146–5152. [Google Scholar] [CrossRef]
  28. Rabemanantsoa, J.; Sharaiha, A. Size Reduced Multi-Band Printed Quadrifilar Helical Antenna. IEEE Trans. Antennas Propag. 2011, 59, 3138–3143. [Google Scholar] [CrossRef]
  29. Byun, G.; Choo, H.; Kim, S. Design of a Dual-Band Quadrifilar Helix Antenna Using Stepped-Width Arms. IEEE Trans. Antennas Propag. 2015, 63, 1858–1862. [Google Scholar] [CrossRef]
  30. Yao, Y.; Liao, S.; Wang, J.; Xue, K.; Balfour, E.A.; Luo, Y. A New Patch Antenna Designed for CubeSat: Dual feed, LS dual-band stacked, and circularly polarized. IEEE Antennas Propag. Mag. 2016, 58, 16–21. [Google Scholar] [CrossRef]
  31. Sun, Y.; Liao, S.; Zhang, W.; Che, W.; Xue, Q. UHF Compact Dual-Band Circularly Polarized Antenna Loaded with Split-Ring Resonators for Satellite Communications. In Proceedings of the 2020 IEEE MTT-S International Wireless Symposium (IWS), Shanghai, China, 20–23 September 2020; pp. 1–3. [Google Scholar] [CrossRef]
  32. Charles, R.A. Design, Construction and Testing of the Deployable UHF Antenna for Skynet 4 Stage 2. In IUTAM-IASS Symposium on Deployable Structures: Theory and Applications; Pellegrino, S., Guest, S.D., Eds.; Springer: Dordrecht, The Netherlands, 2000; pp. 77–86. [Google Scholar]
  33. Wang, H.j.; Fan, B.; Yi, M.; Guan, F.L.; Liu, G.; Chen, X.; Xu, Y.; Huang, J.; Cai, M.; Liu, S. Inflatable Antenna for Space-Borne Microwave Remote Sensing. IEEE Antennas Propag. Mag. 2012, 54, 58–67. [Google Scholar] [CrossRef]
  34. Tserpes, K.; Sioutis, I. Advances in Composite Materials for Space Applications: A Comprehensive Literature Review. Aerospace 2025, 12, 215. [Google Scholar] [CrossRef]
  35. Patil, A.S.; Arnold, E.J. Characterizing Carbon Fiber Conductivity for Structural Antenna Applications. IEEE Trans. Antennas Propag. 2022, 70, 451–458. [Google Scholar] [CrossRef]
  36. Williams, L.R.; Hoel, K.V.; Bråten, L.E.; Romeijer, A.; Hjermann, N.; Sagsveen, B. A Deployable Conical Log Spiral Antenna for Small Spacecraft: Electronic Design and Test. Aerospace 2025, 12, 218. [Google Scholar] [CrossRef]
  37. Pelton, J.N.; Madry, S. (Eds.) Handbook of Small Satellites: Technology, Design, Manufacture, Applications, Economics and Regulation; Springer International Publishing: Cham, Switzerland, 2020. [Google Scholar]
  38. ECSS. Thermal Testing for the Evaluation of Space Materials, Processes, Mechanical Parts and Assemblies; European Coorporation for Space Standardization: Noordwijk, The Netherlands, 2008. [Google Scholar]
  39. Rideshare Payload User’s Guide. SpaceX Rideshare Program Documentation. 2024. Available online: https://www.spacex.com/rideshare/ (accessed on 11 December 2024).
  40. Wertz, J.; Everett, D.; Puschell, J. Space Mission Engineering: The New SMAD; Space Technology Library, Microcosm Press: Portland, OR, USA, 2011. [Google Scholar]
  41. Dyson, J. The characteristics and design of the conical log-spiral antenna. IEEE Trans. Antennas Propag. 1965, 13, 488–499. [Google Scholar] [CrossRef]
  42. Dyson, J.D. The unidirectional equiangular spiral antenna. IRE Trans. Antennas Propag. 1959, 7, 329–334. [Google Scholar] [CrossRef]
  43. Dyson, J.D. A survey of the very wide band and frequency independent antennas-1945 to the present. J. Res. Natl. Bur. Stand. Sect. D Radio Propag. 1962, 66D, 1. [Google Scholar] [CrossRef]
  44. Dyson, J.; Mayes, P. New circular-polarized frequency-independent antennas with conical beam or omnidirectional patterns. IRE Trans. Antennas Propag. 1961, 9, 334–342. [Google Scholar] [CrossRef]
  45. Stephen, C.; Selvam, R.; Suranjan, S. A Comparative Study of Steel and Composite Helical Springs Using Finite Element Analysis. In Proceedings of the 2019 Advances in Science and Engineering Technology International Conferences (ASET), Dubai, United Arab Emirates, 26 March–10 April 2019; pp. 1–6. [Google Scholar]
  46. Wu, L.; Chen, L.; Fu, H.; Jiang, Q.; Wu, X.; Tang, Y. Carbon fiber composite multistrand helical springs with adjustable spring constant: Design and mechanism studies. J. Mater. Res. Technol. 2020, 9, 5067–5076. [Google Scholar] [CrossRef]
  47. Russell-Stevens, M.; Todd, R.; Papakyriacou, M. The effect of thermal cycling on the properties of a carbon fibre reinforced magnesium composite. Mater. Sci. Eng. A 2005, 397, 249–256. [Google Scholar] [CrossRef]
  48. Luger, M.; Traxl, R.; Hofer, U.; Hirzinger, B.; Lackner, R. RUC-based multi-scale model for braid-reinforced polymers: Application to coil springs. Compos. Part B Eng. 2018, 155, 431–443. [Google Scholar] [CrossRef]
  49. Singer, G.; Sinn, G.; Lichtenegger, H.C.; Veigel, S.; Zecchini, M.; Wan-Wendner, R. Evaluation of in-situ shrinkage and expansion properties of polymer composite materials for adhesive anchor systems by a novel approach based on digital image correlation. Polym. Test. 2019, 79, 106035. [Google Scholar] [CrossRef]
  50. Muliana, A.H. Spatial and temporal changes in physical properties of epoxy during curing and their effects on the residual stresses and properties of cured epoxy and composites. Appl. Eng. Sci. 2021, 7, 100061. [Google Scholar] [CrossRef]
  51. Ramos, J.; Pagani, N.; Riccardi, C.; Borrajo, J.; Goyanes, S.; Mondragon, I. Cure kinetics and shrinkage model for epoxy-amine systems. Polymer 2005, 46, 3323–3328. [Google Scholar] [CrossRef]
  52. Michel, M.; Ferrier, E. Effect of curing temperature conditions on glass transition temperature values of epoxy polymer used for wet lay-up applications. Constr. Build. Mater. 2020, 231, 117206. [Google Scholar] [CrossRef]
  53. Sun, Q.; Feng, Y.; Guo, J.; Wang, C. High performance epoxy resin with ultralow coefficient of thermal expansion cured by conformation-switchable multi-functional agent. Chem. Eng. J. 2022, 450, 138295. [Google Scholar] [CrossRef]
  54. Karadeniz, Z.H.; Kumlutas, D. A numerical study on the coefficients of thermal expansion of fiber reinforced composite materials. Compos. Struct. 2007, 78, 1–10. [Google Scholar] [CrossRef]
  55. Chen, L.; Xing, W.; Wu, L.; Chong, J.; Lei, T.; Jiang, Q.; Tang, Y. Understanding multiple parameters affecting static and dynamic performances of composite helical springs. J. Mater. Res. Technol. 2022, 20, 532–550. [Google Scholar] [CrossRef]
  56. Jun, K.; Zhen-yu, W.; Yi-sheng, L.; Zhong, X.; Xu-dong, H. Design method, performance investigation and manufacturing process of composite helical springs: A review. Compos. Struct. 2020, 252, 112747. [Google Scholar]
  57. Zimmermann, J.; Sadeghi, M.; Schroeder, K. Exposure of structural epoxy adhesive to combination of tensile stress and γ-radiation. Int. J. Adhes. Adhes. 2020, 97, 102496. [Google Scholar] [CrossRef]
  58. Yan, M.; Liu, L.; Chen, L.; Li, N.; Jiang, Y.; Xu, Z.; Jing, M.; Hu, Y.; Liu, L.; Zhang, X. Radiation resistance of carbon fiber-reinforced epoxy composites optimized synergistically by carbon nanotubes in interface area/matrix. Compos. Part B Eng. 2019, 172, 447–457. [Google Scholar] [CrossRef]
  59. He, Y.; Suliga, A.; Brinkmeyer, A.; Schenk, M.; Hamerton, I. Atomic oxygen degradation mechanisms of epoxy composites for space applications. Polym. Degrad. Stab. 2019, 166, 108–120. [Google Scholar] [CrossRef]
  60. Franck, A. Viscoelasticity and Dynamic Mechanical Testing; TA Instruments Literature: Melbourne, Australia, 2024. [Google Scholar]
  61. Falchi, A.; Gentile, L.; Minisci, E.; Tirelli, M.; Perugini, P. Launcher Vehicle Aerothermodynamics and Fairing Separation Altitude Effects on Payload Temperature. In Proceedings of the 7th European Conference for Aeronautics and Aerospace Sciences (EUCASS), Madrid, Spain, 1–4 July 2019; pp. 1–16. [Google Scholar]
  62. Williams, L.R.; Hoel, K.V.; Bråten, L.E.; Sagsveen, B. A mechanical and RF performance trade-off for a deployable conical log spiral antenna for spacecrafts. In Proceedings of the 19th European Conference on Antennas and Propagation (EuCAP), Stockholm, Sweden, 30 March–4 April 2025. [Google Scholar]
  63. Liu, K.C.; Maghami, P.; Blaurock, C. Reaction Wheel Disturbance Modeling, Jitter Analysis, and Validation Tests for Solar Dynamics Observatory. In Proceedings of the AIAA Guidance, Navigation, and Control Conference, Honolulu, HI, USA, 18–21 August 2008. NASA Document ID: 20080039248. [Google Scholar]
  64. Madrazo, C. Carbon Fiber Coil Spring Characterization and Manufacturing. Master’s Thesis, University of Nevada, Las Vegas, NY, USA, 2022. [Google Scholar]
  65. Volakis, J.L. Antenna Engineering Handbook, 5th ed.; McGraw-Hill Education: New York, NY, USA, 2019. [Google Scholar]
  66. NASA-HDBK-4006; Low Earth Orbit Spacecraft Charging Design Handbook. National Aeronautics and Space Administration: Washington, DC, USA, 2007.
  67. ASTM E595-15; Standard Test Method for Total Mass Loss and Collected Volatile Condensable Materials from Outgassing in a Vacuum Environment. ASTM International Documentation: Conshohocken, PA, USA, 2021.
  68. Leybold. How Is the Mean Free Path of gAs Molecules Calculated? 2024. Available online: https://www.leybold.com/en-ie/knowledge/vacuum-fundamentals/fundamental-physics-of-vacuum/outgassing-and-the-mean-free-path (accessed on 1 December 2024).
Figure 1. Conical log spiral antenna spring dimensions. Note: the white powder observed is a Bycotest D30A developer used during 3D scanning.
Aerospace 12 00326 g001
Figure 2. Cross-section cut of the spring.
Aerospace 12 00326 g002
Figure 3. Carbon epoxy infusion process.
Aerospace 12 00326 g003
Figure 4. Fiber orientation microscope imaged on a prototype.
Aerospace 12 00326 g004
Figure 5. DMA analysis for SikaBiresin® CR80 with hardener CH80-2.
Aerospace 12 00326 g005
Figure 6. TMA analysis for several configurations.
Aerospace 12 00326 g006
Figure 7. Coordinate system for mass properties. The origin is the blue dot at the apex of the spring in the center of the structure.
Aerospace 12 00326 g007
Figure 8. Measured spring stiffness.
Aerospace 12 00326 g008
Figure 10. Antenna under test in a ACS SU500TC 15 ESS thermal chamber at FFI.
Aerospace 12 00326 g010
Figure 11. Color map showing the geometric difference between antenna 3D scans from before and after thermal cycling.
Aerospace 12 00326 g011
Figure 12. Antenna while compressed onto a base plate and conical seat.
Aerospace 12 00326 g012
Figure 13. Superimposed 3D scans of antenna before and after 200 deployment cycles.
Aerospace 12 00326 g013
Figure 14. Measured antenna’s realized gain before and after 200 compressions.
Aerospace 12 00326 g014
Figure 15. Measured directivity E-plane radiation pattern at 1 GHz before and after 200 compressions.
Aerospace 12 00326 g015
Figure 16. Measured axial ratio before and after 200 compressions at boresight and within ±30° of boresight.
Aerospace 12 00326 g016
Figure 17. Antenna under test in a Löwener thermal vacuum chamber at Kongsberg Defence and Aerospace. Note: we tested two prototypes; the one described in this paper is the antenna at the rear of the chamber.
Aerospace 12 00326 g017
Figure 18. Antenna under test on the vibration table at FFI.
Aerospace 12 00326 g018
Figure 19. Measurement of the antenna impedance through S11 measurement before and after vibration testing.
Aerospace 12 00326 g019
Table 1. Mass properties.
PropertyValueUnit
Mass138g
Volume70,644mm3
Surface area56,604mm2
Center of mass[0, 0, −226.2]mm
I x x = 2,416,457 I x y = −13,974 I x z = −277
Moments of inertia a I y x = −13,974 I y y = 2,428,015 I y z = −70g*mm2
I z x = −277 I z y = −70 I z z = 434,208
a Mass moments of inertia are taken at the center of mass and aligned with the output coordinate system.
Table 2. Natural frequencies of extended spring.
Frequency [Hz]5.511162225.2531.2538.25
Mode axisZXYZXYXYXYXY
Z mode is a vertical displacement and XY mode is a bending mode.
Table 3. Total mass loss due to outgassing.
Initial MassMass After OutgassingPercentage Loss
First cycle138.777 g138.278 g0.36%
Second cycle138.278 g138.241 g0.03%
First cycle of 72 h, second cycle of 78 h.
Table 4. Vibration test sequence.
TestFrequencyLevelSweep Rate
LLSS0–2000 Hz0.5 g2 oct/min
Sine5 Hz1.875 g4 oct/min
100 Hz1.875 g4 oct/min
LLSS0–2000 Hz0.5 g2 oct/min
Random20 Hz0.02 g2/Hz
50 Hz0.03 g2/Hz
700 Hz0.03 g2/Hz
800 Hz0.06 g2/Hz
925 Hz0.06 g2/Hz
2000 Hz0.01288 g2/Hz
GRMS = 7.87 g1 min
LLSS0–2000 Hz0.5 g2 oct/min
Test sequence conducted in all 3 axes. 1 g = 9.81 m/s2.
Table 5. Vibration test results.
Axis and TestMain ModeAmplitudeQ Factor
X, first LLSS460 Hz1.37 g2.8
X, final LLSS478 Hz1.78 g4
% shift3.91%29.93%
Y, first LLSS388 Hz2.17 g5.9
Y, final LLSS390 Hz2.18 g5.9
% shift0.51%0.46%
Z, first LLSS255 Hz6.47 g8.9
Z, final LLSS251 Hz4.36 g6.6
% shift1.57%32.61%
Amplitude is mass-normalized for acceleration, as is standard practice.
Disclaimer/Publisher’s Note: The statements, opinions and data contained in all publications are solely those of the individual author(s) and contributor(s) and not of MDPI and/or the editor(s). MDPI and/or the editor(s) disclaim responsibility for any injury to people or property resulting from any ideas, methods, instructions or products referred to in the content.

