

Imitating the Robots: Measuring Memory Flexibility with Monolingual and Bilingual Preschoolers
 ,
,
Abstract
:1. Introduction
1.1. Memory Flexibility and Bilingualism
1.2. The Present Study
2. Materials and Methods
2.1. Participants
2.2. Materials
2.2.1. NIH Toolbox Picture Vocabulary Test
2.2.2. Bilingualism Measure
Binary Language Group Classification (Bilingual = L2 ≥ 20%)
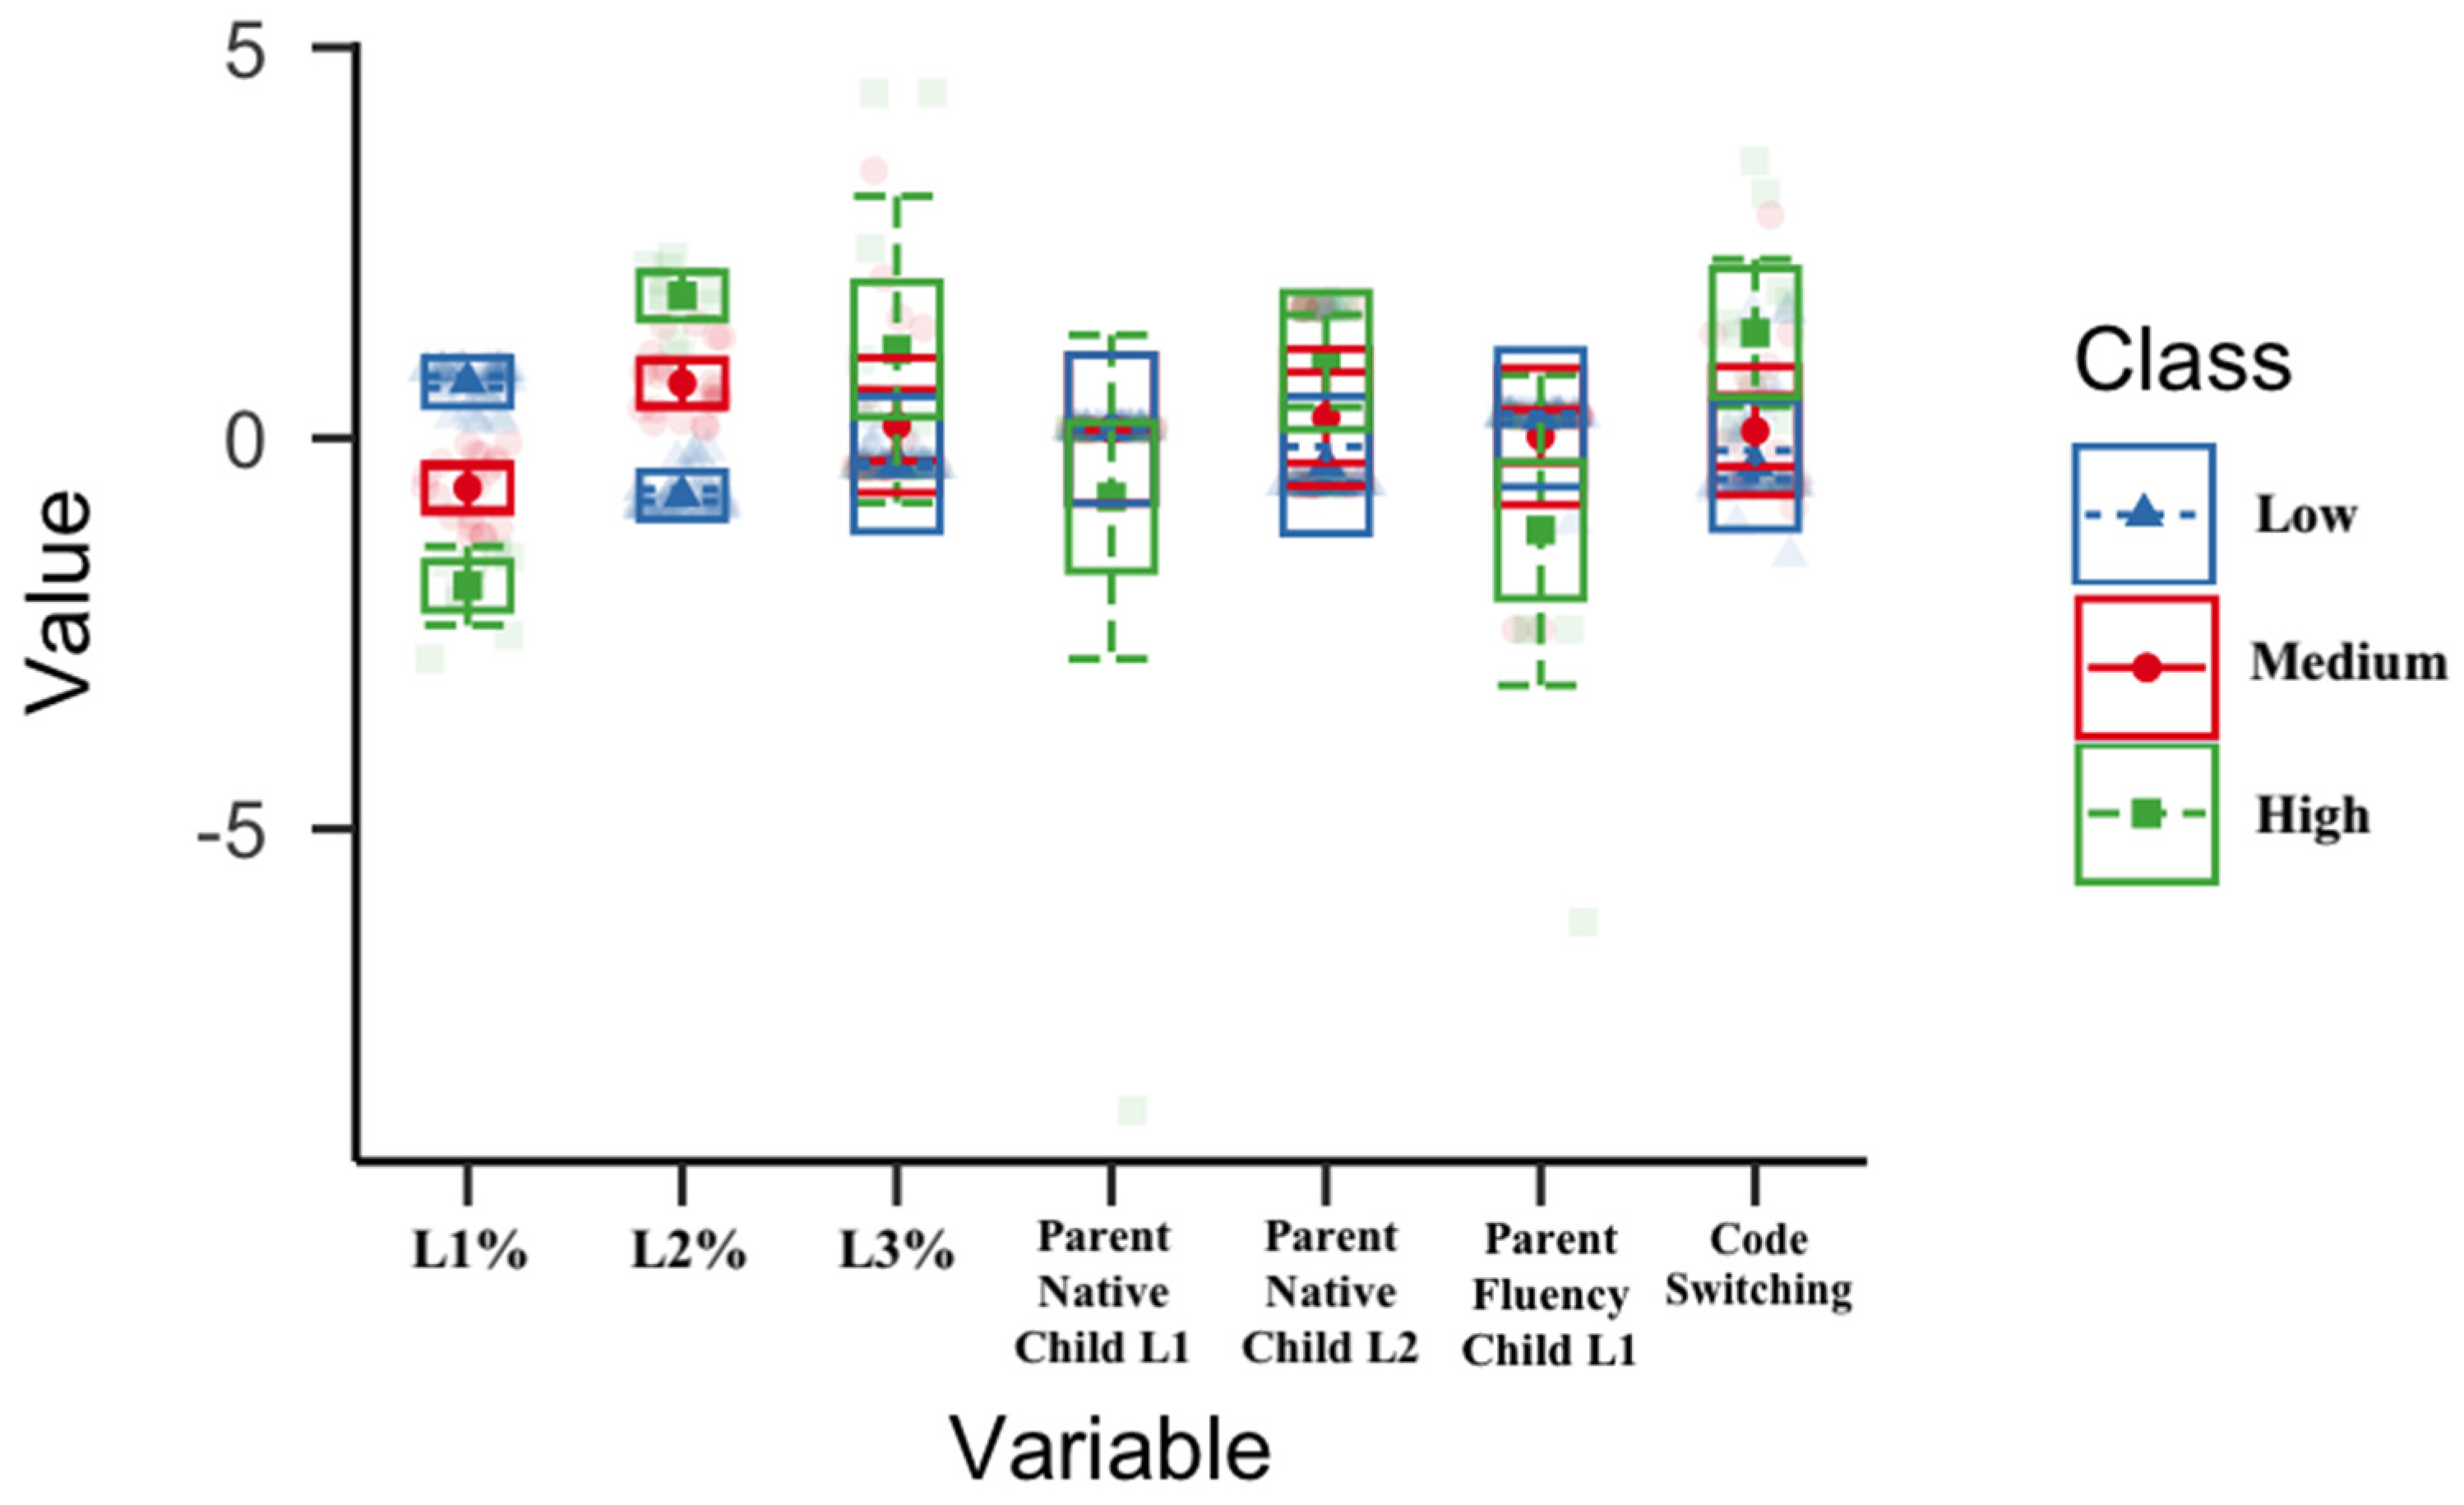
Group Classification by Latent Profile Analysis
Second Language Exposure (L2%)
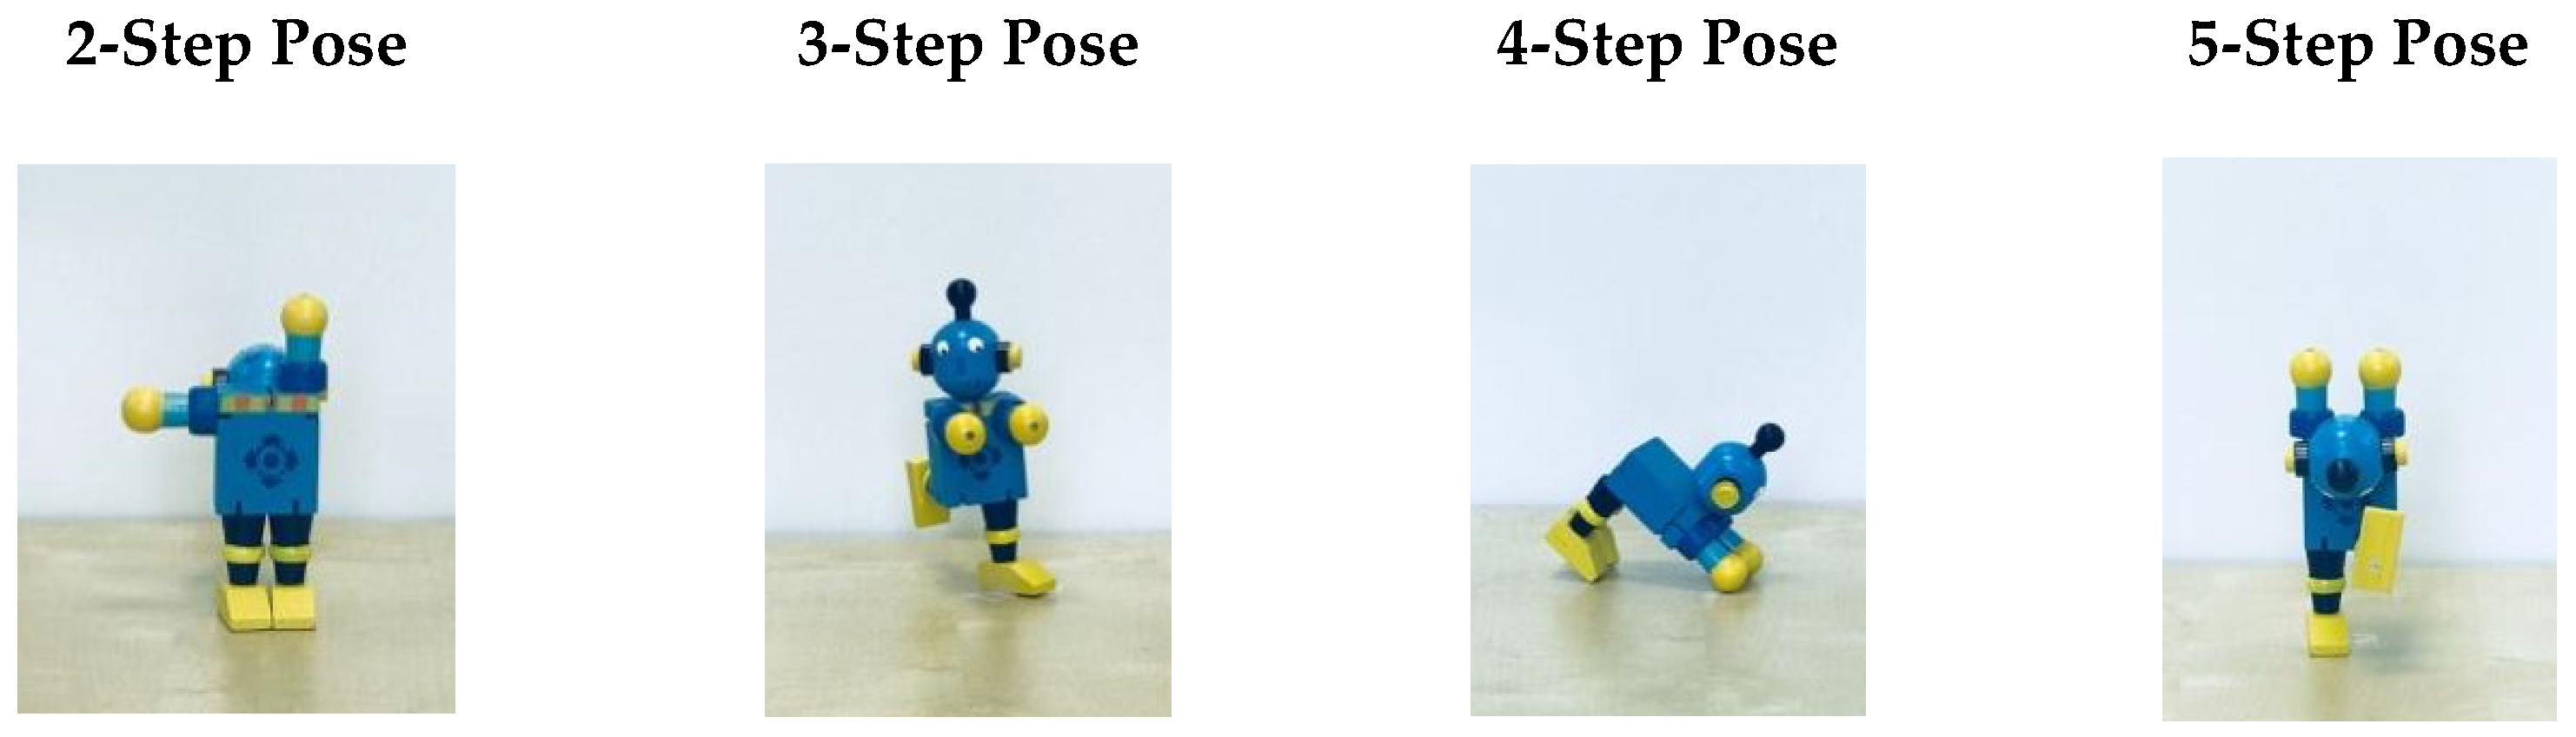
2.2.3. Stimuli
2.3. Design and Procedure
2.3.1. Baseline Phase
2.3.2. Training Phase
2.3.3. Demonstration Phase
2.3.4. Test Phase
2.3.5. Manipulation Check
2.4. Coding and Dependent Variables
2.4.1. Total Correct Movements Score
2.4.2. Pair Score
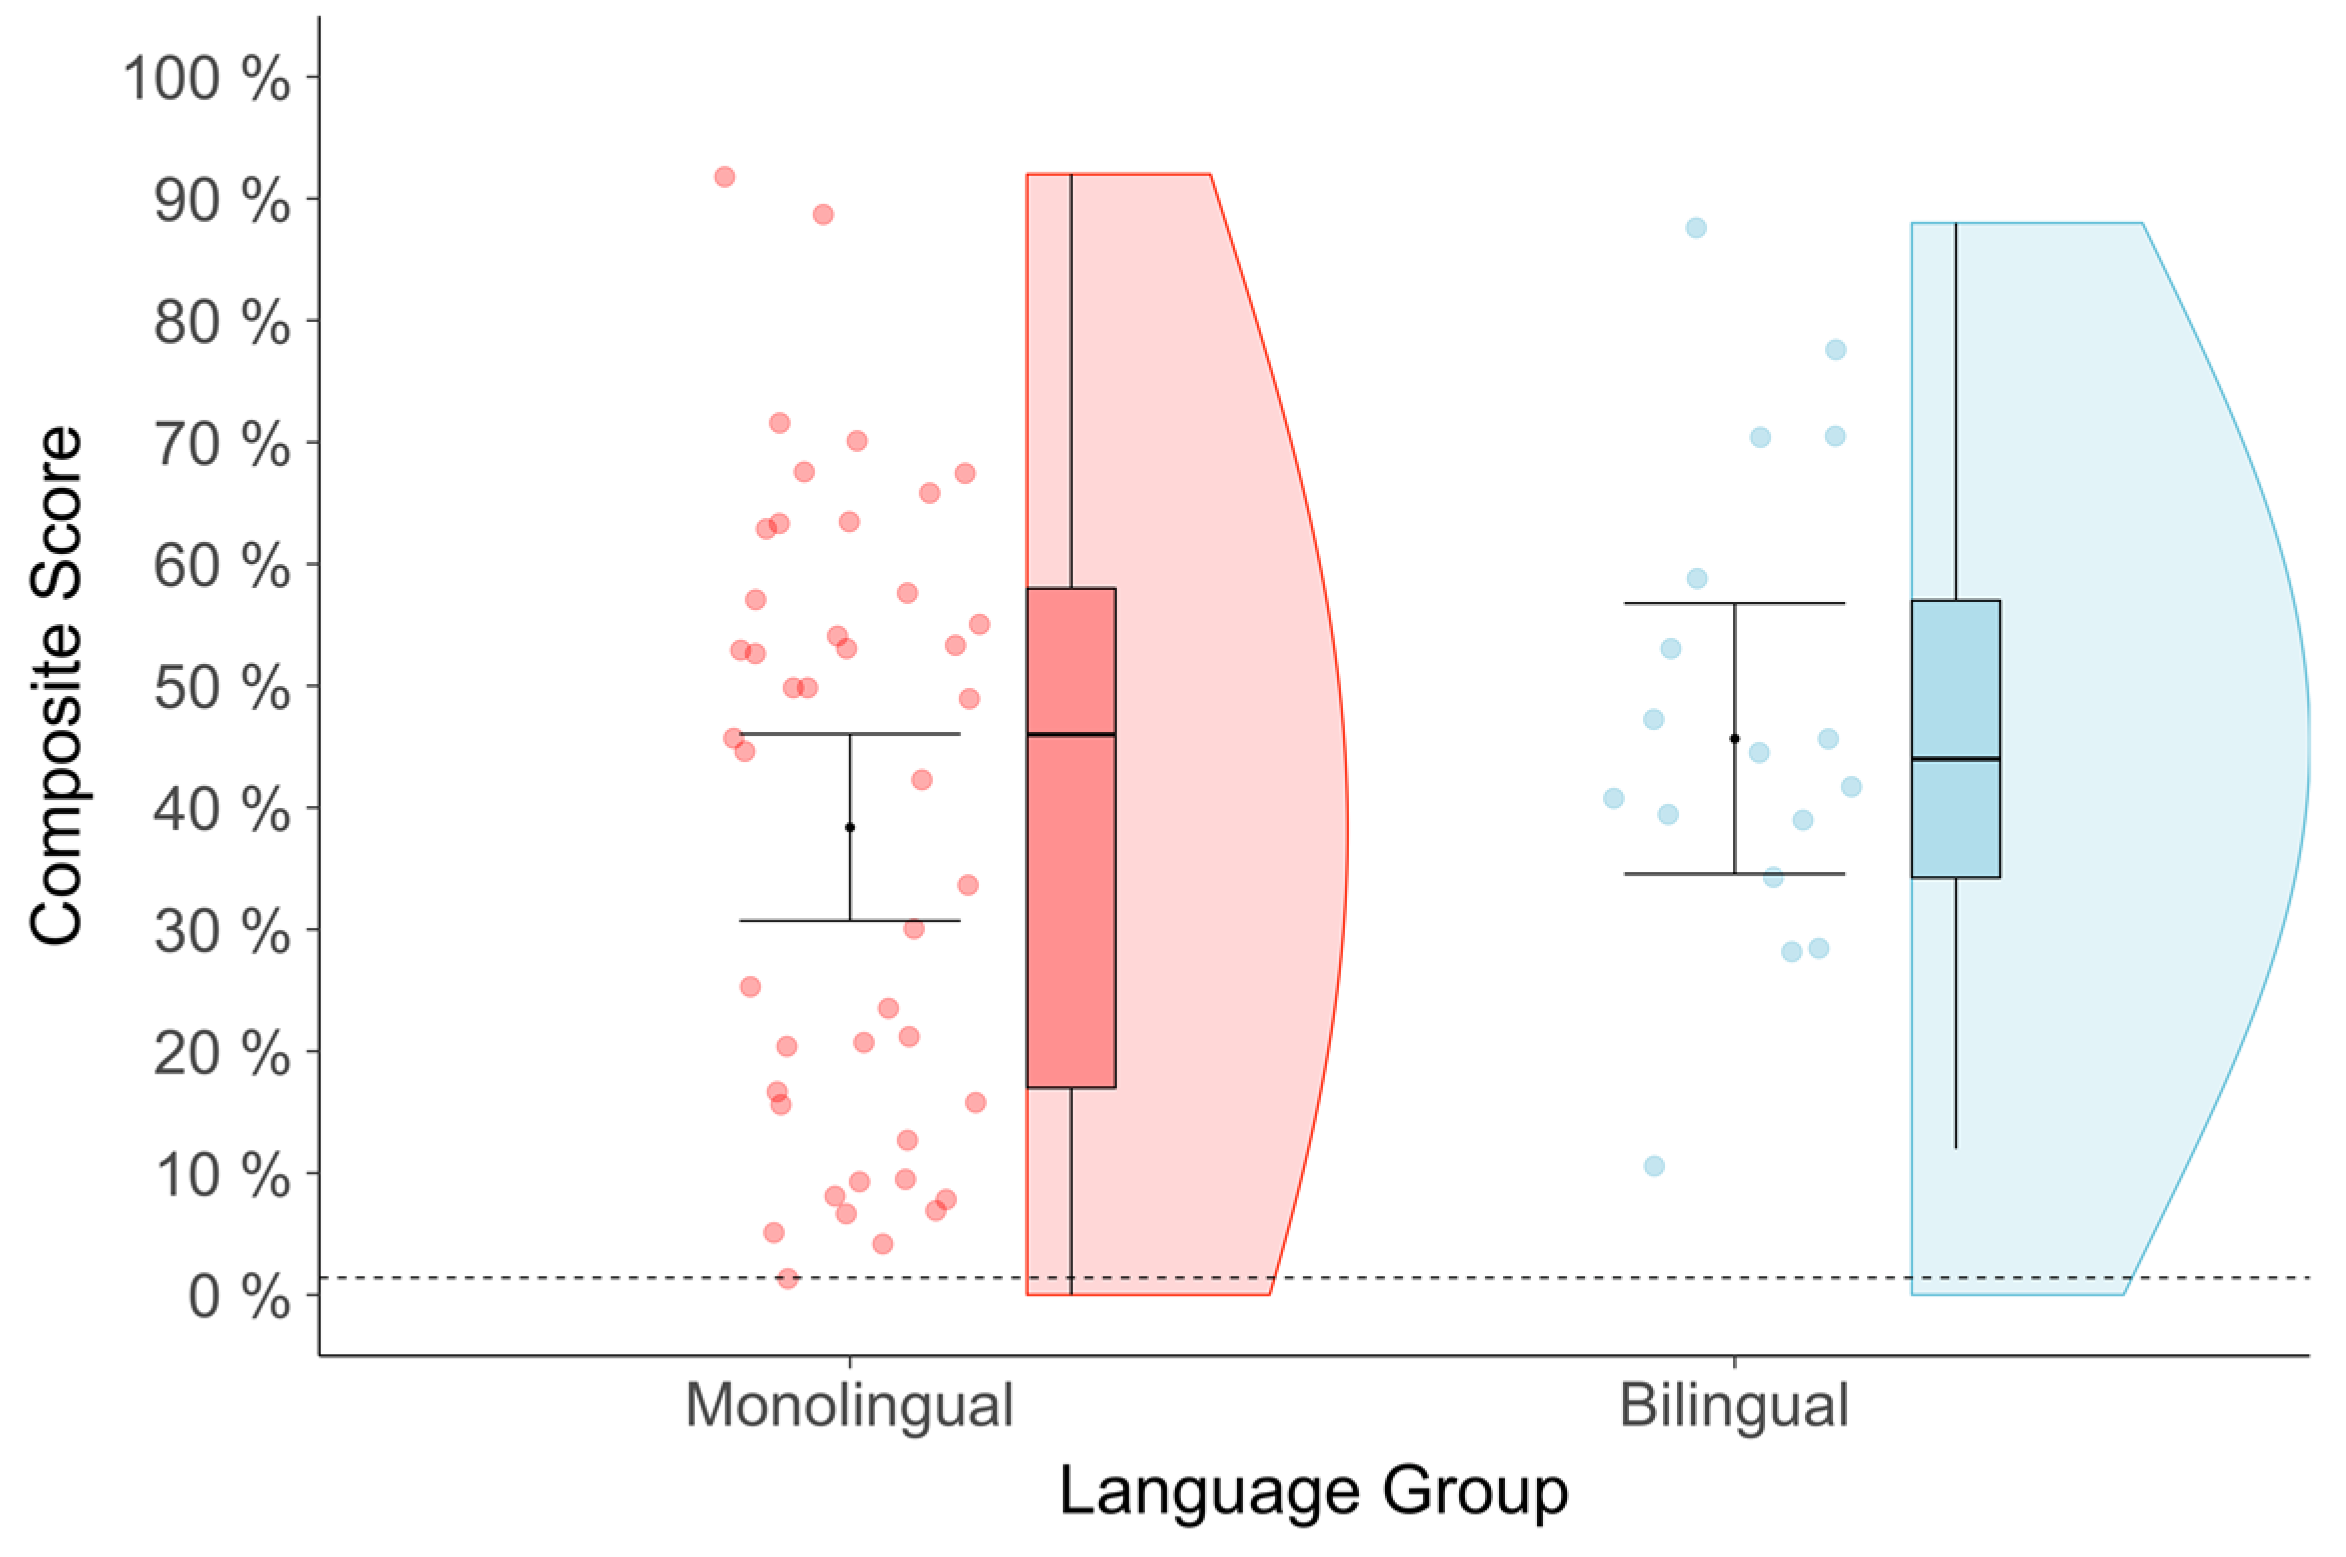
2.4.3. Composite Percentage Score
2.4.4. Baseline Composite Percentage Score
2.5. Latent Profile Analysis (LPA) Plan
2.6. Analysis Plan
- Model 1: Binary Language Group Classification (Bilingual = L2 ≥ 20%)
- Model 2: Group Classification by Latent Profile Analysis
- Model 3: Second Language Exposure (L2%)
- Model 1: Binary Language Group Classification (Bilingual = L2 ≥ 20%)
- Model 2: Group Classification by Latent Profile Analysis
- Model 3: Second Language Exposure (L2%)
3. Results
3.1. Inter-Coder Reliability
3.2. Vocabulary Analysis
3.3. Imitation
3.4. Analysis Approach 1: Linear Regression Analysis
3.4.1. Binary Language Group Classification (Bilingual = L2 ≥ 20%)
3.4.2. Model 2. Group Classification by Latent Profile Analysis
3.4.3. Model 3. Second Language Exposure (L2%)
3.5. Analysis Approach 2: Multi-Level Modeling for Trial-by-Trial Performance
3.5.1. Model 1. Binary Language Group Classification (Bilingual = L2 ≥ 20%)
3.5.2. Model 2. Group Classification by Latent Profile Analysis
3.5.3. Model 3. Second Language Exposure (L2%)
3.6. Exploratory Analysis
4. Discussion
5. Conclusions
Supplementary Materials
Author Contributions
Funding
Institutional Review Board Statement
Informed Consent Statement
Data Availability Statement
Acknowledgments
Conflicts of Interest
References
- Adi-Japha, Esther, Jennie Berberich-Artzi, and Afaf Libnawi. 2010. Cognitive flexibility in drawings of bilingual children. Child Development 81: 1356–66. [Google Scholar] [CrossRef] [PubMed]
- Akogul, Serkan, and Murat Erisoglu. 2017. An approach for determining the number of clusters in a model-based cluster analysis. Entropy 19: 452. [Google Scholar] [CrossRef] [Green Version]
- Baddeley, Alan D., and Graham Hitch. 1974. Working memory. In The Psychology of Learning and Motivation: Advances in Research and Theory. Edited by Gordon H. Bower. New York: Academic Press, vol. 8, pp. 47–89. [Google Scholar]
- Barac, Raluca, Ellen Bialystok, Dina C. Castro, and Marta Sanchez. 2014. The Cognitive Development of Young Dual Language Learners: A Critical Review. Early Childhood Research Quarterly 29: 699–714. [Google Scholar] [CrossRef] [PubMed] [Green Version]
- Barr, Rachel, and Natalie Brito. 2014. From specificity to flexibility: Early developmental changes in memory generalization. In The Wiley Handbook on the Development of Children’s Memory. Edited by Patricia J. Bauer and Robyn Fivush. Chichester: John Wiley and Sons, pp. 453–79. [Google Scholar]
- Barr, Rachel, and Harlene Hayne. 2000. Age-related changes in imitation: Implications for memory development. In Progress in Infancy Research. Edited by Carolyn Rovee-Collier, Lewis P. Lipsitt and Harlene Hayne. Mahwah: Erlbaum, vol. 1, pp. 21–67. [Google Scholar]
- Barr, Rachel, Anne Dowden, and Harlene Hayne. 1996. Developmental changes in deferred imitation by 6-to 24-month-old infants. Infant Behavior and Development 19: 159–70. [Google Scholar] [CrossRef]
- Barr, Rachel, Alecia Moser, Sylvia Rusnak, Laura Zimmermann, Kelly Dickerson, Herietta Lee, and Peter Gerhardstein. 2016. The impact of memory load and perceptual cues on puzzle learning by 2-year-olds. Developmental Psychobiology 58: 817–28. [Google Scholar] [CrossRef] [PubMed]
- Barr, Rachel, Sylvia N. Rusnak, Natalie H. Brito, and Courtney Nugent. 2019. Actions speak louder than words: Differences in memory flexibility between monolingual and bilingual 18-month-olds. Developmental Science 23: e12881. [Google Scholar] [CrossRef]
- Beaudin, Kayla, and Diane Poulin-Dubois. 2022. Testing the Bilingual Cognitive Advantage in Toddlers Using the Early Executive Functions Questionnaire. Languages 7: 122. [Google Scholar] [CrossRef]
- Bialystok, Ellen, and Michelle M. Martin. 2004. Attention and inhibition in bilingual children: Evidence from the dimensional change card sort task. Developmental Science 7: 325–39. [Google Scholar] [CrossRef]
- Bialystok, Ellen, and Lili Senman. 2004. Executive processes in appearance–reality tasks: The role of inhibition of attention and symbolic representation. Child Development 75: 562–79. [Google Scholar] [CrossRef]
- Bialystok, Ellen, Fergus I. Craik, and Jennifer Ryan. 2006. Executive control in a modified antisaccade task: Effects of aging and bilingualism. Journal of experimental psychology: Learning, Memory, and Cognition 32: 1341. [Google Scholar] [CrossRef]
- Brito, Natalie H., and Rachel Barr. 2012. Influence of bilingualism on memory generalization during infancy. Developmental Science 15: 812–16. [Google Scholar] [CrossRef] [PubMed]
- Brito, Natalie H., and Rachel Barr. 2014. Flexible memory retrieval in bilingual 6-month-old infants. Developmental Psychobiology 56: 1156–63. [Google Scholar] [CrossRef] [PubMed]
- Brito, Natalie H., Amanda Grenell, and Rachel Barr. 2014. Specificity of the bilingual advantage for memory: Examining cued recall, generalization, and working memory in monolingual, bilingual, and trilingual toddlers. Frontiers in Psychology 5: 1369. [Google Scholar] [CrossRef] [PubMed] [Green Version]
- Brito, Natalie H., Nuria Sebastian-Galles, and Rachel Barr. 2015. Differences in language exposure and its effects on memory generalization in monolingual, bilingual, and trilingual infants. Bilingualism Language and Cognition 18: 670–82. [Google Scholar] [CrossRef] [Green Version]
- Brito, Natalie H., William P. Fifer, Dima Amso, Rachel Barr, Martha Ann Bell, Susan Calkins, Albert Flynn, Hawley E. Montgomery-Downs, Lisa M. Oakes, John E. Richards, and et al. 2019. Beyond the Bayley: Neurocognitive assessments of development during infancy and toddlerhood. Developmental Neuropsychology 44: 220–47. [Google Scholar] [CrossRef] [PubMed] [Green Version]
- Brito, Natalie H., Ashley Greaves, Ana Leon-Santos, William P. Fifer, and Kimberly G. Noble. 2021. Associations between bilingualism and memory generalization during infancy: Does socioeconomic status matter? Bilingualism: Language and Cognition 24: 231–40. [Google Scholar] [CrossRef] [PubMed]
- Carlson, Stephanie M., and Andrew N. Meltzoff. 2008. Bilingual experience and executive functioning in young children. Developmental Science 11: 282–98. [Google Scholar] [CrossRef] [Green Version]
- Costa, Albert, Mireia Hernández, and Núria Sebastián-Gallés. 2008. Bilingualism aids conflict resolution: Evidence from the ANT task. Cognition 106: 59–86. [Google Scholar] [CrossRef]
- DeAnda, Stephanie, Laura Bosch, Diane Poulin-Dubois, Pascal Zesiger, and Margaret Friend. 2016. The Language Exposure Assessment Tool: Quantifying language exposure in infants and children. Journal of Speech Language & Hearing Research 59: 1346–56. [Google Scholar]
- Eichenbaum, Howard. 1997. Declarative memory: Insights from cognitive neurobiology. Annual Review of Psychology 48: 547–72. [Google Scholar] [CrossRef]
- Gershon, C. Richard, Karon F. Cook, Dan Mungas, Jennifer J. Manly, Jerry Slotkin, Jennifer L. Beaumont, and Sandra Weintraub. 2014. Language measures of the NIH toolbox cognition battery. Journal of the International Neuropsychological Society 20: 642–51. [Google Scholar] [CrossRef] [PubMed]
- Gunnerud, Hilde Lowell, Dieuwer Ten Braak, Elin Kirsti Lie Reikerås, Enrica Donolato, and Monica Melby-Lervåg. 2020. Is bilingualism related to a cognitive advantage in children? A systematic review and meta-analysis. Psychological Bulletin 146: 1059. [Google Scholar] [CrossRef] [PubMed]
- Hayne, Harlene. 2006. Age-related changes in infant memory retrieval: Implications for knowledge acquisition. Processes of Brain and Cognitive Development: Attention and Performance XXI: 209–31. [Google Scholar]
- Karmiloff-Smith, Annette. 1994. Précis of beyond modularity: A developmental perspective on cognitive science. Behavioral and Brain Sciences 17: 693–745. [Google Scholar] [CrossRef]
- Kids Count Data Center. 2019. Children Who Speak a Language Other than English at Home in the United States. Available online: https://datacenter.kidscount.org/data/tables/81-children-who-speak-a-language-other-than-english-at-home#detailed/1/any/false/2048,1729,37,871,870,573,869,36,868,867/any/396,397 (accessed on 28 September 2019).
- Landis, J. Richard, and Gary G. Koch. 1977. The measurement of observer agreement for categorical data. Biometrics 33: 159–74. [Google Scholar] [CrossRef] [Green Version]
- Lowe, J. Cassandra, Isu Cho, Samantha F. Goldsmith, and Bruce J. Morton. 2021. The bilingual advantage in children’s executive functioning is not related to language status: A meta-analytic review. Psychological science 32: 1115–46. [Google Scholar] [CrossRef]
- Mahy, Caitlin E. V., and Yuko Munakata. 2015. Transitions in executive function: Insights from developmental parallels between prospective memory and cognitive flexibility. Child Development Perspectives 9: 128–32. [Google Scholar] [CrossRef]
- Meltzoff, Andrew N. 1990. Towards a developmental cognitive science. Annals of the New York Academy of Sciences 608: 1–37. [Google Scholar] [CrossRef]
- Riggins, Tracy, Carol L. Cheatham, Emily Stark, and Patricia J. Bauer. 2013. Elicited imitation performance at 20 months predicts memory abilities in school-aged children. Journal of Cognition and Development 14: 593–606. [Google Scholar] [CrossRef] [Green Version]
- Rocha-Hidalgo, Joscelin, and Rachel Barr. 2022. Defining Bilingualism during Infancy and Toddlerhood: A Scoping Review. International Journal of Bilingualism. [Google Scholar] [CrossRef]
- Rocha-Hidalgo, Joscelin, Mary Feller, Olivia A. Blanchfield, Sarah C. Kucker, and Rachel F. Barr. 2021. Patterns of mutual exclusivity and retention: A study of monolingual and bilingual 2-year-olds. Infancy 26: 1011–36. [Google Scholar] [CrossRef] [PubMed]
- Rocha-Hidalgo, Joscelin, Meghana Malyala, Brianna Miller, Kate Freda, Olivia A. Blanchfield, Natalie H. Brito, and Rachel Barr. forthcoming. How language environments and vocabulary change longitudinally: An Examination of the language assessment tool at 18, 24, and 36 Months. in prep.
- Rose, Susan A., Judith F. Feldman, and Jeffery J. Jankowski. 2005. Recall memory in the first three years of life: A longitudinal study of preterm and term children. Developmental Medicine & Child Neurology 47: 653–59. [Google Scholar]
- Rusnak, Sylvia N., Joscelin Rocha-Hidalgo, Olivia A. Blanchfield, Mackenzie Odier, Tuleen Sawaf, and Rachel Barr. 2022. The development of the object sequencing imitation task to measure working memory in preschoolers. Journal of Experimental Child Psychology 218: 105372. [Google Scholar] [CrossRef] [PubMed]
- Strid, Karin, Tomas Tjus, Lars Smith, Andrew N. Meltzoff, and Mikael Heimann. 2006. Infant recall memory and communication predicts later cognitive development. Infant Behavior and Development 29: 545–53. [Google Scholar] [CrossRef] [Green Version]
- Williamson, Rebecca A., Vikram K. Jaswal, and Andrew N. Meltzoff. 2010. Learning the rules: Observation and imitation of a sorting strategy by 36-month-old children. Developmental Psychology 46: 57–65. [Google Scholar] [CrossRef]


| Pose | Sequence of Target Actions | Test Length (Min-Max) | Max Score |
|---|---|---|---|
| 2-step | 1. Head back 2. Left-arm up | 20–30 s | 2 target actions + 1 pair = 3 |
| 3-step | 1. Right arm forward 2. Left-arm forward 3. Right-leg back | 30–40 s | 3 target actions + 2 pairs = 5 |
| 4-step | 1. Left-leg forward 2. Head forward 3. Left-arm up 4. Right-arm up | 40–50 s | 4 target actions + 3 pairs = 7 |
| 5-step | 1. Head back 2. Right-arm up 3. Left-arm up 4. Left-leg forward 5. Right-leg forward | 50–60 s | 5 target actions + 4 pairs = 9 |
| Variables | M | SD | Min | Max | Statistic | ||
|---|---|---|---|---|---|---|---|
| Sample from Approach 1 | Binary | Monolingual | 45.21 | 23.83 | 1 | 91 | t(29.91) = 0.65, p = 0.52 |
| Bilingual | 37.54 | 23.48 | 2 | 78 | |||
| Profiles | Low | 46.85 | 22.88 | 6 | 91 | F(2, 60) = 0.752, p = 0.476 | |
| Medium | 39.20 | 24.91 | 2 | 78 | |||
| High | 39.89 | 21.97 | 6 | 78 | |||
| Continuous | PVT Percentile | 44.03 | 23.16 | 2 | 91 | r(61) = −0.107, p = 0.401 | |
| L2% | 12.61 | 14.19 | 0 | 45.50 | |||
| Sample from Approach 2 | Binary | Monolingual | 45.21 | 23.83 | 1 | 91 | t(44.19) = 1.33, p = 0.19 |
| Bilingual | 37.54 | 23.48 | 2 | 78 | |||
| Profiles | Low | 46.06 | 22.85 | 6 | 91 | F(2, 77) = 1.556, p = 0.217 | |
| Medium | 41.90 | 26.54 | 1 | 78 | |||
| High | 33.08 | 21.92 | 2 | 78 | |||
| Continuous | PVT Percentile | 42.91 | 23.84 | 1 | 91 | r(78) = −0.156, p = 0.168 | |
| L2% | 13.34 | 14.66 | 0 | 45.5 |
| Full Model Estimate (SE) | Final Model Estimate (SE) | |
|---|---|---|
| (Intercept) | 33.366 ** | 33.400 *** |
| (9.773) | (8.599) | |
| Language Group (Monolingual vs. Bilingual) | −2.699 | −4.035 |
| (8.046) | (7.196) | |
| L3% exposure | 0.955 | 0.847 |
| (0.810) | (0.784) | |
| Child’s Age in Months (Centered) | 1.921 | 1.966 |
| (1.320) | (1.277) | |
| PVT Percentile (Vocabulary) | 0.197 | 0.204 |
| (0.138) | (0.135) | |
| Child’s Sex (Male = 0; Female = 1) | −1.754 | |
| (7.003) | ||
| Avg. Parental Education (Centered) | −2.320 | |
| (2.776) | ||
| Income (Centered) | −6.384 × 10⁻⁵ | |
| (1.192 × 10⁻⁴) | ||
| Num. Obs. | 63 | 63 |
| R2 | 0.130 | 0.115 |
| R2 Adj. | 0.019 | 0.054 |
| AIC | 591.1 | 586.2 |
| BIC | 610.4 | 599.0 |
| Log. Lik. | −286.553 | −287.087 |
| F | 1.169 | 1.878 |
| RMSE | 24.47 | 24.03 |
| Full Model Estimate (SE) | Final Model Estimate (SE) | |
|---|---|---|
| (Intercept) | 27.305 ** | 26.111 ** |
| (8.246) | (7.570) | |
| Multilingual Exposure Profiles | 11.807 | 11.402 |
| (Low vs. Medium) | (8.014) | (7.744) |
| Multilingual Exposure Profiles | 3.847 | 4.776 |
| (Low vs. High) | (11.210) | (10.534) |
| L3% Exposure | 0.829 | 0.719 |
| (0.897) | (0.871) | |
| Child’s Age in Months (Centered) | 1.511 | 1.611 |
| (1.333) | (1.293) | |
| PVT Percentile (Vocabulary) | 0.226 | 0.230 + |
| (0.138) | (0.135) | |
| Child’s Sex (Male = 0; Female = 1) | −2.607 | |
| (6.914) | ||
| Avg. Parental Education (Centered) | −2.730 | |
| (2.764) | ||
| Income (Centered) | −6.344 × 10⁻⁵ | |
| (1.127 × 10⁻⁴) | ||
| Num. Obs. | 63 | 63 |
| R2 | 0.162 | 0.142 |
| R2 Adj. | 0.038 | 0.067 |
| AIC | 590.7 | 586.2 |
| BIC | 612.1 | 601.2 |
| Log. Lik. | −285.353 | −286.080 |
| F | 1.305 | 1.894 |
| RMSE | 24.23 | 23.86 |
| Full Model Estimate (SE) | Final Model Estimate (SE) | |
|---|---|---|
| (Intercept) | 29.844 *** | 28.656 *** |
| (8.292) | (7.503) | |
| L2% Exposure | 0.131 | 0.155 |
| (0.253) | (0.237) | |
| L3% Exposure | 0.878 | 0.782 |
| (0.828) | (0.805) | |
| Child’s Age in Months (Centered) | 1.891 | 1.960 |
| (1.315) | (1.273) | |
| PVT Percentile (Vocabulary) | 0.200 | 0.206 |
| (0.138) | (0.135) | |
| Child’s Sex (Male = 0; Female = 1) | −1.774 | |
| (6.932) | ||
| Avg. Parental Education(Centered) | −2.383 | |
| (2.776) | ||
| Income (Centered) | −0.0000626 | |
| (0.0001139) | ||
| Num. Obs. | 63 | 63 |
| R2 | 0.132 | 0.116 |
| R2 Adj. | 0.022 | 0.055 |
| AIC | 590.9 | 586.0 |
| BIC | 610.2 | 598.9 |
| Log. Lik. | −286.464 | −287.025 |
| F | 1.195 | 1.910 |
| RMSE | 24.43 | 24.01 |
| Full & Final Model Estimate (SE) | |
|---|---|
| (Intercept) | 44.797 *** |
| (8.117) | |
| Language Group (Monolingual vs. Bilingual) | 0.839 |
| (6.796) | |
| L3% Exposure | 0.565 |
| (0.688) | |
| Child’s Sex (Male = 0; Female = 1) | −7.193 |
| (5.819) | |
| Length of Sequence | −3.776 * |
| (1.645) | |
| Avg. Parental Education (Centered) | −2.410 |
| (2.241) | |
| Income (Centered) | −2.206 × 10⁻⁵ |
| (9.998 × 10⁻⁵) | |
| Child’s Age in Months (Centered) | 1.996 |
| (1.220) | |
| PVT Percentile (Vocabulary) | 0.174 |
| (0.120) | |
| SD (Intercept) | 17.744 |
| SD (Observations) | 30.678 |
| Num. Obs. | 290 |
| R2 Marg. | 0.057 |
| R2 Cond. | 0.293 |
| AIC | 2893.4 |
| BIC | 2933.7 |
| RMSE | 28.31 |
| Full Model Estimate (SE) | Final Model Estimate (SE) | |
|---|---|---|
| (Intercept) | 44.112 *** | 41.248 *** |
| (8.319) | (7.889) | |
| Multilingual Exposure Profiles | 3.061 | 2.218 |
| (Low vs. Medium) | (6.724) | (6.776) |
| Multilingual Exposure Profiles | −0.240 | −1.851 |
| (Low vs. High) | (9.566) | (9.240) |
| L3% Exposure | 0.598 | 0.623 |
| (0.756) | (0.765) | |
| Child’s Age in Months (Centered) | 1.932 | 1.904 |
| (1.229) | (1.229) | |
| PVT Percentile (Vocabulary) | 0.174 | 0.171 |
| (0.120) | (0.120) | |
| Length of Sequence | −3.765 * | −3.715 * |
| (1.646) | (1.647) | |
| Child’s Sex (Male = 0; Female = 1) | −7.039 | |
| (5.801) | ||
| Avg. Parental Education (Centered) | −2.442 | |
| (2.244) | ||
| Income (Centered) | −2.910 × 10⁻⁵ | |
| (9.859 × 10⁻⁵) | ||
| SD (Intercept) | 17.654 | 18.081 |
| SD (Observations) | 30.691 | 30.704 |
| Num. Obs. | 290 | 290 |
| R2 Marg. | 0.058 | 0.046 |
| R2 Cond. | 0.292 | 0.292 |
| AIC | 2895.1 | 2891.4 |
| BIC | 2939.2 | 2924.4 |
| RMSE | 28.34 | 28.30 |
| Full Model Estimate (SE) | Final Model Estimate (SE) | |
|---|---|---|
| (Intercept) | 44.821 *** | 41.856 *** |
| (8.413) | (7.949) | |
| L2% Exposure | 0.017 | −0.014 |
| (0.216) | (0.211) | |
| L3% Exposure | 0.573 | 0.562 |
| (0.694) | (0.702) | |
| Length of Sequence | −3.775 * | −3.721* |
| (1.645) | (1.646) | |
| Child’s Age in Months (Centered) | 2.006 | 1.959 |
| (1.221) | (1.219) | |
| PVT Percentile (Vocabulary) | 0.173 | 0.170 |
| (0.120) | (0.120) | |
| Child’s Sex (Male = 0; Female = 1) | −7.123 | |
| (5.774) | ||
| Avg. Parental Education (Centered) | −2.405 | |
| (2.247) | ||
| Income (Centered) | −2.405 × 10⁻⁵ | |
| (9.794 × 10⁻⁵) | ||
| SD (Intercept) | 17.749 | 18.155 |
| SD (Observations) | 30.678 | 30.694 |
| Num. Obs. | 290 | 290 |
| R2 Marg. | 0.057 | 0.045 |
| R2 Cond. | 0.293 | 0.292 |
| AIC | 2893.4 | 2889.6 |
| BIC | 2933.7 | 2919.0 |
| RMSE | 28.31 | 28.28 |
Publisher’s Note: MDPI stays neutral with regard to jurisdictional claims in published maps and institutional affiliations. |
© 2022 by the authors. Licensee MDPI, Basel, Switzerland. This article is an open access article distributed under the terms and conditions of the Creative Commons Attribution (CC BY) license (https://creativecommons.org/licenses/by/4.0/).
Share and Cite
Rocha-Hidalgo, J.; Rusnak, S.N.; Blanchfield, O.A.; Suresh, S.; Tahmassebi, L.; Greenwood, H.; Chanchavac, K.; Barr, R. Imitating the Robots: Measuring Memory Flexibility with Monolingual and Bilingual Preschoolers. Languages 2022, 7, 268. https://doi.org/10.3390/languages7040268
Rocha-Hidalgo J, Rusnak SN, Blanchfield OA, Suresh S, Tahmassebi L, Greenwood H, Chanchavac K, Barr R. Imitating the Robots: Measuring Memory Flexibility with Monolingual and Bilingual Preschoolers. Languages. 2022; 7(4):268. https://doi.org/10.3390/languages7040268
Chicago/Turabian StyleRocha-Hidalgo, Joscelin, Sylvia N. Rusnak, Olivia A. Blanchfield, Sharanya Suresh, Lily Tahmassebi, Hadley Greenwood, Kimberly Chanchavac, and Rachel Barr. 2022. "Imitating the Robots: Measuring Memory Flexibility with Monolingual and Bilingual Preschoolers" Languages 7, no. 4: 268. https://doi.org/10.3390/languages7040268