
The Influence of Multilingual Experience on Executive Function and Structure Learning: Effects in Young Adults in the UK and Singapore

Abstract
:1. Introduction
2. Materials and Methods
2.1. Participants
2.2. Materials and Procedure
2.2.1. Procedure
2.2.2. Background Measures
Demographics
Intelligence3
- Non-Verbal Intelligence (NVIQ)
- Verbal Intelligence (VIQ)
2.2.3. Language Measures
2.2.4. EF and SL Measures
Cognitive Flexibility
- (1)
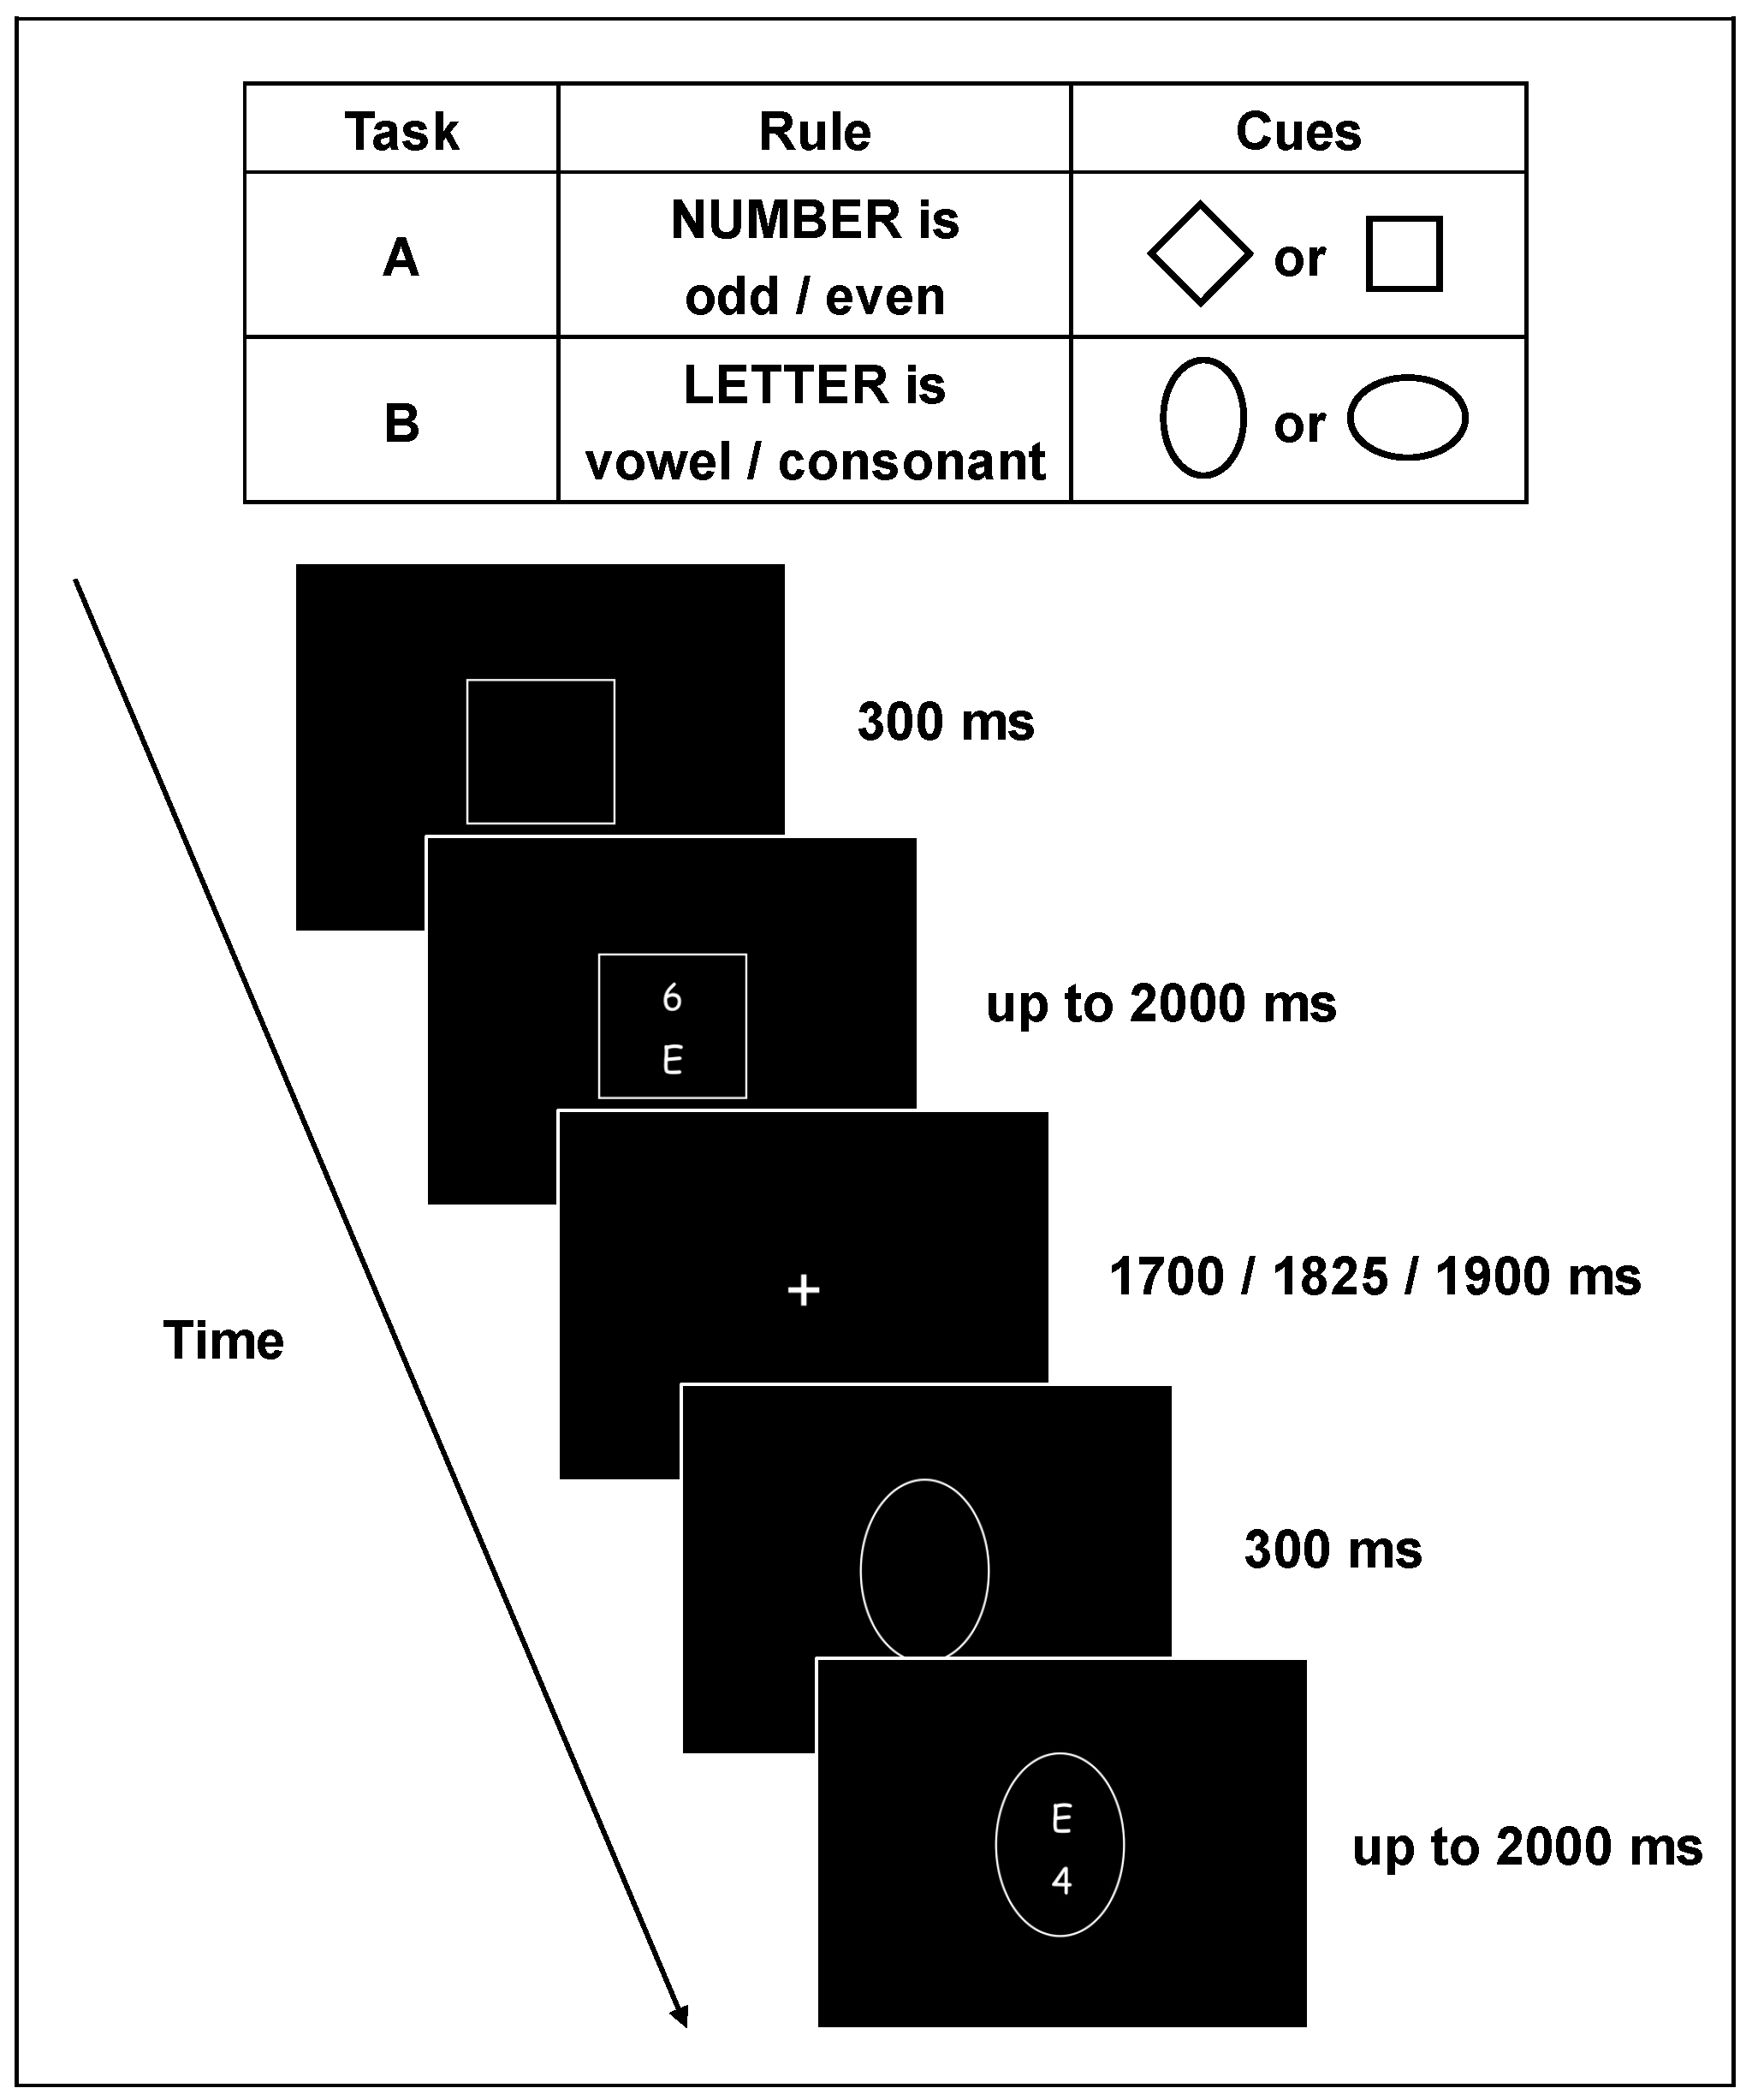
- Task-Set switching (TSS)
- TSS switch Accuracy cost = mean Accuracy in switch trials − mean Accuracy in non-switch trials
- TSS switch RT cost = mean RT in switch trials − mean RT in non-switch trials
- (2)
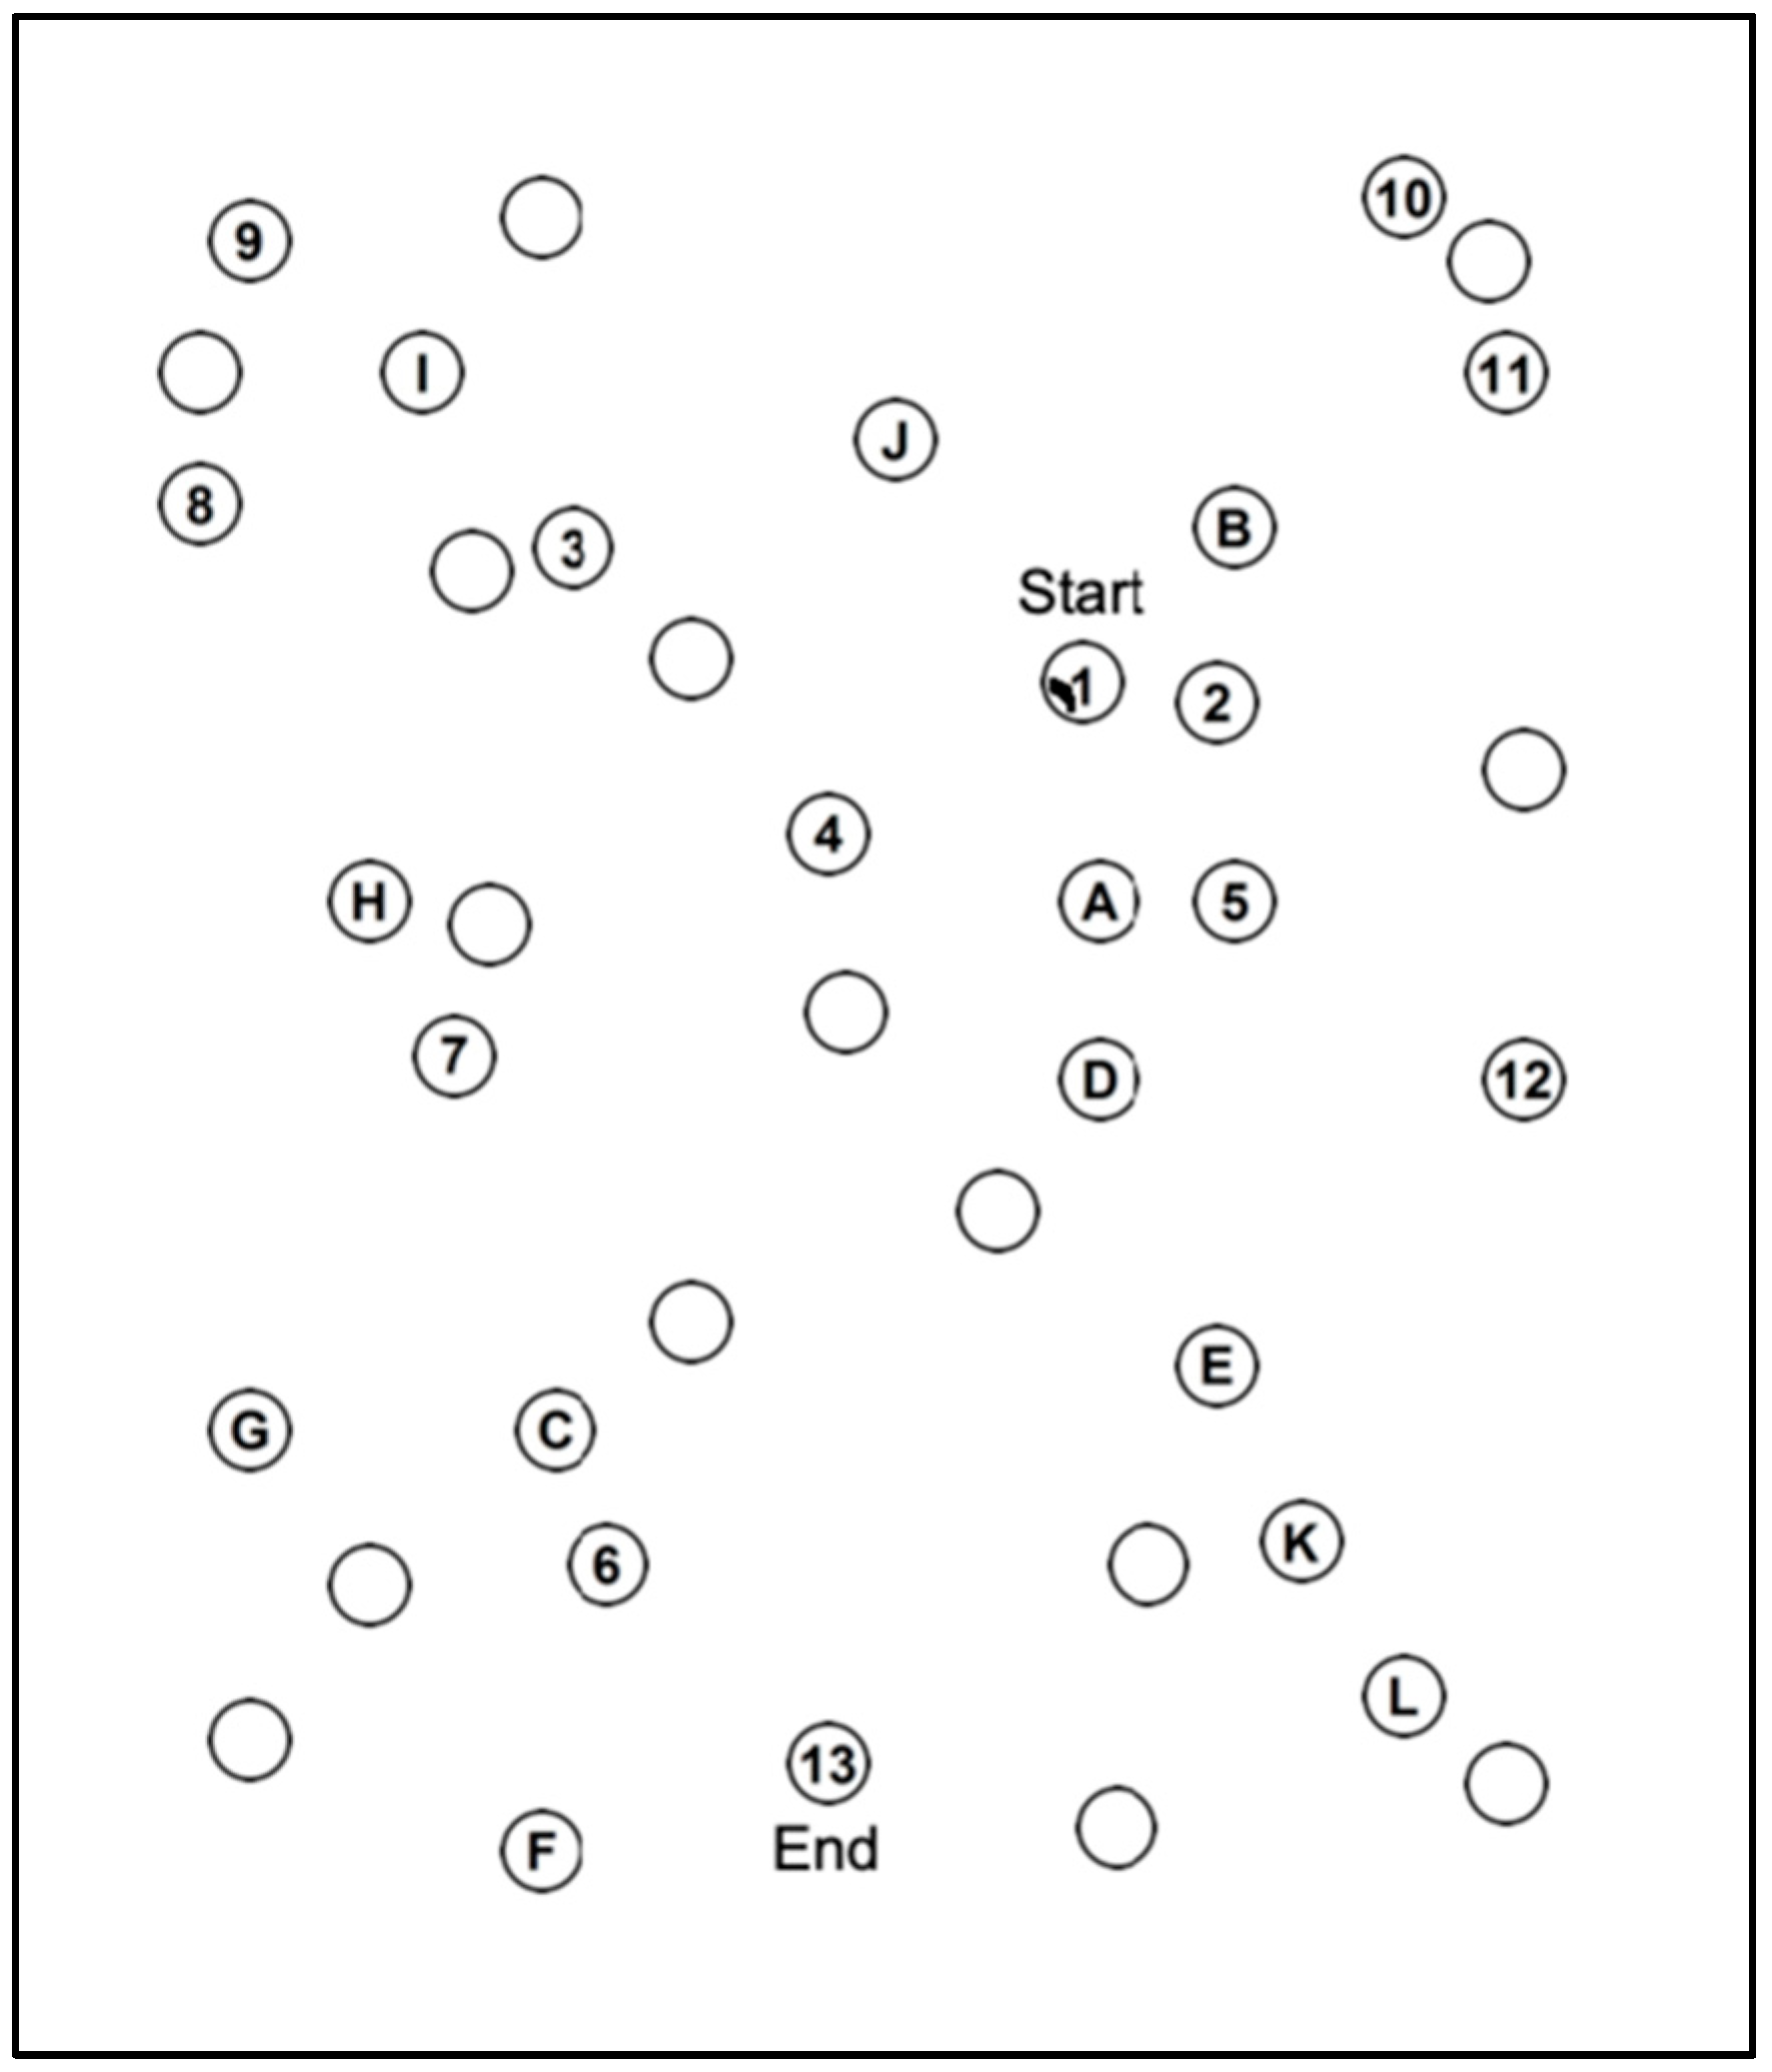
- Trail Making Test (TMT)
- (3)
- Wisconsin Card Sorting Test (WCST)
- (4)
- Intra-Extra Dimensional Set Shift (IED) task
- (5)
- Probabilistic Reversal (PR) Learning task
Inhibition
- (1)
- Stroop task
- Stroop Accuracy cost = mean Accuracy in incongruent trials − mean Accuracy in congruent trials
- Stroop RT cost = mean RT in incongruent trials − mean RT in congruent trials
Working Memory
- (1)
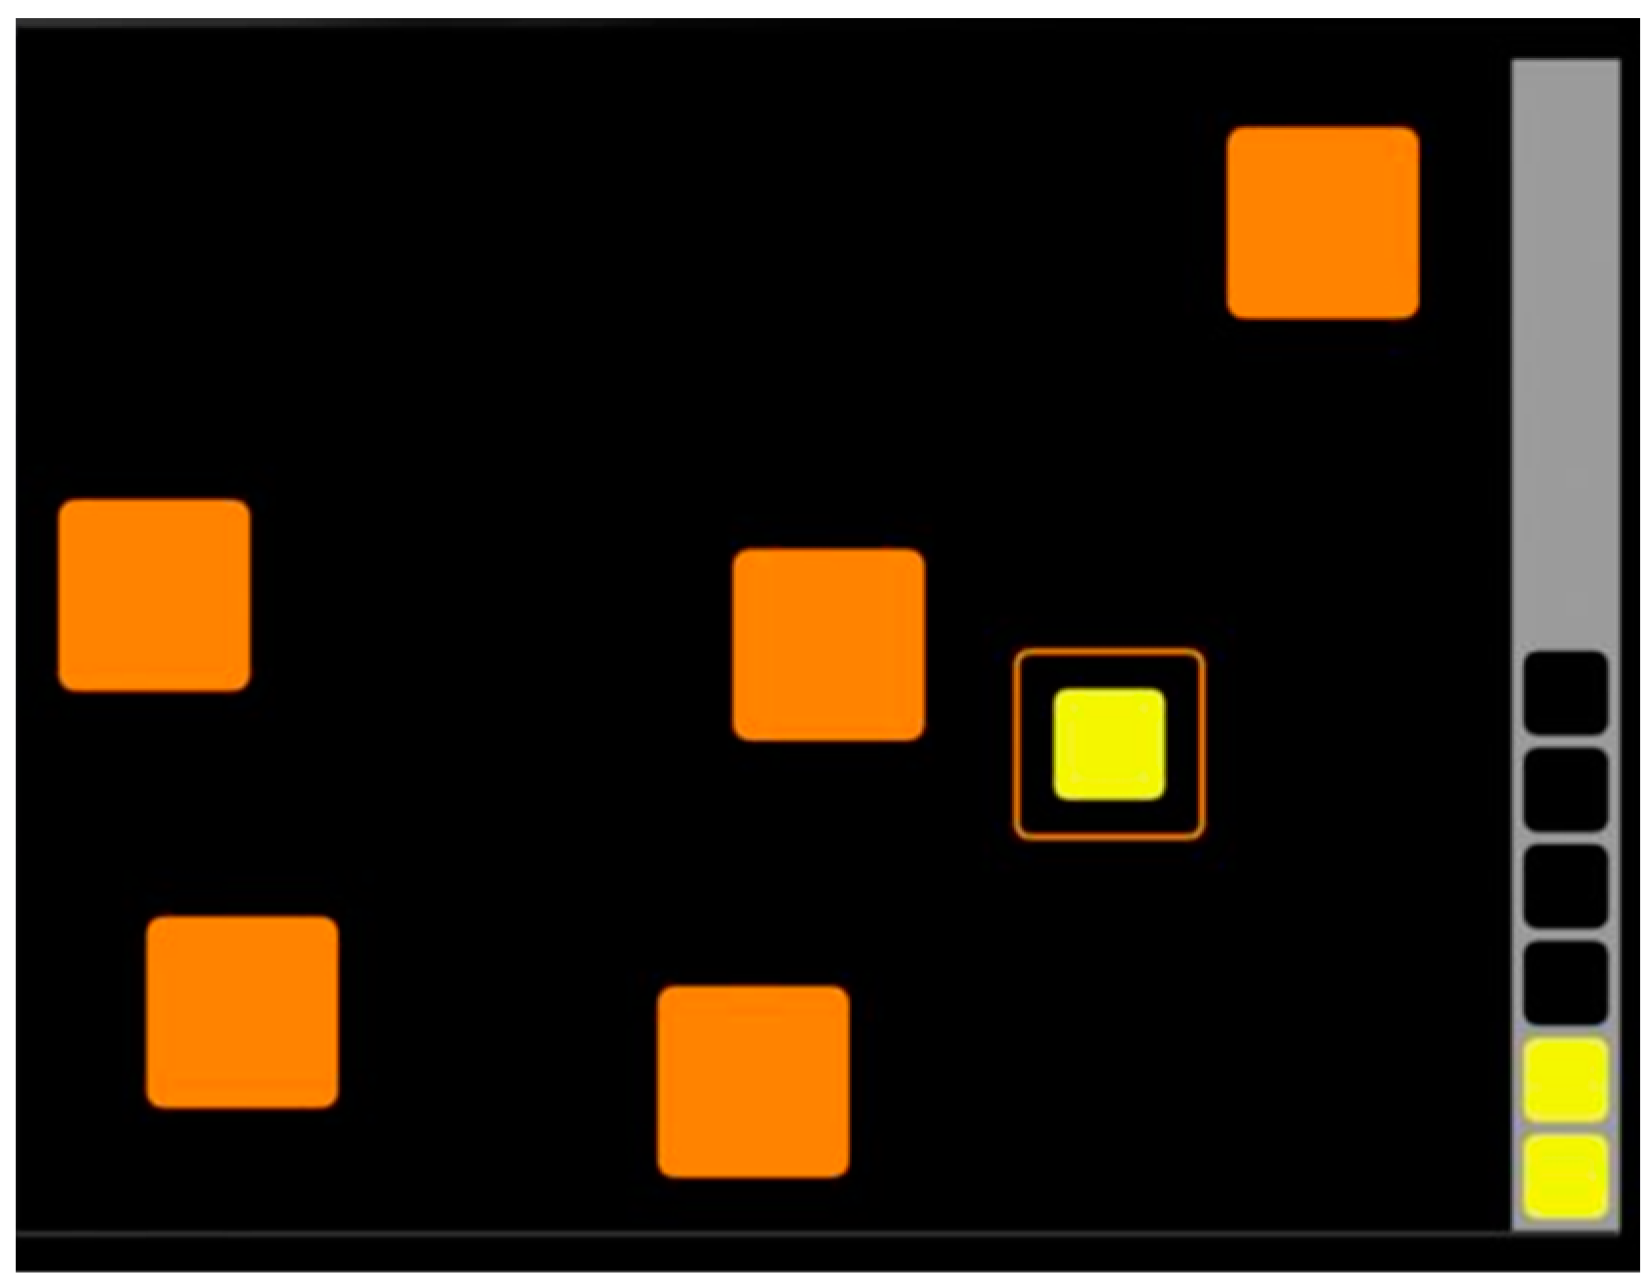
- Spatial Working Memory (SWM) task
- (2)
- Backward Digit Span (BDS) task
Statistical Learning
- (1)
- Structure Learning (SL) task
| Level 1 | Target | ||||
| A | B | C | D | ||
| Context | A | 0.8 | 0.2 | ||
| B | 0.8 | 0.2 | |||
| C | 0.2 | 0.8 | |||
| D | 0.8 | 0.2 | |||
2.3. Analysis
3. Results
3.1. Language Profiles in the UK and Singapore
3.1.1. Differences between Groups
3.1.2. Differences between Groups
- UK Sample
- Singapore Sample
3.2. Language Effects on Cognitive Performance
- Language Entropy and L2 AoA;
- Balanced Proficiency, Single-Language context use, Code-Switching;
- Balanced Proficiency, Single-Language context use, Dual-Language context use.
- Language Entropy, L2 AoA, Balanced Proficiency, Single-Language context use, Code-Switching;
- Language Entropy, L2 AoA, Balanced Proficiency, Single-Language context use, Dual-Language context use.
3.2.1. UK Sample
- 1.
- Cognitive Flexibility (CF)
- Task-Set Switching (TSS)
- Accuracy cost
- 2.
- Working Memory (WM)
- Spatial Working Memory (SWM)
- Strategy score
- 3.
- Structure Learning (SL)
- SL Performance Index (PI)
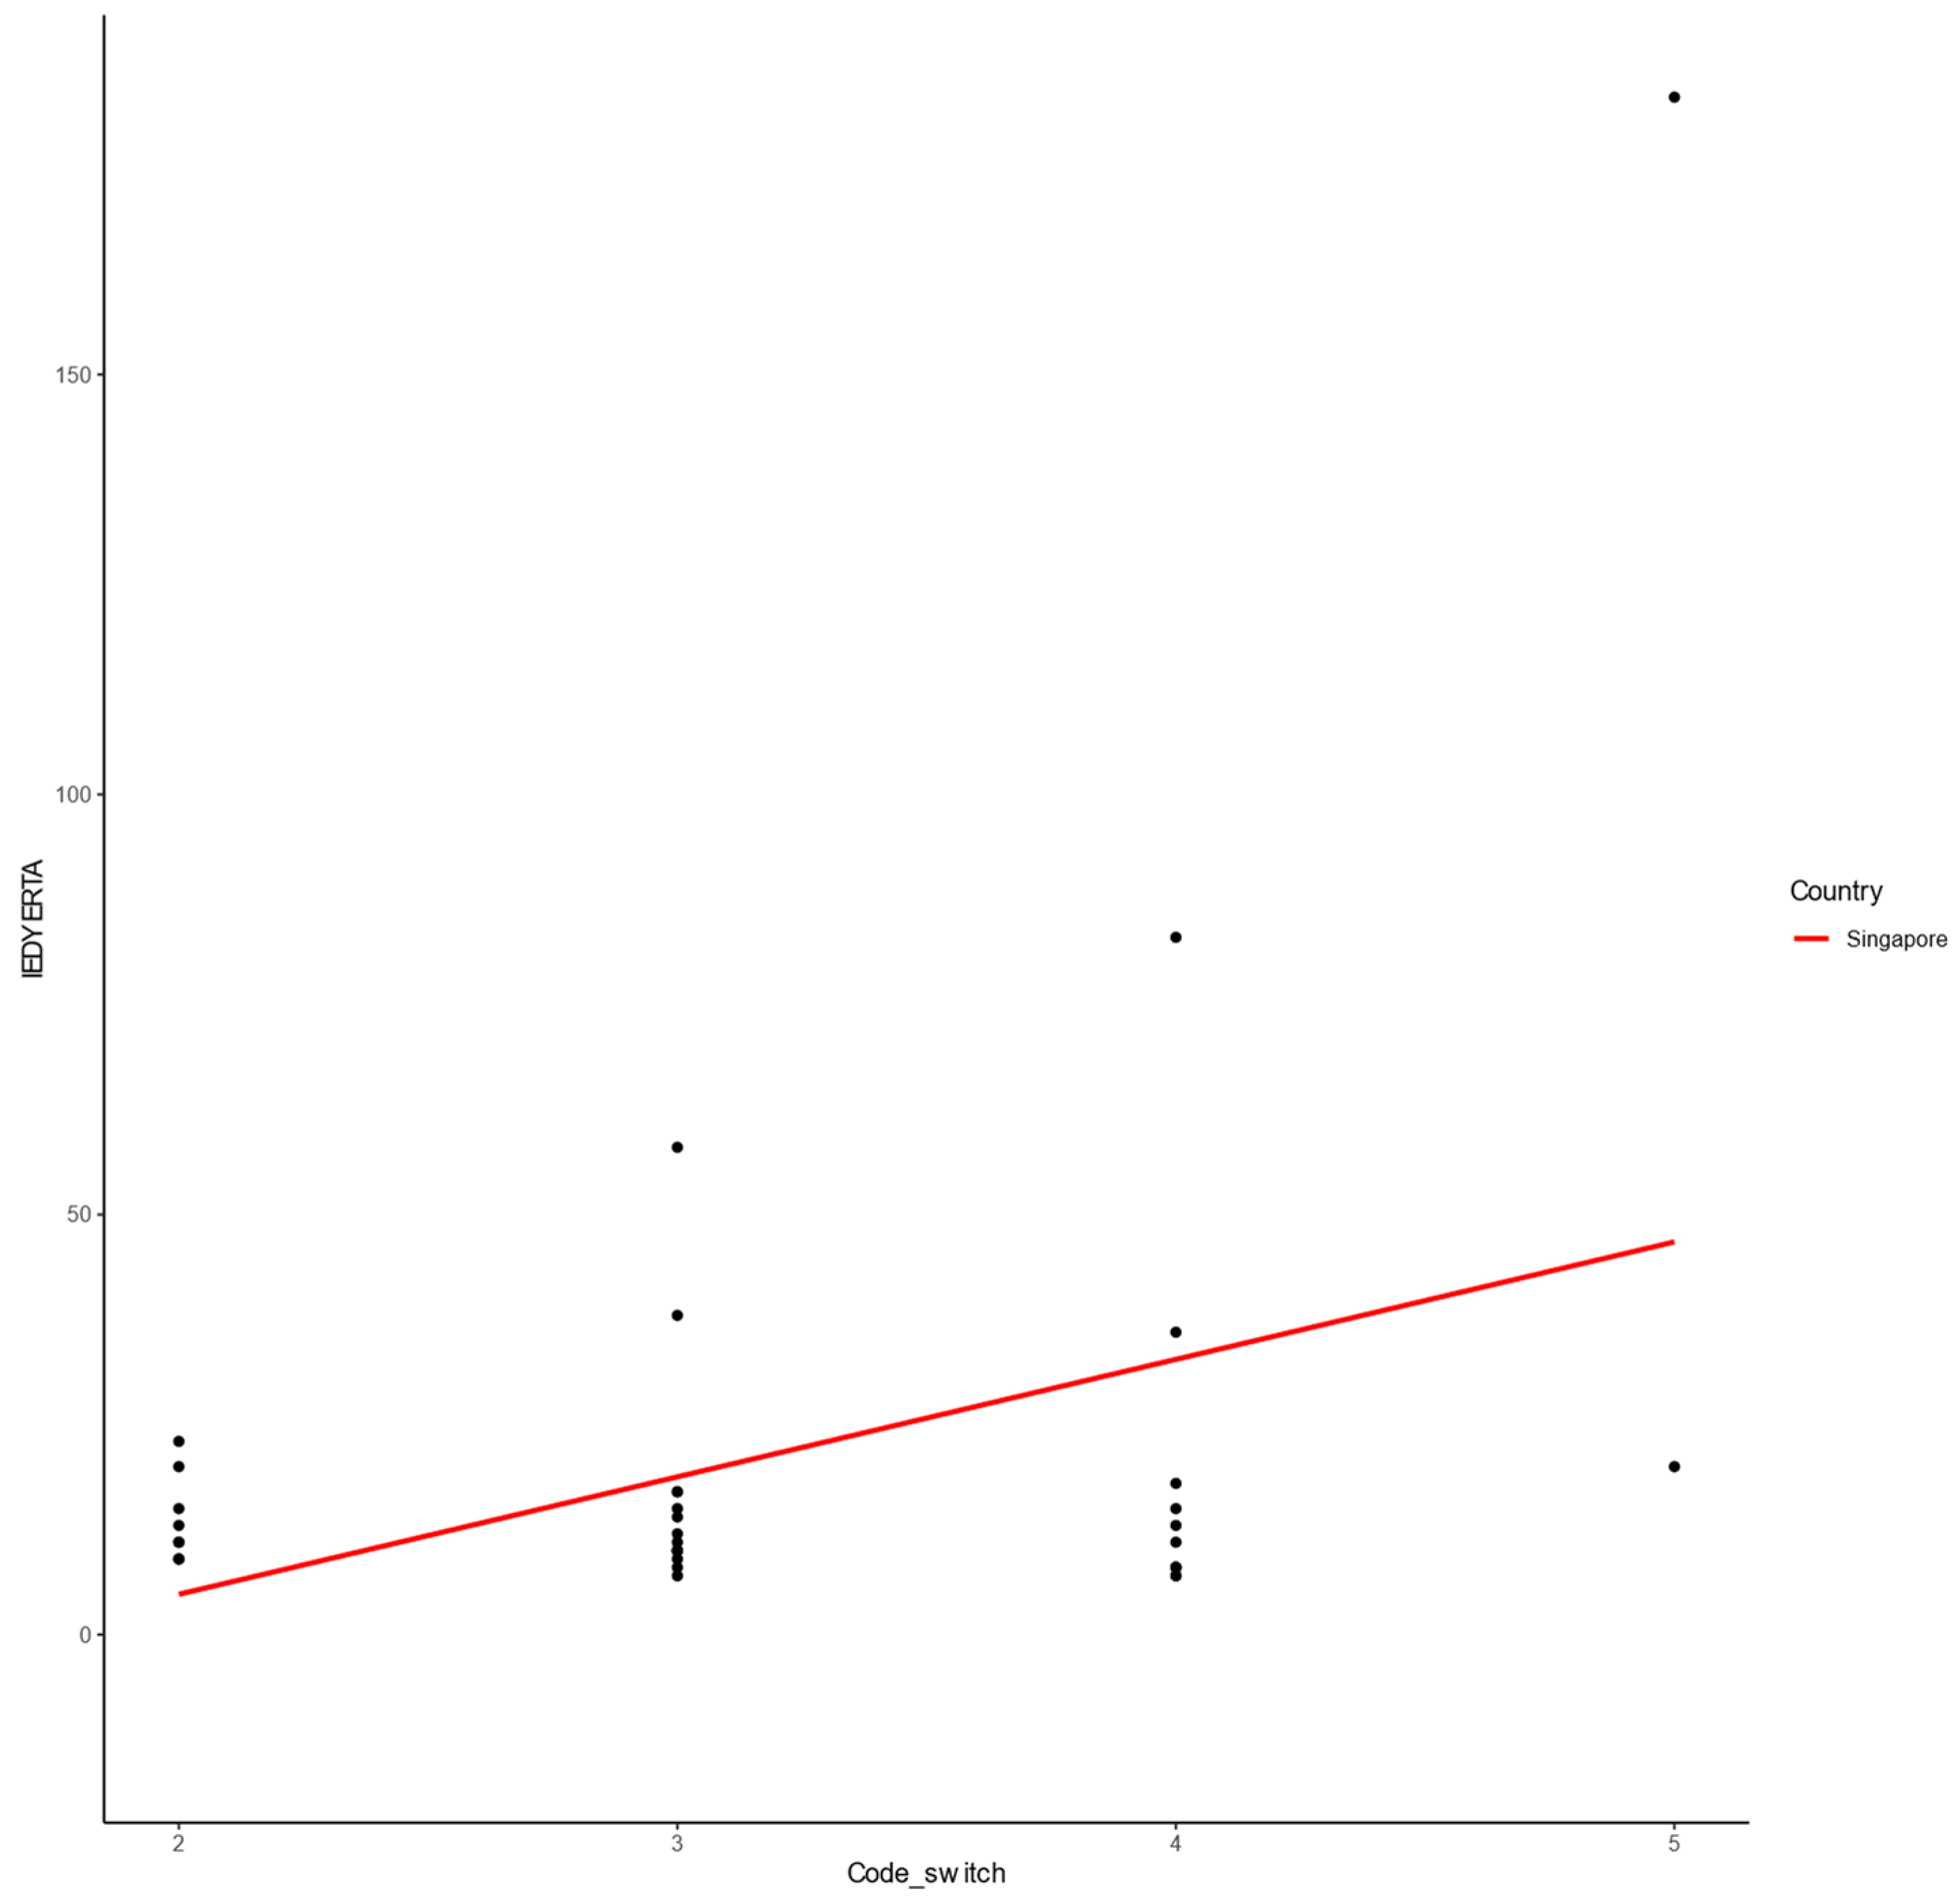
3.2.2. Singapore Sample
- 1.
- Cognitive Flexibility (CF)
- Trail Making Test (TMT) B:A Ratio
- Intra-Extra Dimensional (IED) Set Shift
- Total Errors
- Extra-Dimensional Shift Errors
- 2.
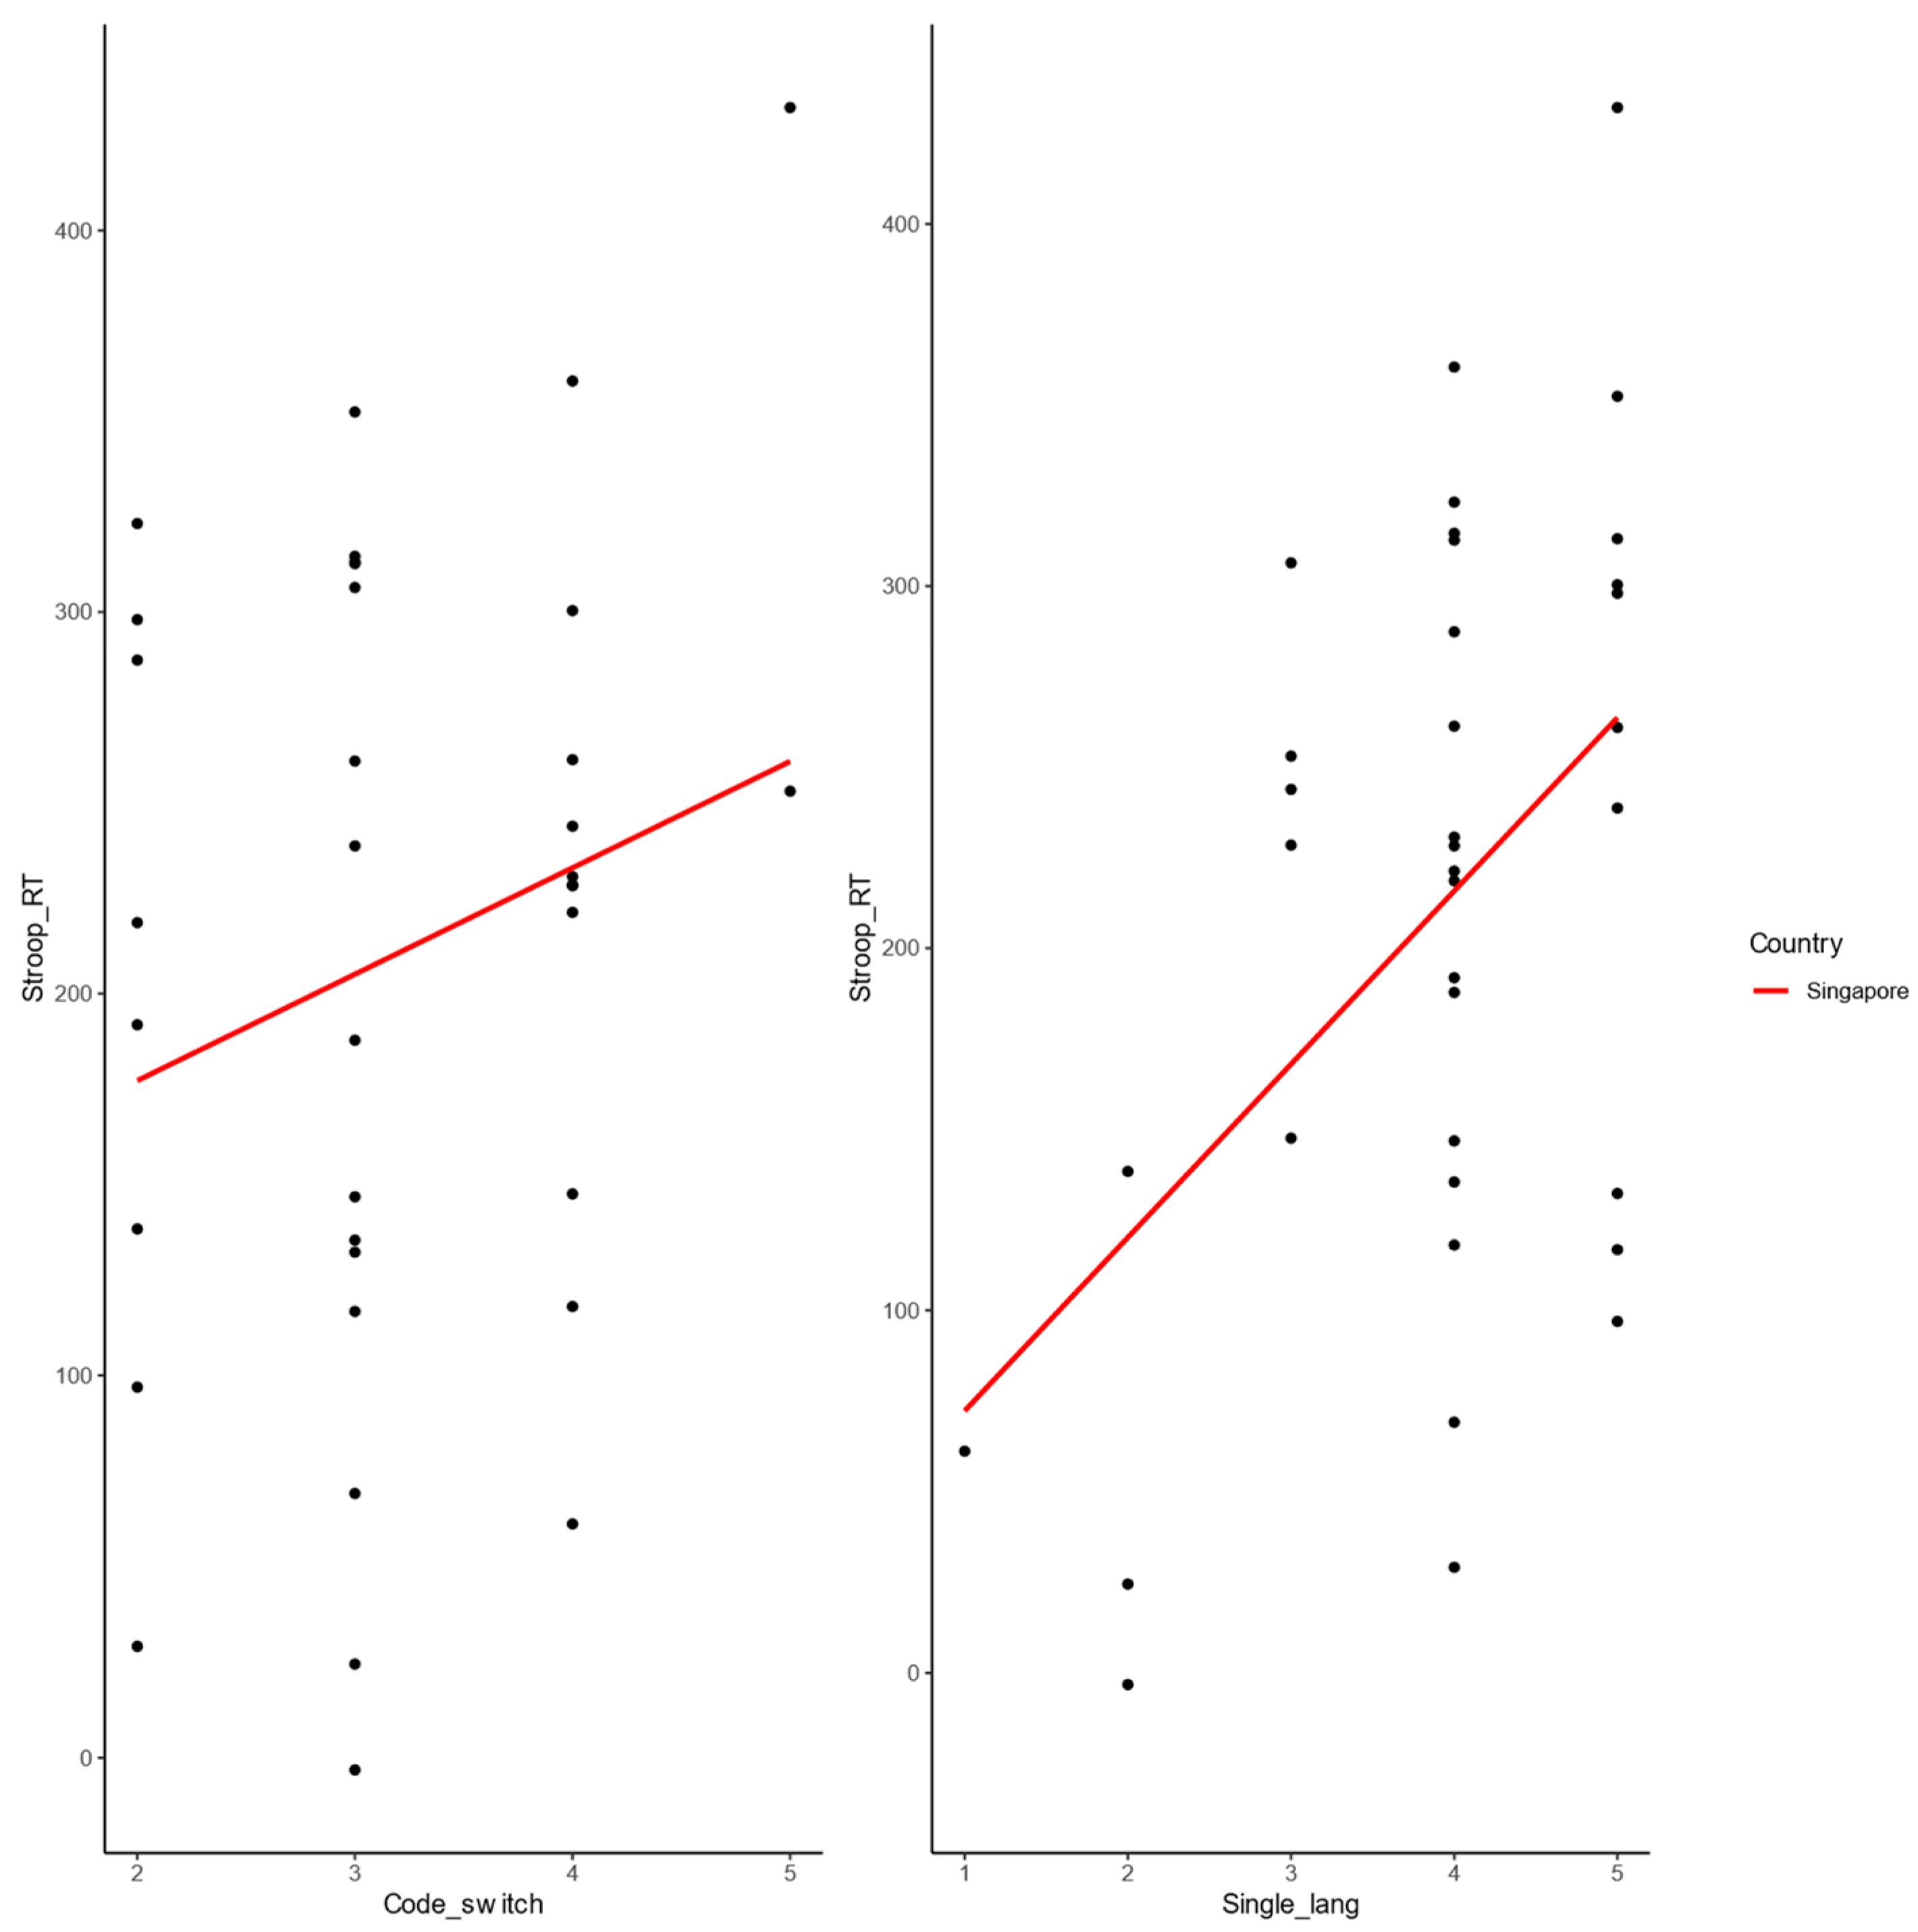
- Inhibition
- Stroop Task
- RT cost
- 3.
- Working Memory (WM)
- Spatial Working Memory (SWM)
- Total Errors
- Strategy score
- Verbal Working Memory (VWM)
- Backward Digit Span (BDS)
Structure Learning (SL)
- SL Performance Index (PI)
- SL Strategy ICD
4. Discussion
4.1. Linguistic Profiles
4.2. Relationship between Language Experience and Cognitive Control in Different Contexts
5. Conclusions
Author Contributions
Funding
Institutional Review Board Statement
Informed Consent Statement
Data Availability Statement
Conflicts of Interest
Correction Statement
Appendix A. Demographics Questionnaire
- 1.
- When is your birthday (Enter x if you would prefer not to say)?
- 2.
- What is your gender?
- 3.
- Are you now married, widowed, divorced, separated or never married?
- 4.
- Have you ever been diagnosed with any neurological or psychiatric disorders or suffered from brain injury?
- 5.
- Are you colour-blind?
- 6.
- Describe your handedness:
- 7.
- Choose one or more ethnicities that you consider yourself to be:
- 8.
- In which country do you currently reside?
 Country
- 9.
- In which country were you born?
Country- 10.
- In which country did you spend the majority of your youth?
Country- 11.
- Have you ever lived in a country other than the one in which you were born?
- 12.
- What is your current Residence Status
- 13.
- What is your Postcode/District? (Enter x if you would prefer not to say)
- 14.
- What is the highest level of education you have completed?
- 15.
- Which statement best describes your current employment status?
- 16.
- Indicate your best guess as to your household’s earnings in the last year (before tax)? (*in Singapore $ and UK £ - depending on the sample)
- 17.
- What type of dwelling does your family live in? (*Singapore Question)
- 18.
- Is your family dwelling privately owned or rented? (*UK question)
- 19.
- Follow-up: What type of dwelling does your family reside in?
- 20.
- How many children are there in your household?
- 21.
- Which members compose your household? (select all that apply)
- 22.
- What is the highest level of school your father has completed or the highest degree they have received?
- 23.
- What is the highest level of school your mother has completed or the highest degree they have received?
- 24.
- Which statement best describes your father’s current employment status?
- 25.
- Which statement best describes your mother’s current employment status?
- 26.
- Do you play video games (of any sort)?
Appendix B. Language Questionnaire & CEFR Grid
- Q1. Participant ID
- Q2. Please answer the following questions for all the languages/dialects you know (native and non-native)
- Which language(s)
- Age of Acquisition (For languages you speak from birth, put 0).
- Context of Acquisition (e.g., home, environment, school).
- Hours of current Usage (in a day) (0–18 h).
- Percentage of current Usage (in a day). Put 0% if you do not use this particular language (your answers should add up to 100%).
- Context of Usage (e.g., home, education, community, work, language school, etc.).
- Q3. How often are the following statements true for your everyday use of language?
- I only/mainly use one of the languages I know.Never ☐ Rarely ☐ Sometimes ☐ Most of the time ☐ Always ☐
- I use the languages I know in distinct contexts (e.g., Language 1 at home, Language 2 at school/work, etc.).Never ☐ Rarely ☐ Sometimes ☐ Most of the time ☐ Always ☐
- I switch between the languages I know even within the same context (e.g., home or school), but with different interlocutors.Never ☐ Rarely ☐ Sometimes ☐ Most of the time ☐ Always ☐
- I switch between the languages I know even within the same conversation/interaction (with the same interlocutor).Never ☐ Rarely ☐ Sometimes ☐ Most of the time ☐ Always ☐
- Q4. Select the number of non-native languages/dialects that you know.
- Q5. You will now be presented with some statements describing levels of proficiency in a language. Please write each of your additional languages/dialects under the box that most accurately describes your competence in that language/dialect.


Appendix C. Correlation Matrices
Appendix C.1. Correlation Matrices of Background Measures
| 1 | 2 | 3 | 4 | |
| Age | – | |||
| SES | 0.06 | – | ||
| NVIQ | −0.009 | 0.12 | – | |
| VIQ | −0.34 * | −0.01 | −0.03 | – |
| Significance codes: 0 ‘***’ 0.001 ‘**’ 0.01 ‘*’ 0.05 ‘.’ 0.1 ‘ ’ 1. | ||||
| 1 | 2 | 3 | 4 | |
| Age | – | |||
| SES | 0.11 | – | ||
| NVIQ | −0.05 | 0.30 | – | |
| VIQ | 0.08 | 0.08 | 0.11 | – |
| Significance codes: 0 ‘***’ 0.001 ‘**’ 0.01 ‘*’ 0.05 ‘.’ 0.1 ‘ ’ 1. | ||||
Appendix C.2. Correlation Matrices of Background and Language Measures
| Balanced Usage | ||
| Balanced Usage | – | |
| Age | −0.23 | |
| SES | 0.02 | |
| NVIQ | 0.05 | |
| VIQ | 0.38 ** | p = 0.006 |
| Significance codes: 0 ‘***’ 0.001 ‘**’ 0.01 ‘*’ 0.05 ‘.’ 0.1 ‘ ’ 1. | ||
| Language Entropy | ||
| Language Entropy | – | |
| Age | 0.44 ** | p = 0.001 |
| SES | −0.10 | |
| NVIQ | -0.10 | |
| VIQ | −0.39 ** | p = 0.005 |
| Significance codes: 0 ‘***’ 0.001 ‘**’ 0.01 ‘*’ 0.05 ‘.’ 0.1 ‘ ’ 1. | ||
| Balanced Proficiency | ||
| Balanced Proficiency | – | |
| Age | −0.23 | |
| SES | 0.02 | |
| NVIQ | 0.05 | |
| VIQ | 0.38 ** | p = 0.006 |
| Significance codes: 0 ‘***’ 0.001 ‘**’ 0.01 ‘*’ 0.05 ‘.’ 0.1 ‘ ’ 1. | ||
| L2 AoA | |
| L2 AoA | – |
| Age | −0.03 |
| SES | −0.006 |
| NVIQ | 0.19 |
| VIQ | 0.08 |
| Significance codes: 0 ‘***’ 0.001 ‘**’ 0.01 ‘*’ 0.05 ‘.’ 0.1 ‘ ’ 1. | |
| Single-Language | |
| Single-Language | – |
| Age | 0.20 |
| SES | 0.20 |
| NVIQ | −0.15 |
| VIQ | 0.23 |
| Significance codes: 0 ‘***’ 0.001 ‘**’ 0.01 ‘*’ 0.05 ‘.’ 0.1 ‘ ’ 1. | |
| Dual-Language | |
| Dual-Language | – |
| Age | 0.14 |
| SES | 0.06 |
| NVIQ | −0.18 |
| VIQ | −0.17 |
| Significance codes: 0 ‘***’ 0.001 ‘**’ 0.01 ‘*’ 0.05 ‘.’ 0.1 ‘ ’ 1. | |
| Code-Switching | ||
| Code-Switching | – | |
| Age | 0.04 | |
| SES | 0.02 | |
| NVIQ | −0.08 | |
| VIQ | −0.31 * | p = 0.030 |
| Significance codes: 0 ‘***’ 0.001 ‘**’ 0.01 ‘*’ 0.05 ‘.’ 0.1 ‘ ’ 1. | ||
| Balanced Usage | ||
| Balanced Usage | – | |
| Age | 0.07 | |
| SES | 0.06 | |
| NVIQ | −0.38 * | p = 0.021 |
| VIQ | 0.0006 | |
| Significance codes: 0 ‘***’ 0.001 ‘**’ 0.01 ‘*’ 0.05 ‘.’ 0.1 ‘ ’ 1. | ||
| Language Entropy | |
| Language Entropy | – |
| Age | −0.05 |
| SES | −0.16 |
| NVIQ | 0.30 |
| VIQ | −0.16 |
| Significance codes: 0 ‘***’ 0.001 ‘**’ 0.01 ‘*’ 0.05 ‘.’ 0.1 ‘ ’ 1. | |
| Balanced Proficiency | ||
| Balanced Proficiency | – | |
| Age | −0.13 | |
| SES | −0.04 | |
| NVIQ | −0.03 | |
| VIQ | 0.43 ** | p = 0.009 |
| Significance codes: 0 ‘***’ 0.001 ‘**’ 0.01 ‘*’ 0.05 ‘.’ 0.1 ‘ ’ 1. | ||
| L2 AoA | ||
| L2 AoA | – | |
| Age | 0.31 | |
| SES | −0.06 | |
| NVIQ | 0.02 | |
| VIQ | 0.44 ** | p = 0.007 |
| Significance codes: 0 ‘***’ 0.001 ‘**’ 0.01 ‘*’ 0.05 ‘.’ 0.1 ‘ ’ 1. | ||
| Single-Language | |
| Single-Language | – |
| Age | −0.13 |
| SES | 0.04 |
| NVIQ | −0.15 |
| VIQ | −0.10 |
| Significance codes: 0 ‘***’ 0.001 ‘**’ 0.01 ‘*’ 0.05 ‘.’ 0.1 ‘ ’ 1. | |
| Dual-Language | |
| Dual-Language | – |
| Age | 0.006 |
| SES | −0.07 |
| NVIQ | 0.20 |
| VIQ | −0.16 |
| Significance codes: 0 ‘***’ 0.001 ‘**’ 0.01 ‘*’ 0.05 ‘.’ 0.1 ‘ ’ 1. | |
| Code-Switching | |
| Code-Switching | – |
| Age | −0.04 |
| SES | 0.003 |
| NVIQ | 0.01 |
| VIQ | −0.13 |
| Significance codes: 0 ‘***’ 0.001 ‘**’ 0.01 ‘*’ 0.05 ‘.’ 0.1 ‘ ’ 1. | |
Appendix D. Regression Models
| AIC | BIC |
| −104.46 | −98.72 |
| Estimate | β | S.E. | t | p | |
| TSS Acc cost | (Intercept) | −0.082 | 0.071 | −1.154 | 0.254 |
| VIQ | 0.003 | 0.001 | 2.800 | 0.007 ** | |
| Significance codes: 0 ‘***’ 0.001 ‘**’ 0.01 ‘*’ 0.05 ‘.’ 0.1 ‘ ’ 1. F(1,48) = 7.84, p = 0.007, R2 = 0.14, R2adjusted = 0.12. | |||||
| AIC | BIC |
| 251.78 | 264.42 |
| Estimate | β | S.E. | t | p | |
| SWM Strategy | (Intercept) | 35.933 | 7.030 | 5.111 | <0.0001 *** |
| L2_AoA | −0.095 | 0.132 | −0.716 | 0.478 | |
| Age | −0.317 | 0.187 | −1.693 | 0.098 | |
| SES | −9.861 | 3.201 | −3.081 | 0.004 ** | |
| NVIQ | −3.896 | 2.362 | −1.649 | 0.107 | |
| VIQ | −0.113 | 0.054 | −2.105 | 0.042 | |
| Significance codes: 0 ‘***’ 0.001 ‘**’ 0.01 ‘*’ 0.05 ‘.’ 0.1 ‘ ’ 1. F(5,39) = 4.03, p = 0.005, R2 = 0.34, R2adjusted = 0.26. | |||||
| AIC | BIC |
| 252.97 | 263.81 |
| Estimate | β | S.E. | t | p | |
| SWM Strategy | (Intercept) | 26.193 | 4.133 | 6.338 | <0.0001 *** |
| L2_AoA | −0.095 | 0.136 | −0.703 | 0.486 | |
| SES | −9.915 | 3.275 | −3.028 | 0.004 ** | |
| NVIQ | −3.867 | 2.417 | −1.600 | 0.117 | |
| VIQ | −0.081 | 0.052 | −1.578 | 0.122 | |
| Significance codes: 0 ‘***’ 0.001 ‘**’ 0.01 ‘*’ 0.05 ‘.’ 0.1 ‘ ’ 1. F(4,40) = 4.13, p = 0.007, R2 = 0.29, R2adjusted = 0.22. | |||||
| AIC | BIC |
| −68.21 | −58.55 |
| Estimate | β | S.E. | t | p | |
| SL PI improvement | (Intercept) | −0.184 | 0.122 | −1.510 | 0.138 |
| Balanced Proficiency | −0.022 | 0.008 | −2.635 | 0.011 * | |
| Code-Switching | −0.021 | 0.016 | −1.324 | 0.192 | |
| VIQ | 0.006 | 0.002 | 3.486 | 0.001 ** | |
| Significance codes: 0 ‘***’ 0.001 ‘**’ 0.01 ‘*’ 0.05 ‘.’ 0.1 ‘ ’ 1. F(5,39) = 6.26, p = 0.001, R2 = 0.29, R2adjusted = 0.24. | |||||
| AIC | BIC |
| −64.52 | −58.72 |
| Estimate | β | S.E. | t | p | |
| SL PI improvement | (Intercept) | −0.225 | 0.107 | −2.108 | 0.040 * |
| VIQ | 0.005 | 0.002 | 3.158 | 0.003 ** | |
| Significance codes: 0 ‘***’ 0.001 ‘**’ 0.01 ‘*’ 0.05 ‘.’ 0.1 ‘ ’ 1. F(1,49) = 9.975, p = 0.003, R2 = 0.17, R2adjusted = 0.15. | |||||
| AIC | BIC |
| 27.80 | 34.14 |
| Estimate | β | S.E. | t | p | |
| TMT B:A Ratio | (Intercept) | 0.855 | 0.121 | 7.051 | <0.0001 *** |
| L2 AoA | 0.059 | 0.029 | 2.009 | 0.053 | |
| Balanced Proficiency | 0.123 | 0.052 | 2.377 | 0.0234 * | |
| Significance codes: 0 ‘***’ 0.001 ‘**’ 0.01 ‘*’ 0.05 ‘.’ 0.1 ‘ ’ 1. F(2,33) = 5.90, p = 0.006, R2 = 0.26, R2adjusted = 0.22. | |||||
| AIC | BIC |
| 349.23 | 357.15 |
| Estimate | β | S.E. | t | p | |
| IED Total Errors (incl. outliers) | (Intercept) | −138.007 | 59.271 | −2.328 | 0.026 * |
| Single-Language | 8.232 | 4.882 | 1.686 | 0.102 | |
| Code-Switching | 15.705 | 5.704 | 2.753 | 0.010 ** | |
| Age | 3.627 | 2.267 | 1.600 | .119 | |
| Significance codes: 0 ‘***’ 0.001 ‘**’ 0.01 ‘*’ 0.05 ‘.’ 0.1 ‘ ’ 1. F(3,32) = 3.632, p = 0.023, R2 = 0.25, R2adjusted = 0.18. | |||||
| AIC | BIC |
| 177.47 | 181.78 |
| Estimate | β | S.E. | t | p | |
| IED Total Errors (w/o Outliers) | (Intercept) | 0.392 | 4.835 | 0.081 | 0.936 |
| VIQ | 0.224 | 0.091 | 2.454 | 0.020 ** | |
| Significance codes: 0 ‘***’ 0.001 ‘**’ 0.01 ‘*’ 0.05 ‘.’ 0.1 ‘ ’ 1. F(1,29) = 6.024, p = 0.020, R2 = 0.17, R2adjusted = 0.14. | |||||
| AIC | BIC |
| 238.48 | 246.40 |
| Estimate | β | S.E. | t | p | |
| IED Extra-Dimensional Shift Errors | (Intercept) | −24.925 | 10.748 | −2.319 | 0.027 * |
| Language Entropy | 11.366 | 2.779 | 4.090 | 0.0002 *** | |
| Age | 1.362 | 0.483 | 2.823 | 0.008 ** | |
| NVIQ | −11.077 | 4.5547 | −2.432 | 0.021 * | |
| Significance codes: 0 ‘***’ 0.001 ‘**’ 0.01 ‘*’ 0.05 ‘.’ 0.1 ‘ ’ 1. F(3,32) = 8.618, p = 0.0002, R2 = 0.45, R2adjusted = 0.40. | |||||
| AIC | BIC |
| 428.86 | 436.78 |
| Estimate | β | S.E. | t | p | |
| Stroop RT Cost | (Intercept) | −35.414 | 94.63 | −2.086 | 0.045 |
| Balanced Proficiency | 29.570 | 13.49 | 2.192 | 0.036 * | |
| Single-Language | 56.830 | 14.76 | 3.850 | 0.0005 *** | |
| Code-Switching | 43.940 | 17.54 | 2.505 | 0.018 * | |
| Significance codes: 0 ‘***’ 0.001 ‘**’ 0.01 ‘*’ 0.05 ‘.’ 0.1 ‘ ’ 1. F(3,32) = 6.748, p = 0.001, R2 = 0.39, R2adjusted = 0.33. | |||||
| AIC | BIC |
| 318.22 | 324.55 |
| Estimate | β | S.E. | t | p | |
| SWM Errors | (Intercept) | 26.592 | 10.987 | 2.420 | 0.021 * |
| Language Entropy | −13.456 | 8.216 | −1.638 | 0.111 | |
| SES | 30.415 | 18.528 | 1.642 | 0.110 | |
| Significance codes: 0 ‘***’ 0.001 ‘**’ 0.01 ‘*’ 0.05 ‘.’ 0.1 ‘ ’ 1. F(2,33) = 3.21, p = 0.053, R2 = 0.16, R2adjusted = 0.11. | |||||
| AIC | BIC |
| 205.07 | 211.41 |
| Estimate | β | S.E. | t | p | |
| SWM Strategy | (Intercept) | 11.843 | 2.282 | 5.189 | <0.0001 *** |
| Language Entropy | −3.426 | 1.707 | −2.007 | 0.0530 | |
| SES | 9.473 | 3.849 | 2.461 | 0.0192 * | |
| Significance codes: 0 ‘***’ 0.001 ‘**’ 0.01 ‘*’ 0.05 ‘.’ 0.1 ‘ ’ 1. F(2,33) = 6.005, p = 0.006, R2 = 0.27, R2adjusted = 0.22. | |||||
| AIC | BIC |
| 181.81 | 189.72 |
| Estimate | β | S.E. | t | p | |
| BDS | (Intercept) | 10.656 | 2.264 | 4.708 | <0.0001 *** |
| Code-Switching | −0.944 | 0.551 | −1.714 | 0.096 | |
| SES | −4.495 | 2.842 | −1.582 | 0.124 | |
| NVIQ | 6.677 | 2.066 | 3.233 | 0.003 ** | |
| Significance codes: 0 ‘***’ 0.001 ‘**’ 0.01 ‘*’ 0.05 ‘.’ 0.1 ‘ ’ 1. F(3,32) = 4.56, p = 0.009, R2 = 0.30, R2adjusted = 0.23. | |||||
| AIC | BIC |
| −51.40 | −45.07 |
| Estimate | β | S.E. | t | p | |
| SL PI improvement | (Intercept) | −0.234 | 0.065 | −3.614 | <0.001 *** |
| Language Entropy | 0.179 | 0.048 | 3.693 | 0.0008 *** | |
| SES | 0.437 | 0.109 | 3.999 | 0.0003 *** | |
| Significance codes: 0 ‘***’ 0.001 ‘**’ 0.01 ‘*’ 0.05 ‘.’ 0.1 ‘ ’ 1. F(2,33) = 12.75, p < 0.0001, R2 = 0.44, R2adjusted = 0.40. | |||||
| AIC | BIC |
| −34.66 | −29.90 |
| Estimate | β | S.E. | t | p | |
| SL Strategy ICD | (Intercept) | −0.236 | 0.046 | −5.154 | <0.0001 *** |
| Language Entropy | 0.116 | 0.061 | 1.894 | 0.0667 | |
| Significance codes: 0 ‘***’ 0.001 ‘**’ 0.01 ‘*’ 0.05 ‘.’ 0.1 ‘ ’ 1. F(1,34) = 3.589, p = 0.067, R2 = 0.10, R2adjusted = 0.07. | |||||
| 1 | The “Global South” is a term that has been traditionally used to refer to economically disadvantaged nations. A broader definition incorporates countries that have historically frequently faced colonisation by Global North countries (especially European), have unstable democracies, and/or are in the process of industrialising (Finance Center for South-South Cooperation n.d.; World Population Review 2023). We acknowledge that our sample of young University students in Singapore comprise a relatively privileged group compared to other areas of the Global South. |
| 2 | Mean self-rated English Proficiency for the UK sample was 5.9 out of 6, and for the Singapore sample was 5.82 out of 6 (the groups did not differ significantly t = 1.12, p = 0.27). |
| 3 | We tried to use well-validated tasks, whose psychometric properties have been thoroughly analysed, and which have been used as indicators of general intelligence in multiple areas of the world (Kaufman et al. 2006; Raven 2000). However, we recognise that “culture-free” measures of intelligence suffer certain weaknesses (Gonthier 2022; Walker et al. 2009), and this should be taken into account in future studies. |
| 4 | For participants who listed a single language, a score of 0 was added to L2 Proficiency in order to calculate Balanced Proficiency score (i.e., difference in proficiency between most proficient and second most proficient language). |
| 5 | As most of our participants reported 6 out of 6 in L1 Proficiency, the Balanced Proficiency score mostly depends on L2 Proficiency. |
| 6 | For the calculation of Balanced Usage, we only included the first two most used languages, weighted against each other. For example, if a participant reported 60% use of English, 30% use of French, and 10% use of German, we excluded German and converted the percentages for English and French to 67% and 33% respectively. The outputs of the models, however, were not different when we used unconverted percentages (unweighted Balanced Usage). |
| 7 | L2 here can technically be another L1 for participants that acquired both languages at birth. |
| 8 | As mentioned earlier, this interaction may also be present in the UK (and Europe more generally) in big centres with greater cultural and linguistic variation, but societal attitudes still privilege the major languages (Bunk and Wiese 2024). |
| 9 | We must point out that there was an apparent correlation between Balanced Proficiency and VIQ in the UK sample, but this stopped being significant when we corrected for multiple comparisons. Still, when we ran separate models, the model with VIQ was better than the one with Balanced Proficiency. |
References
- Antón, Eneko, Jon A. Duñabeitia, Adelina Estévez, Juan A. Hernández, Alejandro Castillo, Luis J. Fuentes, Douglas J. Davidson, and Manuel Carreiras. 2014. Is There a Bilingual Advantage in the ANT Task? Evidence from Children. Frontiers in Psychology 5: 1–12. [Google Scholar] [CrossRef]
- Antón, Eneko, Manuel Carreiras, and Jon Andoni Duñabeitia. 2019. The Impact of Bilingualism on Executive Functions and Working Memory in Young Adults. PLoS ONE 14: e0206770. [Google Scholar] [CrossRef] [PubMed]
- Antón, Eneko, Yuriem Fernández García, Manuel Carreiras, and Jon Andoni Duñabeitia. 2016. Does Bilingualism Shape Inhibitory Control in the Elderly? Journal of Memory and Language 90: 147–60. [Google Scholar] [CrossRef]
- Armitage, Stewart G. 1946. An Analysis of Certain Psychological Tests Used for the Evaluation of Brain Injury. Psychological Monographs 60: i. [Google Scholar] [CrossRef]
- Bak, Thomas H. 2015. Beyond a Simple ‘Yes’ and ‘No’. Cortex 73: 332–33. [Google Scholar] [CrossRef] [PubMed]
- Bak, Thomas H., and Suvarna Alladi. 2016. Bilingualism, Dementia and the Tale of Many Variables: Why We Need to Move beyond the Western World. Commentary on Lawton et Al. (2015) and Fuller-Thomson (2015). Cortex 74: 315–17. [Google Scholar] [CrossRef]
- Bartolotti, James, Viorica Marian, Scott R. Schroeder, and Anthony Shook. 2011. Bilingualism and Inhibitory Control Influence Statistical Learning of Novel Word Forms. Frontiers in Psychology 2: 1–10. [Google Scholar] [CrossRef] [PubMed]
- Bialystok, Ellen. 2009. Bilingualism: The Good, the Bad, and the Indifferent. Bilingualism: Language and Cognition 12: 3–11. [Google Scholar] [CrossRef]
- Bialystok, Ellen. 2010. Global-Local and Trail-Making Tasks by Monolingual and Bilingual Children: Beyond Inhibition. Developmental Psychology 46: 93–105. [Google Scholar] [CrossRef]
- Bialystok, Ellen, Raymond Klein, Fergus I.M. Craik, and Mythili Viswanathan. 2004. Bilingualism, Aging, and Cognitive Control: Evidence from the Simon Task. Psychology and Aging 19: 290–303. [Google Scholar] [CrossRef]
- Blackburn, Harold L., and Arthur L. Benton. 1957. Revised Administration and Scoring of the Digit Span Test. Journal of Consulting Psychology 21: 139–43. [Google Scholar] [CrossRef] [PubMed]
- Blom, Elma, Aylin C. Küntay, Marielle Messer, Josje Verhagen, and Paul Leseman. 2014. The Benefits of Being Bilingual: Working Memory in Bilingual Turkish–Dutch Children. Journal of Experimental Child Psychology 128: 105–19. [Google Scholar] [CrossRef] [PubMed]
- Bonifacci, Paola, Lucia Giombini, Stéphanie Bellocchi, and Silvana Contento. 2011. Speed of Processing, Anticipation, Inhibition and Working Memory in Bilinguals. Developmental Science 14: 256–69. [Google Scholar] [CrossRef] [PubMed]
- Bunk, Oliver, and Heike Wiese. 2024. Contact Dialects in Urban Youth Culture and Beyond. In The Routledge Handbook of Language and Youth Culture, 1st ed. Edited by Bente A. Svendsen and Rickard Jonsson. New York: Routledge, pp. 333–46. [Google Scholar] [CrossRef]
- Cambridge Cognition. 2019. CANTAB® [Cognitive Assessment Software]. Available online: www.cantab.com (accessed on 1 March 2020).
- Carlson, Stephanie M., and Andrew N. Meltzoff. 2008. Bilingual Experience and Executive Functioning in Young Children. Developmental Science 11: 282–98. [Google Scholar] [CrossRef] [PubMed]
- Cavallaro, Francesco, and Ng Bee Chin. 2014. Language in Singapore: From Multilingualism to English Plus. In Challenging the Monolingual Mindset. Edited by John Hajek and Yvette Slaughter. Bristol: Channel View Publications, pp. 33–48. [Google Scholar] [CrossRef]
- Cockcroft, Kate. 2022. Working Memory in Multilinguals: Factors That Assist and Impede. International Journal of Multilingualism 21: 997–1013. [Google Scholar] [CrossRef]
- Cools, Roshan, Luke Clark, Adrian M. Owen, and Trevor W. Robbins. 2002. Defining the Neural Mechanisms of Probabilistic Reversal Learning Using Event-Related Functional Magnetic Resonance Imaging. The Journal of Neuroscience 22: 4563–67. [Google Scholar] [CrossRef] [PubMed]
- Council of Europe. 2020. Common European Framework of Reference for Languages: Learning, Teaching, Assessment—Companion Volume. Edited by Council of Europe Publishing. Available online: www.coe.int/lang-cefr (accessed on 10 March 2020).
- Cunnings, Ian. 2012. An Overview of Mixed-Effects Statistical Models for Second Language Researchers. Second Language Research 28: 369–82. [Google Scholar] [CrossRef]
- Dixon, L. Quentin. 2005. Bilingual Education Policy in Singapore: An Analysis of Its Sociohistorical Roots and Current Academic Outcomes. International Journal of Bilingual Education and Bilingualism 8: 25–47. [Google Scholar] [CrossRef]
- Dormann, Carsten F., Jane Elith, Sven Bacher, Carsten Buchmann, Gudrun Carl, Gabriel Carré, Jaime R. García Marquéz, Bernd Gruber, Bruno Lafourcade, Pedro J. Leitão, and et al. 2013. Collinearity: A Review of Methods to Deal with It and a Simulation Study Evaluating Their Performance. Ecography 36: 27–46. [Google Scholar] [CrossRef]
- Duñabeitia, Jon Andoni, Juan Andrés Hernández, Eneko Antón, Pedro Macizo, Adelina Estévez, Luis J. Fuentes, and Manuel Carreiras. 2014. The Inhibitory Advantage in Bilingual Children Revisited. Experimental Psychology 61: 234–51. [Google Scholar] [CrossRef]
- Estanga, Ainara, Mirian Ecay-Torres, Almudena Ibañez, Andrea Izagirre, Jorge Villanua, Maite Garcia-Sebastian, M. Teresa Iglesias Gaspar, Ane Otaegui-Arrazola, Ane Iriondo, Monserrat Clerigue, and et al. 2017. Beneficial Effect of Bilingualism on Alzheimer’s Disease CSF Biomarkers and Cognition. Neurobiology of Aging 50: 144–51. [Google Scholar] [CrossRef] [PubMed]
- Filippi, Roberto, Andrea Ceccolini, Elizabeth Booth, Chen Shen, Michael S. C. Thomas, Mireille B. Toledano, and Iroise Dumontheil. 2022. Modulatory Effects of SES and Multilinguistic Experience on Cognitive Development: A Longitudinal Data Analysis of Multilingual and Monolingual Adolescents from the SCAMP Cohort. International Journal of Bilingual Education and Bilingualism 25: 3489–506. [Google Scholar] [CrossRef] [PubMed]
- Finance Center for South-South Cooperation. n.d. Global South Countries (Group of 77 and China)—Partnership Program—The Finance Center for South-South Cooperation. Available online: http://www.fc-ssc.org/en/partnership_program/south_south_countries (accessed on 1 October 2023).
- Fuller-Thomson, Esme, and Diana Kuh. 2014. The Healthy Migrant Effect May Confound the Link between Bilingualism and Delayed Onset of Alzheimer’s Disease. Cortex; a Journal Devoted to the Study of the Nervous System and Behavior 52: 128–30. [Google Scholar] [CrossRef] [PubMed]
- Gallo, Federico, Nikolay Novitskiy, Andriy Myachykov, and Yury Shtyrov. 2021. Individual Differences in Bilingual Experience Modulate Executive Control Network and Performance: Behavioral and Structural Neuroimaging Evidence. Bilingualism: Language and Cognition 24: 293–304. [Google Scholar] [CrossRef]
- Giorgio, Joseph, Vasilis M. Karlaftis, Rui Wang, Yuan Shen, Peter Tino, Andrew Welchman, and Zoe Kourtzi. 2018. Functional Brain Networks for Learning Predictive Statistics. Cortex 107: 204–19. [Google Scholar] [CrossRef]
- Goldberg, Wendy A., Jo Ann Prause, Rachel Lucas-Thompson, and Amy Himsel. 2008. Maternal Employment and Children’s Achievement in Context: A Meta-Analysis of Four Decades of Research. Psychological Bulletin 134: 77–108. [Google Scholar] [CrossRef] [PubMed]
- Gonthier, Corentin. 2022. Cross-Cultural Differences in Visuo-Spatial Processing and the Culture-Fairness of Visuo-Spatial Intelligence Tests: An Integrative Review and a Model for Matrices Tasks. Cognitive Research: Principles and Implications 7: 11. [Google Scholar] [CrossRef] [PubMed]
- Gorilla. 2022. Available online: https://www.gorilla.sc (accessed on 1 January 2022).
- Gough, Vicky. 2023. The British and Their Secret Language Regrets|British Council. British Council. Available online: https://www.britishcouncil.org/voices-magazine/british-and-their-secret-language-regret (accessed on 15 February 2024).
- Grant, David A., and Esta Berg. 1948. A Behavioral Analysis of Degree of Reinforcement and Ease of Shifting to New Responses in a Weigl-Type Card-Sorting Problem. Journal of Experimental Psychology 38: 404–11. [Google Scholar] [CrossRef]
- Green, David W., and Jubin Abutalebi. 2013. The Adaptive Control Hypothesis. Journal of Cognitive Psychology 25: 515–30. [Google Scholar] [CrossRef]
- Grosjean, François. 2021. The Extent of Bilingualism. In Life as a Bilingual. Cambridge: Cambridge University Press, pp. 27–39. [Google Scholar] [CrossRef]
- Gullifer, Jason W., and Debra Titone. 2018. Compute Language Entropy with {languageEntropy}. Available online: https://github.com/jasongullifer/languageEntropy (accessed on 5 May 2021).
- Gullifer, Jason W., and Debra Titone. 2020. Characterizing the Social Diversity of Bilingualism Using Language Entropy. Bilingualism: Language and Cognition 23: 283–94. [Google Scholar] [CrossRef]
- Gullifer, Jason W., Xiaoqian J. Chai, Veronica Whitford, Irina Pivneva, Shari Baum, Denise Klein, and Debra Titone. 2018. Bilingual Experience and Resting-State Brain Connectivity: Impacts of L2 Age of Acquisition and Social Diversity of Language Use on Control Networks. Neuropsychologia 117: 123–34. [Google Scholar] [CrossRef] [PubMed]
- Hartanto, Andree, and Hwajin Yang. 2016. Disparate Bilingual Experiences Modulate Task-Switching Advantages: A Diffusion-Model Analysis of the Effects of Interactional Context on Switch Costs. Cognition 150: 10–19. [Google Scholar] [CrossRef] [PubMed]
- Hernández, Mireia, Albert Costa, Luis J. Fuentes, Ana B. Vivas, and Núria Sebastián-Gallés. 2010. The Impact of Bilingualism on the Executive Control and Orienting Networks of Attention. Bilingualism: Language and Cognition 13: 315–25. [Google Scholar] [CrossRef]
- Holm, Sture. 1979. A Simple Sequentially Rejective Multiple Test Procedure. Scandinavian Journal of Statistics 6: 65–70. [Google Scholar]
- I-ABC: A Personalised Learning Study—Adaptive Brain Lab. n.d. Available online: https://www.abg.psychol.cam.ac.uk/participation/iabc (accessed on 1 March 2020).
- Inquisit 6. 2021. Available online: https://www.millisecond.com (accessed on 1 January 2021).
- Jevtović, Mina, Jon Andoni Duñabeitia, and Angela de Bruin. 2020. How Do Bilinguals Switch between Languages in Different Interactional Contexts? A Comparison between Voluntary and Mandatory Language Switching. Bilingualism: Language and Cognition 23: 401–13. [Google Scholar] [CrossRef]
- Jia, Fanlu. 2022. Effect of Second Language Proficiency on Inhibitory Control in the Simon Task: An FMRI Study. Frontiers in Psychology 13: 812322. [Google Scholar] [CrossRef]
- Jiao, Lu, Yuanyue Zhang, Patrick Plummer, Cong Liu, and Baoguo Chen. 2019. The Influence of Bilingual Language Experience on Executive Control: An ERPs Study. Journal of Neurolinguistics 51: 42–52. [Google Scholar] [CrossRef]
- Jylkkä, Jussi, Anna Soveri, Jenny Wahlström, Minna Lehtonen, Antoni Rodríguez-Fornells, and Matti Laine. 2017. Relationship between Language Switching Experience and Executive Functions in Bilinguals: An Internet-Based Study. Journal of Cognitive Psychology 29: 404–19. [Google Scholar] [CrossRef]
- Jylkkä, Jussi, Matti Laine, and Minna Lehtonen. 2021. Does Language Switching Behavior Rely on General Executive Functions? Bilingualism: Language and Cognition 24: 583–95. [Google Scholar] [CrossRef]
- Jylkkä, Jussi, Minna Lehtonen, Fred Lindholm, Anna Kuusakoski, and Matti Laine. 2018. The relationship between general executive functions and bilingual switching and monitoring in language production. Bilingualism: Language and Cognition 21: 505–22. [Google Scholar] [CrossRef]
- Karlaftis, Vasilis M., Joseph Giorgio, Petra E. Vértes, Rui Wang, Yuan Shen, Peter Tino, Andrew E. Welchman, and Zoe Kourtzi. 2019. Multimodal Imaging of Brain Connectivity Reveals Predictors of Individual Decision Strategy in Statistical Learning. Nature Human Behaviour 3: 297–307. [Google Scholar] [CrossRef] [PubMed]
- Karlaftis, Vasilis M., Rui Wang, Yuan Shen, Peter Tino, Guy Williams, Andrew E. Welchman, and Zoe Kourtzi. 2018. White-Matter Pathways for Statistical Learning of Temporal Structures. ENeuro 5: 382–99. [Google Scholar] [CrossRef]
- Kaufman, Alan S., Dawn P. Flanagan, Vincent C. Alfonso, and Jennifer T. Mascolo. 2006. Test Review: Wechsler Intelligence Scale for Children, Fourth Edition (WISC-IV). Journal of Psychoeducational Assessment 24: 278–95. [Google Scholar] [CrossRef]
- Kehagia, Angie A., Rong Ye, Dan W. Joyce, Orla M. Doyle, James B. Rowe, and Trevor W. Robbins. 2017. Parsing the Roles of the Frontal Lobes and Basal Ganglia in Task Control Using Multivoxel Pattern Analysis. Journal of Cognitive Neuroscience 29: 1390–1401. [Google Scholar] [CrossRef] [PubMed]
- Kerrigan, Lucy, Michael S. C. Thomas, Peter Bright, and Roberto Filippi. 2017. Evidence of an Advantage in Visuo-Spatial Memory for Bilingual Compared to Monolingual Speakers. Bilingualism: Language and Cognition 20: 602–12. [Google Scholar] [CrossRef]
- Kirk, Neil W., Linda Fiala, Kenneth C. Scott-Brown, and Vera Kempe. 2014. No Evidence for Reduced Simon Cost in Elderly Bilinguals and Bidialectals. Journal of Cognitive Psychology 26: 640–48. [Google Scholar] [CrossRef] [PubMed]
- Kopp, Bruno. 2011. Neuropsychologists Must Keep Their Eyes on the Reliability of Difference Measures. Journal of the International Neuropsychological Society 17: 562–63. [Google Scholar] [CrossRef] [PubMed]
- Kuhn, Max, and Kjell Johnson. 2013. Applied Predictive Modeling. New York, Dordrecht, London and Berlin/Heidelberg: Dordrecht: London: Berlin/Heidelberg: Springer. [Google Scholar] [CrossRef]
- Lai, Gabrielle, and Beth A. O’Brien. 2020. Examining Language Switching and Cognitive Control Through the Adaptive Control Hypothesis. Frontiers in Psychology 11: 525661. [Google Scholar] [CrossRef]
- Laine, Matti, and Minna Lehtonen. 2018. Cognitive Consequences of Bilingualism: Where to Go from Here? Language, Cognition and Neuroscience 33: 1205–12. [Google Scholar] [CrossRef]
- Leimgruber, Jakob R. E. 2013. The Management of Multilingualism in a City-State: Language Policy in Singapore. In Multilingualism and Language Diversity in Urban Areas: Acquisition, Identities, Space, Education. Edited by Peter Siemund, Ingrid Gogolin, Monika Schulz and Julia Davydova. Amsterdam: John Benjamins, pp. 227–56. [Google Scholar]
- Leong, Victoria, Kausar Raheel, Jia Yi Sim, Kriti Kacker, Vasilis M. Karlaftis, Chrysoula Vassiliu, Kastoori Kalaivanan, S. H. Annabel Chen, Trevor W. Robbins, Barbara J. Sahakian, and et al. 2022. A New Remote Guided Method for Supervised Web-Based Cognitive Testing to Ensure High-Quality Data: Development and Usability Study. Journal of Medical Internet Research 24: e28368. [Google Scholar] [CrossRef]
- Li, Xiaoqian, Kwun Kei Ng, Joey Ju Yu Wong, Jia Wen Lee, Juan Helen Zhou, and W. Quin Yow. 2021. Bilingual Language Entropy Influences Executive Functions through Functional Connectivity and Signal Variability. Brain and Language 222: 105026. [Google Scholar] [CrossRef] [PubMed]
- Luk, Gigi, and Ellen Bialystok. 2013. Bilingualism Is Not a Categorical Variable: Interaction between Language Proficiency and Usage. Journal of Cognitive Psychology 25: 605–21. [Google Scholar] [CrossRef]
- Luk, Gigi, Eric De Sa, and Ellen Bialystok. 2011. Is There a Relation between Onset Age of Bilingualism and Enhancement of Cognitive Control? Bilingualism: Language and Cognition 14: 588–95. [Google Scholar] [CrossRef]
- Luo, Lin, Fergus I. M. Craik, Sylvain Moreno, and Ellen Bialystok. 2013. Bilingualism Interacts with Domain in a Working Memory Task: Evidence from Aging. Psychology and Aging 28: 28–34. [Google Scholar] [CrossRef]
- Makoni, Sinfree, Anna Kaiper-Marquez, and Lorato Mokwena. 2022. The Routledge Handbook of Language and the Global South-s. London: Routledge. [Google Scholar]
- Miyake, Akira, Naomi P. Friedman, Michael J. Emerson, Alexander H. Witzki, Amy Howerter, and Tor D. Wager. 2000. The Unity and Diversity of Executive Functions and Their Contributions to Complex “Frontal Lobe” Tasks: A Latent Variable Analysis. Cognitive Psychology 41: 49–100. [Google Scholar] [CrossRef] [PubMed]
- Morales, Julia, Alejandra Calvo, and Ellen Bialystok. 2013. Working Memory Development in Monolingual and Bilingual Children. Journal of Experimental Child Psychology 114: 187–202. [Google Scholar] [CrossRef]
- Office for National Statistics. 2022. Language, England and Wales: Census 2021. November. Available online: https://www.ons.gov.uk/peoplepopulationandcommunity/culturalidentity/language/bulletins/languageenglandandwales/census2021 (accessed on 15 February 2023).
- Ong, Kenneth Keng Wee, and Lawrence Jun Zhang. 2010. Metalinguistic Filters within the Bilingual Language Faculty: A Study of Young English-Chinese Bilinguals. Journal of Psycholinguistic Research 39: 243–72. [Google Scholar] [CrossRef]
- Onnis, Luca, Win Ee Chun, and Matthew Lou-Magnuson. 2018. Improved Statistical Learning Abilities in Adult Bilinguals. Bilingualism: Language and Cognition 21: 427–33. [Google Scholar] [CrossRef]
- Ooi, Seok Hui, Winston D. Goh, Antonella Sorace, and Thomas H. Bak. 2018. From Bilingualism to Bilingualisms: Bilingual Experience in Edinburgh and Singapore Affects Attentional Control Differently. Bilingualism 21: 867–79. [Google Scholar] [CrossRef]
- Paap, Kenneth R., and Zachary I. Greenberg. 2013. There Is No Coherent Evidence for a Bilingual Advantage in Executive Processing. Cognitive Psychology 66: 232–58. [Google Scholar] [CrossRef]
- Paap, Kenneth R., Hunter A. Johnson, and Oliver Sawi. 2014. Are Bilingual Advantages Dependent upon Specific Tasks or Specific Bilingual Experiences? Journal of Cognitive Psychology 26: 615–39. [Google Scholar] [CrossRef]
- Potter, Christine E., Tianlin Wang, and Jenny R. Saffran. 2017. Second Language Experience Facilitates Statistical Learning of Novel Linguistic Materials. Cognitive Science 41: 913–27. [Google Scholar] [CrossRef] [PubMed]
- Prior, Anat, and Brian Macwhinney. 2010. A Bilingual Advantage in Task Switching. Bilingualism: Language and Cognition 13: 253–62. [Google Scholar] [CrossRef] [PubMed]
- R Core Team. 2021. R: A Language and Environment for Statistical Computing. Foundation for Statistical Computing. Vienna: R Core Team. [Google Scholar]
- Raven, John. 2000. The Raven’s Progressive Matrices: Change and Stability over Culture and Time. Cognitive Psychology 41: 1–48. [Google Scholar] [CrossRef] [PubMed]
- Raven, John C., John Hugh Court, and John Earle Raven. 2000. Standard Progressive Matrices. London: Psychology Press. [Google Scholar]
- Robbins, Trevor W., Merle James, Adrian M. Owen, Barbara J. Sahakian, Lynn McInnes, and Patrick Rabbitt. 1994. Cambridge Neuropsychological Test Automated Battery (CANTAB): A Factor Analytic Study of a Large Sample of Normal Elderly Volunteers. Dementia 5: 266–81. [Google Scholar] [CrossRef] [PubMed]
- Siemund, Peter, Monika Edith Schulz, and Martin Schweinberger. 2014. Studying the Linguistic Ecology of Singapore: A Comparison of College and University Students. World Englishes 33: 340–62. [Google Scholar] [CrossRef]
- Soveri, Anna, Antoni Rodriguez-Fornells, and Matti Laine. 2011. Is There a Relationship between Language Switching and Executive Functions in Bilingualism? Introducing a within Group Analysis Approach. Frontiers in Psychology 2: 10197. [Google Scholar] [CrossRef]
- Stasenko, Alena, Georg E. Matt, and Tamar H. Gollan. 2017. A Relative Bilingual Advantage in Switching with Preparation: Nuanced Explorations of the Proposed Association Between Bilingualism and Task Switching. Journal of Experimental Psychology. General 146: 1527. [Google Scholar] [CrossRef]
- Stroop, J. Ridley. 1935. Studies of Interference in Serial Verbal Reactions. Journal of Experimental Psychology 18: 643. [Google Scholar] [CrossRef]
- Sullivan, Margot D., Yolanda Prescott, Devora Goldberg, and Ellen Bialystok. 2016. Executive Control Processes in Verbal and Nonverbal Working Memory: The Role of Aging and Bilingualism. Linguistic Approaches to Bilingualism 6: 147–70. [Google Scholar] [CrossRef]
- Torres, Valeria L., Mónica Rosselli, David A. Loewenstein, Merike Lang, Idaly Vélez-Uribe, Fernanda Arruda, Joshua Conniff, Rosie E. Curiel, Maria T. Greig, Warren W. Barker, and et al. 2022. The Contribution of Bilingualism to Cognitive Functioning and Regional Brain Volume in Normal and Abnormal Aging. Bilingualism: Language and Cognition 25: 337–56. [Google Scholar] [CrossRef]
- Venables, William N., and Brian D. Ripley. 2002. Modern Applied Statistics with S. New York: Springer. [Google Scholar]
- Verhagen, Josje, and Elise de Bree. 2021. Effects of Bilingualism on Statistical Learning in Preschoolers. Linguistic Approaches to Bilingualism 11: 611–39. [Google Scholar] [CrossRef]
- Verreyt, Nele, Evy Woumans, Davy Vandelanotte, Arnaud Szmalec, and Wouter Duyck. 2016. The Influence of Language-Switching Experience on the Bilingual Executive Control Advantage. Bilingualism: Language and Cognition 19: 181–90. [Google Scholar] [CrossRef]
- Walker, Alexandra J., Jennifer Batchelor, and Arthur Shores. 2009. Effects of Education and Cultural Background on Performance on WAIS-III, WMS-III, WAIS-R and WMS-R Measures: Systematic Review. Australian Psychologist 44: 216–23. [Google Scholar] [CrossRef]
- Wang, Rui, Yuan Shen, Peter Tino, Andrew E. Welchman, and Zoe Kourtzi. 2017a. Learning Predictive Statistics from Temporal Sequences: Dynamics and Strategies. Journal of Vision 17: 1–16. [Google Scholar] [CrossRef] [PubMed]
- Wang, Rui, Yuan Shen, Peter Tino, Andrew E. Welchman, and Zoe Kourtzi. 2017b. Learning Predictive Statistics: Strategies and Brain Mechanisms. The Journal of Neuroscience 37: 8412. [Google Scholar] [CrossRef] [PubMed]
- Wechsler, David. 2011. Wechsler Abbreviated Scale of Intelligence–Second Edition (WASI-II). San Antonio: NCS Pearson. [Google Scholar]
- Wickham, Hadley. 2016. Ggplot2: Elegant Graphics for Data Analysis. New York: Springer. [Google Scholar]
- Wigdorowitz, Mandy, Ana I. Pérez, and Ianthi M. Tsimpli. 2020. A Holistic Measure of Contextual and Individual Linguistic Diversity. International Journal of Multilingualism 20: 469–87. [Google Scholar] [CrossRef]
- Wigdorowitz, Mandy, Ana I. Pérez, and Ianthi M. Tsimpli. 2022. Sociolinguistic Context Matters: Exploring Differences in Contextual Linguistic Diversity in South Africa and England. International Multilingual Research Journal 16: 345–64. [Google Scholar] [CrossRef]
- World Population Review. 2023. Global South Countries 2023. Available online: https://worldpopulationreview.com/country-rankings/global-south-countries (accessed on 15 March 2023).
- Woumans, Evy, Shauni Van Herck, and Esli Struys. 2019. Shifting Gear in the Study of the Bilingual Advantage: Language Switching Examined as a Possible Moderator. Behavioral Sciences 9: 86. [Google Scholar] [CrossRef]
- Xie, Wenhan, and Francesco Cavallaro. 2016. Attitudes towards Mandarin–English Bilingualism: A Study of Chinese Youths in Singapore. Journal of Multilingual and Multicultural Development 37: 628–41. [Google Scholar] [CrossRef]
- Yang, Sujin, Hwajin Yang, and Barbara Lust. 2011. Early Childhood Bilingualism Leads to Advances in Executive Attention: Dissociating Culture and Language. Bilingualism: Language and Cognition 14: 412–22. [Google Scholar] [CrossRef]
- Yin, Jing, Connie Qun Guan, Elaine R. Smolen, Esther Geva, and Wanjin Meng. 2022. Does Early Exposure to Chinese–English Biliteracy Enhance Cognitive Skills? Frontiers in Psychology 13: 2074. [Google Scholar] [CrossRef] [PubMed]
- Yow, W. Quin, and Xiaoqian Li. 2015. Balanced Bilingualism and Early Age of Second Language Acquisition as the Underlying Mechanisms of a Bilingual Executive Control Advantage: Why Variations in Bilingual Experiences Matter. Frontiers in Psychology 6: 123975. [Google Scholar] [CrossRef] [PubMed]


| Background Measure | UK | Singapore | ||||
|---|---|---|---|---|---|---|
| Mean | SD | Mean | SD | t | p | |
| Age | 24.0 | 3.18 | 21.3 | 2.15 | −4.36 | <0.0001 |
| SES a | 0.59 | 0.17 | 0.45 | 0.17 | −3.76 | 0.0003 |
| NVIQ b | 0.65 | 0.24 | 0.48 | 0.24 | −3.31 | 0.001 |
| VIQ c | 63.5 | 10.5 | 51.7 | 7.89 | −5.68 | <0.0001 |
| Background Measure | UK | Singapore | ||
|---|---|---|---|---|
| N | N | X2 | p | |
| Female | 33 (of 51) | 27 (of 36) | 1.05 | 0.307 |
| English-dominant (use) | 42 (of 51) | 31 (of 36) | 0.22 | 0.638 |
| Videogame usage | 18 (of 51) | 20 (of 36) | 3.52 | 0.061 |
| UK | Singapore | |||||
|---|---|---|---|---|---|---|
| Mean | SD | Mean | SD | MW U | p | |
| Age of L2 Acquisition (L2 AoA) (in years) | 8.47 | 4.24 | 2.98 | 1.95 | 178 | <0.0001 |
| Usage1 | 0.87 | 0.15 | 0.81 | 0.16 | ||
| Usage2 | 0.13 | 0.15 | 0.19 | 0.16 | ||
| Proficiency1 | 5.98 | 0.07 | 5.97 | 0.14 | ||
| Proficiency2 | 4.24 | 2.11 | 4.39 | 1.11 | ||
| Balanced Usage (Usage1 − Usage2) a | 0.75 | 0.30 | 0.62 | 0.32 | 688 | 0.046 |
| Balanced Proficiency (Proficiency1 − Proficiency2) b | 1.74 | 2.12 | 1.57 | 1.11 | 1038.5 | 0.295 |
| Language Entropy c | 0.50 | 0.44 | 0.64 | 0.39 | 1068 | 0.196 |
| Single-Language d | 3.86 | 1.22 | 3.89 | 1.01 | 883.5 | 0.756 |
| Dual-Language d | 2.67 | 1.28 | 3.36 | 0.90 | 1205.5 | 0.011 |
| Dense Code-Switching d | 2.31 | 1.14 | 3.19 | 0.86 | 1327.5 | 0.0003 |
| 1 | 2 | 3 | 4 | 5 | 6 | 7 | |
|---|---|---|---|---|---|---|---|
| Balanced Usage | – | ||||||
| Language Entropy | −0.85 *** | – | |||||
| Balanced Proficiency | 0.54 *** | −0.68 *** | – | ||||
| L2 AoA | 0.11 | −0.20 | 0.45 * | – | |||
| Single-Language | 0.03 | 0.02 | 0.02 | −0.02 | – | ||
| Dual-Language | −0.34 | 0.34 | −0.32 | −0.35 | 0.05 | – | |
| Code-Switching | −0.33 | 0.28 | −0.27 | −0.35 | −0.10 | 0.80 *** | – |
| 1 | 2 | 3 | 4 | 5 | 6 | 7 | |
|---|---|---|---|---|---|---|---|
| Balanced Usage | – | ||||||
| Language Entropy | −0.84 *** | – | |||||
| Balanced Proficiency | 0.13 | −0.17 | – | ||||
| L2 AoA | −0.08 | −0.03 | 0.18 | – | |||
| Single-Language | 0.03 | 0.14 | −0.12 | −0.07 | – | ||
| Dual-Language | −0.36 | 0.35 | −0.16 | −0.05 | −0.24 | – | |
| Code-Switching | −0.41 | 0.26 | −0.17 | 0.02 | −0.14 | 0.69 *** | – |
| Variable | TSS Accuracy Cost | SWM Strategy | SL PI |
|---|---|---|---|
| β | β | β | |
| (Intercept) | −0.082 | 26.193 *** | −0.184 |
| L2 AoA | – | −0.095 | – |
| Balanced Proficiency | – | – | −0.022 * |
| Code-Switching | – | – | −0.021 |
| VIQ | 0.003 ** | −0.081 | 0.006 ** |
| NVIQ | – | −3.867 | – |
| SES | – | −9.915 ** | – |
| R2 | 0.14 | 0.29 | 0.29 |
| F | 7.84 ** | 4.13 ** | 6.26 ** |
| Variable | TMT B:A Ratio | IED Total Errors | IED ED Errors | Stroop RT Cost | SWM Strategy | BDS | SL PI |
|---|---|---|---|---|---|---|---|
| β | β | β | β | β | β | β | |
| (Intercept) | 0.86 *** | 0.39 | −24.93 * | −35.41 | 11.84 *** | 10.66 *** | −0.23 *** |
| L2 AoA | 0.06 | – | – | – | – | – | – |
| Balanced Proficiency | 0.12 * | – | – | 29.57 * | – | – | – |
| Language Entropy | – | – | 11.37 *** | – | −3.43 | – | 0.18 *** |
| Single-Language Context | – | – | – | 56.83 *** | – | – | – |
| Code-Switching | – | – | – | 43.94 * | – | −0.94 | – |
| VIQ | – | 0.22 ** | – | – | – | – | – |
| NVIQ | – | – | −11.08 * | – | – | 6.68 ** | – |
| SES | – | – | – | – | 9.47 * | −4.50 | 0.44 *** |
| Age | – | – | 1.36 ** | – | – | – | – |
| R2 | 0.26 | 0.17 | 0.45 | 0.39 | 0.27 | 0.20 | 0.44 |
| F | 5.90 ** | 6.02 * | 8.62 ** | 6.75 ** | 6.01 ** | 4.56 ** | 12.75 *** |
Disclaimer/Publisher’s Note: The statements, opinions and data contained in all publications are solely those of the individual author(s) and contributor(s) and not of MDPI and/or the editor(s). MDPI and/or the editor(s) disclaim responsibility for any injury to people or property resulting from any ideas, methods, instructions or products referred to in the content. |
© 2024 by the authors. Licensee MDPI, Basel, Switzerland. This article is an open access article distributed under the terms and conditions of the Creative Commons Attribution (CC BY) license (https://creativecommons.org/licenses/by/4.0/).
Share and Cite
Vassiliu, C.; Leong, V.; Hendriks, H. The Influence of Multilingual Experience on Executive Function and Structure Learning: Effects in Young Adults in the UK and Singapore. Languages 2024, 9, 136. https://doi.org/10.3390/languages9040136
Vassiliu C, Leong V, Hendriks H. The Influence of Multilingual Experience on Executive Function and Structure Learning: Effects in Young Adults in the UK and Singapore. Languages. 2024; 9(4):136. https://doi.org/10.3390/languages9040136
Chicago/Turabian StyleVassiliu, Chrysoula, Victoria Leong, and Henriette Hendriks. 2024. "The Influence of Multilingual Experience on Executive Function and Structure Learning: Effects in Young Adults in the UK and Singapore" Languages 9, no. 4: 136. https://doi.org/10.3390/languages9040136
APA StyleVassiliu, C., Leong, V., & Hendriks, H. (2024). The Influence of Multilingual Experience on Executive Function and Structure Learning: Effects in Young Adults in the UK and Singapore. Languages, 9(4), 136. https://doi.org/10.3390/languages9040136