Abstract
As a result of the COVID-19 pandemic, governments and central banks worldwide implemented a wide range of policies to support households and businesses, among them a series of measures to support the availability of credit. This paper quantitatively assesses how monetary and regulatory policy measures helped lessen the effect of the economic downturn on bank credit to the private sector, and on non-performing loans, and focuses on small EMEs, which have been the subject of little analysis in this regard. Specifically, it looks at a number of countries in the Central American region. The resulting estimates show that the policies implemented substantially reduced the negative impact of the crisis on bank credit and nonperforming loans, and that the measures largely responsible for this mitigation were regulatory rather than monetary.
1. Introduction
The COVID-19 pandemic resulted, first, in a global health emergency and then in a world economic downturn that jeopardized the standard of living of every single country in 2020. In such a situation, improving credit conditions is regarded as an effective tool for mitigating the impact of the crisis on billions of households and firms. In theory, improved access to credit (1) enables households to access funds and, therefore, maintain their consumption, and (2) enables firms to pay salaries, suppliers, and fixed costs. These measures imply the gaining of time for mobility to return and, with it, the capacity to generate revenues to cover their liabilities. Several countries implemented a series of policies intended to maintain the proper functioning of the financial system. In this paper, we evaluate whether or not such policies were successful in supporting bank credit to the private sector (hereafter, private credit) by analyzing a subgroup of small emerging market economies, and also quantifying the contribution of different policies, both monetary and regulatory.
The subgroup of countries studied here belong to the region of Central America.1 They are particularly useful for studying the effect of monetary and financial policies on credit because:
- (i)
- The effect of these policies can be more clearly identified, as its risk of mixing with the impact of other policies to support the economy is small due to the scarcity and very narrow scope of the latter. The IMF (2022) estimates that the fiscal response to the COVID-19 crisis, through additional spending and foregone revenue in some countries of Central America in a two year period, was less than 1.5% of GDP (Costa Rica (1.5%) and Nicaragua (1.3%)), and in others, between 2.5 and 3.5% of GDP (Guatemala (3.3%), Honduras (2.7%), El Salvador (2.6%), the Dominican Republic (3.3%), and Panama (3.4%)). This is in contrast to developed economies, where, for example, in the US, the figure was 25% of GDP; in Germany, 14%; Japan, 17%; and the United Kingdom, 16%.
- (ii)
- Their financial data are public, standardized (and thus, comparable), and robust in terms of frequency and length. They provide and disclose their data through the Central American Monetary Council (CMC),2 which gathers and organizes the data following the methodologies of the International Monetary Fund (IMF).
- (iii)
- They implemented a number of monetary and regulatory policies, which will be described in Section 3.
Studying the effects of policies to maintain credit, in the private sector in Central America, is also relevant because, in low-income countries, the productive sector is predominantly made up of small firms (Poschke 2018) with limited access to finance (Beck et al. 2005), and those firms were the most severely affected by the pandemic (Zhang and Sogn-Grundvåg 2022).
This paper investigates how financial and monetary policies can mitigate the adverse effects of the COVID-19 pandemic on the banking system, with a focus on small emerging economies. It aims to separate the effect of monetary stimuli, from that of regulatory relief, on bank lending and loan quality. It also explores the challenges and opportunities for small emerging countries to implement effective regulatory policies that can support credit growth and financial stability during a severe crisis, with limited resources. The paper contributes to the literature on alternative financial policies in small emerging economies and provides policy implications for coping with shocks when resources are limited.
We show that monetary measures, such as reducing reserve requirements and monetary rates, helped mitigate the contraction of private credit. However, the policies that contributed most to this were those that relaxed financial regulatory norms, which also curbed the rise in non-performing loans. Monetary measures, meanwhile, had no significant effect on the latter.
2. Literature Review
Not only are studies estimating the effects of financial policies to support the provision of credit in response to the COVID-19 crisis scarce, but their effect is also inconclusive and they do not include small emerging economies. For example, in an analysis of the US, Duncan et al. (2022) found only a weak association between credit growth and regulatory capital constraints or measures of bank health.3 In contrast, for a sample of 112 large banks across 24 advanced and large emerging market economies, Casanova et al. (2021) claimed that policies to increase the balance sheet capacity of banks (measured by capital on risk-weighted assets and the ratio of loan loss reserves to total assets) during the pandemic had a positive impact on loan growth. For the Euro area, Altavilla et al. (2020) showed that monetary and microprudential policies contributed to supporting bank credit. Falagiarda and Köhler-Ulbrich (2021) suggested that the moderation in bank lending dynamics, since the summer of 2020, has been primarily the result of demand-side factors but that the financial policies contributed to maintaining favorable bank lending conditions, such as low interest rates.
To the best of our knowledge, this paper is the first that aims to disentangle the effects of monetary and regulatory policies during COVID-19 in small emerging economies in Latin America.
It is worth noting that, during a crisis, firms turn to banks for credit (Li et al. 2020), while credit is closely linked to economic activity (and vice versa). For example, Liu and Wang (2014) claim that a downturn in the economy would result in a reduction in the price of assets that would reinforce the credit restrictions faced by productive companies and promote a redistribution of resources from productive to non-productive companies. In this way, a pandemic generates an economic contraction that strengthens credit restrictions, reduces the productivity of companies, and, in consequence, leads to lower economic growth in the following years. Several studies confirm that the COVID-19 crisis negatively impacted the performance of firms (Bartik et al. 2020), increased their financial risks (Almustafa et al. 2023; Beck and Keil 2020) and resulted in spatially concentrated bankruptcies (Ruiz-Marín et al. 2023). However, the pandemic had less of an impact on firms with more financial capacity (Fahlenbrach et al. 2021). The COVID-19 crisis also increased the bank systemic risk across multiple countries (Duan et al. 2021).4
Regarding the determinants of bank credit at country level, the explanatory variables that appear more frequently across studies are GDP, inflation, interest rate, and exchange rate (Ivanovic 2016 provides a description of papers for several countries and regions, and Guo and Stepanyan 2011, an analysis for emerging markets). The models usually try to consider the supply side by including indicators of the banking system, such as number of banks (Jiménez et al. 2012) and funding conditions (Guo and Stepanyan 2011). Analyses of the effects of monetary policy on credit show the relevance of monetary policy rates (Jiménez et al. 2012) and reserve requirements (Bustamante et al. 2019).
The change in non-performing loans (NPLs) is expected to depend mainly on the prevalent economic conditions, but some characteristics of the banking sector should also be relevant. For example, in an analysis of Bosnia and Herzegovina, Žunić et al. (2021) show that NPLs are affected by GDP, presence of COVID-19, and loan loss provisions, and that COVID-19 delayed the effect on NPLs, due to the moratoriums on loans.
3. Exploration of Data
An initial exploration of the data provides encouraging graphical support for our hypothesis. The moderate drop in private credit (Figure 1) and limited hike in non-performing loans (Figure 2) suggest that the monetary and financial measures implemented limited their deterioration.
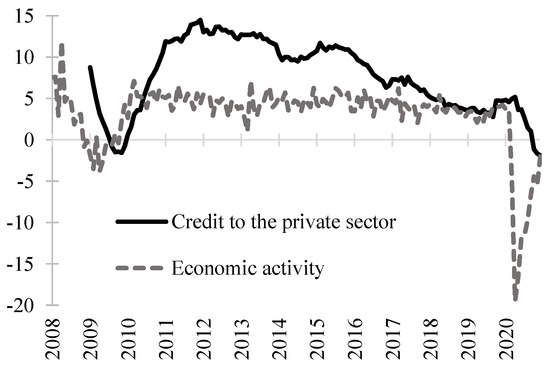
Figure 1.
Monthly index of economic activity and private credit. Annual percentage variation. Note: loans have been aggregated regionally by converting them to USD. Source: Central American Monetary Council.
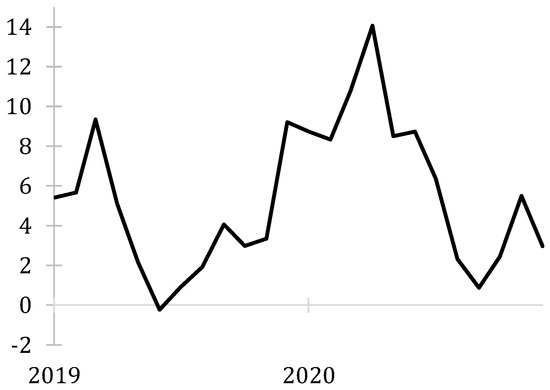
Figure 2.
Non-performing loans. Annual percentage variation. Note: loans have been aggregated regionally, based on the conversion of non-performing loans by country to USD. Non-performing loans are defined as the balance of gross loans that are more than 90 days past due. Source: Central American Monetary Council.
As a result of the COVID-19 pandemic, sanitary measures were implemented, at both a national and international levels, that paralyzed economic activity in the second quarter of 2020, thus affecting foreign inflows from trade and tourism, and various local economic activities. Consequently, the GDP of the Central American region fell by 7.4% in 2020. As infections waned, economic activity in the region gradually resumed in the second half of the year, then in 2021, GDP subsequently recovered its pre-pandemic level (thanks to 10.9% growth).
In contrast to the 2009 crisis, the economic crunch of 2020 was far more severe than the fall in private credit (see Figure 1). As mentioned previously, GDP contracted by 7.4%, while private credit fell by only 1.9% year-on-year (hereafter, YOY). This reduction in credit in 2020 was not very different from that registered in the 2009 crisis (−0.8% YOY), when GDP dropped by 0.2%. At first glance, this suggests that the monetary and financial measures implemented had a favorable impact on cushioning the drop in private credit.
As for non-performing loans, these registered a substantial increase in the first months of the pandemic, but then fell substantially in the second semester. The annual growth rate of non-performing loans rose from 8.3% in February to 14.1% in April, then slowed down from that month on, though they never reached the low of the previous year (see Figure 2).
As a point of reference, the first case of COVID-19 in Central America was recorded in Costa Rica on March 6. On March 11, the World Health Organization declared the disease a pandemic and from that moment onwards, in addition to placing restrictions on movement in order to contain the transmission of the disease, various countries in the region began implementing a series of financial measures, which are described below.5
The financial support measures implemented in the region can be classified as follows:
- (i)
- Monetary policy;
- (ii)
- Regulatory policy in support of the financial system;
- (iii)
- Lines of credit or guarantees through public sector institutions (especially public banks) for the private financial system.
In general, the countries of the region turned to their monetary policy tools, such as reductions in the monetary policy rate and legal reserve requirements. In regulatory matters, they relaxed capital, liquidity, and provision requirements, and implemented moratoriums on loan repayments (interest and capital), the latter without affecting customer credit ratings. This helped customers to avoid defaulting and to have access to credit. In addition, central bank liquidity facilities were introduced, along with lines of credit and guarantees from public banks. Due to space limitations, it is impossible to provide a detailed description of the measures here, and doing so would simply be a repetition of the source information. A detailed description by country and measure can be found in CMC (2020). Table 2.1 in IADB (2022) provides a country-by-country summary of the measures that permit identification of how frequently the different policies were used in the countries of the region, and they are reviewed below:
- Monetary policy—neither El Salvador nor Panama applied any kind of monetary policies (as they are dollarized); Costa Rica, the Dominican Republic, Guatemala, and Honduras cut the monetary rate, reduced the legal reserve requirements, and provided liquidity facilities, while Nicaragua did not provide liquidity.
- Regulatory policies—neither the Dominican Republic nor Panama made changes in their regulatory policies. The remaining countries implemented several strategies, such as relaxing risk criteria and report requirements (Costa Rica, Honduras, and Nicaragua), and capital, liquidity, and provisions norms (Costa Rica, El Salvador, Guatemala, and Honduras). Guatemala allowed extensions to classify loans as uncollectible.
- Household and firm support—all the countries implemented a moratorium for payment of credit installments without affecting ratings.
- El Salvador, Guatemala, Honduras, and Nicaragua provided credit lines to the private financial system.
The countries of the region made significant cuts to their monetary policy rates, taking them to historically low levels in the case of Costa Rica, Guatemala, Honduras, Nicaragua, and the Dominican Republic (0.75%, 1.75%, 3.0%, 3.5%, and 3.0%, respectively). Relaxing the legal reserve requirements resulted in a lower effective reserve ratio in local currency in various countries of the region.6 For example, from 2019 to 2020, it went from 22.3% to 17.5% in El Salvador, 14.2% to 12.9% in Costa Rica, and from 11.5% to 11.0% in the Dominican Republic, with no change in Guatemala and Honduras.
The moratoriums on loan repayments were the only measures implemented on a wide scale, in all the countries of the region. Restructured bank loans came to constitute between 12% and 60% of the total loans, depending on the country (see Figure 3).
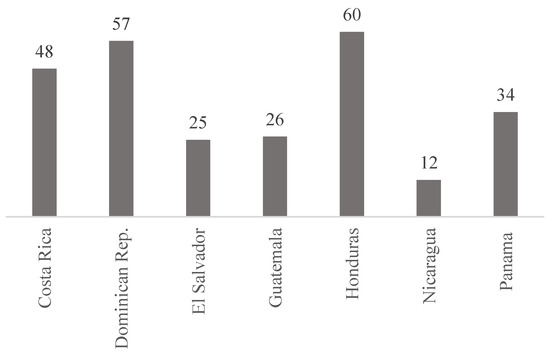
Figure 3.
Restructured loans as a percentage of total bank credit (March 2020–February 2021). Source: Figure 2.6 in IADB (2022).
According to CID-Gallup (2021), over 40% of households in Honduras and Panama indicated that they would not have been able to repay their loans during the pandemic had it not been for repayment flexibilities. In El Salvador, the figure was 36% of households; in Guatemala, 35%; in Costa Rica, 28%; and in the Dominican Republic, 20%.
4. Econometric Strategy
The proposed specification is a means to quantify the contribution of the monetary and regulatory policies implemented during the crisis, as well as to gauge their effectiveness in reducing the risks to financial stability that arose as a result. To do so, we employed two dynamic panel specifications to the model: (1) the determinants of private credit, and (2) the determinants of non-performing loans.
As determinants of private credit, we included the most relevant variables identified in the literature (see Section 2). These are GDP, inflation, exchange rate; interest rate and number of banks on the supply side; and reserve requirements. We added the number of COVID-19 cases to control for the magnitude of the pandemic, and the percentage of loans in moratorium to account for this relevant policy. The specific model and a more detailed description of the variables are shown in Equation (1). The literature suggests that growth of non-performing loans is mainly related to economic conditions. Consequently, as its determinants, we included the macroeconomic variables stated above, but also tested the rest of the variables included in private credit (see Equation (2)).
Table 1 and Table 2 show selected descriptive statistics of the main variables in this study. To be precise, we provide the mean of the variables, private credit; non-performing loans; economic activity index; and delinquency rate, for each country of the Central American region and the Dominican Republic for three periods: (i) the entire sample (January 2008–February 2021), (ii) the year previous to the COVID-19 crisis (January 2019–February 2020), and (iii) the COVID-19 crisis period (March 2020–February 2021). Table 1 presents the variables in growth rates while Table 2 shows the variables in levels. Additional (standard) descriptive statistics can be found in Table A8 in Appendix A (Code and data are available as supplementary material, CODEandDATA.zip).

Table 1.
Selected descriptive statistics: variables in annual growth rates.
Table 2.
Selected descriptive statistics: variables in levels.
The information gathered in these tables reveals several relevant patterns:
- The Private credit growth rate decreased substantially in El Salvador, Honduras, and Panama during the COVID-19 crisis, compared to before the crisis. The decrease was much smaller in the Dominican Republic, and negligible in Guatemala. Costa Rica experienced an increase in the growth rate, while Nicaragua improved its negative growth rate, but still remained negative (see Table 1).
- The NPL growth rate was already negative in El Salvador before the crisis, and became even more negative during the crisis. It turned from positive to negative in Guatemala and Nicaragua; it increased significantly in Panama and the Dominican Republic. The NPL growth rate in Costa Rica was positive and slightly decreased (but still positive) during the crisis (see Table 1).
- The Economic activity indexes show the profound impact of the crisis on the region. Panama suffered the largest drop in production. Costa Rica, El Salvador, Honduras, the Dominican Republic, and Nicaragua also experienced sizeable decreases, but less than in the first case. Guatemala’s economic activity index was the least affected by the crisis (see Table 1 and Table 2).
- The delinquency rates increased slightly in Costa Rica, Honduras, Panama, and the Dominican Republic during the crisis. Only Nicaragua had a substantial increase in the delinquency rate index, whereas El Salvador and Guatemala improved (see Table 2).
4.1. Private Credit
The estimated function of bank credit to the private sector is as follows
where i refers to the country (i.e., the CAPARD economies of Costa Rica, El Salvador, Guatemala, Honduras, Nicaragua, the Dominican Republic, and Panama) and t to the month (the sample spans the period from 2008 to 2021).7 C stands for credit, and indicates the balance of the gross loans granted to the private sector by banking institutions. The interest rate, R, is the weighted active interest rate in domestic currency. LR is the legal reserve ratio and corresponds to the effective legal reserve ratio in domestic currency. The value of the restructured loans in each country is shown in Figure 3, which corresponds to the period from March 2020 (the month this measure was implemented by the authorities, except in Nicaragua, where it was June 2020) until February 2021 (the end of the sample). We included the first lag of credit to control for the persistence of the annual growth rate of credit. The macro controls include the Monthly Index of Economic Activity (Y) (IMAE, a monthly proxy of GDP), the consumer price index (P), and the exchange rate (E). The index of economic activity should capture the income effect (despite this being small in Central America) resulting from the fiscal expansion during the pandemic. Country controls include the number of banks and the number of COVID-19 cases per million people, as well as fixed effects by country. The variables are estimated in YOY growth rates, which are denoted by Δ. The error term is . These are unbalanced panels for reasons of data availability.8 The estimates of our baseline model are presented in Table 3.
Table 3.
Determinants of credit in CAPARD.
We employed four different panel data estimators: fixed effects (FE), feasible generalized least squares (FGLS), instrumental variables (IV), and an Arellano–Bond estimator (AB). We then proceeded to discuss and scrutinize each estimate. The first two columns provide the estimates of FE and FGLS, respectively, while column 3 presents the IV estimates and column 4, the Arellano–Bond estimates.
We started with the FE estimation and test its assumptions. We used three tests: (1) the Wooldrige autocorrelation test; (2) Wald’s heteroskedasticity test for panel data; and (3) the Breusch–Pagan test, to identify contemporaneous correlation. See Table 4A:9
Table 4.
A: Fixed effects panel residual tests. B: instrumental variables tests. C: tests for the GMM Arellano–Bond estimation.
The test statistics in Table 4A indicate that there is evidence of autocorrelation and heteroskedasticity in the FE estimation; therefore, we opted for an FGLS estimator, in order to mitigate these issues.
We also tested the validity of the IV (two-stage panel data) estimates, in which the first lag of C is instrumented with the second lag and the fixed effects for each country. The results of the first stage are available in Table 4B, and provide no evidence of weak instruments (the F statistic is greater than 10, which, according to the rule of thumb, implies that the instruments are not weak). The Sargan overidentification test yielded a p-value over 0.10, which indicates that overidentifying restrictions are valid (the null hypothesis of the test assumes that all instruments are valid).
Lastly, the Arellano–Bond method instruments the first lag of credit and uses the first lag of all exogenous variables as the standard instrument, while as GMM-type instruments, we used the second lag of C. The results presented in Table 4C provide evidence that this specification is valid, as the instruments passed both the test of exogeneity and the Arellano–Bond test for zero autocorrelation in first-differenced errors.
From Table 3, it can be inferred that the interest rate and the legal reserve ratio had a significant and negative effect on private credit in the region. Thus, a reduction in these, during the crisis, contributed to sustaining credit. The regression estimates also show a positive and significant coefficient for restructured loans, indicating that they too contributed to maintaining credit throughout the crisis. As expected, economic activity and the number of banks had a positive effect on credit growth. The negative and small coefficient of the constant may be capturing the trend of repayments before the expiration of the loans.
4.2. Non-Performing Loans
The specification of non-performing loans (loans whose scheduled payments have not been made for 90 or more days) is similar to that proposed for private credit (see Equation (1)):
As in Equation (1), Equation (2) includes the first lag of the dependent variable to control for the persistence of this variable. We also estimated the VIFs to test for multicollinearity (see Table A1 of the Appendix A); we found evidence that there is no multicollinearity, as the mean VIF for the non-performing loans model was 2.16. Table 5 presents the results of the estimation of Equation (2) by fixed effects (FE), feasible generalized least squares (FGLS), instrumental variables (IV), and an Arellano–Bond estimation (AB).
Table 5.
Determinants of non-performing loans in CAPARD.
Column 3 (IV estimates) shows the results of a two-stage panel data regression, in which the lag of the IMORA and the lag of the number of banks were used as instruments for the lag of non-performing loans. The IMORA is the ratio of the overdue credit portfolio to the total credit portfolio. The reason for using the lags of the IMORA and the number of banks is to ensure the exogeneity of the instruments.10 Lastly, column 4 shows the results for an Arellano–Bond estimation. Table 4C presents the tests of exogeneity and zero autocorrelation.
The results show that economic activity, COVID-19 cases, and restructured loans were the only significant determinants and had a negative effect on the increase of non-performing loans. This suggests that, during the COVID-19 crisis, moratoriums on loan repayments contributed to reducing the growth of non-performing loans in CAPARD. In general, the exchange rate, inflation, legal reserves, and interest rates are not statistically significant in these models.
5. Interpretation of the Results and Robustness Checks: Private Credit and Non-Performing Loans
To provide an estimate of the magnitude of the effect of each determinant, we calculated what their effect would have been in 2020, based on their behavior that year. In December 2019, the annual growth rate of private credit in CAPARD was close to 5%. A year later, in December 2020, it was –1.9% (see Figure 4). In 2020, average interest rates (R) in CAPARD decreased by 3.9% and the average legal reserve ratio (LR), by 4.1%.11 The average ratio of restructured bank loans to total loans in March 2021 was 37.4%. We measured the contribution of R, LR, and restructured bank loans to the credit growth rate by multiplying their YOY variations by their respective coefficients in column 4 of Table 3. Figure 5 shows the results of this exercise; these are: (i) the effects of these three variables on the credit growth rate, and (ii) the difference between the recorded credit growth and the contribution of these variables. The calculations suggest that the contribution, to sustaining bank credit to the private sector, of reduced interest rates and legal reserve requirements, along with moratoriums, amounted to around 0.9 pp (percentage points) of the total credit balance. Restructured loans contributed the most to mitigating the reduction in private credit. The difference between the registered contraction in private credit and the contribution of these variables suggests that, in their absence, private credit would have shrunk by 2.8% in 2020, in contrast to the 1.9% reduction actually recorded.
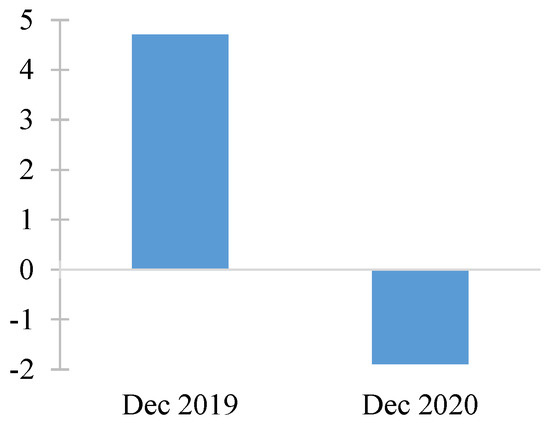
Figure 4.
Bank credit to the private sector in CAPARD, annual growth rate. Source: Central American Monetary Council.
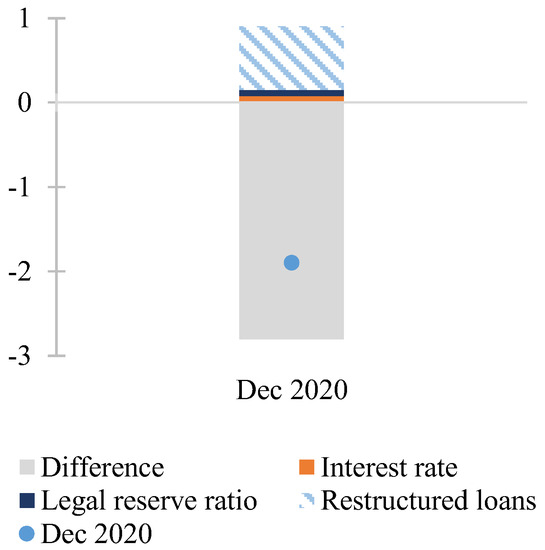
Figure 5.
Effect on private credit, percentage points. Source: own calculations.
We performed the same exercise for non-performing loans. In December 2019, non-performing loans grew 9.2% YOY, while in December 2020, they increased by just 3.0% (see Figure 6). The coefficient of the restructured loans in column AB of Table 5 suggests this variable reduced the annual variation in non-performing loans by 6.0 percentage points. Thus, in the absence of the moratoriums, non-performing loans would have grown 9.0% annually in 2022 (see Figure 7).
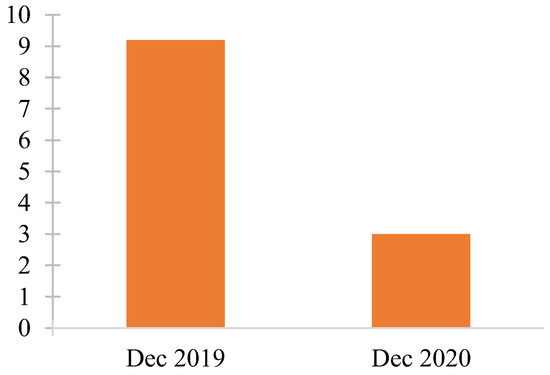
Figure 6.
Non-performing loans in CAPARD, annual growth rate. Source: Central American Monetary Council.
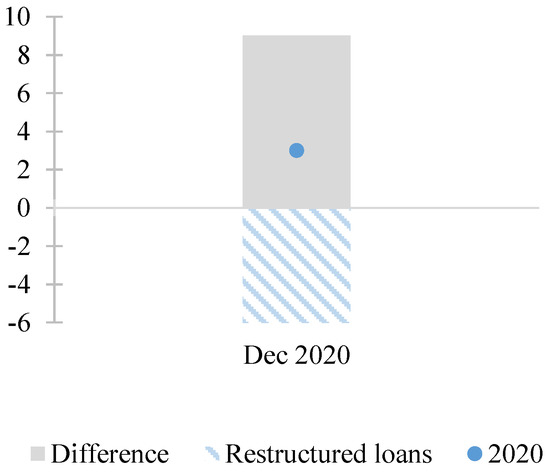
Figure 7.
Effect on non-performing loans, percentage points. Source: own calculations.
To assess the robustness of the estimates, we provided an alternative specification: we built a dummy variable that takes the value of one when the announcements on moratoriums and extension of credit terms are made—March 2020 (June 2020 in Nicaragua). The dummy variable remained activated until February 2021 (the end of the sample period). Note that, while restructured bank credit was indeed an important measure during the COVID-19 crisis, it was not the only one. Many regulatory policy measures were implemented at the same time; this obviously limited the ability to disentangle their effects. Therefore, the analysis was complemented by a more general one. The specifications of the robustness checks were the same as those shown in Equations (1) and (2); the only difference was the replacement of “restructured loans” with “regulatory measures” (the dummy variable). We employed the same estimation techniques (FE, FGLS, IV, and AB) and performed tests for the FE, IV, and AB estimations, using the regulatory dummy. These tests were included in the Appendix A. Table A3 and Table A7 (also in Appendix A) show the results of the models.
The interest rate and the legal reserve ratio had a significant and negative effect on private credit in the region, while economic activity and the number of banks had a positive effect on credit growth. Thus, reducing the former during the crisis contributed to sustaining credit. As expected, the regulatory measures, taken during COVID-19, positively impacted credit. Using column 4 of Table 4, Figure A1 of Appendix A shows the decomposition of the effects. The results are in line with those found previously. The only difference is that the more general “regulatory measures” dummy had a slightly greater effect on credit than the “restructured loans” variable. This is indicated by the blue-striped area in Figure 5 (with a magnitude of 0.76) and Figure A1 of Appendix A (0.99).
In the case of non-performing loans, economic activity and regulatory easing contributed to reducing the non-performing loans. These results are very similar to those presented before. As with private credit, the more general “regulatory measures” dummy had a greater effect on non-performing loans than the “restructured loans” variable (−6.0 in the blue-striped area in Figure 7 and −8.75 in Figure A2 of Appendix A).
6. Concluding Remarks
During 2020, the countries of CAPARD implemented numerous financial measures to mitigate the effects of the COVID-19 crisis on bank credit to the private sector, and this work evaluated their effectiveness. Using a panel data analysis, we estimated the effects of monetary and regulatory policies on private credit growth and loan quality (specifically, non-performing loans).
Our results indicate that the effects of these measures helped sustain that credit and avoid a deeper deterioration of non-performing loans. Moreover, our estimates show that this positive effect of policies other than standard monetary policies was quite sizeable. To be specific, our results suggest that regulatory policy (such as relaxation of risk criteria, report, capital, liquidity, and provisions requirements) and household and firm support (moratoriums of payments), helped to reduce the impact of the COVID-19 crisis. Of course, the reduction of monetary interest rates and the legal reserve requirements were applied across the board in the region and also contributed to mitigate the drop in private credit. These results underscore the importance of monetary policies and regulatory flexibility in supporting credit and financial stability in times of severe stress. Some of these alternative policies can be considered less onerous than the fiscal ones, which is significant for small emerging economies, such as those of CAPARD.
The analysis benefited from having a monthly series of the restructured loans; in its absence, the possibility of exploring their dynamics and studying by-country effects is limited. For future research, it would be important to explore the process of taking the loans out of the moratorium and analyzing its effects. Moratoriums were extended well beyond 2021 in several countries, despite economic activity having recovered. While this contributes to a safer transition to the regular application of regulatory norms, it could also have contributed to an excess of liquidity. This, in its turn, could have effects on credit and inflation, among other variables.
In terms of data, an international initiative to provide time series of restructured loans and other outcomes from support measures would be desirable.
Supplementary Materials
The following supporting information can be downloaded at: https://www.mdpi.com/article/10.3390/ijfs11020068/s1.
Author Contributions
Conceptualization, A.M.; software, D.V.-S. and L.A.; validation, D.V.-S.; formal analysis, A.M., D.V.-S. and L.A.; investigation, A.M., D.V.-S. and L.A.; writing—original draft preparation, A.M. and D.V.-S.; writing—review and editing, A.M. and D.V.-S. All authors have read and agreed to the published version of the manuscript.
Funding
This research received no external funding.
Institutional Review Board Statement
Not applicable.
Informed Consent Statement
Not applicable.
Data Availability Statement
Publicly available datasets were analyzed in this study. The data and the code can be found in the supplementary material: [link/accession number CODEandDATA.zip].
Conflicts of Interest
The opinions expressed in this article are the authors’ own and do not necessarily reflect the view of the IDB. The authors declare no conflict of interest.
Appendix A
Table A1.
Variance inflation factors (VIFs).
Table A1.
Variance inflation factors (VIFs).
| Variable | Private Credit | Non-Performing Loans |
|---|---|---|
| Lag | 3.81 | 1.45 |
| Constant | 4.33 | 4.54 |
| IMAE | 2.96 | 3.04 |
| CPI | 3.62 | 3.44 |
| Exchange rate | 1.55 | 1.38 |
| Legal reserve ratio | 1.1 | 1.21 |
| Interest rate | 1.3 | 1.29 |
| Number of banks | 1.09 | 1.07 |
| Restructured loans | 3.01 | 2.70 |
| COVID-19 cases | 1.99 | 1.52 |
| Mean VIF | 2.48 | 2.16 |
Note: Table A1 shows the VIF for the proposed specifications in Equations (1) and (2). VIF measures the portion of the variance that is explained by correlation.
Table A2.
Variance inflation factors (VIFs) using regulatory dummy.
Table A2.
Variance inflation factors (VIFs) using regulatory dummy.
| Variable | Private Credit | Non-Performing Loans |
|---|---|---|
| Lag | 3.84 | 1.47 |
| Constant | 4.50 | 4.86 |
| IMAE | 3.00 | 3.09 |
| CPI | 3.62 | 3.44 |
| Exchange rate | 1.57 | 1.36 |
| Legal reserve ratio | 1.13 | 1.22 |
| Interest rate | 1.26 | 1.23 |
| Number of banks | 1.12 | 1.08 |
| Regulatory dummy | 2.99 | 2.73 |
| COVID-19 cases | 1.94 | 1.49 |
| Mean VIF | 2.50 | 2.20 |
Note: Table A2 shows the VIF for our robustness checks. VIF measures the portion of the variance that is explained by correlation. We found evidence that there is no multicollinearity, as the mean VIF, with the regulatory dummy for both models, is less than 10. For non-performing loans, the variable of COVID-19 cases is lagged in four periods.
Table A3.
Determinants of credit in CAPARD using regulatory dummy.
Table A3.
Determinants of credit in CAPARD using regulatory dummy.
| FE | FGLS | IV | AB | |
|---|---|---|---|---|
| (1) | (2) | (3) | (4) | |
| Lag (Credit) | 0.978 ** | 0.979 ** | 0.973 ** | 0.978 ** |
| (0.00722) | (0.00693) | (0.00718) | (0.00709) | |
| Y | 0.0943 ** | 0.0550 ** | 0.0874 ** | 0.0940 ** |
| (0.0148) | (0.0121) | (0.0146) | (0.0145) | |
| P | 0.0533 ** | 0.0222 | 0.0425 ** | 0.0547 ** |
| (0.0236) | (0.0175) | (0.0196) | (0.0231) | |
| E | 0.0239 | 0.00711 | 0.00598 | 0.0231 |
| (0.0167) | (0.0136) | (0.0136) | (0.0165) | |
| LR | −0.0204 ** | −0.0219 ** | −0.0194 ** | −0.0206 ** |
| (0.00358) | (0.00374) | (0.00358) | (0.00351) | |
| R | −0.0157 ** | −0.0105 ** | −0.0161 ** | −0.0156 ** |
| (0.00462) | (0.00427) | (0.00454) | (0.00456) | |
| Number of banks | 0.0189 ** | 0.0220 ** | 0.0164 ** | 0.0197 ** |
| (0.00863) | (0.00800) | (0.00811) | (0.00857) | |
| Regulatory dummy | 0.987 ** | 0.589 ** | 0.882 ** | 0.991 ** |
| (0.304) | (0.242) | (0.298) | (0.296) | |
| COVID-19 cases | −0.00861 ** | −0.0106 ** | −0.00807 ** | −0.00861 ** |
| (0.00379) | (0.00365) | (0.00372) | (0.00369) | |
| Constant | −0.425 ** | −0.118 * | −0.276 ** | −0.428 ** |
| (0.115) | (0.0665) | (0.0913) | (0.112) | |
| Observations | 833 | 833 | 828 | 827 |
| Pseudo R-squared | 0.974 | 0.973 | 0.974 | 0.974 |
Notes: L indicates one lag. The variables are annual growth rates except COVID-19 cases and restructured loans. Period: January 2008–February 2021. * p < 0.1; ** p < 0.05.
Table A4.
Fixed effects panel residual tests.
Table A4.
Fixed effects panel residual tests.
| Test | Private Credit | Non-Performing Loans |
|---|---|---|
| Wooldridge autocorrelation test | 0.0472 | 0.0005 |
| Wald’s heteroskedasticity test | 0.000 | 0.001 |
| Breusch–Pagan test to identify contemporaneous correlation | 0.316 | 0.0270 |
Note: Table A4 presents the Wooldridge autocorrelation test, Wald’s heteroskedasticity test for panel data, and the Breusch–Pagan test to identify contemporaneous correlation. For both models, the tests indicate autocorrelation and heteroskedasticity in the FE estimation, therefore we proceeded to perform an FGLS estimation.
Test statistics in Table A4. indicate that there is evidence of autocorrelation and heteroskedasticity in the FE estimation; therefore, we opted for an FGLS estimator.
Table A5 provides no evidence of weak instruments (the F statistic is greater than 10, which, according to the rule of thumb, implies that instruments are not weak). The Sargan overidentification test yielded a p-value of 0.2559 for the private credit estimations and a p-value of 0.1216 for non-performing loans, which indicates that overidentifying restrictions are valid for both estimates. The null hypothesis of the test assumes that all instruments are valid.
Table A5.
Instrumental variables tests.
Table A5.
Instrumental variables tests.
| Test | Private Credit | Non-Performing Loans |
|---|---|---|
| F statistic | 3012.510 | 3489.550 |
| Sargan overidentification test | 0.2559 | 0.1216 |
Note: The results of the first stage for both models show an F statistic greater than 10, which, according to the rule of thumb, indicates that there is no presence of weak instruments. The Sargan overidentification test yields a p-value greater than 0.05, which indicates that the null hypothesis, that the instruments are not correlated with the error, can be rejected. This primarily indicates that the instruments are correlated with past errors, and therefore, the assumption of exogeneity is not met.
Table A6 provides evidence that this specification is valid, as the instruments passed both the test of exogeneity and the Arellano–Bond test for zero autocorrelation in first-differenced errors.
Table A6.
Tests for the GMM Arellano–Bond estimation.
Table A6.
Tests for the GMM Arellano–Bond estimation.
| Test | Private Credit | Non-Performing Loans |
|---|---|---|
| Sargan test | 0.146 | 0.066 |
| Arellano–Bond test for zero autocorrelation in first-differenced errors | L1: 0.109 L2: 0.7891 | L1: 0.0308 L2: 0.450 |
Note: The Arellano–Bond method instruments the first lag of private credit and non-performing loans and uses the first lag of all exogenous variables as the standard instrument; for GMM-type instruments we use the second lag of private credit and non-performing loans. Table A6 shows that this specification is efficient, since the instruments passed the test of exogeneity and the Arellano–Bond test for zero autocorrelation in first-differenced errors showed no autocorrelations.
Table A7.
Determinants of non-performing loans in CAPARD using regulatory dummy.
Table A7.
Determinants of non-performing loans in CAPARD using regulatory dummy.
| FE | FGLS | IV | AB | |
|---|---|---|---|---|
| (1) | (2) | (3) | (4) | |
| Lag (NPL) | 0.904 ** | 0.924 ** | 0.907 ** | 0.901 ** |
| (0.0131) | (0.0126) | (0.0133) | (0.0126) | |
| Y | −0.565 ** | −0.222 ** | −0.510 ** | −0.594 ** |
| (0.0906) | (0.0736) | (0.0868) | (0.0872) | |
| P | −0.168 | 0.0814 | 0.0446 | −0.136 |
| (0.138) | (0.0953) | (0.111) | (0.133) | |
| E | −0.0641 | 0.0609 | 0.0806 | −0.0518 |
| (0.0928) | (0.0717) | (0.0741) | (0.0891) | |
| LR | −0.0195 | −0.00817 | −0.0141 | −0.0206 |
| (0.0280) | (0.0267) | (0.0276) | (0.0269) | |
| R | −0.0267 | 0.0265 | −0.0286 | −0.0321 |
| (0.0207) | (0.0189) | (0.0206) | (0.0200) | |
| Number of banks | −0.0356 | −0.0701 | −0.0217 | −0.0161 |
| (0.0496) | (0.0437) | (0.0464) | (0.0481) | |
| Regulatory dummy | −8.454 ** | −4.329 ** | −7.762 ** | −8.748 ** |
| (1.712) | (1.397) | (1.675) | (1.641) | |
| COVID-19 cases | 0.158 ** | 0.129 ** | 0.146 ** | 0.161 ** |
| (0.0404) | (0.0336) | (0.0400) | (0.0387) | |
| Constant | 3.369 ** | 0.765 ** | 2.130 ** | 3.331 ** |
| (0.714) | (0.379) | (0.560) | (0.683) | |
| Observations | 833 | 833 | 832 | 827 |
| Pseudo R-squared | 0.898 | 0.897 | 0.899 | 0.898 |
Notes: L indicates one lag. The variables are annual growth rates, except COVID-19 cases and restructured loans. Period: January 2008–February 2021. ** p < 0.05.

Figure A1.
Effect on private credit, pp. Source: own calculations using column 4 of Table A3.
Figure A1.
Effect on private credit, pp. Source: own calculations using column 4 of Table A3.


Figure A2.
Effect on non-performing loans, pp. Source: own calculations using column 4 of Table A7.
Figure A2.
Effect on non-performing loans, pp. Source: own calculations using column 4 of Table A7.

Table A8.
Descriptive statistics.
Table A8.
Descriptive statistics.
| Variable | Mean | Std. Dev. | Min | Max | Observations | |||
|---|---|---|---|---|---|---|---|---|
| Non-performing loans | overall | 9.7258 | 23.4484 | −43.4170 | 129.2829 | N | = | 1012 |
| between | 5.7320 | 0.3350 | 17.2507 | n | = | 7 | ||
| within | 22.8377 | −48.6239 | 124.0760 | T | = | 144.571 | ||
| Private credit | overall | 8.8889 | 7.6541 | −20.8053 | 32.8830 | N | = | 1012 |
| between | 2.9337 | 3.1634 | 13.0145 | n | = | 7 | ||
| within | 7.1518 | −21.9324 | 31.7559 | T | = | 144.571 | ||
| Y | overall | 2.6685 | 5.0060 | −30.6079 | 14.0209 | N | = | 1018 |
| between | 0.9793 | 1.2004 | 4.1792 | n | = | 7 | ||
| within | 4.9232 | −31.5097 | 14.24752 | T | = | 145.429 | ||
| P | overall | 3.3786 | 2.5083 | −2.4691 | 13.5010 | N | = | 1028 |
| between | 1.4582 | 0.9983 | 5.2350 | n | = | 7 | ||
| within | 2.1135 | −1.9781 | 13.5783 | T | = | 146.857 | ||
| E | overall | 1.8277 | 3.4152 | −13.3830 | 17.6314 | N | = | 1012 |
| between | 2.0464 | 0.0000 | 4.8832 | n | = | 7 | ||
| within | 2.8412 | −12.7429 | 18.2714 | T | = | 144.571 | ||
| LR | overall | −0.5584 | 10.4454 | −44.4785 | 55.3044 | N | = | 858 |
| between | 2.6466 | −4.5101 | 3.0650 | n | = | 6 | ||
| within | 10.1691 | −43.5938 | 51.6810 | T | = | 143 | ||
| R | overall | −0.6077 | 14.0282 | −47.7155 | 63.9739 | N | = | 1018 |
| between | 1.6833 | −2.8647 | 2.1183 | n | = | 7 | ||
| within | 13.9413 | −45.4585 | 66.2309 | T | = | 145.429 | ||
| Number of
banks | overall | 0.4879 | 5.5431 | −14.2857 | 25 | N | = | 1000 |
| between | 1.7341 | −1.7596 | 3.4751 | n | = | 7 | ||
| within | 5.3024 | −15.0875 | 22.01281 | T | = | 142.857 | ||
| Restructured
loans | overall | 3.6649 | 12.3354 | 0.0000 | 60.0000 | N | = | 1134 |
| between | 1.8329 | 0.9630 | 5.9259 | n | = | 7 | ||
| within | 12.2181 | −2.2610 | 57.7390 | T | = | 162 | ||
| COVID-19
cases | overall | 6.7426 | 38.0105 | 0.0000 | 746.3580 | N | = | 1134 |
| between | 6.4683 | 0.1801 | 17.9121 | n | = | 7 | ||
| within | 37.5354 | −11.1695 | 735.1885 | T | = | 162 | ||
Note: “overall” refers to the average value of a variable across all units and time periods; “between” is the variation of a variable across different units over time; “within” variation is the variation of a variable within each unit (Country) over time. The variables are annual growth rates, except COVID-19 cases per million people and restructured loans that are in levels. Period: January 2008–February 2021.
Notes
| 1 | These include Costa Rica, the Dominican Republic, Guatemala, Honduras, El Salvador, Nicaragua, and Panama. The Dominican Republic is included because it forms part of the Central American Integration System and its subgroups’ institutions. |
| 2 | In Spanish, Consejo Monetario Centroamericano. This is a multilateral institution that represents a group of central banks and other financial regulators, which forms part of the System of Economic Integration of Central America (SICA). |
| 3 | According to Berger and Demirgüç-Kunt (2021), the effect of the COVID-19 crisis did not have severe consequences for the US banking sector, thanks to the speed and size of the U.S. stimulus program and the prudential policies put in place during the global financial crisis. |
| 4 | For measures to mitigate bank risk, see Nguyen and Dang (2022, 2023) on risk governance structures and their effectiveness; Nguyen (2022) on audit committee effectiveness; and Alam et al. (2021) on deposits insurance. |
| 5 | They also announced diverse social policy measures. These were implemented gradually, and their scope was limited (as discussed in the previous section). A list of these measures can be found in IADB (2020). |
| 6 | The effective reserve requirement ratio is the percentage of the total deposits received by commercial banks and financial institutions that are kept as cash reserves, in order to be able to respond to depositor cash withdrawals or to any unforeseen contingency. |
| 7 | Data source: Central American Monetary Council. |
| 8 | There is a risk that the explanatory variables are correlated with each other (multicolinearity). We therefore estimate the variance inflation factors (VIFs), which measure the proportion of the variance explained by correlation. The VIF test results are presented in Table A1 of Appendix A. In short, we found scant evidence of multicollinearity; the estimated VIF is less than 10, with a mean of 2.48. |
| 9 | Table 4A–C presents the tests for both estimates—private credit and non-performing loans. |
| 10 | |
| 11 | While most countries in the region registered average annual variations in their interest rates in 2020 (ranging from −16.8% in Costa Rica to −1.7% in Guatemala), two exceptional cases registered an increase (2.4% in El Salvador and 13.2% in Panama). Similarly, the legal reserve ratio decreased in most countries (from −21.5% in El Salvador to −4.2% in the Dominican Republic), though there was no change in one country (Guatemala) and an increase in another (13.8% in Honduras). |
References
- Alam, Nafis, Ganesh Sivarajah, and Muhammad Ishaq Bhatti. 2021. Do deposit insurance systems promote banking stability? International Journal of Financial Studies 9: 52. [Google Scholar] [CrossRef]
- Almustafa, Hamza, Quang Khai Nguyen, Jia Liu, and Van Cuong Dang. 2023. The impact of COVID-19 on firm risk and performance in MENA countries: Does national governance quality matter? PLoS ONE 18: e0281148. [Google Scholar] [CrossRef] [PubMed]
- Altavilla, Carlo, Francesca Barbiero, Miguel Boucinha, and Lorenzo Burlon. 2020. The Great Lockdown: Pandemic Response Policies and Bank Lending Conditions. Working Paper Series, No. 2465; Frankfurt: European Central Bank. [Google Scholar]
- Bartik, Alexander W., Marianne Bertrand, Zoë B. Cullen, Edward L. Glaeser, Michael Luca, and Christopher T. Stanton. 2020. How Are Small Businesses Adjusting to COVID-19? Early Evidence from a Survey; Working Paper No. w26989; Cambridge: National Bureau of Economic Research.
- Beck, Thorsten, and Jan Keil. 2020. Are Banks Catching Corona? Effects of COVID on Lending in the U.S. Available online: https://ssrn.com/abstract=3766831 (accessed on 1 October 2021).
- Beck, Thorsten, Asli Demirgüç-Kunt, and Vojislav Maksimovic. 2005. Financial and Legal Constraints to Growth: Does Firm Size Matter? Journal of Finance 60: 137–77. [Google Scholar] [CrossRef]
- Berger, Allen N., and Asli Demirgüç-Kunt. 2021. Banking research in the time of COVID-19. Journal of Financial Stability 57: 100939. [Google Scholar] [CrossRef]
- Bustamante, José, Walter Cuba, and Rafael Nivin. 2019. Determinants of Credit Growth and the Bank Lending Channel in Peru: A Loan Level Analysis. BIS Working Papers No. 803. Basel: Bank for International Settlements. [Google Scholar]
- Casanova, Catherine, Bryan Hardy, and Mert Onen. 2021. COVID-19 policy measures to support bank lending. In BIS Quarterly Review. Basel: Bank for International Settlements, pp. 45–59. [Google Scholar]
- CID-Gallup. 2021. National surveys of public opinion. In Survey Applied in the Second Fortnight of May 2021. San José: CID-Gallup. [Google Scholar]
- CMC. 2020. Matrix of Macroeconomic Policies: September 2020. Consejo Monetario Centroamericano. Available online: https://www.secmca.org/periodo_informe/trimestral/ (accessed on 1 October 2021).
- Duan, Yuejiao, Sadok El Ghoul, Omrane Guedhami, Haoran Li, and Xinming Li. 2021. Bank systemic risk around COVID-19: A cross-country analysis. Journal of Banking and Finance 133: 106299. [Google Scholar] [CrossRef] [PubMed]
- Duncan, Elizabeth, Akos Horvath, Diana Iercosan, Bert Loudis, Alice Maddrey, Francis Martinez, Timothy Mooney, Ben Ranish, Ke Wang, Missaka Warusawitharana, and et al. 2022. COVID-19 as a stress test: Assessing the bank regulatory framework. Journal of Financial Stability 61: 101016. [Google Scholar] [CrossRef]
- Fahlenbrach, Rüdiger, Kevin Rageth, and René M. Stulz. 2021. How valuable is financial flexibility when revenue stops? Evidence from the COVID-19 crisis. The Review of Financial Studies 34: 5474–521. [Google Scholar] [CrossRef]
- Falagiarda, Matteo, and Petra Köhler-Ulbrich. 2021. Bank lending to euro area firms—What have been the main drivers during the COVID-19 pandemic? European Economy 1: 119–43. [Google Scholar]
- Guo, Kai, and Vahram Stepanyan. 2011. Determinants of Bank Credit in EMEs. IMF Working Paper, No. 11/51. Washington: International Monetary Fund. [Google Scholar]
- IADB. 2020. The Impact of COVID-19 on the Economies of Central America, Haiti, Mexico, Panama and the Dominican Republic. Washington: Inter-American Development Bank. (In Spanish) [Google Scholar] [CrossRef]
- IADB. 2022. In Search of Better Indebtedness Conditions for Companies and Households: Economic Report on Central America, Mexico, Panama, and the Dominican Republic. Washington: Inter-American Development Bank. (In Spanish) [Google Scholar] [CrossRef]
- IMF. 2022. Fiscal Policies Database in Response to COVID-19. Washington: International Monetary Funds. Available online: https://www.imf.org/en/Topics/imf-and-covid19/Fiscal-Policies-Database-in-Response-to-COVID-19 (accessed on 1 November 2021).
- Ivanovic, Maja. 2016. Determinants of Credit Growth: The Case of Montenegro. Journal of Central Banking Theory and Practice 2: 101–18. [Google Scholar] [CrossRef]
- Jiménez, Gabriel, Steven Ongena, José-Luis Peydró, and Jesús Saurina. 2012. Credit Supply and Monetary Policy: Identifying the Bank Balance-Sheet Channel with Loan Applications. American Economic Review 102: 2301–26. [Google Scholar] [CrossRef]
- Li, Lei, Philip E. Strahan, and Song Zhang. 2020. Banks as lenders of first resort: Evidence from the COVID-19 crisis. The Review of Corporate Finance Studies 9: 472–500. [Google Scholar] [CrossRef]
- Liu, Zheng, and Pengfei Wang. 2014. Credit Constraints and Self-Fulfilling Business Cycles. American Economic Journal: Macroeconomics 6: 32–69. [Google Scholar] [CrossRef]
- Nguyen, Quang Khai. 2022. Audit committee structure, institutional quality, and bank stability: Evidence from ASEAN countries. Finance Research Letters 46: 102369. [Google Scholar] [CrossRef]
- Nguyen, Quang Khai, and Van Cuong Dang. 2022. The impact of risk governance structure on bank risk management effectiveness: Evidence from ASEAN countries. Heliyon 8: e11192. [Google Scholar] [CrossRef] [PubMed]
- Nguyen, Quang Khai, and Van Cuong Dang. 2023. Does the country’s institutional quality enhance the role of risk governance in preventing bank risk? Applied Economics Letters 30: 850–53. [Google Scholar] [CrossRef]
- Poschke, Markus. 2018. The Firm Size Distribution across Countries and Skill-Biased Change in Entrepreneurial Technology. American Economic Journal: Macroeconomics 10: 1–41. [Google Scholar] [CrossRef]
- Ruiz-Marín, Manuel, Mariluz Maté-Sánchez-Val, and Jose Noguera-Venero. 2023. Did Covid-19 modify the spatial concentration of business failure? Regional Statistics 13: 201–13. [Google Scholar] [CrossRef]
- Zhang, Dengjun, and Geir Sogn-Grundvåg. 2022. Credit constraints and the severity of COVID-19 impact: Empirical evidence from enterprise surveys. Economic Analysis and Policy 74: 337–49. [Google Scholar] [CrossRef] [PubMed]
- Žunić, Amila, Kemal Kozarić, and Emina Žunić Dželihodžić. 2021. Non-Performing Loan Determinants and Impact of COVID-19: Case of Bosnia and Herzegovina. Journal of Central Banking Theory and Practice 10: 5–22. [Google Scholar] [CrossRef]


Disclaimer/Publisher’s Note: The statements, opinions and data contained in all publications are solely those of the individual author(s) and contributor(s) and not of MDPI and/or the editor(s). MDPI and/or the editor(s) disclaim responsibility for any injury to people or property resulting from any ideas, methods, instructions or products referred to in the content. |
© 2023 by the authors. Licensee MDPI, Basel, Switzerland. This article is an open access article distributed under the terms and conditions of the Creative Commons Attribution (CC BY) license (https://creativecommons.org/licenses/by/4.0/).