Abstract
Real estate, characterized by its diverse and complex nature, presents a multifaceted research domain. It encompasses various topics and challenges, making it both content-wise challenging and multidimensional. This study aims to conduct a knowledge mapping of the literature in the real estate field using a sample of 9700 document articles published between 1929 and 2023 based on publications indexed in the Web of Science database. This study utilizes the software SciMAT (version 1.1.04) to demonstrate hot keywords and trends in this field and additionally employs the VOSviewer (version 1.6.19) tool to analyze keywords, countries, authors, and sources. Authors reveal a growing interest in real estate literature, with the USA contributing the most publications, while relatively few originate from Africa and South America. This study investigates the strategic themes and the scientific evolution structure, provides a comprehensive examination of the current state of real estate literature, and helps in understanding its development. It offers a valuable reference point for future research in this domain.
1. Introduction
The subject shed light on one of the great interests on our world today, namely real estate. Real estate encompasses land and any permanent structures, whether naturally occurring or manufactured. This sector comprises a wide range of properties such as residential homes, apartments, commercial buildings, and even fences. Property types are typically categorized, primarily for analytical and practical purposes, into two main groups: housing and commercial properties. Within the commercial category, there are further subdivisions, including retail properties, hotels, offices, and industrial properties (Glickman 2014).
Acquiring one of these properties remains a decision that highlights selectivity and meticulousness in decision-making among individuals in our society, which is influenced not only by economic factors but also by personal and societal considerations (El Bied et al. 2024; Salzman and Zwinkels 2017). Moreover, the construction of new buildings, whether private or public, plays a significant role in a country’s annual gross domestic product (GDP). At the same time, the value of existing buildings forms the largest part of a nation’s wealth and is a crucial asset for most businesses (Lambiri and Rovolis 2014). Real estate property possesses both a physical dimension, given its association with tangible assets, and a legal dimension, which pertains to property rights governing those physical assets. Interestingly, transactions within the property market do not involve the exchange of the actual physical land and buildings but rather encompass the transfer of legal rights or interests tied to these assets. Notably, a distinctive characteristic setting the physical real estate apart from numerous other types of commodities is its enduring nature (Baum 2009). Real estate property possesses the notable characteristic of being highly illiquid. This is another way of saying that it is very costly to trade real estate property, as it involves direct cost such as taxes, legal fees, valuation fees, and brokers´ fees and indirect costs as mentioned by Baum (2009). The real estate sector is subject to the influence of numerous factors. Consequently, accurately predicting and conducting a comprehensive analysis in this field can be quite challenging (Yang et al. 2022). The global rise in real estate prices since the 1980s has attracted increasing research interest due to its impact on the economy. This analysis continues to be a prime area of focus to date (Goodchild and D’Arcy 2018). Recently, scholars in bibliometrics have started using quantitative methods to examine the evolution trend and developments in research hotspots, incorporating their expertise in the respective research domain; for example Jayantha and Oladinrin (2020) have published in the fields of economics, finance, and real estate.
This article seeks to enhance our comprehension of this global concern by conducting a bibliometric analysis of the literature pertaining to real estate prices spanning the years from 1999 to 2022. Bibliometric analysis, as an approach, quantitatively measures the publications of research units, individuals, and countries, enabling the measurement of their evolution and trends. This method provides an overview of research activity in a specific field by analyzing key research areas and predicting future study directions. It involves selecting and aggregating primary academic articles within a given period and a defined theme, characterized by intelligent keyword usage (Filliatreau 2009). This intelligence categorization facilitates statistical analysis, revealing aspects such as the number of published articles, their longitudinal evolution, and the distribution of utilized methodologies and theories.
The origin of bibliometric study can be traced back to the mid-20th century when Alan Pritchard, a British intelligence expert, introduced the concept in his paper defining it as an area of study that applies mathematical and statistical methods to examine and quantify books (Pritchard 1968). Traditionally, bibliometric methods were applied to trace citation connections in academic journal articles (Schaer 2013). Overtime, these methods have expanded in application, encompassing quantitative research evaluations of academic output across various document types, including books, reports, theses, and published articles. This expansion enables the identification of trends within specific research areas and the exploration of intellectual networks among scholars (Pinto et al. 2014).
This comprehensive study investigates real estate research spanning 1999 to 2022, with a primary focus on identifying and highlighting key trends and developments by examining a substantial body of knowledge in the field, offering valuable perspectives for future exploration and analysis in the domain.
2. Materials and Methods
The research methodology employed in this study uses visual bibliometric methods described in Figure 1. The Web of Science Collection Database was chosen as the focal point of this research and literature sourcing due to its inclusion of high-impact academic journals, encompassing nearly all pivotal research papers. The databases were collected in February 2024 through searches using the term TC = “real estate” OR “real-estate” as the topic to ensure comprehensive coverage, capturing all relevant literature as the database may index the term in different ways, resulting in 9626 papers. The dataset was refined by applying the filter “document type: article and review article” to ensure a focus on high-quality, peer-reviewed research and subsequently exported in Tab Delimited File Format, including full records and cited references. The exported data were then input into VOSviewer (version 1.6.19) software for comprehensive analysis, enabling the creation of bibliometric maps. VOSviewer is widely used in research for bibliometric analysis, such as identifying unexplored themes and highlighting the most frequently cited references within specific domains. Its strengths lie in visualizing large bibliometric networks through an interactive interface, which makes it particularly effective for generating various types of maps, including those for keywords, publications, authors, and journals based on co-citation (Donthu et al. 2021; Yu et al. 2020). Moreover, VOSviewer’s capability to efficiently manage large datasets and generate clear visualizations makes it well suited for examining complex relationships within the data.
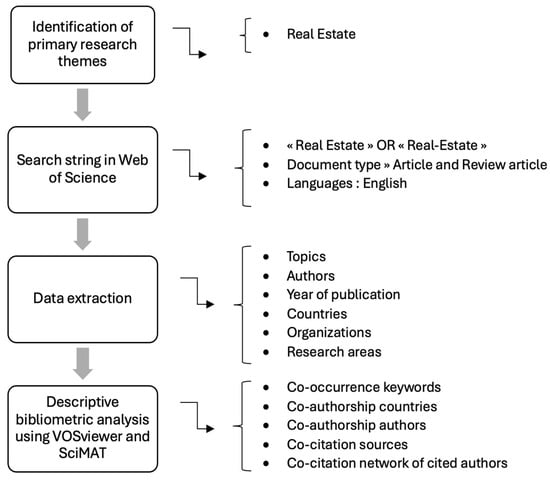
Figure 1.
Schematic representation of the methodology employed in this study.
To conduct a detailed analysis of research themes, SciMAT version 1.1.04, a freely available tool, was employed for its ability to understand the thematic and conceptual evolution of research fields over time. SciMAT is particularly useful for tracking how research themes develop over time and can clearly show the conceptual subdomains of the research field, helping to provide a detailed view of the themes and their evolutions (Sharifi 2021).
This methodology relies on co-word analysis and the h-index. To prevent data from appearing flat, the entire time span was divided into consecutive periods. Although these periods often cover the same time frames, the low number of publications in the early years required dividing the time span into comparable periods. Thus, the study period (1929–2023) was divided into three consecutive time periods: 1929–2003, 2004–2013, and 2014–2023 with 1839, 2028, and 5759 publications, respectively.
3. Results
3.1. VOSviewer Software Bibliometric Analysis Results
3.1.1. Bibliometric Analysis of Publication Output
The research output growth in real estate field from 1929 to 2023 presented in Figure 2 reveals a dynamic evolution marked by distinct phases reflecting significant changes in research activity.
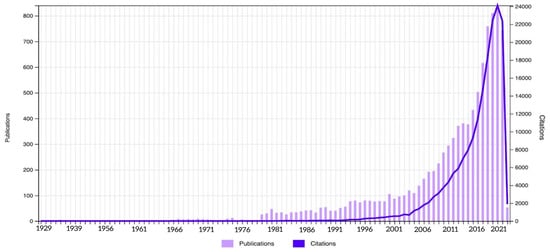
Figure 2.
The number of publications on real estate in WOSCC from 1929 to 2023.
- -
- Initially from 1929 to 2003 (flat growth): This period reflects the earlier stages of real estate research, which saw relatively limited development and publication activity. The slow growth may be attributed to the field´s relatively lower priority compared with other disciplines until more recent decades.
- -
- From 2004 to 2013 (gradual growth): Starting from 2004, there was a noticeable increase in the production of scientific publications in real estate, with a gradual growth over the following ten years. This phase suggests a steady but significant expansion of research activities, driven by factors such as economic trends and urbanization.
- -
- From 2014 to 2023 (marked growth): This phase experienced a pronounced acceleration in the growth of scientific publications, indicating a notable focus on real-estate-related issues and challenges. This marked growth suggests increased recognition of the importance of real estate research in addressing societal, economic, and environmental concerns, driven by emerging technologies, urban development pressures, sustainability concerns, and the growing complexity of real estate markets.
Overall, these three phases illustrate the evolution of publication production in the real estate field, from a relatively stagnant phase to gradual growth and finally to a period of marked expansion and heightened scholarly activity capturing the major phases of development in real estate research and to provide insight into how various factors influenced the growth of the field over time.
These phases reflect the field’s evolution and its growing significance in addressing today’s challenges and opportunities. The rise in productivity is also attributed to the advancement of technology, which has facilitated access to resources (Pinto et al. 2014). Furthermore, there was a striking surge in the number of publications in 2020 that can be largely attributed to the profound impact of the COVID-19 pandemic. Jones and Macdonald (2004) affirmed that journals that maintained the volume of non-COVID-19 publications increased their overall scientific output.
3.1.2. Bibliometric Analysis of the Keywords Co-Occurrence
Keywords can effectively summarize the main idea of a research paper and highlight its results. Therefore, analyzing their co-occurrence helps reveal prominent themes and assists academics in better understanding scientific issues. In this study, a visualization of the co-occurrence keywords of the published literature on real estate was performed in VOSviewer software to provide a clearer picture of the strength of these keywords. Of the 23,211 keywords, 2114 met the threshold. Figure 3 shows the visual network map of keywords co-occurrence; the real estate domain is centered on the three major words “real-estate” with 749 occurrences, «real estate» with 733 occurrences, and “market” with 649 occurrences, which are centrally positioned on the map and surrounded by nodes of different sizes that indicate the frequency of occurrence. The clustering of keywords in distinct colors in the chart indicates different types of clusters, the node size represents the frequency of occurrence, and the thick connection line between the nodes represents their strong link; the shorter the distance between two nodes, the larger the number of co-occurrences of the two keywords. Detailed description of clusters of keyword analysis is provided in Table 1 below.
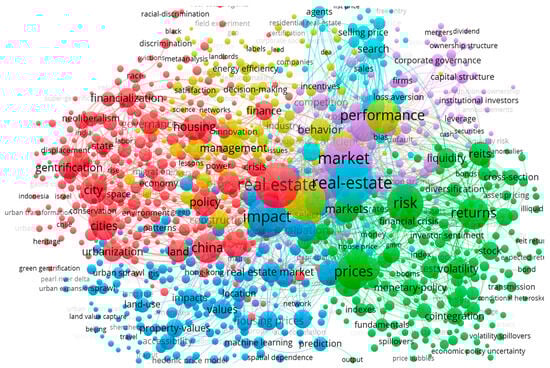
Figure 3.
Bibliometric map of keywords by VOSviewer.

Table 1.
VOSviewer keyword analysis—clusters and labels.
Cluster 1. This cluster is commonly associated with urban sustainability. City, housing, growth, and land were the keywords with the highest co-occurrence scores of 280, 245, 240, and 180, respectively, and considered as the more strongly interlinked keywords to urban sustainability according to the closer network visualization in VOSviewer. However, they can be considered as the hot topics in urban sustainability research to real estate, in addition to the fact that the importance of sustainability in real estate analysis is now widely acknowledged. As stated by Jones and Macdonald (2004), having a viable real estate sector with sustainable markets is a mandatory condition for maintaining an urban sustainability (Kauko 2019).
Cluster 2. By examining the keywords related to this cluster such as market, risk, prices, and returns with 649, 511, 465, and 372 scores, respectively, it can be noticed that the topic concentration was on finance and investment. Housing construction plays a significant role in driving the economy (Annelore and Manuel 2019); moreover, housing accounts for a significant portion of a household’s spending and constitutes a considerable share of lifetime income (Rathnasingha and Khatibi 2012).
Cluster 3. The top four keywords were efficiency, sustainability, environment, and green buildings with co-occurrence frequencies of 168, 144, 49, and 44, respectively. After examining the keywords related with this cluster, it can be noticed that this latter focuses more on sustainable development. According to Linda and Ineta (2017), the real estate market and construction industry development are related to the sustainability concept. Additionally, a healthy real estate market provides a sustainable development by facilitating human activities while improving public spaces in cities and towns (Trinkūnas et al. 2018). In this context, sustainable development is linked to sustainable urban environment, which refers to construction practices that account for environmental considerations (Kilbert 2005).
Cluster 4. This cluster focused more on urban resilience. Accessibility, amenities, air pollution, and air quality were the keywords with the highest co-occurrence frequencies of 99, 48, 36, and 17, respectively. The link between urban resilience and real estate can be explained by how the real estate development and management practices can contribute to or be influenced by the resilience of urban areas. Urban resilience focuses on a city’s ability to adapt to and recover from various shocks and stresses, as studied in Kauko (2023) taking the COVID-19 pandemic as the natural disaster proxy. Thus, Tian et al. (2021) show the consequences and opportunities arising for real estate in this same crisis confirming that the greater the city’s resilience to the pressure of the COVID-19 pandemic, the faster its residential land prices will recover.
Urban resilience might be linked to wider sustainability challenges, and it is as important as urban sustainability (Kauko 2023). The difference between the two concepts is as follows: sustainability is balancing the world, whereas resilience is managing an imbalanced world (Petrisor 2017).
Cluster 5. The top keywords related to this cluster are investment, commercial real estate, and credit with the highest co-occurrence frequencies of 359, 104, and 106, respectively. Upon analyzing the keywords linked to this cluster, it is evident that the focus is on financial aspects. The financial sector has a direct impact on asset valuations, particularly in the real estate market. The connection between financial stability and fluctuations in real estate prices has been extensively studied (Cardarelli et al. 2011; Moscone et al. 2014), focusing on the relationship between bank stability and the real estate market, the interaction between equity and property markets, and the correlation between the foreign exchange market and the housing market.
Cluster 6. The keywords with the highest co-occurrence frequencies are property values and real estate market with 122 and 170, respectively. The final cluster might be related to the housing market, which plays a significant role in helping buyers and sellers make informed decisions, lenders assess the risk of loans, and the government calculate property taxes (Chattopadhyay 1999).
3.1.3. Bibliometric Analysis Co-Authorship Countries
The country co-authorship analysis involves identifying which countries have the most significant influence in the field of investigation. The visualization map of co-authorship between countries shown in Figure 4 demonstrates the international collaboration in the context of “Real estate” research of the 75 most productive countries in six collaboration clusters indicated by different colors. A total of 122 countries contributed to the publications; a minimum number of 5 countries were selected, and 75 met the threshold. Each node represents a country, and its size reflects the number of contributions of the country (i.e., the bigger the node, the higher the contribution of the country in terms of co-authorship). The thickness of the link between any two countries indicates the strength of the collaboration between them. Conversely, countries that are further apart have a weaker co-authorship relationship. The colors indicate clusters of countries that are relatively related to each other. VOSviewer classifies co-authorship based on author affiliations, counting each distinct country separately when authors have multiple affiliations in different countries and as a single contribution when affiliations are within the same country. The United States is the most productive country with 3720 documents and has the most collaborations with 68 different countries, followed by China with 1403 documents and collaborations with 62 different countries. On the other hand, England has 691 documents and collaborations with 64 countries. It is evident that high-income countries consistently held a prominent position in these rankings primarily due to their ample funding, suitable tools, equipment, and organizational structures, which enable them to produce and publish a greater number of documents (Mörschbächer and Granada 2022).
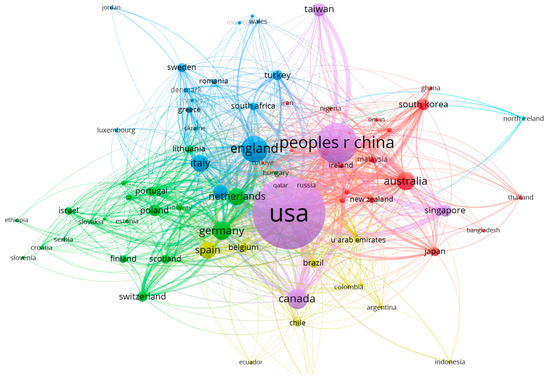
Figure 4.
Bibliometric map of co-authorship countries in VOSviewer.
3.1.4. Bibliometric Analysis Co-Authorship Authors
The function module of the co-authorship visualization of VOSviewer represents a form of contributions between scholars within a specific domain of study by mapping their collaboration networks; it helps to understand how they are connected and highlight scholars who work across different disciplines. The co-authorship network of authors in the real estate field is displayed in Figure 5. Of the 17,744 authors, 428 meet the threshold, and only 241 are connected by the default settings of VOSviewer software (omitting articles with a greater number of 25 co-authors and a minimum of 5 articles published by authors); the results were regrouped in 21 clusters. The size of the node indicates the number of documents of the author. Notably, Hui Eddie C.M holds the distinction of being the author with the highest number of documents, totaling 43, followed by Seiler Michael J with 36 documents to their credit. Furthermore, the thickness of the link between any two authors is an indicator of the strength of the collaboration between them. Remarkably, Clayton Jim emerges as the author with the highest total link strength (49).
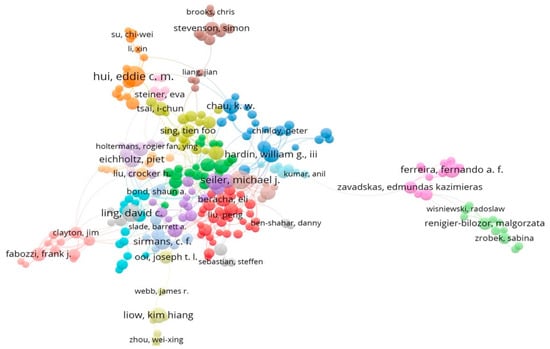
Figure 5.
Bibliometric map of authorship authors in VOSviewer.
3.1.5. Bibliometric Analysis of Co-Citation Sources
The analysis of sources from which publications originate is a key point to consider (Small 1973). It serves for disseminating research findings, discoveries, inventions, and guidance for future research aspects (Farrukh et al. 2020). Furthermore, conducting statistical analysis toward articles’ journal sources allows demonstrating the relationships and influence among journals within the real estate field. According to van Eck and Waltman (2014), bibliographic coupling involves the extent to which the reference lists of publications overlap. The more the number of references two publications share, the stronger their bibliographic coupling relationship. Figure 6 illustrates the bibliographic coupling of sources; by employing a minimum threshold of five documents and fractional counting methodology, the final sample comprises 390 sources. It presents the most productive sources with node volume and points, where the node size indicates the number of articles published by a source. The number of bibliographic coupling links between two documents is determined by the number of shared references they cite together. The top five journals were the Journal of Real Estate Finance (713 publications), Real Estate Economics (424 publications), Sustainability (377 publications), the Journal of Real Estate Research (211 publications), and Urban Studies (185 publications) (Figure 7).
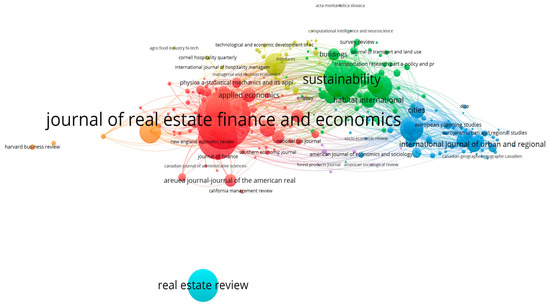
Figure 6.
Bibliometric map of co-citation sources in VOSviewer.
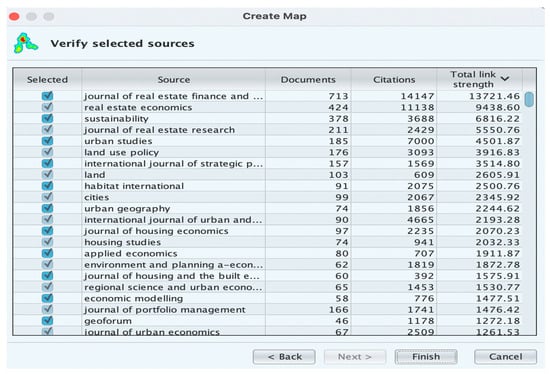
Figure 7.
The most influential journals of bibliographic coupling analysis.
3.1.6. Bibliometric Analysis of Co-Citation Network of Cited Authors
In order to understand the most cited authors in the real estate research, a co-citation network map of cited authors in the real estate field is displayed in Figure 8. The minimum number of citations for an author is set at 20. Of the 141,270 authors, 2371 meet the threshold. VOSviewer selected 1000 authors with the greatest total link strength and categorized them into six clusters. The authors with the highest number of citations are Fama EF (1047 citations), Case Karl E (762 citations), and Ling David C (662 citations), who appeared in both bibliographic coupling and co-citation analysis with others such as Hui Eddie C (430 citations) and Clayton J (331 citations). This indicates the continuous impact and high-ranking level of these authors. The top three authors with most publications are from the US: the economist Eugene F Fama (University of Chicago Booth School of Business), Case Karl E (Wellesley College, Massachusetts), and Ling David C (University of Florida). These three authors have contributed a lot to the research and development in real estate, finance, and economics.
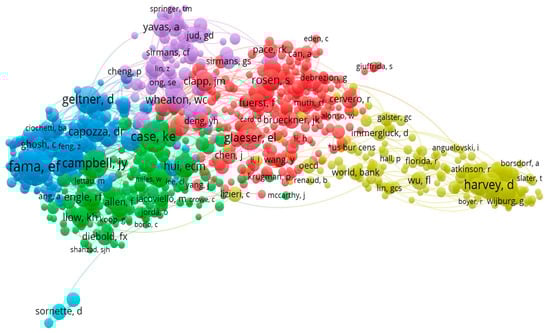
Figure 8.
Bibliometric map of co-citation authors in VOSviewer.
3.2. SciMAT Mapping Analysis of Real Estate
This bibliometric methodology enables the analysis of a research field and the visualization of its conceptual subdomains, along with its thematic evolution within specific periods. The research themes are classified based on their centrality and density rank values into a strategic diagram (Callon et al. 1991). Centrality indicates the degree of interaction of a network with other networks, whereas density reflects the internal strength of the network. Consequently, four categories of themes can be identified according to the quadrant in which they are situated, as illustrated in the example in Figure 9a.
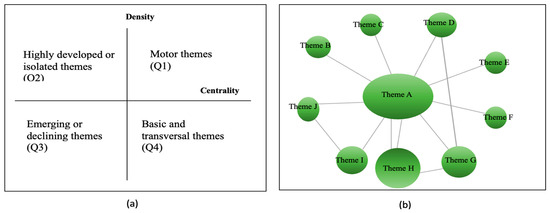
Figure 9.
(a) Strategic diagram. (b) Thematic diagram.
- -
- Themes in quadrant 1 (Q1) are known as the motor themes, which are important for developing and structuring the research field. They present strong centrality and high density.
- -
- Themes in quadrant 2 (Q2) are identified as highly developed and isolated themes. They are strongly related and highly specialized, but they are not important for the field.
- -
- Themes in quadrant 3 (Q3) are titled emerging or declining themes. They are weakly developed and exhibit low density and centrality.
- -
- Themes in quadrant 4 (Q4) are important for a research field but are not well developed. They are known as basic and transversal themes.
In a thematic analysis, keywords and their interconnections form a network graph known as a thematic network. This graph illustrates the co-occurrence of research themes and emphasizes the number of relationships between them, as demonstrated in the example provided in Figure 9b.
3.2.1. SciMAT Strategic Diagram and Performance Analysis by Period
Period from 1929 to 2003
Figure 10 depicts the strategic diagram for the first period (1929–2003) with twenty research theme clusters related to real estate, alongside the performance indicator (the number of documents, h-index, and citations) table. Ten of these themes are considered to be key due to their contribution to the growth of knowledge about real estate (motor themes and basic and transversal themes): “returns”, “prices”, “performance”, “investment”, “indexes”, “real estate returns”, “demand”, “stock returns”, “city”, and “firm size”. Based on the number of citations and h-index, the main research themes directly linked to the real estate field for this period are as follows: “returns” (n: 207), “demand” (n: 119), and “prices” (n: 105). It is important to mention that these main research themes identified are included in the key themes (motor themes and basic and transversal themes). Furthermore, it is notable that real estate has remained a significant topic in market analysis over an extended period. Since the inception of studies on this topic, the connected topics have primarily revolved around market analysis, as evidenced by the main research themes cited above (“returns”, “demand”, and “prices”).
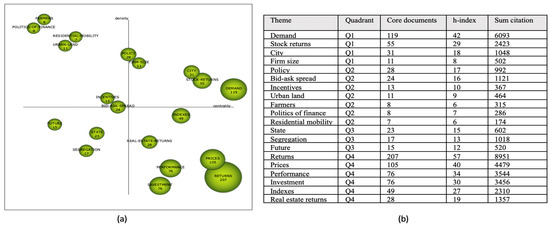
Figure 10.
(a) Strategic diagram (b) performance of research themes from 1929 to 2003. Source: SciMAT.
The thematic network depicted in Figure 11 provides insight into the main research themes and their relationships within the field. In Figure 11a, the “returns” theme emerges prominently, accompanied by numerous subtopics. Notably, “real estate” and “market” stand out as major themes directly linked to “returns”, with the highest number of citations. Additionally, “assets” and “integration” are notable subtopics that exhibit a strong connection, suggesting a significant interplay between these two aspects within the broader context of returns. This visualization underscores the interconnected nature of research themes and highlights key focal points within the field, facilitating a deeper understanding of the relationships between different elements in this field. Similarly, in Figure 11b,c, the “demand” and “prices” themes are showcased, revealing their connections to other major themes.
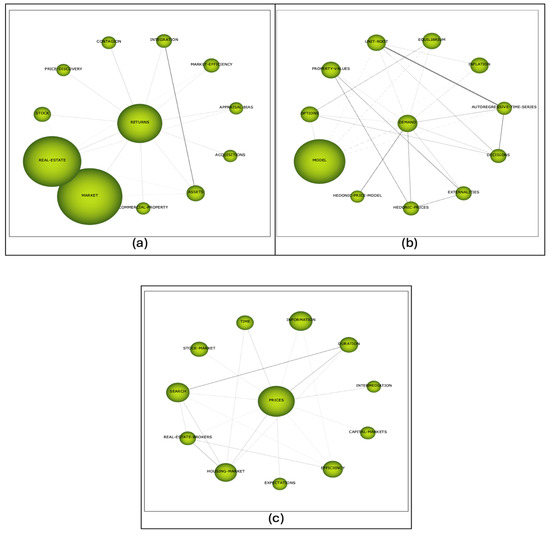
Figure 11.
Thematic network of the main themes in 1929–2003 period. (a) Returns theme. (b) Demand theme. (c) Prices theme.
Period from 2004 to 2013
Figure 12 illustrates the strategic diagram for the second period (2004–2013) with twenty-four research theme clusters. Eight of these themes are considered motor themes and positioned in the first quadrant. Based on the number of their citations, h-index, and their position in the strategic diagram, the main research themes directly related to the real estate field in this period are “risk”, “search”, and “construction”. The “risk” theme is in the first quadrant and has a position with a high value of centrality (33.17) and value density (8.63) with 16,998 references, followed by the “search” theme with a high value of centrality (25.24), the highest value of density (19.68), and 11,797 references. This is followed by the “construction” theme with a centrality value of 21.1, a density value of 9.49, and 15,174 references. These themes have strong external links in various fields and robust strong internal links among their elements. In this period, the emergence of the themes of risk, crashes, and the new financial crisis can be attributed to the economic crisis in 2008 as some analysts (Sornette and Woodard 2010) linked the crisis to the real estate bubble. In Figure 13a, topics related to risk, such as returns, market, and performance, are depicted. Figure 13b showcases topics related to search, including time, listing price, selling price, and duration, with a larger line indicating a stronger connection between these four keywords. Lastly, Figure 13c illustrates the relationship between the construction theme and real estate, with a bigger node representing the highest number of publications relating these two concepts. Additionally, other interconnected themes such as decision-making and price indexes are depicted, highlighting the complexity and interconnectedness within the thematic network during this period.
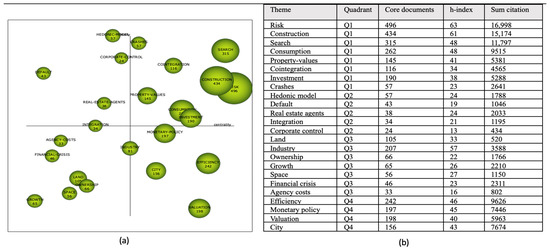
Figure 12.
(a) Strategic diagram (b) performance of research themes from 2004 to 2013. Source: SciMAT.
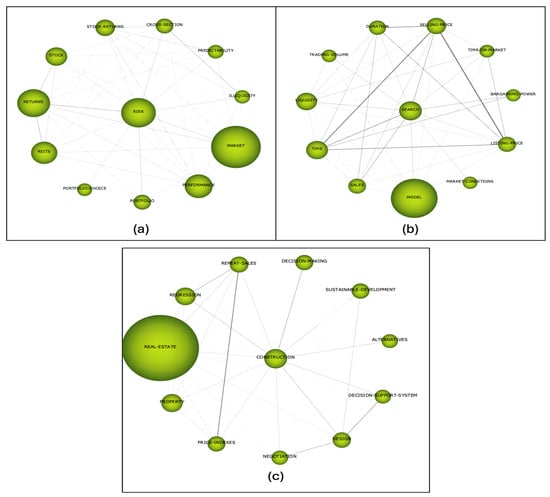
Figure 13.
Thematic network of the main themes in 2004–2013 period. (a) Risk theme. (b) Search theme. (c) Construction.
Period from 2014 to 2023
Figure 14 shows a strategic diagram that depicts the period from 2014 to 2023, showcasing twenty-three research theme clusters, with eight categorized in quadrant 1, denoted as motor themes. Key research themes associated with the real estate field during this period are “time”, “city”, and “REITs” based on their citations, h-index, and strategic diagram placement. The “time” theme presents the highest centrality and density values, along with the highest number of references, with values of 25.16, 1, and 1871, respectively. Following this, the “city” theme has centrality and density values of 18.37 and 0.91, respectively, with 1085 references. Lastly, the “REITs” theme demonstrates a centrality of 23.99, a density of 0.96, and 1036 references. Additionally, in this recent period, new themes such as sustainability and climate change have emerged, highlighting the increasing importance of environmental considerations in the context of real estate.
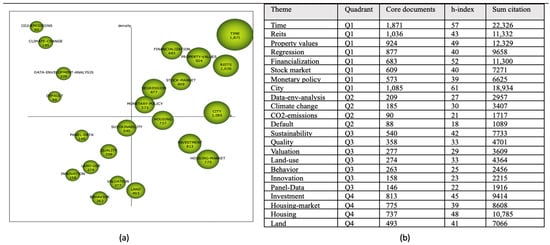
Figure 14.
(a) Strategic diagram (b) performance of research themes from 2014 to 2023. Source: SciMAT.
The “time” theme as shown in Figure 15 is connected to market dynamics, prices, and real estate sector, with a notable emphasis (larger line´s size) on its correlation with listing and selling price as indicated by Knight (2002), highlighting the relationship between pricing and the duration a property spends on the market, underscoring the significance of time-related factors in determining listing and selling prices. The “city” theme is very mature, basic, and influential in the research field and has strong internal and external links with other themes. It is linked to themes such as urbanization, governance, and globalization in one network (see Figure 15).
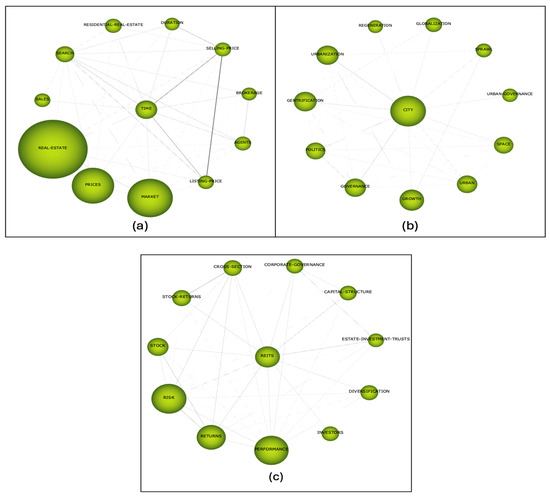
Figure 15.
Thematic network of the main themes in 2014–2023 period. (a) Time theme. (b) City theme. (c) REITs theme.
As shown in the thematic network in Figure 15, the connection between the “REITs” theme and risk, returns, and performance can be attributed to the inherent characteristics of real estate investment trusts. REITs are subject to a range of risks, such as market fluctuations and changes in interest rates, which can significantly affect their returns and overall performance (Benefield et al. 2009; Lee et al. 2008; Orzano and Welling 2017; Salisu et al. 2024).
4. Discussion
The research presented in this paper offers a comprehensive bibliometric analysis of the real estate field, shedding light on its significance, contribution, and motivations. Through investigation, it has uncovered several key findings that underscore the value of such research.
First and foremost, this study contributes to the growing body of knowledge in the real estate domain by providing a systematic and data-driven overview of the research landscape and by identifying the most influential keywords, authors, sources, and the countries where most publications were generated. Furthermore, mapping out the co-citation and co-authorship networks gives a clear picture of the field’s intellectual structure. It shows where research is concentrated and points out opportunities for interdisciplinary collaboration.
The combined use of VOSviewer and SciMAT in this study has provided complementary perspectives on the evolution and thematic focus of real estate research. VOSviewer’s identification of keyword clusters such as urban sustainability, finance and investment, and housing market aligns with SciMAT’s thematic periods, illustrating a progression from economic performance and risk analysis to urban-centric and investment-focused themes. This convergence shows that researchers are exploring more complex and interdisciplinary topics in this field. Furthermore, both tools highlight the importance of understanding financial aspects and urban dynamics, reflecting the ongoing relevance of these themes across different periods of study.
In conclusion, the advantage of this research paper is not only to enhance the understanding of its scholarly landscape but also to provide a valuable tool for stakeholders to make informed decisions, advance knowledge, and address the multifaceted challenges that characterize the real estate sector in today’s dynamic world.
Despite the significant contributions made by this research paper, it is essential to acknowledge its limitations and identify avenues for further work in the field of real estate bibliometrics. One limitation of this study is the reliance on existing databases and sources, which may not capture all relevant publications or accurately represent the entire landscape of real estate research. Additionally, the analysis presented here is based on quantitative metrics, and further qualitative assessments of research content can provide deeper insights.
In terms of future work, there are several promising directions. First is incorporating qualitative methods, such as content analysis or surveys, to offer a richer understanding of the content and context of real estate research. Moreover, investigating the impact and practical applications of research within the real estate sector can bridge the gap between academic work and industry needs. Finally, as the real estate landscape continues to evolve, exploring emerging trends, such as sustainability, technology, and urbanization, will be crucial for keeping the research up-to-date and relevant in addressing the ever-changing challenges and opportunities in the dynamic world of real estate.
Author Contributions
Conceptualization, S.E.B., L.R.M., M.V.d.-l.-F.-A. and D.R.M.; methodology, S.E.B., L.R.M., M.V.d.-l.-F.-A. and D.R.M.; software, S.E.B. and L.R.M.; validation, M.V.d.-l.-F.-A. and D.R.M.; formal analysis, S.E.B., L.R.M., M.V.d.-l.-F.-A. and D.R.M.; investigation, S.E.B.; resources, S.E.B.; data curation, M.V.d.-l.-F.-A.; writing—original draft preparation, S.E.B.; writing—review and editing, L.R.M. and M.V.d.-l.-F.-A.; visualization, D.R.M.; supervision, L.R.M. All authors have read and agreed to the published version of the manuscript.
Funding
This research received no external funding.
Institutional Review Board Statement
Not applicable.
Informed Consent Statement
Not applicable.
Data Availability Statement
The data presented in this study are available on request from the corresponding author.
Conflicts of Interest
The authors declare no conflict of interest.
References
- Annelore, Hofman, and B. Aalbers Manuel. 2019. A finance and real estate driven regime in the United Kingdom. Geoforum 100: 89–100. [Google Scholar]
- Baum, Andrew. 2009. Real Estate Investment: A Strategic Approach, 2nd ed. London: Estates Gazette. [Google Scholar] [CrossRef]
- Benefield, Justin D., Randy I. Anderson, and Leonard V. Zumpano. 2009. Performance differences in property-type diversified versus specialized real estate investment trusts (REITs). Review of Financial Economics 18: 70–79. [Google Scholar] [CrossRef]
- Callon, Michel, Jean P. Courtial, and Françoise Laville. 1991. Co-Word Analysis as a Tool for Describing the Network of Interactions between Basic and Technological Research: The Case of Polymer Chemistry. Scientometrics 22: 155–205. [Google Scholar] [CrossRef]
- Cardarelli, Roberto, Selim Elekdag, and Subir Lall. 2011. Financial stress and economic contractions. Journal of Financial Stability 7: 78–97. [Google Scholar] [CrossRef]
- Chattopadhyay, Sudip. 1999. Estimating the Demand for Air Quality: New Evidence Based on the Chicago Housing Market Estimating the Demand for Air Quality: New Evidence Based on the Chicago Housing Market. Land Economics 75: 22–38. Available online: http://www.jstor.org/stable/3146991 (accessed on 12 January 2016). [CrossRef]
- Donthu, Naveen, Satish Kumar, Debmalya Mukherjee, Nitesh Pandey, and Weng Marc Lim. 2021. How to conduct a bibliometric analysis: An overview and guidelines. Journal of Business Research 133: 285–96. [Google Scholar] [CrossRef]
- El Bied, Salma, Lorenzo Ros-McDonnell, Marivi V. de-la-Fuente-Aragón, and Diego Ros-McDonnell. 2024. Assessing the relationship between particulate matter concentration and property values in Spanish cities. Heliyon 10: e33807. [Google Scholar] [CrossRef] [PubMed]
- Farrukh, Muhammad, Fancheng Meng, Ali Raza, and Muhammad Sohail Tahir. 2020. Twenty-seven years of Sustainable Development Journal: A bibliometric analysis. Sustainable Development 28: 1725–37. [Google Scholar] [CrossRef]
- Filliatreau, Ghislaine. 2009. Bibliométrie et évaluation en sciences humaines et sociales: Une brève introduction. Revue d’Histoire Moderne & Contemporaine 55-4bis: 61–66. [Google Scholar] [CrossRef]
- Glickman, Edward A. 2014. An Introduction to Real Estate Finance. Amsterdam: Elsevier. [Google Scholar] [CrossRef]
- Goodchild, Robin, and Éamonn D’Arcy. 2018. An International Overview of Real Estate Markets. London: Routledge. [Google Scholar]
- Jayantha, Wadu Mesthrige, and Olugbenga Timo Oladinrin. 2020. Bibliometric analysis of hedonic price model using CiteSpace. International Journal of Housing Markets and Analysis 13: 357–71. [Google Scholar] [CrossRef]
- Jones, Colin, and Charlotte Macdonald. 2004. Sustainable Urban Form and Real Estate Markets. Paper presented at the annual European Real Estate Conference, Milan, Italy, June 2–5. [Google Scholar]
- Kauko, Tom. 2019. Innovation in urban real estate: The role of sustainability. Property Management 37: 197–214. [Google Scholar] [CrossRef]
- Kauko, Tom. 2023. On the Resilience of Urban Real Estate Development. Qeios 2: 2–3. [Google Scholar] [CrossRef]
- Kilbert, Charles J. 2005. Sustainable Construction: Green Building Design and Delivery. Hoboken: John Wiley & Sons Inc. [Google Scholar]
- Knight, John R. 2002. Listing price, time on market, and ultimate selling price: Causes and effects of listing price changes. Real Estate Economics 30: 213–37. [Google Scholar] [CrossRef]
- Lambiri, Dionysia, and Antonios Rovolis. 2014. Real estate, and housing markets. In Handbook of Regional Science. Berlin and Heidelberg: Springer, pp. 125–45. [Google Scholar] [CrossRef]
- Lee, Ming-Long, Ming-Te Lee, and Kevin C. H. Chiang. 2008. Real estate risk exposure of equity real estate investment trusts. Journal of Real Estate Finance and Economics 36: 165–81. [Google Scholar] [CrossRef]
- Linda, Kauskale, and Geipele Ineta. 2017. Integrated approach of real estate market analysis in sustainable development context for decision making. Procedia Engineering 172: 505–12. [Google Scholar]
- Moscone, Francesco, Elisa Tosetti, and Alessandra Canepa. 2014. Real estate market and financial stability in US metropolitan areas: A dynamic model with spatial effects. Regional Science and Urban Economics 49: 129–46. [Google Scholar] [CrossRef]
- Mörschbächer, Ana Paula, and Camille Eichelberger Granada. 2022. Mapping the worldwide knowledge of antimicrobial substances produced by Lactobacillus spp.: A bibliometric analysis. Biochemical Engineering Journal 180: 108343. [Google Scholar] [CrossRef]
- Orzano, Michael, and John Welling. 2017. Research Real Estate Contributors the Impact of Rising Interest Rates on Reits. New York: S&P Global. [Google Scholar]
- Petrisor, Alexandru-Ionut. 2017. A Diversity-Based Approach to the Spatial Development of Socio-Ecological Systems. București: INCD URBAN-INCERC. [Google Scholar]
- Pinto, María, Antonio Pulgarín, and M. Isabel Escalona. 2014. Viewing information literacy concepts: A comparison of two branches of knowledge. Scientometrics 98: 2311–29. [Google Scholar] [CrossRef]
- Pritchard, Alan. 1968. Statistical Analysis of Bibliographic Structure. London: North-Western Polytechnic School of Libriarianship. [Google Scholar]
- Rathnasingha, D. L. P. M., and Ali Khatibi. 2012. Residential Mortgage Default at Housing Development Finance Corporation of Sri Lanka: EPF Security-A Review. Paper presented at the Annual Research Symposium 2012, Colombo, Sri Lanka, August 16–17. [Google Scholar]
- Salisu, Afees A., Ahamuefula E. Ogbonna, and Xuan Vinh Vo. 2024. Climate risks and the REITs market. International Journal of Finance and Economics. Early View. [Google Scholar] [CrossRef]
- Salzman, Diego, and Remco C. J. Zwinkels. 2017. Behavioral Real Estate. Journal of Real Estate Literature 25: 77–106. [Google Scholar] [CrossRef]
- Schaer, Philipp. 2013. Applied informetrics for digital libraries: An overview of foundations, problems and current approaches. Historical Social Research/Historische Sozialforschung 38: 267–81. [Google Scholar]
- Sharifi, Ayyoob. 2021. Urban sustainability assessment: An overview and bibliometric analysis. Ecological Indicators 121: 107102. [Google Scholar] [CrossRef]
- Small, Henry. 1973. Co-citation in the scientific literature: A new measure of the relationship between two documents. Journal of the American Society for Information Science 24: 265–69. [Google Scholar] [CrossRef]
- Sornette, Didier, and Ryan Woodard. 2010. Financial Bubbles, Real Estate Bubbles, Derivative Bubbles, and the Financial and Economic Crisis. In Econophysics Approaches to Large-Scale Business Data and Financial Crisis. Edited by Misako Takayasu, Tsutomu Watanabe and Hideki Takayasu. Tokyo: Springer, pp. 101–48. [Google Scholar]
- Tian, Chuanhao, Xintian Peng, and Xiang Zhang. 2021. COVID-19 pandemic, urban resilience and real estate prices: The experience of cities in the yangtze river delta in china. Land 10: 960. [Google Scholar] [CrossRef]
- Trinkūnas, Vaidotas, Laura Tupėnaitė, Saulius Raslanas, Nikolai Siniak, Arturas Kaklauskas, Renaldas Gudauskas, Jurga Naimavičienė, Arune Binkytė, Darius Prialgauskas, and Živile Tunčikienė. 2018. Sustainable development of real estate: Decision support model and recommendations for the period of crisis. International Journal of Strategic Property Management 22: 252–64. [Google Scholar] [CrossRef]
- van Eck, Nees Jan, and Ludo Waltman. 2014. Visualizing Bibliometric Networks. In Measuring Scholarly Impact. Berlin: Springer International Publishing, pp. 285–320. [Google Scholar] [CrossRef]
- Yang, Cheng-Hong, Borcy Lee, and Yu Da Lin. 2022. Effect of Money Supply, Population, and Rent on Real Estate: A Clustering Analysis in Taiwan. Mathematics 10: 1155. [Google Scholar] [CrossRef]
- Yu, Yuetian, Yujie Li, Zhongheng Zhang, Zhichun Gu, Han Zhong, Qiongfang Zha, Luyu Yang, Cheng Zhu, and Erzhen Chen. 2020. A bibliometric analysis using VOSviewer of publications on COVID-19. Annals of Translational Medicine 8: 816–16. [Google Scholar] [CrossRef]
Disclaimer/Publisher’s Note: The statements, opinions and data contained in all publications are solely those of the individual author(s) and contributor(s) and not of MDPI and/or the editor(s). MDPI and/or the editor(s) disclaim responsibility for any injury to people or property resulting from any ideas, methods, instructions or products referred to in the content. |
© 2024 by the authors. Licensee MDPI, Basel, Switzerland. This article is an open access article distributed under the terms and conditions of the Creative Commons Attribution (CC BY) license (https://creativecommons.org/licenses/by/4.0/).