Abstract
This paper describes large, fine-grained, intentionally inclusive, research-based cognitive models called learning maps. Learning maps are the product of an intensive research synthesis process to develop formal learning models that better reflect the diversity of how learners can learn and be assessed on academic content. Students begin at different places and learn at different rates, and they may have cognitive disabilities or may face a variety of barriers that pose challenges when learning content. Learning maps provide numerous starting points and pathways by which students can acquire and demonstrate knowledge, skills, and understandings. Our work in developing learning maps relies on principles of Universal Design for Learning (UDL), which provides a foundation of flexibility and inclusivity to accommodate students with a wide range of cognitive, linguistic, physical, and sensory profiles. In this paper, we describe learning map design, development, and both qualitative and quantitative methods for the evaluation of map structure. In addition, we offer reflections on our experiences with implementing learning maps as the cognitive architecture for assessments and educational interventions through our work on a variety of projects. With examples from these projects, we describe evidence that shows how learning maps can be useful tools for improving instruction and assessment for all learners. We identify areas where further research and inquiry could prove fruitful and conclude with a discussion of potential areas of extension and offer suggestions for the ongoing refinement of learning maps.
1. Introduction
Every academic year, K–12 students arrive in classrooms across the United States and bring with them unique prior knowledge and skills at differing levels of mastery. Once in classrooms, students receive instruction based on grade-specific expectations described by academic content standards (Every Student Succeeds Act [ESSA], 2015). Standardized assessments at the building, district, and state levels guide curricular choices and contribute to standardization within the educational system. However, teachers make choices that are based on their students, classrooms, and curricula; students start at different places and learn at different rates, and many have disabilities or language barriers that introduce challenges to learning the academic content. The tension between the diversity of learners and the standardization they encounter within the educational system is an established problem, with downstream effects that include students falling further behind as school progresses, difficulty in providing appropriate instruction differentiated for individual learners, achievement gaps between groups of students, and issues of equity and access. There are many challenges in education, including providing high-quality, standards-based academic instruction, determining how to differentiate teaching to meet the needs of a wide range of students at varying levels of content mastery (Tomlinson, 2000), designing assessments that yield information for their intended purposes, supporting teachers in using assessment data to guide instructional decisions (Mandinach & Jimerson, 2016), and ensuring that both instruction and assessment are designed inclusively (Karvonen et al., 2020). A generally accepted approach to confronting these problems is to use cognitive models to represent the knowledge, skills, and understandings (KSUs) described by academic content standards (National Governors Association Center for Best Practices & Council of Chief State School Officers, 2010; Pellegrino et al., 2016) and to base assessments on those same models. A cognitive model is a descriptive representation of the cognitive processes involved in the acquisition of the crucial KSUs needed to learn specific concepts or domains (Ohlsson, 2008). One type of cognitive model is a learning map. Unlike academic standards and most learning progressions, learning maps represent multiple potential pathways by which students may acquire KSUs. This approach of representing the diversity of KSU acquisition affords individual students more ways to reach their learning goals. Learning maps support assessment and instruction by introducing variability within standardized educational approaches. For example, learning maps can help teachers who follow a standard scope and sequence differentiate instruction for students who do not follow the dominant or prescribed instructional path. Teachers can use learning maps to identify related KSUs that build across units and support those who need additional instruction on earlier concepts while learning new ones. Assessments based on learning maps support differentiated access to the tested construct so assessment results provide evidence of what all students know relative to the construct, regardless of their proficiency.
This paper describes an approach to developing large, fine-grained, intentionally inclusive, research-based learning maps that synthesize a variety of cognitive models to better reflect the diversity of how learners can learn and be assessed on academic content. We draw from examples across multiple projects to describe procedures for developing and validating learning maps and describe their uses for instruction and assessment. Example research questions are described in the Approaches to Validation section.
2. What Is a Learning Map?
A learning map is a model of multiple ways that diverse learners can acquire KSUs in a particular domain. The term learning map has been used in different contexts to describe a network model of how learning occurs within a particular domain (e.g., Knight, 2013; Marsick, 1994; Popham, 2011). Our definition of a learning map is a particular type of cognitive model of learning that are formal representations of thought processes that show how humans perceive, process, and retain new information. The learning maps we describe meet Ohlsson’s (2008) definition of a cognitive model in that the KSUs represented in the map do not require specific sensorimotor actions to demonstrate mastery. Furthermore, the learning maps we describe reflect a theory of learning by representing the multiple hypothesized pathways that depict student learning in a network structure. These models are large, detailed, interconnected, web-like representations of KSUs that represent the learning in a particular domain (Bechard et al., 2012). A learning map is an acyclic graph that represents interconnected KSUs to represent a domain. Individual KSUs are represented as nodes in the map with directional connections between nodes that show the order of acquisition of learning.
Learning maps represent cognitive KSUs. They do not prescribe the environments in which learning occurs or the means of engagement, representation, action, or expression. Using learning maps, educators can choose the means of instruction, the ways students demonstrate their learning, and the ways to interest, challenge, and motivate students according to their individual characteristics that maximize student learning.
Map developers must define the content domain they intend to represent. A domain can be constrained to a small area of focus or broadly encompass an academic content area. Any definition of the domain should focus on the cognitive KSUs learners acquire, including those aligned with any expectations for mastery that learners should achieve. In academic contexts, the domain can be anchored by academic content standards that provide grade-specific examples of what students should know and be able to do in a particular content area. Approaches to setting boundaries on the domain to be represented in a learning map depend on the intended purposes and uses of the map. For example, learning maps can be developed to cover a small set of interconnected procedural skills (e.g., identifying and extending patterns) or to represent the domain of content a student is expected to learn across multiple years of instruction (e.g., K–12 mathematics).
Although learning maps can represent a domain that is reflected in standards or curriculum, learning maps are not curricular scope-and-sequence documents. Curriculum designers use scope-and-sequence documents as an organizing framework that represents instructional targets for a particular domain and the sequence in which the skills should be ordered (Kridel, 2010). These documents may look like learning maps if they represent multiple potential trajectories of instruction, but they focus on curricular decisions to support a course of instruction, not on representations of learning. For example, scope-and-sequence documents may represent specific instructional activities or procedural skills, but they rarely offer detailed, discrete representations of KSUs that describe learners’ cognitive representations across multiple pathways.
Traditionally, cognitive taxonomies (e.g., Bloom, 1956) have been used to describe generic hierarchies of cognitive processes; a cognitive process may then be paired with content to define a learning target. Learners develop increasingly complex understandings by moving up the levels of the taxonomy with the same content. Historically, taxonomies such as Bloom’s were unidimensional, cumulative, hierarchical frameworks. In contrast, the revision of Bloom’s taxonomy (Anderson & Krathwohl, 2001) describes the cognitive processes by which thinkers encounter and work with knowledge (Armstrong, 2010), as reflected in four knowledge dimensions (i.e., factual, conceptual, procedural, metacognitive) that intersect with the six cognitive process dimensions (i.e., knowledge, comprehension, application, analysis, synthesis, and evaluation). The result is a two-dimensional taxonomy that acknowledges that thought processes occur within specific learning contexts. This type of taxonomy can be useful, but it still fails to show the more complex relationships between content and cognitive process as learners develop knowledge in a domain. In contrast, a learning map structure depicts the various ways in which student thinking in a content area becomes more sophisticated and complex over time (Wilson & Bertenthal, 2005). Rather than representing academic content and cognitive processes as separate dimensions, a learning map models both the content and the processes in a single structure (i.e., nodes) and models the increasing sophistication of knowledge through pathways.
Learning maps offer other potential benefits over other cognitive taxonomies and models. Learning maps can align to highly valued core concepts and larger enduring understandings, which may be reflected in specific grade-level content standards but are essential to support learning over time (Wiggins & McTighe, 2001). Because learning maps represent an ordered set of relationships between KSUs, a map may be aligned to different content standards across grade levels, offering starting points for students who may be ready to begin learning above or below their enrolled grade level. Additionally, learning map structures can directly represent interconnections between different academic disciplines. For example, the cognitive skills required to read a data table may be taught in a specific context in mathematics, but they are also important within science and social studies and are crucial to support increased understanding of data representation and use across grade levels.
2.1. Structure
Learning maps contain two fundamental elements: nodes and connections. Both elements are defined through a comprehensive research synthesis. Nodes depict the KSUs within a domain and vary in complexity or grain size. For example, the KSUs in a node can focus on specific academic content (e.g., recognize the difference between living and nonliving things) or preacademic or foundational skills (e.g., demonstrate object constancy by seeking objects when they are hidden) and can have a very small grain size (e.g., count by ones to 10) or larger grain size (e.g., demonstrate cardinality). Unidirectional connections indicate the order of KSU acquisition, with less complex nodes preceding more complex nodes. In an example map structure representing life sciences, “recognize the difference between living and nonliving things” may be a prerequisite for the adjacent KSU “describe the availability of living and nonliving resources in different habitats”. There is a dependency between these two KSUs in that acquisition of the latter KSU requires the presence, or mastery, of the former. In the learning map structure, this dependency is represented by the connection between KSUs, with the direction indicating the order of the dependency. In some cases, the order of acquisition represents a specific developmental process. In other cases, connections characterize empirical findings or logical progressions between KSUs. Depending on their degree of conceptual interconnectedness with other KSUs in the content area, nodes may have multiple preceding and succeeding nodes. In general, nodes with many connections with other nodes in learning map models are considered more important within a domain than nodes with fewer connections. Figure 1 shows an example of the learning map structure, from least to most complex KSUs, in the domain of English language arts (ELA). Circles represent nodes, and the arrows between them depict connections and their order of acquisition. The nodes higher in the learning map structure support the acquisition of lower nodes, with the final node signifying a learning target. The connections through the structure depict the multiple pathways representing the varied ways in which students may advance in learning the domain’s content.
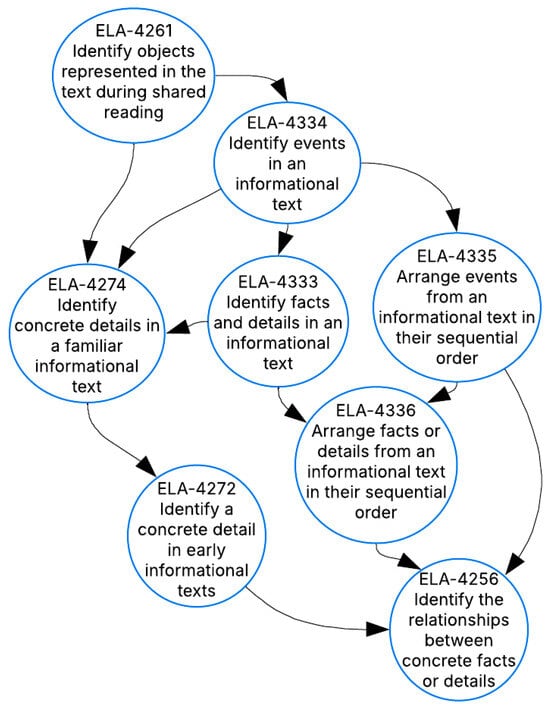
Figure 1.
An example of a learning map structure.
2.2. Differentiation from Other Models of Learning
As a model, learning maps are different from learning progressions, computational models of cognition and learning, and cognitive architectures. Learning progressions (Confrey et al., 2014, 2017; Shepard, 2018) are structured around key ideas or understandings, such as grade-level content standards (Bechard et al., 2012), and they represent student learning through a sequence of building-block KSUs that contribute to their mastery (Hess, 2012b; Popham, 2011). As defined by the National Research Council (2007), “learning progressions are descriptions of the successively more sophisticated ways of thinking about an important domain of knowledge and practice that can follow one another as children learn about and investigate a topic over a broad span of time” (p. 219). In practice, learning progressions usually include only a single, linear pathway that depicts a typical trajectory of learning content and may not account for how students with exceptionalities learn (Hess, 2012b). In contrast, the KSUs and the relationships that comprise learning maps become progressively more complex over time and provide potential intermediate targets that can guide student learning and instruction (Bechard et al., 2012).
Learning maps also differ from the computational models of human cognition and learning that emerged in the mid-20th century in cognitive science because of advances in computing that allow for the simulation of cognitive processes (Sun, 2008). These computational models are typically developed to generate and test hypotheses about learning mechanisms or representational structures that can explain empirical phenomena (McClelland, 2009). A common form of a computational model of learning is a connectionist model, which includes units (sometimes called nodes) and connections that are inspired by neural systems (Thomas & McClelland, 2008). Unlike learning maps, the scope and application of connectionist models, and computational models of learning more generally, are to illustrate the mechanistic processes of learning and are not intended to represent a large domain of knowledge within a content area. For example, Rumelhart and McClelland (1986) used a connectionist model to test whether rule learning was necessary to simulate the developmental pattern of over-regularizing and then correctly learning past tense verbs (e.g., a young child saying “goed” as the past tense of “go” before learning to say “went”). Their model demonstrated that both over-regularization and correct production of past tense verbs could result from distributed representations acquired through experience without explicit rules. Learning maps, on the other hand, are designed to address the pattern seen over learning rather than the underlying learning mechanisms that account for it. For the example of past tense verbs, a learning map would specify that receptive understanding of verb tense typically precedes production of past tense verbs and that the correct production of irregular past tense follows production of the regular past tense. A learning map may also represent the receptive versus productive use of verbs across spoken or signed and written language, depending on the intended application of the learning map. These types of models are designed to address different levels of understanding learning and are suited to different purposes. However, studies that provide evidence of mechanistic learning processes could inform the design of a learning map.
Other models to emerge from cognitive science research are cognitive architectures, which are designed to support artificial intelligence (Kotseruba & Tsotsos, 2020). The focus of cognitive architectures is to produce intelligent behavior of artificial systems, such as voice assistants or autonomous robots, leading to a focus on cognitive processes much broader than academic learning (e.g., attention, action planning, social interaction; Kotseruba & Tsotsos, 2020). Cognitive architectures may not try to emulate human-like learning but rather focus on human-like behavior. Cognitive architectures typically have small granularity at both the action and concept levels; in addition to determining if a learner gives a correct response, the small granularity determines if a learner gives a correct response and allows the evaluation of each step a learner takes for a particular task. For example, one academic application of a cognitive architecture to education is ACT-R in intelligent tutoring systems for mathematics (Ritter et al., 2007). In this system, ACT-R represents the declarative and procedural knowledge needed to complete mathematics problems, and the tutoring interface monitors performance to identify when the student might be missing underlying knowledge. For instance, in tutoring strategies for division by fractions (Rittle-Johnson & Koedinger, 2001), the model represents declarative knowledge about the specific fraction in a problem (i.e., for two-thirds, it represents that it is a number, it is a fraction, two is the numerator, and three is the denominator) as well as the procedures needed to implement a strategy (i.e., to invert and multiply, identify the dividend and divisor, represent both as fractions, convert mixed numbers to fractions if needed, invert divisor, etc.). This approach requires breaking down both declarative and procedural knowledge into the smallest components possible to identify potential gaps or incorrectly executed steps in student performance. By contrast, a learning map section on fraction division builds conceptual knowledge related to fractions and division problems (e.g., recognizing denominator, explaining division problems, and solving word problems involving fractions) without specifying the actions a student could take to apply or demonstrate their knowledge.
Learning maps may be more useful in representing student learning for the instruction and assessment of academic domains, compared with other approaches described in this section, for two primary reasons. First, learning maps include different nodes that can be selected as targets depending on the learner’s goals, needs, and prior knowledge, and each selected target has multiple pathways leading to it. Second, because these models can depict the relationships and interactions between the KSUs within and across topics in a content area, learning maps represent how students can use related knowledge to attain their current academic target. These characteristics of learning maps make them appropriate tools for supporting learner variability when creating profiles of KSU mastery at a point in time and when showing trajectories of learning over time.
2.3. Uses of Learning Maps
The essential characteristics of learning maps (e.g., multiple pathways, relevance for diverse learners, and depiction of relationships between KSUs within and across domains) make them valuable for assessment and instruction.
A common aim for cognitive models in education is to support the design of formal assessments that might cover a large instructional unit, the standards taught in an entire marking period, or sampling the full breadth of content standards taught during the year. Learning progressions can guide the development of classroom or standardized assessments because of their organized and empirically based foundation (Alonzo & Steedle, 2008). Learning maps are especially well suited to evidence-centered design approaches because they are an output of the domain-modeling stage of assessment development (Bechard et al., 2019; Karvonen et al., 2020; Mislevy, 2011). In evidence-centered design (Mislevy et al., 2003), assessment designers develop models of student cognition as structures for organizing evidence of cognition elicited through specific task models. Across instantiations, these have been labeled student models, domain models, and sometimes proficiency models. Here, we use the more common domain model. The KSUs defined within the domain model are latent and therefore cannot be directly observed without an understanding of the skills required. The purpose of the domain model is to articulate which KSUs will be targeted in the assessment and then linked to a particular type of evidence (i.e., behavior) that will be elicited through the assessment via an appropriate task model. Student performance on a task then enables test designers to articulate specific claims about what students know and can do. The critical KSUs in learning maps highlight the benchmarks and intermediate goals progressing toward the key targets in the assessment (Wilson, 2009).
Map structures can highlight especially important nodes that may be prioritized as assessment targets. For example, a node with several incoming paths may represent a critical stage in students’ KSUs. Maps help identify important content leading up to and extending past a high-priority target (e.g., the grade-level expectation articulated in an academic content standard). A stakeholder approach may instead look to content standards in prior grades. Maps offer a clearer content progression that shows what comes next, which can help assessment users focus on maintaining the highest possible expectations and avoid the pitfall of describing a student in terms of their achievement of expectations from lower grade levels (e.g., Minnema et al., 2004). A rationale for how assessment targets are identified in a map may support a stronger validity claim based on content-related evidence, compared with a more traditional approach such as relying on stakeholders’ subjective judgments about which targets are most important to include.
After assessment targets are selected, learning maps can also support the assessment development process. Node observations, or descriptive statements of how students may demonstrate their mastery of the KSU represented by a node, indicate what type of behavior is expected during assessment. Evidence of the behavior may vary, and node observations do not constrain the form of evidence. In contrast to methods in which test developers meet test specifications by mixing and matching content and cognitive processes, writing items to align to node observations promotes alignment on both the content and cognitive process dimensions. Items can be written to measure the nodes that are assessment targets. Nodes near the assessment targets can suggest potential distractors representing common misunderstandings. Students’ item responses produce evidence of their mastery of nodes, indicating their current mastery of KSUs and locations within learning maps.
Depending on the test design, map structures can also promote efficient assessment administration and the way results are presented. For example, a computer-based test can be item- or stage-adaptive to gain maximum information on nodes where the system is least certain about student mastery. In a system that supports the reporting of results at a fine grain size, teachers can use a class-level report to check how many students have mastered the tested nodes and then use those results to make decisions about reteaching, differentiation, or individualized instruction as needed.
Learning maps can also help educators guide future instruction through formative assessment practices (Daro et al., 2011; Heritage, 2008; Hess, 2008, 2012a). For example, fine-grained learning maps or clusters of nodes and connections within larger learning maps can highlight all the relevant stepping-stone stages leading toward instructional goals. Educators can use the map or cluster of nodes with formative assessment processes to identify where students currently stand in their mastery of KSUs (Daro et al., 2011). The map structure then provides additional information about what students still need to learn and the multiple pathways they may take to close the gap between current learning and instructional goals (Bechard et al., 2012). This information can then be used for individual or group differentiation while acknowledging student strengths and areas of needed improvement. When planning differentiated instruction, a teacher can use a learning map to identify appropriate pathways and critical KSUs matching their students’ needs. In practice, this process may result in some students working toward more proximate goals, some students engaging in guided practice on targeted skills, and other students “moving on” to the next set of KSUs targeted for instruction within the learning map or cluster of nodes. For example, teachers have been able to use segments of learning maps to support their formative assessment practices and instructional decisions in writing instruction for students with intellectual disability (Kobrin et al., 2023). Map-driven formative assessment practices can improve educators’ knowledge of student learning, their use of formative assessment results, and their understanding of how to help struggling students (Hess, 2012a).
Regardless of whether teachers have access to map-based assessment results or just the maps themselves, maps can benefit instruction by providing educators with a detailed understanding of the critical KSUs and various orders of acquisition among students’ current learning. Maps can bolster academic content knowledge for teachers with more generalist backgrounds (e.g., elementary or special educators). Learning maps also provide information about how conceptually linked skills can be taught together with an instructional focus on groups of nodes. Because learning maps show multiple pathways, instruction can focus on regions within the map that provide multiple access points for students who may approach an academic target from different directions.
Finally, learners can use learning maps to direct their own learning. Self-directed learning, including self-regulation behaviors during learning, requires the learner to effectively set goals, monitor performance, and adjust behaviors to attain goals (Schraw et al., 2006; Zimmerman et al., 2002). Learning maps can help students self-direct learning by helping them identify paths to short- and long-term goals based on nodes beginning with their current location of mastery within the map and then supporting them as they regularly compare their performance on goal-related tasks with the KSUs as reflected in nodes in the map (Bechard et al., 2012). Depending on their performance, students can make adjustments to their goals and learning strategies, along with educator guidance and support.
2.4. Examples of Learning Maps-Based Projects and Programs
We have developed and used learning maps in several projects over the past decade. We first began developing learning maps in 2011 with funding from the U.S. Department of Education’s Office of Special Education Programs to develop a learning map-based alternate assessment system for students with significant cognitive disabilities. The Dynamic Learning Maps (DLM) Alternate Assessment System assesses students with significant cognitive disabilities on their academic achievement with respect to grades 3 through high school. The DLM system, used operationally in states since 2015, is the first large-scale assessment system used for accountability purposes that incorporates ELA and mathematics learning maps as part of the assessment system architecture (N. M. Kingston et al., 2016).
Given the examinee population, the DLM Consortium combined principles of evidence-centered design and Universal Design for Learning (UDL; CAST, 2018) to build the DLM learning maps and assessments (Bechard et al., 2019; Karvonen et al., 2020). For example, each content area map encompasses an academic domain, with skills ranging from preacademic to the KSUs in high school content standards. The research syntheses used to develop the DLM maps include both conceptual and empirical literature on how students with and without disabilities develop KSUs and learn content in the academic domains. The KSUs represented in the nodes are intentionally inclusive and allow learners to demonstrate their mastery regardless of their mode of expressive communication or physical or sensory profiles. In limited cases where students may not be able to access a node because of their disability (e.g., a student who is deaf will not learn rhyming auditorily), multiple pathways allow students to make progress in the domain. DLM assessment developers design items that maximize the possible ways that students can demonstrate mastery of nodes related to grade-level content standards. Assessment developers use task models and small sections of the map when writing items (Bechard et al., 2019). This information promotes a well-aligned assessment by showing the assessment target in the context of related KSUs that are not assessment targets, essentially preventing misalignment to nearby nodes. Assessment results indicate the degree of student mastery in a subject using evidence from student responses to multiple assessment items aligned to nodes in the learning map structure. Student score reports contain information about overall achievement in the subject, mastery of clusters of content standards called conceptual areas, and fine-grained information about the level of mastery of each tested content standard. DLM assessment results are used for summative purposes, but they can also be used to guide instruction because they report what a student has mastered in the context of the content that comes next in the map. In DLM score reports, where individual node descriptions are synthesized into cluster-level descriptions that look more like a linear progression, teachers can interpret fine-grained mastery data to identify student strengths and areas for improvement, make connections across content standards, and plan subsequent instruction (Clark et al., 2018). On an annual teacher survey, about half of respondents (49.6%) agreed or strongly agreed that their students’ location on the learning map accurately reflect what they knew and could do, and 62.3% agreed or strongly agreed the information was useful in instructional planning and practice (Beitling & Clark, 2019).
As an extension of the maps developed for the DLM project, N. M. Kingston and Broaddus (2017) used learning maps as the basis for a system to improve formative assessment practices by general education teachers in ELA and mathematics. As part of the Enhanced Learning Maps project, funded by the U.S. Department of Education’s Office of Elementary and Secondary Education, an online interface was developed in partnership with participating educators to use learning maps to support teachers in identifying learning goals, accessing research-based instructional guides and activities, and interpreting evidence of student thinking. Participating teachers indicated that the learning maps have promise, but they reported challenges related to implementation and instructionally sensitive measurement using this type of novel approach to formative assessment and instruction (N. Kingston et al., 2021).
The Innovations in Science Map, Assessment, and Report Technologies (I-SMART) project, funded through a U.S. Department of Education Enhanced Assessment Grant, extended the map development processes from the DLM system and introduced several new ideas about learning map structure. This was the first project to represent three-dimensional science standards based on the Next Generation Science Standards in “neighborhood” maps (i.e., clusters of nodes from a larger learning map model) that contain nodes identified as assessment targets for map-based science assessments for struggling learners with and without disabilities, and for students with significant cognitive disabilities (Swinburne Romine et al., 2018). External review panels identified common pathways students may take through a learning map neighborhood; those pathways informed decisions about which nodes to select as assessment targets. The I-SMART project also connected science neighborhoods to ELA and mathematics maps (Swinburne Romine et al., 2018), introduced more rigorous methods for developing and refining learning map structures (Hoover et al., 2021), and extended the line of maps-based score report research by developing and evaluating a dashboard teachers can use to view map segments and visualize student results within a map structure (Dolan et al., 2020).
The Shared Writing Instructional Model (SWIM) project, funded by the U.S. Department of Education’s Office of Special Education Programs, developed a learning map to support a map-based model of writing instruction for students with intellectual disabilities in grades K–8. The SWIM project used learning maps that represent the development of writing KSUs from the earliest understandings of expressive communication and written language up to and including grade-level English language arts standards. The project staff adapted evidence-based practices in writing instruction to support teachers in using consistent instructional routines to teach students learning clusters of nodes (Swinburne Romine & Thatcher, 2022). Teachers learned how to use these learning maps and related instructional strategies to plan, deliver, and evaluate specially designed writing instruction (Kobrin et al., 2023).
3. Learning Map Construction
Learning map development includes two phases of work that shape the content and structure of the learning map (Dynamic Learning Maps Consortium, 2016; Swinburne Romine et al., 2018). When constructing learning maps, developers define the design criteria and then conduct a systematic literature review to produce a draft map. After initial construction, the draft map is evaluated using a systematic review process. Map developers use feedback from the review process to revise the draft map and produce a final version. This process is described in a subsequent section in which we discuss our approaches to map validation. To establish the design criteria for the map construction phase, developers must answer five questions.
- What are the purposes and intended uses of this learning map? For example, will the map guide instruction, provide the architecture for assessments, or both? The ultimate utility of the map and the selection of appropriate validation techniques will depend on a clearly articulated purpose.
- What are the standards, domain specifications, or learner outcomes to be represented in this learning map? Examples may include high school ELA standards, expectations for accomplishing scientific or technical processes, or even standards for professional practice in a particular occupation.
- What are the boundaries around the domain to be represented in this learning map? Boundaries may be set from the perspective of a particular grade level or for the content included in a specific course or unit of instruction. Boundaries may also be defined by the academic content standards and the intended uses (e.g., a prekindergarten span for a kindergarten readiness assessment, nodes associated with all K–12 standards to support a system of summative assessments).
- What is the desired grain size of KSUs for this learning map? For example, in a map designed for struggling learners, the grain size may be smaller as KSUs are broken down to provide additional incremental learning targets. In contrast, a larger grain size may be appropriate for a population of learners with significant expertise and prior knowledge in a domain.
- What is the required expertise needed for the developers of this map? For example, when developing a map to guide instruction, the team developing the map may need some members with deep understanding of the content and some members with experience teaching the target learner population. If the map is designed to support a heterogeneous population of learners or a homogenous group with complex physical, sensory, or other needs, the team may also include members with expertise in UDL. If the map to be constructed will be based on relatively sparse research literature in the domain, the team may also include general experts on learner cognition. If a team has known gaps in areas of expertise, they may wish to design their validation stage to include that expertise.
After the design criteria are established, map construction begins with a thorough review of current cognitive and developmental literature. An initial literature review gathers information on how the learner population broadly learns the standards, domain, or outcomes (i.e., the steps or stages and the order in which learners typically advance through them), highlighting the critical KSUs and the links between them that may comprise the learning map’s content and structure. Examining the map’s content and structure throughout map construction may suggest broad jumps in student learning (i.e., significant increases in complexity between adjacent KSUs), potential difficulties that the learner population may encounter in their learning, or areas insufficiently covered by the initial literature review. Additional literature reviews may eliminate coverage gaps, potential learner difficulties, and insufficiently covered areas by proposing additional KSUs and links between them until a draft of the map emerges.
Returning to the example of a learning map for an academic domain, the framework of the learning map is developed by translating content standards, common instructional practices, published learning progressions, and effective interventions into KSUs that inform node and connection development. The literature review then highlights the KSUs that serve as the supporting nodes between and preceding the academic targets. These supporting nodes represent the critical KSUs that link the academic targets into a coherent whole and provide the benchmarks students use when advancing their learning. When the literature provides no clear direction on KSUs that fill sections of the map, developers make hypotheses and logical analyses about potential supporting nodes that fill in those sections. In the example section of the learning map shown in Figure 1, the academic content standards addressed as part of the map development process were reading standards in English language arts.
Each node is given a succinct name that summarizes the KSU it represents and an extended description that provides additional detail. In the example map in Figure 1, map developers started with performance expectations described in the standards like “Identify the relationships between concrete facts or details”. Node observations, or descriptions of common ways students demonstrate mastery of KSU, are then written to ensure that each node is unique. In a map designed to support assessments, the node observations describe ways in which the KSU can be measured or observed in the tested population given the assessment design. In a map designed to support instruction, node observations include student behaviors and work products that may be observed in formative assessment during instruction. Regardless of their purpose, it is critical to apply universal design principles (CAST, 2018) to ensure that the maps and their derivative products do not introduce barriers for the population. For example, a node observation “communicate understanding of transitive property” supports multiple means by which that understanding could be communicated. In contrast, a node observation “determine the meaning of spoken words” would introduce barriers to representation for students who are deaf or hard of hearing.
Once an initial set of nodes is specified, developers establish directional connections. This process includes arranging nodes in a tentative order, specifying research-based connections, and filling gaps as determined by expert judgment. Developers begin by ordering nodes by increasing complexity. The literature review may suggest the arrangement of the nodes in the learning map. For example, an empirical study that provides evidence that Skill A precedes Skill B would be represented as Node A with a directional connection to Node B. In the example section of the learning map shown in Figure 1, the literature shows that readers are often able to identify concrete details in familiar texts which they have read multiple times before they are able to demonstrate the same skill in a text they are reading for the first time. This led to the placement of a KSU “identify concrete details in a familiar information text” as a precursor to “identify a concrete detain in early informational texts. For preceding nodes that immediately contribute to the acquisition of succeeding nodes, direct connections link the nodes. Similarly, when there is a hypothesized direct relationship between two skills, a connection is added. The universal design principles of multiple means of representation and expression apply to connections as well. Given maps’ network structure, connections may form alternate pathways around areas of the learning map, allowing students who may need additional or unique support to advance through it. An example of an alternate pathway may be a separate set of nodes that represents concept formation through a particular sensory channel, such as development of phonemic awareness in braille rather than by sight. If the development process includes the creation of multiple interrelated learning maps for a topic (e.g., maps in science and mathematics designed for an integrated unit), the process may include linking the multiple learning maps together through shared or conceptually related nodes.
Finally, creating connections and holistically evaluating the draft map can uncover additional gaps or ambiguities. The literature review may resolve the ambiguities or suggest additional KSUs that may fill in gaps in the learning map. When the literature provides no suggestions, map developers may also remove gaps by conducting a logical analysis to break down a concept or KSU into its component elements (e.g., what are the critical components comprising the concept or KSU? What do learners need to know to progress from Node A to Node B?) and hypothesizing potential nodes and their relationships to fill the gaps. At the end of this process, the map represents the developers’ best possible hypothesis of how learning occurs in the domain.
4. Approaches to Validation
Map validation is a process of evaluating the available evidence and determining if there is support for the map’s hypothesized content (nodes) and structure (connections). Across our projects, we have developed judgment-based and empirical approaches to map validation. These methods have different uses depending on the map and the types of data available to support empirical evaluation. Judgment-based approaches can be used at any point after a draft map is constructed and rely directly on the map itself. Our empirical validation approaches use data based on student responses to assessment items aligned to nodes. These approaches can be used independently or in combination.
4.1. Expert Reviews
4.1.1. Internal
After draft maps are developed, they are internally reviewed by project staff. The purpose of an internal review is to evaluate the draft maps from multiple perspectives to ensure the design criteria are met. Depending on the purpose and scope of the learning map, developers may recruit staff with specific types of expertise. For example, in the DLM project, we included internal reviewers, including experts in the content represented in the maps, accessibility experts with experience working with students with disabilities, educational psychologists, and experts in learning and development. Internal reviewers need to understand the purpose and intended uses of the learning map, the domain definition, and the design criteria. The goal is to gather formative feedback that can inform additional modifications to the draft map before external review.
4.1.2. External
The purpose of an external review of a draft map is to evaluate and further refine the structure and content of the map to improve its accuracy and suitability for the map’s intended purpose and use. Depending on the map content and intended uses, different research questions and criteria might drive decisions about how to approach external review. For example, if a research question is “does the map accurately describe the relationships between KSUs?”, external review methods may rely more on content reviews. If the research questions are “is the learning map likely to be useable for the intended audience?” and “is the learning map likely to support the intended goals for the learner population?”, external reviews might focus on usability and relevance for the intended purpose and learner population. Different types of external reviews may be conducted concurrently or sequentially.
External reviewers provide a fresh perspective on the map structure. External reviewers are experts and stakeholders who were not involved in the development of the draft map. Procedures for designing the external panel review can take various forms, with map developers borrowing from methodological literature on designing panel procedures—for example, from assessment standard setting (Cizek & Bunch, 2006) and alignment (Cizek et al., 2018) methods. Next, we describe an external review procedure piloted by the I-SMART project during the development of learning map neighborhoods (Swinburne Romine et al., 2018); panelists reviewed the maps for content and accessibility. I-SMART maps were developed for students with significant cognitive disabilities and other struggling students who are falling behind grade-level expectations in science.
With a goal of maximizing the diversity of perspectives, backgrounds, and expertise, project staff recruited panelists to serve as external reviewers and organized them into groups of four to seven people to work with a facilitator. Panelists were selected for their expertise in the content of the map, diverse demographic and cultural backgrounds, and experience with the populations of learners for whom the map was designed. Facilitators were selected from project staff according to their experience facilitating other types of panel review events and familiarity with the project aims. Facilitators received training on the procedures before working with their panels. Panelists began the external review with orientation to materials, proceeded to individual evaluation of draft maps, and then moved to within-panel discussion, synthesis, and recommendations. Panelists built an understanding of the map structure, design principles, and intended purpose and use of the maps. Next, panelists used established criteria to independently evaluate the nodes, connections, and overall map structure. They used a rating sheet to indicate their judgments on how elements of the draft map met, partially met, or did not meet the criteria. There were criteria associated with the nodes, connections, and global evaluations for the section of the map being reviewed. Criteria were associated either with questions related to the domain being represented or the accessibility of the content. The criteria used for the I-SMART map review are provided in Table 1.

Table 1.
Node and connection criteria.
Next, the panel facilitator aggregated the individual evaluations and supported the panelists in a discussion of the data, focusing on nodes or connections for which there was disagreement that all criteria were met. Through the discussion, panelists provided consensus (i.e., all panelists agreed on the group’s final decision and recommendation) or near consensus (i.e., the minority viewpoint was also recorded by the facilitator) recommendations according to the established criteria. Through consensus discussion, each panel then identified a pathway through the map that most learners would likely follow. Because the I-SMART panels reviewed map neighborhoods by grade band (grades 3–6, 5–8, and 9–12), the next step included configuring a cross-grade band panel from among members of the three existing panels to evaluate vertical relationships in the content across the neighborhood maps. This process used a facilitated discussion but no individual ratings.
After the panel meeting, project staff referred to panel data when revising and finalizing draft maps. Map developers reviewed panel recommendations and accepted those that met the criteria for logic, consistency within the neighborhood map, and consistency with the research narrative associated with the map. When map developers were not certain if recommended changes met those criteria, they met in small groups with other subject matter and student population experts to discuss how best to resolve the recommendations. Project staff made final decisions to accept or reject panel recommendations for changes to the maps by consensus.
Technical documentation at the end of the panel review process included descriptions of facilitator qualifications and panelists’ expertise and demographics, a summary of panel training procedures, a description of rating methods and percentages of nodes and connections that met and did not meet criteria on individual ratings, consensus recommendations, decision rules for implementing panel feedback, and statistics summarizing final decisions on revisions (Swinburne Romine et al., 2018). In this example, the technical documentation contributes procedural evidence of the technical quality for the map according to its intended purpose and use.
4.2. Empirical Approaches
Much of the existing research on empirical evaluations of cognitive models is based on learning progressions or learning trajectories. These models generally have a stricter structure that identifies a single pathway, whereas learning map structures offer more flexibility in the pathways students might follow. However, many of the methods used to validate learning progressions or trajectories can be adapted for use in a learning map context. These methods range from using classical items statistics to evaluate the difficulty of items at different locations in the progression (e.g., Herrmann-Abell & DeBoer, 2018) to using psychometric models to show differences in student performance across levels of the progression (e.g., Jin et al., 2015) to using controlled interventions to show if the use of learning progressions during instruction is positively related to student outcomes (e.g., Barrett et al., 2012; Supovitz et al., 2018). The next section describes a framework for learning map evaluation, introduced by Thompson and Nash (2019), that draws from the learning progression literature and generalizes the methods to apply to more flexible map-based structures. Our approach to validation takes the form of evaluation where we look for confirmatory and nonconfirmatory findings. All of these methods are based on data collected using assessments with items aligned to nodes.
4.2.1. A Diagnostic Framework for Learning Map Evaluation
The framework described by Thompson and Nash (2019) uses diagnostic classification models (DCMs; Bradshaw, 2016; Rupp et al., 2010) to examine patterns of student mastery across the learning map structure. DCMs are multivariate psychometric models that estimate student KSUs as a set of discrete latent variables rather than a unidimensional trait. That is, rather than a general, continuous measure of student ability that is common to item response theory and classical test theory, DCMs provide a profile of mastery of, or proficiency in, the set of assessed skills. Most DCMs use binary skill indicators (e.g., master/nonmaster, proficient/nonproficient), with scores estimated as the probability that a student has mastered each skill. In practice, a threshold is often set (e.g., 0.80) to report scores as binary master/nonmaster decisions (Bradshaw & Levy, 2019). When using binary skill indicators, there are 2A possible mastery profiles, where A is the number of nodes being assessed. As an example, Table 2 shows the eight mastery profiles possible when there are three assessed nodes. In Table 2, a student with Profile 3 has mastered only Node 2, whereas a student with Profile 7 has mastered Node 2 and Node 3.
Table 2.
Implied mastery profiles for a three-node assessment.
The mastery profiles can be mapped onto a learning map to validate the proposed structures. For example, take a simple map structure with three nodes, as shown in Figure 2. There are multiple ways to interpret the structure shown. The first is a strict interpretation of the pathways, where all arrows represent required prerequisite knowledge. Under this interpretation, mastery of Node 1 is a prerequisite for mastery of Node 2, and both Node 1 and Node 2 must be mastered before Node 3 can be mastered. A more flexible interpretation allows multiple possible pathways to the mastery of Node 3. One pathway is to master Node 1 and then directly proceed to Node 3. A second pathway is to master Node 1, then Node 2, and then finally Node 3. In other words, mastery of Node 2 is no longer a prerequisite for mastery of Node 3.
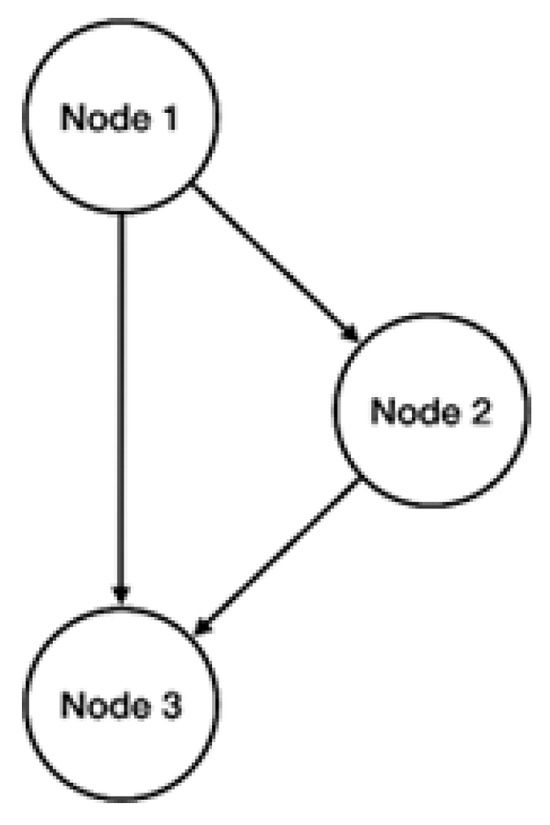
Figure 2.
A simple learning map structure with three nodes.
Both strict and flexible interpretations imply different patterns of mastery profiles. If the hypothesized structure in Figure 2 is true, some of the mastery profiles are not expected to be observed. For example, a student should not be able to master only Node 3 (Profile 4). Returning to Table 2, the mastery profiles that are expected under each interpretation of the structure in Figure 2 are shown. Note that Profile 6 (mastery of Node 1 and Node 3 only) is expected only under the alternate pathways interpretation when mastery of Node 2 is no longer a strict prerequisite for mastery of Node 3.
With the knowledge of expected and unexpected profiles, it is possible to estimate two DCMs. The first is a fully saturated log-linear cognitive diagnostic model (LCDM; Henson et al., 2009). The LCDM makes no assumptions about node structure, and students can be classified into any possible mastery profile. The second model is the hierarchical diagnostic classification model (HDCM; Templin & Bradshaw, 2014). As the name implies, the HDCM allows a hierarchical specification of the nodes—in other words, a specified subset of mastery profiles—and only those profiles are available during the estimation process. This means that when using the HDCM, students can be placed only into expected profiles. The determination of which profiles are allowed in the HDCM (i.e., strict prerequisite vs. alternate pathways) should be guided by the subject matter expertise and cognitive models used to develop the map structures.
If the hypothesized structure holds, then very few students should appear in the unexpected profiles when estimating the LCDM. Continuing with the three-node example, very few students should master only Node 3. To quantify how many is “very few”, the model fit of the LCDM can be compared with the HDCM. Because the HDCM contains a subset of all possible mastery profiles, it is nested within the LCDM. Thus, the LCDM will always have better fit in an absolute sense because more parameters are available to explain more variance. However, if the hypothesized structures are correct, then the removal of the unexpected profiles in the HDCM should not have a significant adverse effect on the fit of the model. That is, when comparing the relative fit of the LCDM and HDCM, either through a likelihood ratio test or an information criterion (e.g., the widely applicable information criterion; Watanabe, 2010), the two should show equivalent fit when the proposed structure holds. If the HDCM shows substantially worse fit than the LCDM, then this is evidence that there is a meaningful number of students who are better classified in an unexpected profile, indicating that the proposed structure may need to be revised.
The estimated mastery profiles for each student can also be used to evaluate the uniqueness of the nodes in the map structure. Using the node classifications for each student (e.g., master/nonmaster), we can create a matrix with one row for each student and one column for each node. The cells of the matrix are then filled with zero and one, where one indicates that the student mastered the node and zero indicates nonmastery. Finally, we can calculate the tetrachoric correlation between each pair of nodes. The tetrachoric correlation is chosen because the traditional Pearson correlation is attenuated when using categorical data (Choi et al., 2010). When nodes are unique, we expect the correlations to be moderately positive. Some positive correlation is expected, given that all of the nodes in map structure are measuring related content. Nonetheless, the correlations should not be so high as to imply that the two nodes function practically as a single node. If the nodes are unique, we should see cases where the mastery status on the two nodes differs.
Estimating the LCDM and HDCM for the full map structure may not be feasible if there are data constraints such as small sample sizes or sparse data (e.g., in the case of computer adaptive testing; Thompson & Nash, 2022). Even with large samples, estimating the LCDM and HDCM can be challenging as the number of nodes being assessed increases, because increasing the number of nodes exponentially also increases the number of profiles. For example, if binary node classifications are used, moving from three to eight nodes increases the number of possible profiles from 8 to 256. If a large number of profiles have very few students—as may be the case even with large samples, given that some profiles are unexpected—then the concurrent estimation of nodes may not be feasible. If the full estimation of the LCDM and HDCM is not possible, an alternative is to estimate a separate LCDM for each node. That is, instead of a single three-node model, we would estimate three single-node models. Because the separate node models do not rely on students taking items aligned to every node, and because there are only two profiles (i.e., master or nonmaster), these single-node models are easier to estimate. Single-node models can estimate a mastery status for each node a student was assessed on, and a post hoc mastery profile can be created from the individual mastery classifications. The number of post hoc profiles aligned to expected and unexpected profiles can then be evaluated. The evidence provided by this method is not as strong as that of the full LCDM and HDCM comparison because the post hoc profiles do not allow for a direct test of the meaningfulness of the number of students with unexpected profiles. However, the single-node method still provides useful information, such as which profiles have the most students, and whether students are commonly being classified into unexpected profiles. Additionally, the profiles derived from single-node methods can be used to examine node uniqueness with the same method described for the full models. Thus, the single-node method is a good alternative when the available data make LCDM and HDCM comparisons infeasible.
4.2.2. Applied Examples of the Diagnostic Framework
Learning map structures for the DLM Alternate Assessment System and the I-SMART project are evaluated with a diagnostic framework for learning map evaluation. The following is a high-level overview of this work.
In the DLM alternate assessments for ELA and mathematics, each content standard is associated with a mini-map, which is a cluster of nodes and connections from the larger learning map for each subject. Within the mini-map, groups of one or more closely related fine-grained nodes are clustered into attributes of a slightly larger grain size. Nodes represent content standards at varying levels of complexity to ensure all students can access grade-level academic content. Nodes are identified at three levels (Initial Precursor, Distal Precursor, Proximal Precursor) that lead to the Target level, which most closely aligns to the content standard. A fifth level for each content standard, the Successor level, features nodes that extend beyond the grade-level target. During the assessment, students are assessed on one level for each standard. The system assigns students to the level for each standard that is the best match, according to the students’ performance on previous assessment items.
For scoring purposes, DLM assessments assume a strict hierarchy of node mastery. That is, if a student demonstrates mastery of nodes at one level, mastery is also assigned to all lower levels for the same standard (Dynamic Learning Maps Consortium, 2017). Thompson and Nash (2019) used the diagnostic framework to evaluate this assumption. In a five-attribute model, there are 32 possible profiles. However, a strict hierarchy means that only six profiles are expected (i.e., mastery of zero, one, two, three, four, or all five levels per standard). In their study, the authors used the single-node-level method, as students typically test on only one node level, with three to five items per level. The single-node level method is the same as the single-node method described above, except that the unit of analysis is the cluster of nodes at each level, rather than a single node. Using this method, the authors demonstrated that the DLM content standards largely conform to the assumed hierarchy. Their study was not a direct evaluation of the learning map structure, as the unit of analysis are node levels. However, because the levels are associated with specific nodes on the learning map, this study provides preliminary empirical evidence in support of the DLM learning map structure.
Unlike DLM assessments, I-SMART assessments support empirical evaluation of the I-SMART neighborhood maps at the node level. Students take I-SMART assessments at one level composed of three to five nodes. In the I-SMART assessments, three to five items are written per node, rather than per level as in the DLM alternate assessments. Thus, in I-SMART models for the node level, relationships within each level can be estimated using the full LCDM and HDCM, as well as single-node models. That is, rather than estimating the relationships between node levels, as was performed for the DLM learning map models, the I-SMART test design facilitated the estimation of relationships among individual nodes.
The I-SMART map evaluation indicated that empirical data support the structure of the neighborhood maps (Hoover et al., 2021). The HDCM showed equivalent fit to the LCDM for all node levels. Additionally, when using single-node models, the post hoc mastery profiles showed relatively small numbers of students with unexpected profiles. However, small samples sizes limited the scope of the evaluation. Although Hoover et al. (2021) were able to look at the structure of nodes within node levels, the samples were too small to support a full evaluation with all of the nodes in a neighborhood or the number of mastery profiles that approach would entail.
5. Conclusions and Future Directions
5.1. Conclusions
Learning maps are cognitive models of learning that can support both instruction and assessment. Fine-grained learning maps represent valued KSUs in a hierarchical system within a domain (e.g., showing increasing cognitive complexity and sophistication in content acquisition and mastery) and provide an inclusive structure to track student progress toward learning goals via multiple pathways. In this paper, we have discussed the differences between learning maps and other formal models of learning, described how maps can inform instructional decision-making and assessment design, highlighted methods to evaluate map structure, and discussed the potential of learning maps to articulate an inclusive model of learning that describes the diversity and variability in learners.
The work we described in this paper highlights the intentionally inclusive nature of learning maps. Although it is possible to create learning maps that do not make a robust effort toward inclusive representation, the multiple pathways and focus on cognition rather than behavior make learning maps well suited to include a broad population. In our work, we lean on UDL principles of multiple means of representation and action and expression (CAST, 2018) to support the development of node descriptions and node observations. Considering the multiple means through which learners may engage and demonstrate KSUs while developing multiple and alternate pathways in the learning map’s structure results in a network model of how learning occurs within a particular domain. These models are designed to be flexible and inclusive of learners with a range of cognitive, linguistic, sensory, and physical profiles.
The experience reflected in this paper demonstrates the maturation of learning models and the promise of their expansion and use across multiple contexts. Despite the progress our team has made with learning maps over the past decade, there is much work to be conducted, including fundamental questions, challenges, extensions, and research on learning maps and their uses.
5.2. Future Directions
5.2.1. Fundamental Questions and Challenges
The use of learning maps for a range of purposes in instruction and assessment is still emerging. To advance and refine the use of learning maps as architectures for instruction and assessment, several challenges require additional inquiry. Three examples of research questions that could be posed are: (a) how do learning maps align with research on expert versus novice understandings? (b) how could cognitive and affective development (e.g., goal setting, self-regulation) be represented in a single learning map? and (c) do accurate learning map structures correspond with formal cognitive process dimension taxonomies that have been used to describe learning more generally? Future learning map validation studies could ask research questions like: (a) how do student responses to assessment items over time relate to the structure of a learning map? and (b) how do student and teacher perceptions of mastery of KSUs relate to a learning map structure?
In considering how content is represented in learning maps, one area of potential inquiry is to evaluate how map structures reflect learning from the perspective of the conceptual frameworks learners bring to the task of learning. These frameworks are apparent in the research on how experts and novices organize ideas and information in a particular domain (e.g., Bransford et al., 2000). Goldman and Pellegrino (2015) described a principle of learning specifically related to content and its organization: “To develop competence in an area of inquiry, students must (a) have a deep foundation of factual knowledge, (b) understand facts and ideas in the context of a conceptual framework, and (c) organize knowledge in ways that facilitate retrieval and application” (p. 35). Given the different organizational frameworks of experts and novices, it is worth examining how the different pathways represented in learning maps might be more useful or relevant to different learners within a common domain.
Another line of research that is needed is how development of the affective domain (goal setting, self-regulation, etc.) intersects with the content to be learned. For example, there is an extensive body of research on the self-determined learning model of instruction (Shogren et al., 2012) as an intervention to promote academic goal attainment and other outcomes. There may be value in evaluating whether research on the development of self-determination supports treating self-determination as an organized learning model that could then be layered onto academic maps. Alternatively, interventions that more explicitly integrate metacognitive components in academic instruction (e.g., self-regulated strategy development in writing; see Harris & Graham, 1999) may be strengthened or made more flexible by mapping the metacognitive skills that support specific academic KSUs.
A final example of an area for further inquiry is the appropriateness of incorporating formal cognitive process dimension taxonomies into learning map structures. As described earlier, we integrate the content and cognitive process inside the nodes. However, cognitive taxonomies have a 70+-year history in education, and their use is still expected in certain contexts. For example, the DLM assessment system is subject to federal peer-review requirements. We provided evidence peers can use to judge whether the assessment system has “demonstrated adequate alignment between the State’s assessments and the academic content standards the assessments are designed to measure in terms of content (i.e., knowledge and process), balance of content, and cognitive complexity” (United States Department of Education, 2018, critical element 3.1, p. 47). Peers expect to see evidence that treats content and cognitive complexity as two dimensions that can be evaluated separately. We adopted a cognitive taxonomy for the DLM system (Bechard et al., 2021) and conducted alignment studies using the taxonomy and traditional alignment methodologies. We realize there is an imperfect relationship between a stand-alone taxonomy and the way cognitive processes cycle vertically within the learning map, yet the taxonomy may provide a bridge for understanding the learning maps and validating our work during the development stages.
5.2.2. Potential Applications of Learning Maps
There are several ways in which learning maps could be applied in other contexts. Obvious extensions of the work would include the use of learning maps in general education contexts. Much of the work we have described has focused on developing learning maps as structures to support the teaching, learning, and assessment of students with disabilities who have specialized educational needs. Additional work with typically developing students could lead to refined approaches to the empirical validation of map structures. Furthermore, how do teachers use map-based results to guide instructional decisions?
An additional area of extension would be to apply our map development approach to content domain specification to contemporary discussions in the educational field related to equitable, culturally responsive, inclusive definitions of constructs. Randall (2021) proposed an explicitly antiracist framework for construct definition that includes multiple ways of knowing, resulting in reconsideration of what has historically been considered “construct-irrelevant” variance in large-scale assessments. The structure of learning maps as tools for construct definition lends itself to more inclusive representations of what all students know and can do.
Related to providing more inclusive models of learning, future extensions of the work could use learning map structures to model domains that integrate cross-disciplinary connections between academic domains. We described preliminary work in the I-SMART project focused on representing areas of intersection between learning in mathematics and ELA via science learning map neighborhoods. Additional work in higher-order skills such as data analysis, argumentation, and designing solutions for engineering problems may yield opportunities to represent cross-domain connections.
A final extension could be in the application of rigorously validated learning maps to provide content structures that support theory-driven personalized learning models (e.g., Bernacki et al., 2021; Walkington & Bernacki, 2020). This application could also include the extension of learning-based methods in additional higher educational and professional learning contexts, including providing domain specifications for competency-based models and their associated assessments (Guo et al., 2020).
5.2.3. Future Research on Learning Maps
The learning maps can be powerful tools for providing teachers with research-based content structures to help them identify where students are in their learning and where they can go next. Future research is needed to understand how teachers (and students) use map-based assessment results. There are risks associated with potential interpretations of maps structures in which teachers and learners may view a collection of individual nodes as “checklists for mastery” rather than a representation of multiple pathways to learn specific academic targets. Additional research can also answer questions about whether the intentionally inclusive approaches to defining domains we have described actually affect teaching and learning.
In this paper, we described research on developing and evaluating maps for multiple purposes related to instruction and assessment, including developing cognitive models of academic domains (Bechard et al., 2019; Dynamic Learning Maps Consortium, 2016), evaluating map structures using expert reviews (Swinburne Romine et al., 2018) and empirical methods (Hoover et al., 2021; Thompson & Nash, 2019), and the use of map structures to support formative assessment activities (N. Kingston et al., 2021) and guide instructional planning (Clark et al., 2018; Swinburne Romine & Thatcher, 2022). These studies build from the literature on learning progressions (e.g., Alonzo & Gotwals, 2012) and provide some empirical support that learning maps can fulfill their intended uses. Further research is needed in each of these areas to continue to develop and expand the use of learning maps as tools to support instruction and assessment.
Author Contributions
Conceptualization, R.S.R., J.S., M.K., W.J.T., K.E., V.S. and S.B.; Funding acquisition, R.S.R. and M.K.; Methodology, R.S.R., J.S., M.K., K.E., V.S. and S.B.; Project administration, R.S.R. and M.K.; Validation, R.S.R., M.K., W.J.T. and S.B.; Visualization, J.S. and W.J.T.; Writing—original draft, R.S.R., J.S., M.K., W.J.T., K.E., V.S. and S.B.; Writing—review & editing, R.S.R., M.K. and V.S. All authors have read and agreed to the published version of the manuscript.
Funding
Funding for projects described in this paper was from the United States Department of Education through several grants. I-SMART: Funded by the office of elementary and secondary education in 2016 (S368A170009) ELM: Funded by the office of elementary and secondary education in 2015 (S368A150013) DLM: Funded by the Office of Special Education Programs in 2010 (84.373X100001) SWIM: Funded in 2019 by the Office of Special Education Programs (H326M180010).
Institutional Review Board Statement
While no new data is reported in this paper, projects with human subjects research described therein were conducted under the approval of the Institutional Review Board at the University of Kansas.
Informed Consent Statement
While no new data is reported in this paper, projects with human subjects research described therein included informed written consent procedures for participants.
Data Availability Statement
No new data were created or analyzed in this study. Data sharing is not applicable to this article.
Acknowledgments
Many people have supported the development and use of learning maps as tools to support teaching, learning and assessment. The authors particularly wish to acknowledge the contributions of Lori Andersen, Angela Broaddus, Sarah Brown, Caroline Buonadonna, Dale Cope, Joyce Depenbusch, Holly Dubiel, Eun Mi Kim, Neal Kingston, Jennifer Richardson, Amber Samson, Kelli Thomas and Tom Walsh.
Conflicts of Interest
We have no known conflicts of interest to report. The funders of the projects described in this paper had no role in the designs of the studies; in the collection, analyses, or interpretation of data; in the writing of the manuscript; or in the decision to publish the results.
References
- Alonzo, A., & Gotwals, A. W. (Eds.). (2012). Learning progressions in science: Current challenges and future directions. Sense Publishers. [Google Scholar]
- Alonzo, A., & Steedle, J. T. (2008). Developing and assessing a force and motion learning progression. Science Education, 93(3), 389–421. [Google Scholar] [CrossRef]
- Anderson, L. W., & Krathwohl, D. R. (Eds.). (2001). A taxonomy for learning, teaching, and assessing: A revision of bloom’s taxonomy of educational objectives. Allyn & Bacon, Pearson Education Group. [Google Scholar]
- Armstrong, P. (2010). Bloom’s taxonomy. Vanderbilt University Center for Teaching. Available online: https://cft.vanderbilt.edu/wp-content/uploads/sites/59/Blooms-Taxonomy.pdf (accessed on 12 March 2025).
- Barrett, J. E., Sarama, J., Clements, D. H., Cullen, C., McCool, J., Witkowski-Rumsey, C., & Klanderman, D. (2012). Evaluating and improving a learning trajectory for linear measurement in elementary grades 2 and 3: A longitudinal study. Mathematical Thinking and Learning, 14(1), 28–54. [Google Scholar] [CrossRef]
- Bechard, S., Clark, A., Swinburne Romine, R., Karvonen, M., Kingston, N., & Erickson, K. (2019). Use of evidence-centered design to develop learning maps-based assessments. International Journal of Testing, 19(2), 188–205. [Google Scholar] [CrossRef]
- Bechard, S., Hess, K., Camacho, C., Russell, M., & Thomas, K. (2012, October 26). Why should cognitive learning models be used as the foundation for designing next generation assessment systems? [Symposium presentation]. SRI International and Center for Educational Testing and Evaluation (CETE). Colloquium on Learning Models (Learning Maps/Progressions/etc.), Instruction, and Next Generation Assessments that Include Special Populations, Washington, DC, USA. Available online: https://www.karin-hess.com/_files/ugd/5e86bd_45b60e538a4945e18ecb070ae18a24a9.pdf (accessed on 12 March 2025).
- Bechard, S., Karvonen, M., & Erickson, K. (2021). Opportunities and challenges of applying cognitive process dimensions to map-based learning and alternate assessment. Frontiers in Education, 6, 653693. [Google Scholar] [CrossRef]
- Beitling, B., & Clark, A. (2019). Spring 2019 teacher survey (Research synopsis 19-04). University of Kansas, Accessible Teaching, Learning, and Assessment Systems (ATLAS). Available online: https://dynamiclearningmaps.org/sites/default/files/documents/publication/Spring_2019_Teacher_Survey.pdf (accessed on 12 March 2025).
- Bernacki, M. L., Greene, M. J., & Lobczowski, N. G. (2021). A systematic review of research on personalized learning: Personalized by whom, to what, how, and for what purpose(s)? Educational Psychology Review, 33, 1675–1715. [Google Scholar] [CrossRef]
- Bloom, B. S. (1956). Taxonomy of educational objectives, handbook: The cognitive domain. David McKay. [Google Scholar]
- Bradshaw, L. (2016). Diagnostic classification models. In A. A. Rupp, & J. Leighton (Eds.), The handbook of cognition and assessment: Frameworks, methodologies, and applications (pp. 297–327). John Wiley & Sons. [Google Scholar]
- Bradshaw, L., & Levy, R. (2019). Interpreting probabilistic classifications from diagnostic psychometric models. Educational Measurement: Issues and Practice, 38(2), 79–88. [Google Scholar] [CrossRef]
- Bransford, J. D., Brown, A., & Cocking, R. (Eds.). (2000). How people learn: Brain, mind, experience and school (expanded ed.). National Academies Press. [Google Scholar]
- CAST. (2018). Universal design for learning guidelines version 2.2. Available online: https://udlguidelines.cast.org/ (accessed on 12 March 2025).
- Choi, J., Peters, M., & Mueller, R. O. (2010). Correlational analysis of ordinal data: From Pearson’s r to Bayesian polychoric correlation. Asia Pacific Education Review, 11, 459–466. [Google Scholar] [CrossRef]
- Cizek, G. J., & Bunch, M. B. (2006). Standard setting: A guide to establishing and evaluating performance standards on tests. Sage Publications. [Google Scholar]
- Cizek, G. J., Kosh, A. E., & Toutkoushian, E. K. (2018). Gathering and evaluating validity evidence: The generalized assessment alignment tool. Journal of Educational Measurement, 55(4), 477–512. [Google Scholar] [CrossRef]
- Clark, A. K., Karvonen, M., Swinburne Romine, R., & Kingston, N. (2018, April 12–16). Teacher use of score reports for instructional decision-making [Conference presentation]. Annual Meeting of the National Council on Measurement in Education, New York, NY, USA. [Google Scholar]
- Confrey, J., Gianopulos, G., McGowan, W., Shah, M., & Belcher, M. (2017). Scaffolding learner-centered curricular coherence using learning maps and diagnostic assessments designed around mathematics learning trajectories. ZDM Mathematics Education, 49, 717–734. [Google Scholar] [CrossRef]
- Confrey, J., Maloney, A. P., & Corley, A. K. (2014). Learning trajectories: A framework for connecting standards with curriculum. ZDM Mathematics Education, 46, 719–733. [Google Scholar] [CrossRef]
- Daro, P., Mosher, F., & Corcoran, T. (2011). Learning trajectories in mathematics: A foundation for standards, curriculum, assessment, and instruction (Report No. RR-68). Consortium for Policy Research in Education. Available online: https://repository.upenn.edu/cpre_researchreports/60 (accessed on 12 March 2025).
- Dolan, R. P., Wojcik, C., Ducharme, K., Starr, E., & Blackorby, J. (2020). I-SMART goal 3: Teacher dashboard design. CAST. Available online: https://ismart.works/sites/default/files/documents/Publications/I-SMART_Goal_3%20CAST_Technical_Report_FINAL.pdf (accessed on 12 March 2025).
- Dynamic Learning Maps Consortium. (2016). 2014–2015 technical manual—Integrated model. University of Kansas, Center for Educational Testing and Evaluation. Available online: https://dynamiclearningmaps.org/sites/default/files/documents/publication/Technical_Manual_IM_2014-15.pdf (accessed on 12 March 2025).
- Dynamic Learning Maps Consortium. (2017). 2015–2016 technical manual update: Integrated model. University of Kansas, Center for Educational Testing and Evaluation. Available online: https://dynamiclearningmaps.org/sites/default/files/documents/publication/DLM_Technical_Manual_IM_2015-16.pdf (accessed on 12 March 2025).
- Every Student Succeeds Act [ESSA]. (2015). Every student succeeds act, 20 U.S.C. § 6301. Available online: https://www.congress.gov/bill/114th-congress/senate-bill/1177 (accessed on 12 March 2025).
- Goldman, S. R., & Pellegrino, J. W. (2015). Research on learning and instruction: Implications for curriculum, instruction, and assessment. Policy Insights from the Behavioral and Brain Sciences, 2(1), 33–41. [Google Scholar] [CrossRef]
- Guo, P., Saab, N., Post, L. S., & Admiraal, W. (2020). A review of project-based learning in higher education: Student outcomes and measures. International Journal of Educational Research, 102, 101586. [Google Scholar] [CrossRef]
- Harris, K. R., & Graham, S. (1999). Programmatic intervention research: Illustrations from the evolution of self-regulated strategy development. Learning Disability Quarterly, 22, 251–262. [Google Scholar] [CrossRef]
- Henson, R. A., Templin, J. L., & Willse, J. T. (2009). Defining a family of cognitive diagnosis models using log-linear models with latent variables. Psychometrika, 74(2), 191–210. [Google Scholar] [CrossRef]
- Heritage, M. (2008). Learning progressions: Supporting instruction and formative assessment. National Center for Research on Evaluation, Standards, and Student Testing (CRESST). [Google Scholar]
- Herrmann-Abell, C. F., & DeBoer, G. E. (2018). Investigating a learning progression for energy ideas from upper elementary through high school: Learning progression for energy ideas. Journal of Research in Science Teaching, 55(1), 68–93. [Google Scholar] [CrossRef]
- Hess, K. K. (2008). Developing and using learning progressions as a schema for measuring progress. National Center for the Improvement of Educational Assessment. Available online: https://www.nciea.org/wp-content/uploads/2022/07/CCSSO2_KH08.pdf (accessed on 12 March 2025).
- Hess, K. K. (2012a). Learning progressions: Connecting ongoing learning to assessment. In Communication points newsletter (Vol. 5). National Center and State Collaborative (NCSC), University of Kentucky. [Google Scholar]
- Hess, K. K. (2012b). Learning progressions in K-8 classrooms: How progress maps can influence classroom practice and perceptions and help teachers make more informed instructional decisions in support of struggling learners (Synthesis Report 87). University of Minnesota, National Center on Educational Outcomes. Available online: https://nceo.umn.edu/docs/OnlinePubs/Synthesis87/SynthesisReport87.pdf (accessed on 12 March 2025).
- Hoover, J. C., Thompson, W. J., Nash, B., & Kobrin, J. L. (2021, June 8–11). The I-SMART project: Empirical map validation [Poster presentation]. Annual Meeting of the National Council on Measurement in Education. Available online: https://ismart.works/sites/default/files/documents/Presentations/ismart-ncme21_final.pdf (accessed on 12 March 2025).
- Jin, H., Shin, H., Johnson, M. E., Kim, J., & Anderson, C. W. (2015). Developing learning progression-based teacher knowledge measures. Journal of Research in Science Teaching, 52(9), 1269–1295. [Google Scholar] [CrossRef]
- Karvonen, M., Kingston, N. M., Wehmeyer, M. L., & Thompson, W. J. (2020). New approaches to designing and administering inclusive assessments. In U. Sharma, & S. Salends (Eds.), Oxford research encyclopedia of education. Oxford University Press. [Google Scholar]
- Kingston, N., Hess, J., Cope, D., & Swinburne Romine, R. (2021). On determining the efficacy of using learning maps as an organizing structure for formative assessments. In J. Hong, & R. W. Lissitz (Eds.), Enhancing effective instruction and learning using assessment data (pp. 149–166). Information Age Publishing. [Google Scholar]
- Kingston, N. M., & Broaddus, A. (2017). The use of learning map systems to support the formative assessment in mathematics. Education Sciences, 7(1), 41. [Google Scholar] [CrossRef]
- Kingston, N. M., Karvonen, M., Bechard, S., & Erickson, K. (2016). The philosophical underpinnings and key features of the dynamic learning maps alternate assessment. Teachers College Record, 118(14), 1–30. Available online: https://www.tcrecord.org/Content.asp?ContentId=21546 (accessed on 12 March 2025). [CrossRef]
- Knight, J. (2013). High-impact instruction: A framework for great teaching. Corwin. [Google Scholar]
- Kobrin, J., Adkins, D., Thatcher, E., & Swinburne Romine, R. (2023). Effectiveness of the shared writing instructional model (SWIM Project Brief #4). University of Kansas, Accessible Teaching, Learning, and Assessment Systems. [Google Scholar]
- Kotseruba, I., & Tsotsos, J. K. (2020). 40 years of cognitive architectures: Core cognitive abilities and practical applications. Artificial Intelligence Review, 53(1), 17–94. [Google Scholar] [CrossRef]
- Kridel, C. (Ed.). (2010). Scope and sequence, in curriculum development. In Encyclopedia of curriculum studies (Vol. 2, pp. 771–772). Sage Publications. [Google Scholar]
- Mandinach, E. B., & Jimerson, J. B. (2016). Teachers learning how to use data: A synthesis of the issues and what is known. Teaching and Teacher Education, 60, 452–457. [Google Scholar] [CrossRef]
- Marsick, V. J. (1994). Trends in managerial reinvention: Creating a learning map. Management Learning, 25(1), 11–33. [Google Scholar] [CrossRef]
- McClelland, J. L. (2009). The place of modeling in cognitive science. Topics in Cognitive Science, 1(1), 11–38. [Google Scholar] [CrossRef] [PubMed]
- Minnema, J., Thurlow, M., & Warren, S. (2004). Understanding out-of-level testing in local schools: A first case study of policy and implementation and effects (Out-of-Level Testing Report 11). University of Minnesota, National Center on Educational Outcomes. [Google Scholar]
- Mislevy, R. J. (2011). Evidence-centered design for simulation-based assessment (CRESST Report 800, ED522835); ERIC, University of California, National Center for Research on Evaluation, Standards, and Student Testing (CRESST). Available online: https://files.eric.ed.gov/fulltext/ED522835.pdf (accessed on 12 March 2025).
- Mislevy, R. J., Almond, R. G., & Lukas, J. F. (2003). A brief introduction to evidence-centered design. ETS Research Report Series, 2003(1), i-29. [Google Scholar] [CrossRef]
- National Governors Association Center for Best Practices & Council of Chief State School Officers. (2010). Common core state standards. National Governors Association Center for Best Practices, Council of Chief State School Officers. Available online: http://www.corestandards.org/ (accessed on 12 March 2025).
- National Research Council. (2007). Taking science to school: Learning and teaching science in grades K-8. The National Academies Press. [Google Scholar] [CrossRef]
- Ohlsson, S. (2008). Computational models of skill acquisition. In R. Sun (Ed.), The Cambridge handbook of computational psychology (pp. 359–395). Cambridge University Press. [Google Scholar]
- Pellegrino, J. W., DiBello, L. V., & Goldman, S. R. (2016). A framework for conceptualizing and evaluating the validity of instructionally relevant assessments. Educational Psychologists, 51(1), 59–81. [Google Scholar] [CrossRef]
- Popham, W. J. (2011). Transformative assessment in action: An inside look at applying the process. Association for Supervision & Curriculum Development. [Google Scholar]
- Randall, J. (2021). “Color-Neutral” is not a thing: Redefining construct definition and representation through a justice-oriented critical antiracist lens. Educational Measurement: Issues and Practice, 40, 82–90. [Google Scholar] [CrossRef]
- Ritter, S., Anderson, J. R., Koedinger, K. R., & Corbett, A. (2007). Cognitive tutor: Applied research in mathematics education. Psychonomic Bulletin & Review, 14, 249–255. [Google Scholar] [CrossRef]
- Rittle-Johnson, B., & Koedinger, K. R. (2001). Using cognitive models to guide instructional design: The case of fraction division. Proceedings of the Annual Meeting of the Cognitive Science Society, 23. Available online: https://escholarship.org/uc/item/6dk5t75h#author (accessed on 12 March 2025).
- Rumelhart, D. E., & McClelland, J. L. (1986). On learning the past tenses of English verbs. In J. L. McClelland, D. E. Rumelhart, & the PDP Research Group (Eds.), Parallel distributed processing: Explorations in the microstructure of cognition (Vol. II). Bradford Books. [Google Scholar]
- Rupp, A. A., Templin, J., & Henson, R. A. (2010). Diagnostic measurement: Theory, methods, and applications. Guilford Press. [Google Scholar]
- Schraw, G., Crippen, K., & Hartley, K. (2006). Promoting self-regulation in science education: Metacognition as part of a broader perspective on learning. Research in Science Education, 36, 111–139. [Google Scholar] [CrossRef]
- Shepard, L. A. (2018). Learning progressions as tools for assessment and learning. Applied Measurement in Education, 31(2), 165–174. [Google Scholar] [CrossRef]
- Shogren, K. A., Palmer, S. B., Wehmeyer, M. L., Williams-Diehm, K., & Little, T. D. (2012). Effect of intervention with the self-determined learning model of instruction on access and goal attainment. Remedial and Special Education, 33(5), 320–330. [Google Scholar] [CrossRef]
- Sun, R. (Ed.). (2008). Introduction to computational cognitive modeling. In Cambridge handbook of computational psychology (pp. 3–19). Cambridge University Press. [Google Scholar]
- Supovitz, J. A., Ebby, C. B., Remillard, J., & Nathenson, R. A. (2018). Experimental impacts of the ongoing assessment project on teachers and students (Report No. RR 2018–1). University of Pennsylvania, Consortium for Policy Research in Education. Available online: https://repository.upenn.edu/cpre_researchreports/107 (accessed on 12 March 2025).
- Swinburne Romine, R., Andersen, L., Schuster, J., & Karvonen, M. (2018). Developing and evaluating learning map models in science: Evidence from the I-SMART project. University of Kansas, Accessible Teaching, Learning, and Assessment Systems (ATLAS). Available online: https://ismart.works/sites/default/files/documents/Publications/I-SMART_Goal_1_Technical_Report_FINAL.pdf (accessed on 12 March 2025).
- Swinburne Romine, R., & Thatcher, E. (2022, January 16–19). Shared writing instruction for students with intellectual disabilities an evidence-based approach for K-6 writers [Conference poster]. Annual Meeting of the Council for Exceptional Children, Orlando, FL, USA. [Google Scholar]
- Templin, J., & Bradshaw, L. (2014). Hierarchical diagnostic classification models: A family of models for estimating and testing attribute hierarchies. Psychometrika, 79(2), 317–339. [Google Scholar] [CrossRef] [PubMed]
- Thomas, M. S. C., & McClelland, J. L. (2008). Connectionist models of cognition. In R. Sun (Ed.), Cambridge handbook of computational psychology (pp. 23–58). Cambridge University Press. [Google Scholar]
- Thompson, W. J., & Nash, B. (2019, April 4–8). Empirical methods for evaluating maps: Illustrations and results. In Beyond learning progressions: Maps as assessment architecture [Symposium presentation]. Annual Meeting of the National Council on Measurement in Education, Toronto, ON, Canada (M. Karvonen, (Chair)). Available online: https://dynamiclearningmaps.org/sites/default/files/documents/presentations/Thompson_Nash_Empirical_evaluation_of_learning_maps.pdf (accessed on 12 March 2025).
- Thompson, W. J., & Nash, B. (2022). A diagnostic framework for the empirical evaluation of learning maps. Frontiers in Education, 6, 714736. [Google Scholar] [CrossRef]
- Tomlinson, C. A. (2000). Differentiation of instruction in the elementary grades (ED443572). ERIC. Available online: https://files.eric.ed.gov/fulltext/ED443572.pdf (accessed on 12 March 2025).
- United States Department of Education. (2018). A state’s guide to the U.S. department of education’s assessment peer review process; United States Department of Education. Available online: https://www.ed.gov/sites/ed/files/2020/07/assessmentpeerreview.pdf (accessed on 12 March 2025).
- Walkington, C., & Bernacki, M. L. (2020). Appraising research on personalized learning: Definitions, theoretical alignment, advancements, and future directions. Journal of Research on Technology in Education, 52(3), 235–252. [Google Scholar] [CrossRef]
- Watanabe, S. (2010). Asymptotic equivalence of Bayes cross validation and widely applicable information criterion in singular learning theory. Journal of Machine Learning Research, 11(116), 3571–3594. Available online: https://jmlr.org/papers/v11/watanabe10a.html (accessed on 12 March 2025).
- Wiggins, G. P., & McTighe, J. (2001). Understanding by design. Merrill Education. [Google Scholar]
- Wilson, M. (2009, December). Assessment for learning and for accountability [Paper presentation]. Exploratory seminar: Measurement challenges within the race to the top agenda. Educational Testing Service. Available online: https://www.ets.org/Media/Research/pdf/WilsonPresenterSession4.pdf (accessed on 12 March 2025).
- Wilson, M., & Bertenthal, M. (Eds.). (2005). Systems for state science assessment. National Academies Press. [Google Scholar]
- Zimmerman, B., Bonner, S., & Kovach, R. (2002). Developing self-regulated learners: Beyond achievement to self-efficacy. American Psychological Association. [Google Scholar]
Disclaimer/Publisher’s Note: The statements, opinions and data contained in all publications are solely those of the individual author(s) and contributor(s) and not of MDPI and/or the editor(s). MDPI and/or the editor(s) disclaim responsibility for any injury to people or property resulting from any ideas, methods, instructions or products referred to in the content. |
© 2025 by the authors. Licensee MDPI, Basel, Switzerland. This article is an open access article distributed under the terms and conditions of the Creative Commons Attribution (CC BY) license (https://creativecommons.org/licenses/by/4.0/).