Abstract
In Spain, the COVID-19 pandemic has impacted the various regions of the country differently. The availability of reliable and up-to-date information has proved to be fundamental for the management of this health crisis. However, especially during the first wave of the pandemic (February–August 2020), the disparity in the recording criteria and in the timing of providing these figures to the central government created controversy and confusion regarding the real dimension of the pandemic. It is therefore necessary to have objective and homogeneous criteria at the national level to guide health managers in the correct recording and evaluation of the magnitude of the pandemic. Within this context, we propose using Benford’s Law as an auditing tool to monitor the reliability of the number of daily COVID-related deaths to identify possible deviations from the expected trend.
1. Introduction
It is clear that in order to face a health crisis of the magnitude of COVID-19, public health managers and administrators need to have the necessary tools to collect data correctly and predict the latest trends of the different pandemic indicators.
The COVID-19 health crisis has filled the health-management literature with countless publications about methodologies for the prediction of incidence, transmission dynamics or number of cases. Most of these models are based on mathematical and statistical tools [1,2], such as machine learning [3,4,5] linear generalized models [6], logistic growth models [7], ANFIS model [8] or neuronal networks [9]. In other cases, the search for keywords in social media and Google trends is used to predict infections [10,11].
Other scholars focus on analyzing the reproduction numbers. For instance, in the paper [12], the authors estimate the proportion of the population needing to be immunized to achieve herd immunity. In the work [13], the authors analyze how to estimate the reproduction number related with the rate of growth, according to different types of assumptions. One of the assumptions that cover that paper is the exponentially distributed growth, which is the assumption that we consider in our work.
Indeed, it is desirable that such tools are as operational and simple as possible, so that they can be implemented at all levels of the health and policy organizational hierarchy [14]. Therefore, in this paper we propose using Benford’s Law (BL) [15] as a guide to monitor the correct recording of Covid-related deaths.
In many real-life data sets, the frequency of the first digit does not follow a uniform distribution. In addition, the first digit tends to be small, and so the probability of occurrence of the number 1 in the first position is 30.1%, while the probability of that number being 9 is 4.5% [16]. BL empirically discovered the pattern for the frequency distribution of first digits for many collections of numbers. Therefore, a good approach to analyze a potential manipulation of data recording is to check for the validity of BL.
In this line, BL has been used to detect fraud or errors in data recording in a wide variety of areas. For instance, [17,18,19,20] use BL as a tool for fraud detection in the insurance industry or in other commercial trades. Other authors have also applied BL to test the veracity of scientific data [21] or data with public health relevance, as is the case of the work of Stoerk [22] who focuses on the recording of air quality data in Beijing.
A recent study already uses BL as a tool to assess the effectiveness of the control interventions in flattening the curve and the spread of COVID [16]. Results from this work suggest that BL is a suitable approach to analyze COVID-related trends and potential manipulations or registration errors in the number of cases and deaths, because of the data characteristics. When numbers follow an exponential distribution, as is the case of the number of COVID infections or deaths, it has been demonstrated that they follow Benford’s Law. This audit methodology has also already been used for other infectious diseases. For instance, in Uruguay [23], authors use BL to evaluate the dengue case-reporting system.
As a result, BL may be a useful tool for testing the reliability of data provided by different countries or indeed regions within the same country. As shown by [24], the authors applied BL to test the reliability of COVID-19 death-case reporting in countries with authoritarian regimes. They concluded that countries with democratic regimes do conform better to BL than the authoritarian ones regarding COVID-19 death-case figures reported.
In the case of Spain, the decentralization of some competences, such as health, has caused some difficulties for the central government in collecting homogeneous information on the number of COVID-related cases and deaths. This was especially the case during the first months of the pandemic, when there was a continuous readjustment of COVID figures provided by the different regions. Within this context, it is essential to set a common tool to assess the validity of COVID data recorded across the country.
A good clinical recording system is at the core of good health planning at all levels of management, from a single hospital to a nation-wide level. Likewise, in the case of COVID crisis management, the correct recording of cases, fatality, mortality or incidence rates is essential to reduce inefficiencies in the field of health management [25].
An incorrect registration or updating of data can cause significant inefficiencies, both in the allocation of resources and in the enactment of control measures. Within this context, authors such as Koch et al. 2020 [26], already use BL to assess the veracity of COVID data in China.
Italy was the first European country where the pandemic had a strong impact. Within the Italian context, some authors have stressed the importance of correctly interpreting fatality-rate data and discussing the correct recording of deaths, to optimize a health policy [27] as well as to analyze the different impacts of the pandemic across the regions of a country [28].
In Spain, the basic providers of health information and data are the Ministry of Health, the Health Departments (Consejerías de Salud) and the Public Health Departments of the regions (known as Autonomous Communities (ACs)). Previously, health care beneficiaries and standards were defined centrally, but since 2002, when the decentralization process for health care responsibilities concluded, the responsibility for services delivery and funding has been devolved to the 17 ACs [29]. This organizational model has sometimes led to a lack of homogeneity in the registration of some health phenomena, as in the case of COVID-19. Specifically, during the first wave of the pandemic, there has been great controversy over the lack of homogeneity of criteria when counting COVID cases and deaths in the different ACs. The Ministry of Health itself has not always had updated data at any given time for all regions. The Ministerial Order BOE-A-2020-3953, from 21 March 2020 [30], established that the ACs must provide the central government with the aggregated COVID data on a weekly basis. All the ACs provided their data by filling the related template, which included information such as number of confirmed cases, number of hospitalized cases and number of deaths. However, the protocol for recording this information may vary across ACs. Specifically, the recording of the number of COVID-related deaths is particularly sensitive, as the cause of death is not always clear, especially among the elderly population or those with chronic comorbidities. In addition, many deaths may be recorded as “unknown cause”. All these elements can lead to divergences from the actual situation.
The issue of the updating of tools and protocols for recording health information, as well as the establishment of homogeneous health information systems among ACs are topics already addressed in the literature [31,32]. This discussion takes on particular relevance in a public health crisis such as the current one.
It is essential that health administrations base their policy and management decisions on reliable data and objective criteria in order to avoid inefficiencies. Therefore, the establishment of common mechanisms to detect possible errors and data deviations is fundamental to helping provide a map of the pandemic situation at the national level, as well as identifying the specificities of regional figures.
In this line, this paper proposes using BL as a methodological approach in COVID crisis management to monitor the registration of deaths. Specifically, the aim of this paper is to provide an objective tool capable of detecting possible errors or deviations from the expected trend in the recording of the number of COVID deaths per day in Spain. We focus our analysis on the Spanish case, so the methodology proposed in this paper can be used as a guide to monitor the reliability of COVID-related figures for the health administration both at a regional and central level. In addition, this analysis allows us to look into the pandemic’s impact on the different regions in terms of number of deaths.
2. Methods and Empirical Procedure
2.1. Description of Benford’s Law
Benford’s Law is a mathematical rule conjecture that most sets of numbers verify. It is more frequent for an arbitrary set to verify BL than not. In other words, it is easier to enumerate the set of data that does not verify BL than the set of data that verifies the property [33]. This mathematical law has been used in various scientific fields, such as physics [34] and economics [35]. One of its most frequently used applications is to detect tax fraud [36,37].
Thus, BL establishes the (hypothetical) distribution of the digits of the same sequence of numbers. The distribution depends on the position of the digit or digits considered. Therefore, according to BL, the significant digit distribution does not follow a uniform distribution; they are skewed toward the smaller numbers.
The expression of BL states that the probability that the first digit of a magnitude is a specific figure “n” is provided by Equation (1):
where P(n) is the probability of a number having the first non-zero digit n.
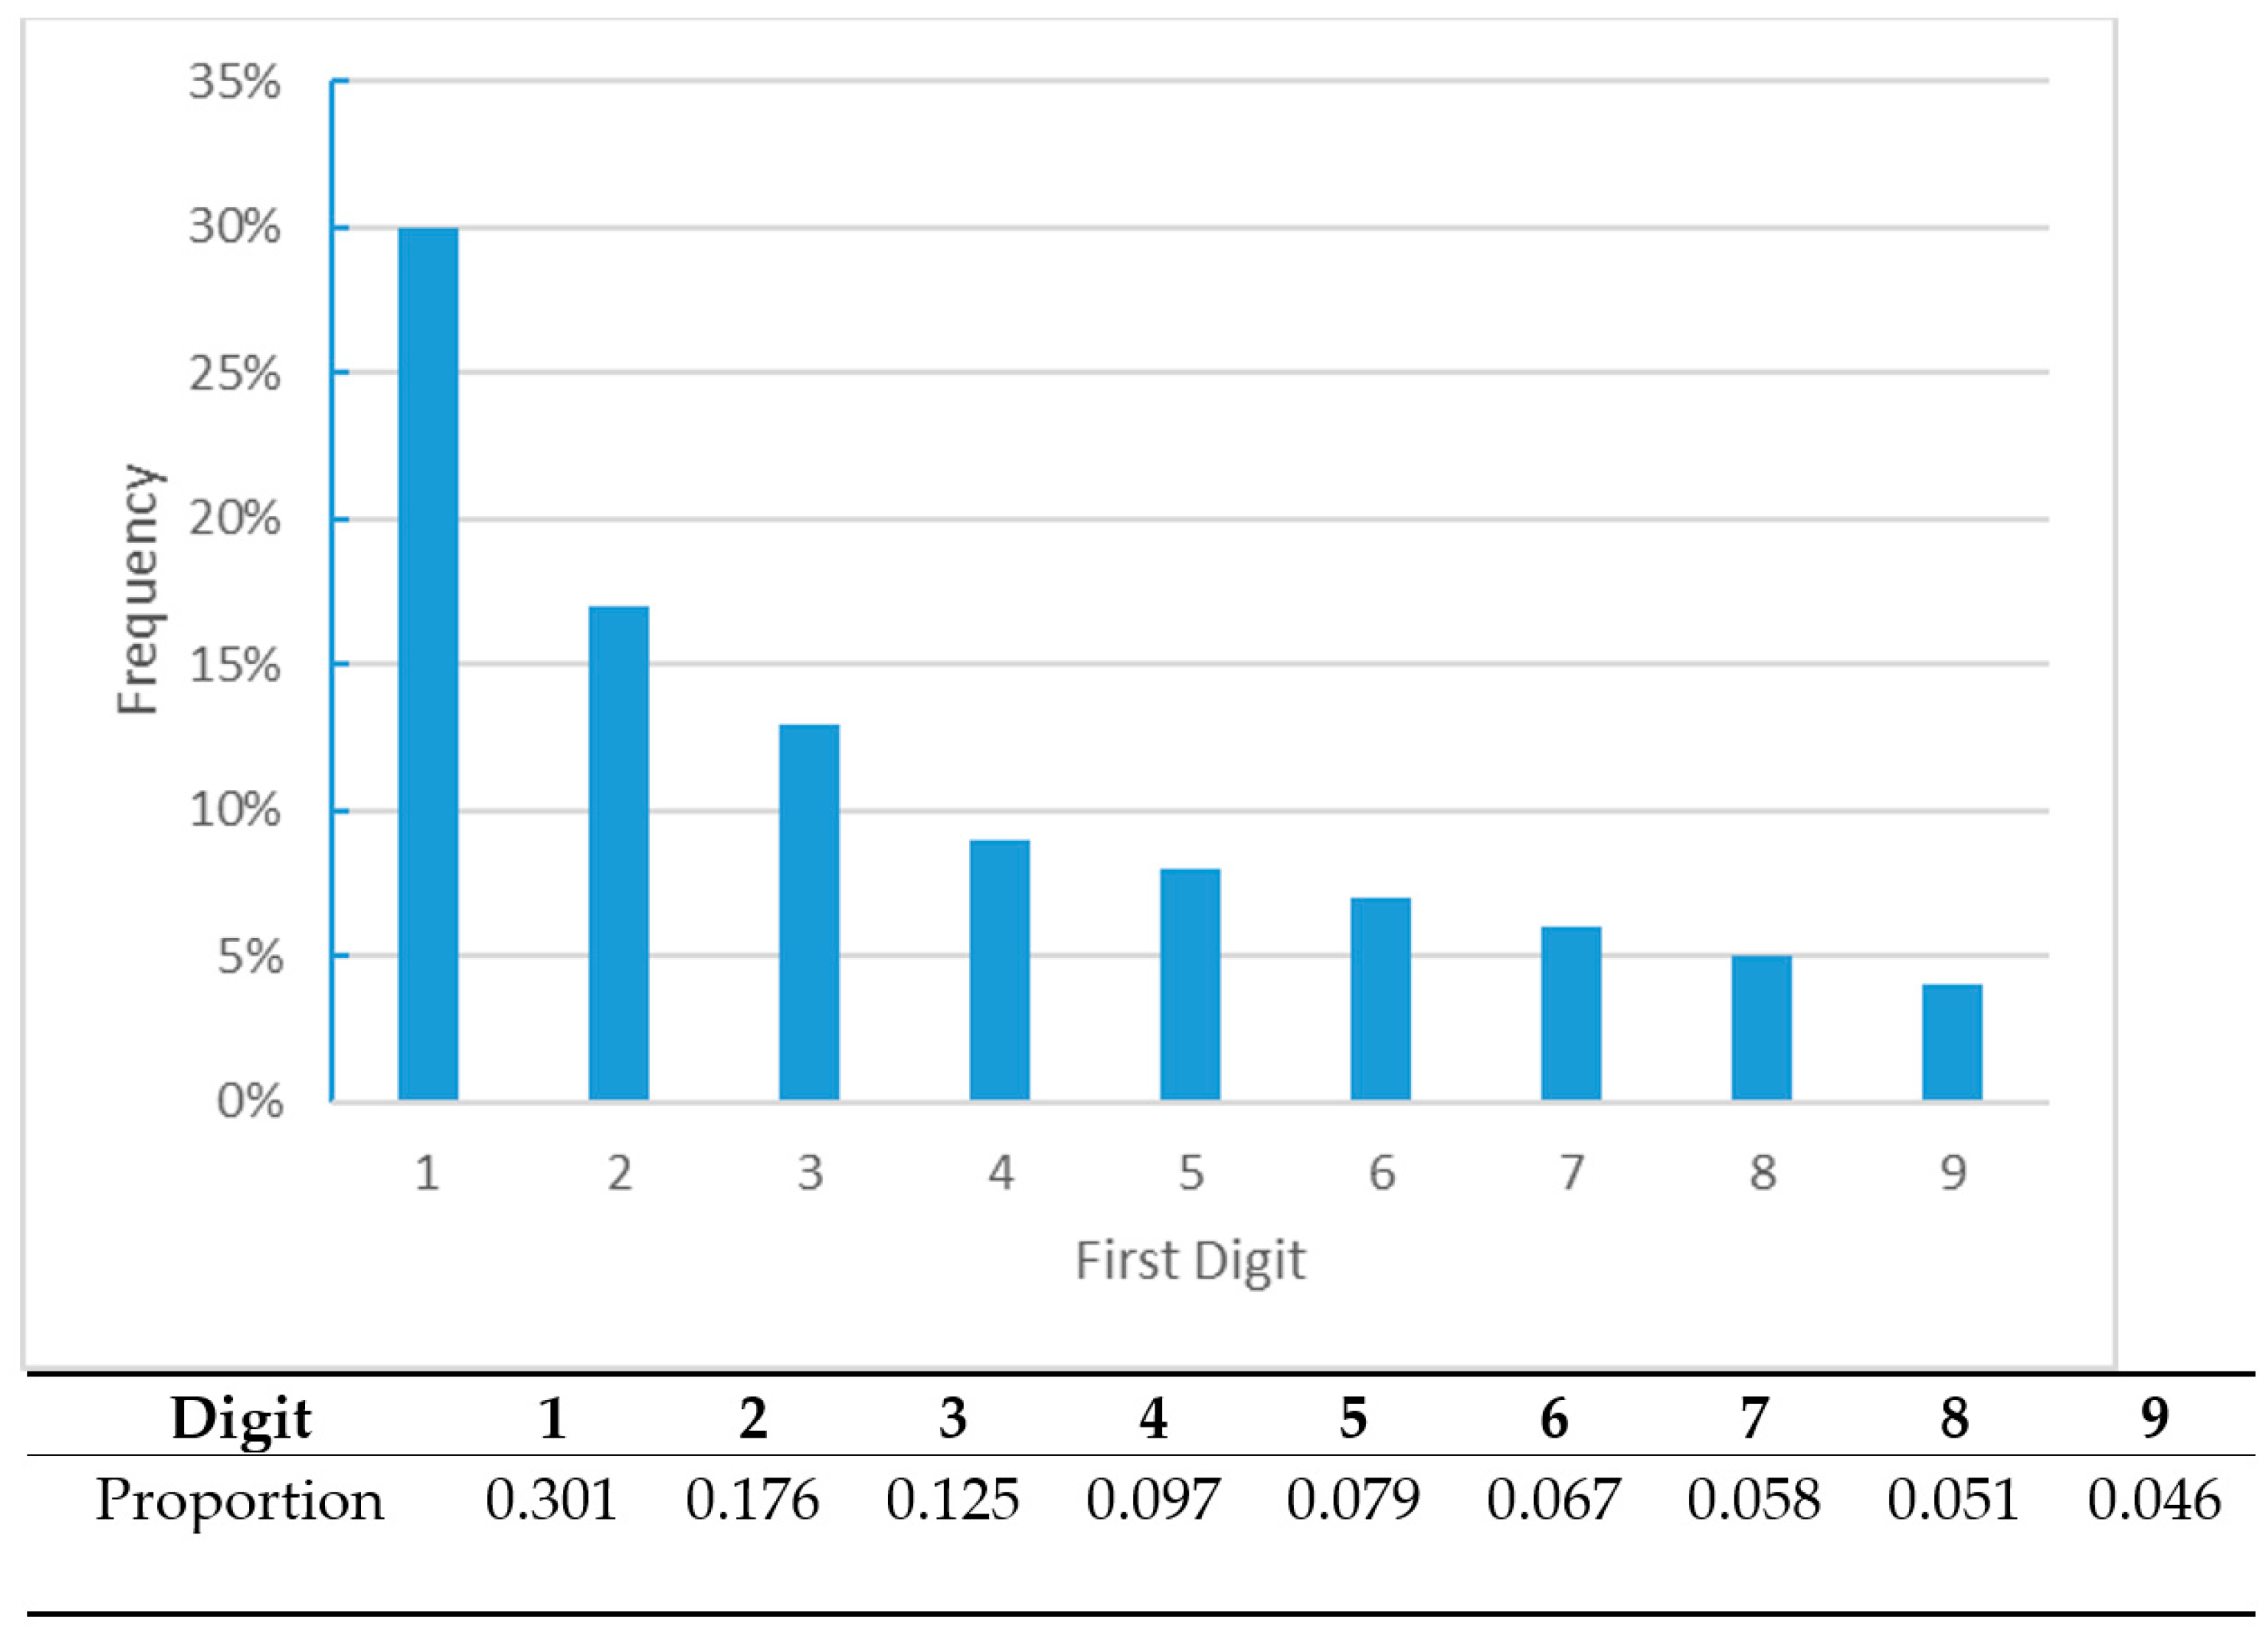
According with expression 1, BL provides the theoretical proportion for each of the digits from 1 to 9 to be first significant digit. Figure 1 shows the distribution of the first significant digit predicted by BL.
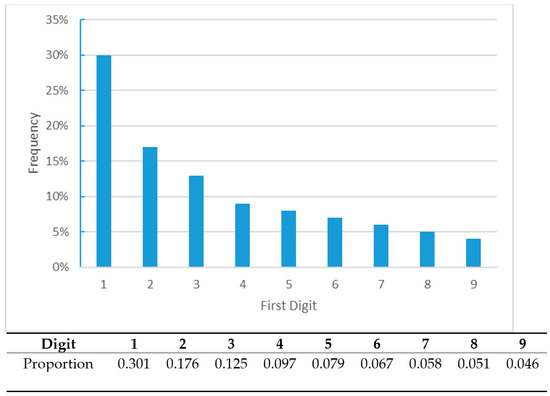
Figure 1.
Frequency distribution of the first digit according to BL.
An extension of the formula, generalized to any set of “k” first digits, is provided by Equation (2).
where P( is the probability that an arbitrary number having the first set of digits the k-tuple .
Therefore, we can obtain the probability of occurrence of each digit according to its position. Thus, for instance, the probability of the first digit is 1 is:
The probability of the first two digits of the pair 37, is:
The probability of the first three digits being the triad 280 is [18]:
2.2. Chi-Square Test
As a goodness-of-fit of the analysis, we used the χ2 (Chi-square) test. Through the χ2 test we tested whether the n entries in a set of data were compatible with BL (Equation (2)). That is to say, we tested the null hypothesis for the first digit probabilities, (. Thus, we tested the hypothesis specified below [38].
Considering as a discrete distribution of probability, and this probability is . In addition, verifies that . Then, we tested the following hypothesis:
The chi-square statistics provide a measure of the distance between real data and Benford distribution. Therefore, the higher the chi-square value, the larger the deviation between real data and Benford distribution [16].
Then, with the chi-square test we tested the null hypothesis (H0) that the first digit is the same as expected on BL basis. Hence, the chi-square test points to those sets of numbers in which we must look into the possible causes of noncompliance with BL, and are those for which we can reject the H0.
2.3. Sensitivity Analysis Steps
In order to verify the results provided by the χ2 test, we designed a sensitivity analysis following the steps detailed below. As the observed figures are random, and that randomization depends on chance, we ran this sensitivity analysis to validate results.
- Step 1.
- First, the series of observed values were modified by random perturbations assuming that:
- (i)
- such a disturbance was unintentional;
- (ii)
- the applied perturbations were independent of each other;
- (iii)
- the perturbation size varied over a 20% range, and within that range any possible outcome was equally likely. This assumption implies consideration of the uniform probability distribution taking values within the interval [−0.1, +0.1]. Denoted as U [−0.1; +0.1].
- Step 2.
- From the observed mortality rate of a specific AC, an arbitrarily large set of alternative series with a generated perturbation was obtained through a Montecarlo simulation. Specifically, we generated 1000 replications for each series. Therefore, given the observed series , we obtained the ith series modified as where 1, …, 1000, are n values obtained by simulation from the distribution U [−0.1; +0.1].
- Step 3.
- The BL test was applied to each series generated synthetically, by calculating the statistics distance of χ2 and the p-value test for that series. Then, we obtained 1000 synthetic series, with their 1000 p-values and their 1000 χ2 distances.
Summarizing, as a result of the previous steps, given an observed series, {, we could generate the 1000 synthetic simulations and the 1000 p-values , then we calculated both the average p-value, , and the average distance χ2. In addition, we calculated quantiles of α-order for those p-values, .
- Step 4.
- From it was possible to obtain the equivalent of a confidence interval that allowed validation of the decision of BL fulfillment with the observed data. That is to say, our goal was to check if the decision for observed data could be kept for data with perturbations. Then, we set a value and took a decision according to the scheme displayed in Table 1:
 Table 1. Criteria to validate decision regarding BL fulfillment.
As we can see in the procedure described above (step 4), we used a confidence interval approach for summarizing test results, but actually, this approach was similar to the empirical test hypothesis procedure.
It should be noted that, in contrast to [39], we did not use the truncated Benford’s Law, but the classical one. Therefore, our analysis focused on validating the simulations generated to contrast the test. Considering both intermediate and maximum values achieved, we perturbed such values to generate the simulations and then compared them with Benford’s Law.
3. Data and Source
For the analysis carried out in this paper, we considered data from the Spanish population in the period from March to June 2020, the first important period of the pandemic (first wave). While we could have used other periods, as the aim of this work was to compare the impact of the pandemic through BL by region in Spain, this period maintains a homogeneous characteristic for all ACs in terms of lockdown measures. In the subsequent periods known as the second and third waves, the regions adopted different control measures that could affect the pandemic trend, and therefore the resulting figures would not be as comparable. In addition, the analyzed period matched the exponential growth phase of the pandemic.
The data analyzed in this work represent the number of deaths per day recorded by the different ACs during the period under study. The data were downloaded from “datadista Git-Hub repository” [40] and the information was contrasted with the data available in the official website of the Spanish Government’s Department of Health (Ministerio de Sanidad).
There are a few errors in the transcription of the government data. Some errors are just changes in the figures due to transcription errors, or changes in the cause of death for some of the deceased. These types of errors in the information were verified and treated by Datadista.
In addition to testing those regions that follow BL in recording the number of daily deaths, we used a ranking of the mortality rate (mortality rate defined as number of COVID deaths within the considered period divided by the population size at the beginning of the period) for the different Spanish regions as a reference. That is to say, we observed whether those regions that deviate from BL are in the first or last positions of the mortality rate ranking. This comparison suggested the potential causes of the deviation from BL. Such causes may relate to errors in the records or low-quality data recording, a stronger impact of the pandemic than in other regions, or better real data than in other regions, i.e., regions with few or no deaths per day.
As discussed in the introduction, BL has been used for a wide variety of phenomena due to its versatility. For BL to be applied, the following recommendations must be met: The data must follow a geometrical sequence and must not contain a theoretical maximum or minimum. In addition, BL is independent of the scale of measurement on which the data are being processed.
Therefore, according to the data characteristics described above, BL was a suitable methodology to achieve the objective proposed in this paper; that is to say, the goal was to test whether the number of daily COVID-related deaths registered by the different ACs followed BL. Hence, it was necessary to focus the analysis on those regions that showed a deviation from what is expected according to BL in the daily death register, in order to identify the possible causes of this deviation. As explained before, we proposed to use BL as an auditing guide to identify possible errors or deviations in the COVID figures recorded by the ACs, in order to set a common tool of reliability data assessment at any level of the health administration hierarchy.
In view of the above, our research question focuses on whether the number of COVID deaths reported by the different ACs during the first four months of the pandemic follows Benford’s Law, in such a way that it is easy to identify those ACs whose figures deviate from the expected trend, and that it is therefore possible to analyze possible errors in the recording of the data.
4. Results
The summary of the main results of our analysis are displayed in Table 2, where we compare the goodness-of-fit to BL with the mortality rate in order to identify recording errors or deviations from the expected trend in the daily death figures by ACs. No standardization variables, such as age or gender, were used in the mortality rate calculation. Disaggregated official data were not available, at least at the beginning of the pandemic period, because of which we considered the global number of deaths.

Table 2.
Regions ranked by χ2 test.
Table 2 includes both results of compliance with BL (χ2 test) and the COVID mortality rate by ACs. Among those regions for which we reject the hypothesis that BL is fulfilled, two kinds of interpretation can be offered. The majority of the ACs for which we reject the H0 are ranked at the top of the mortality rate ranking (above the Spanish rate). In these cases, the explanation for the deviation from BL relates to mistakes in the registration of the daily number of deaths, or an uncontrolled pandemic crisis providing skyrocketing figures. The region with the largest χ2 value is Catalonia, that is to say, the one with the largest deviation from what was expected according to BL. In fact, Catalonia rectified up to approximately 20% of the data initially supplied to the Ministry, confirming that there had been errors in the registry or in the counting of cases.
The exceptions within this group of regions are the cases of Galicia and Extremadura, for which we reject the null hypothesis but which both show low mortality rates. In these cases, the number of daily deaths does not comply with BL probably because of the low number of daily deaths recorded; the number of deaths recorded daily was only one or two.
Therefore, the fact that the number of daily deaths does not follow BL may be due to either incorrect recording of cases (daily deaths in this case), or to a favorable evolution of the pandemic within the region. Thus, in some cases, a region may show a good outcome (a number of daily deaths that remains low over time). Thus, as it records few deaths per day, the phenomenon does not follow the exponential trend described by BL. However, in other cases, non-compliance with BL indicates those regions that may have extremely high daily death rates. (Even if the meaning of death rate is not the same than growth rate (of the number of deaths), somehow, they are related. For instance, if the growth rate increases, the death rate is expected to increase, since the population size (denominator) decreases as the number of deaths increase.)
For those ACs for which we cannot reject the null hypothesis, in other words, where the number of daily deaths follows BL, lower mortality rates are observed. That is, although the figures follow an exponential shift, the expected trend is observed, and this can be considered an indicator that the data have been correctly recorded. However, we can find one exception. This is the case of País Vasco, which is in the middle of the mortality rate ranking, but the number of daily deaths follows BL. In this case, although the COVID mortality rate was high, slightly higher than the Spanish rate, we can say that this information is reliable and the daily number of deaths was well recorded.
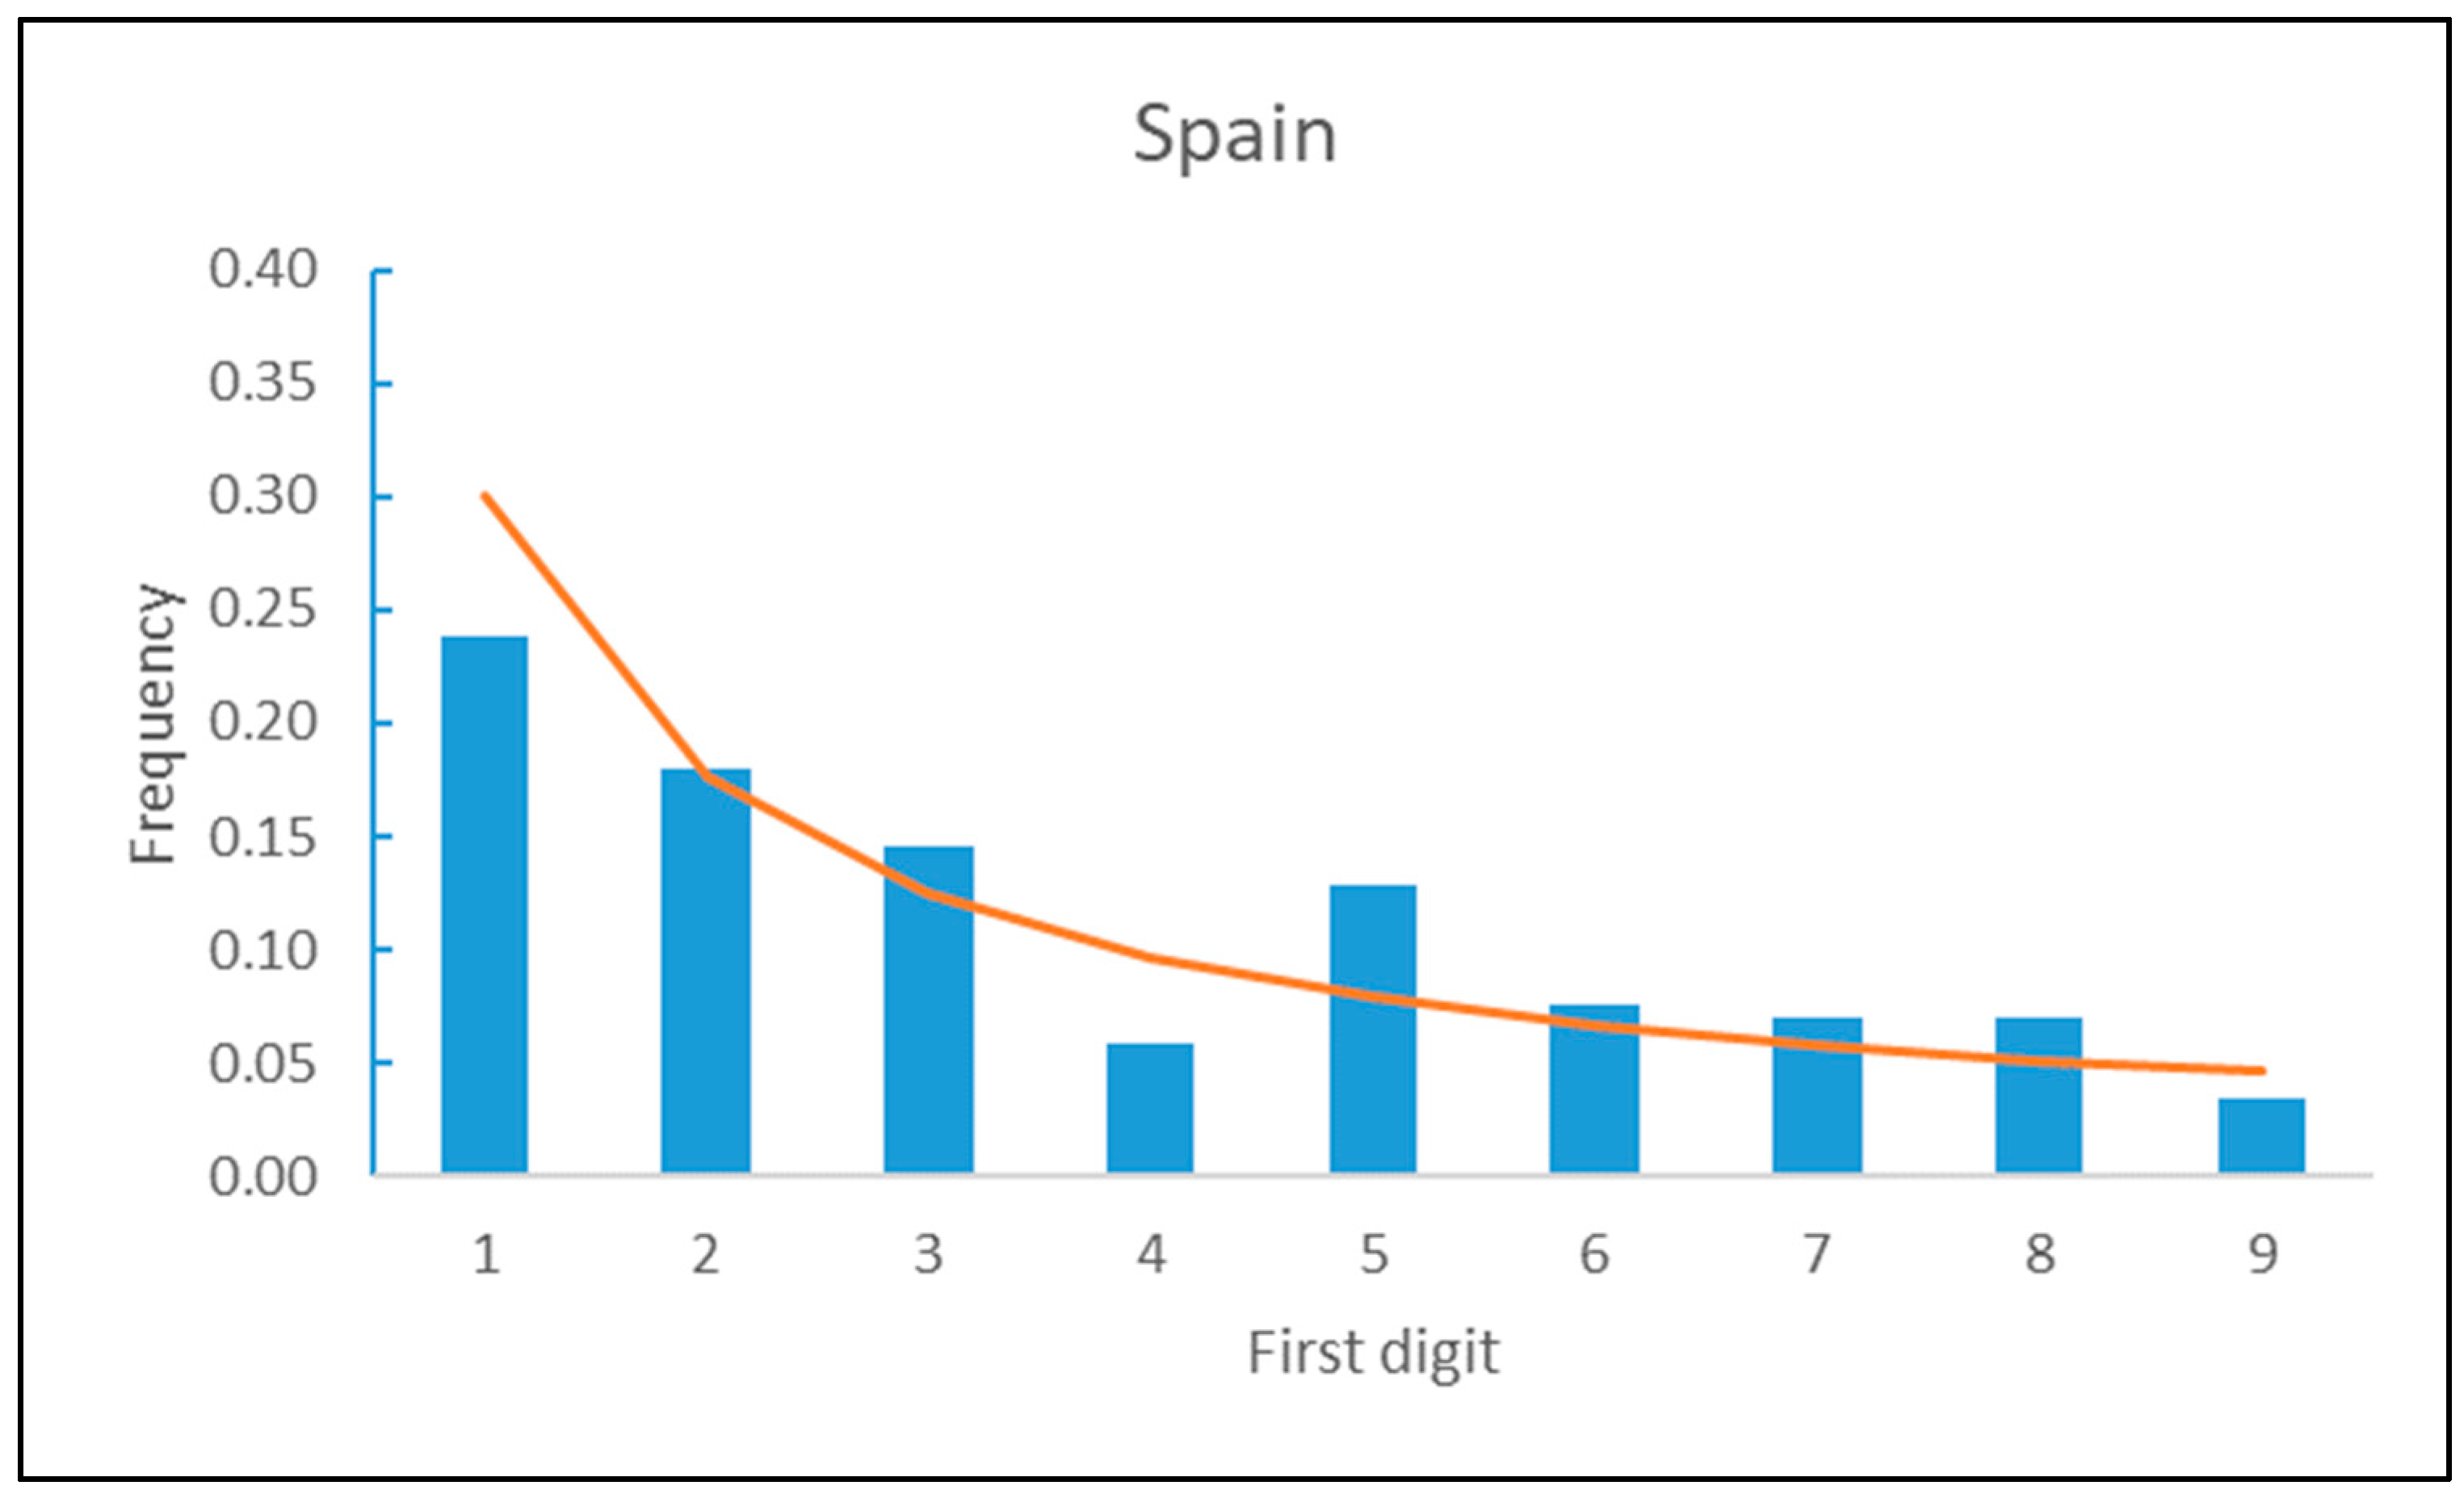
In Figure 2, we can graphically observe the frequencies of recording actual daily deaths versus the trend defined by BL for the figures at a national level. Specifically, bars represent the frequency distribution of the first digit of the number of COVID deaths per day in Spain during the period under study (from March to June 2020) while the line represent the theoretical distribution of BL.
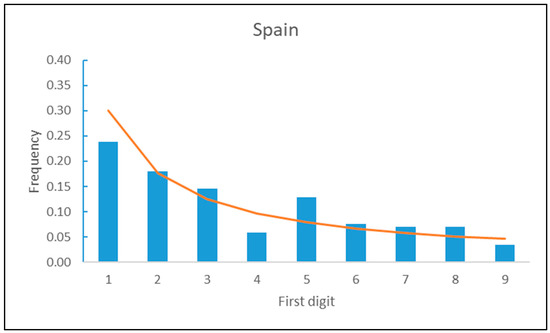
Figure 2.
Frequency distribution of the first digit of the number of deaths per day by COVID in Spain.
As we can observe in Figure 2, the frequency of daily deaths recorded at a national level are quite in line with the trend described by BL.
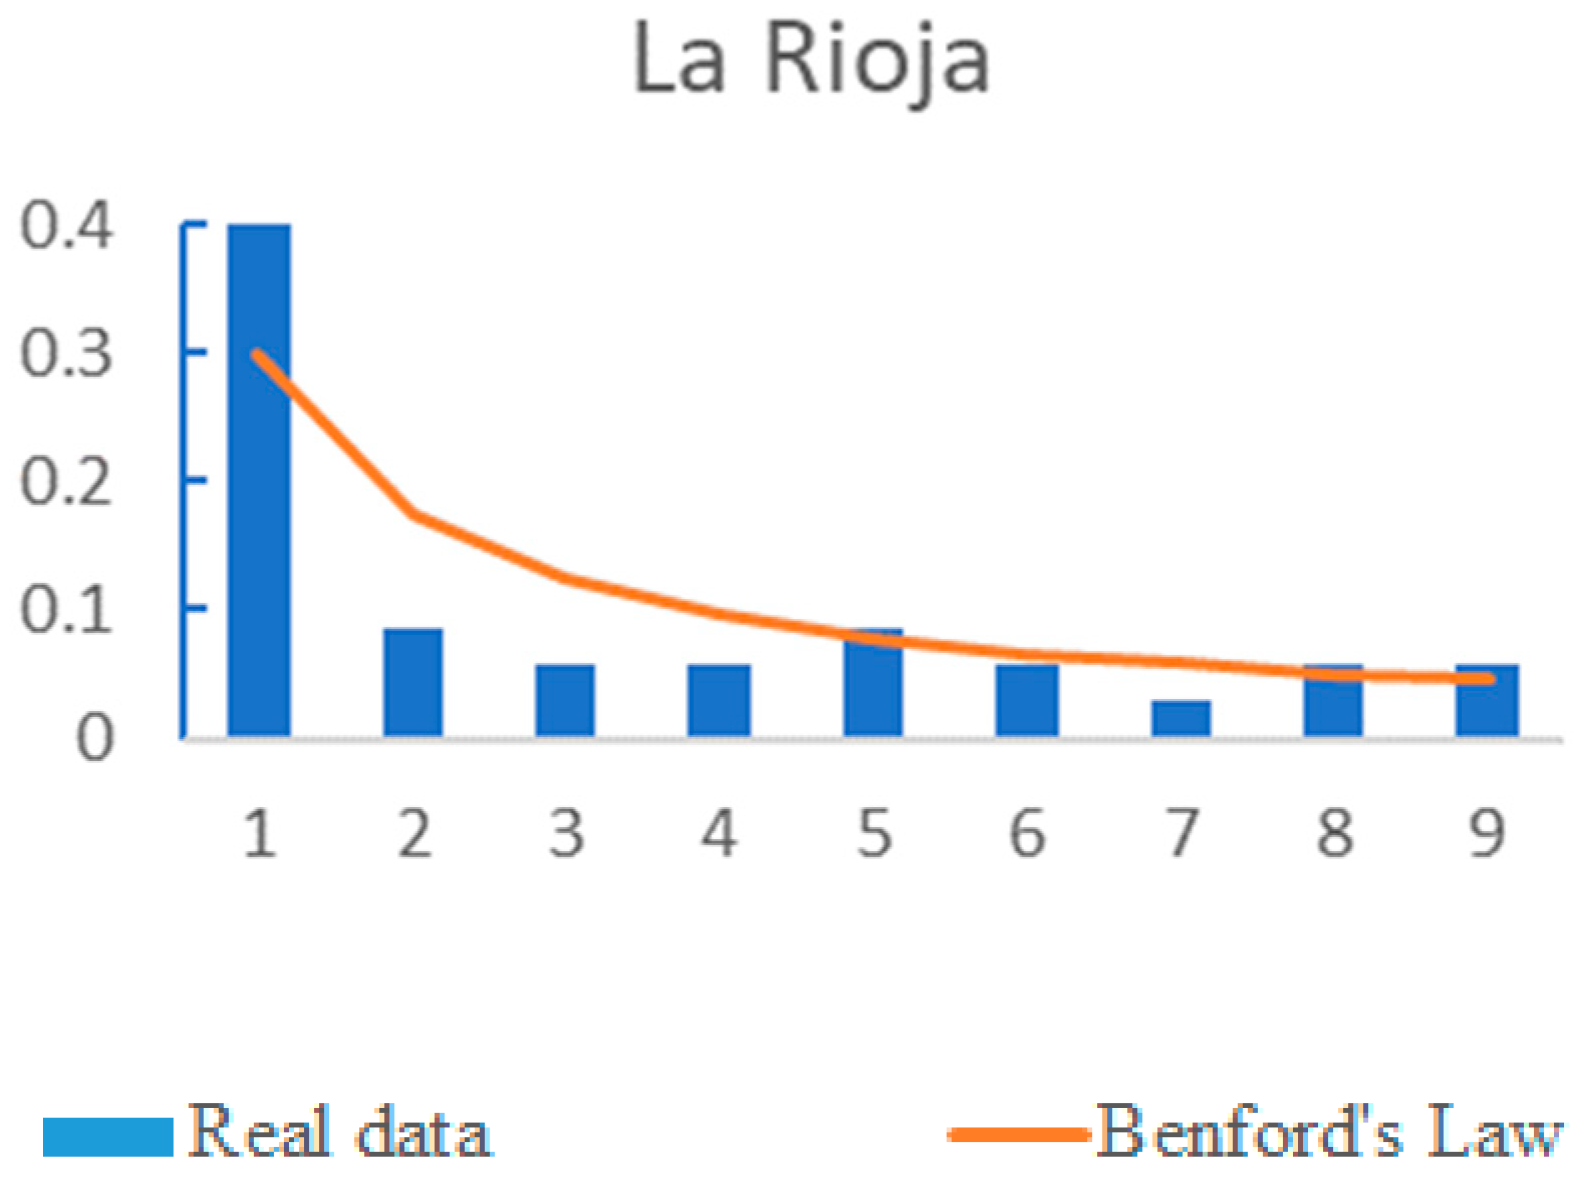
In addition, Figure 3 shows the graphic comparison for each AC, and we can observe that regions such as Cataluña, Navarra or La Rioja show a divergence in the frequency of the first digits from the trend defined by BL. As shown in Table 2, none of these regions fit BL., while regions such as Comunidad Valenciana or Murcia have first figure frequencies that are very similar to that described by BL. These are regions for which the number of daily deaths fulfil BL.


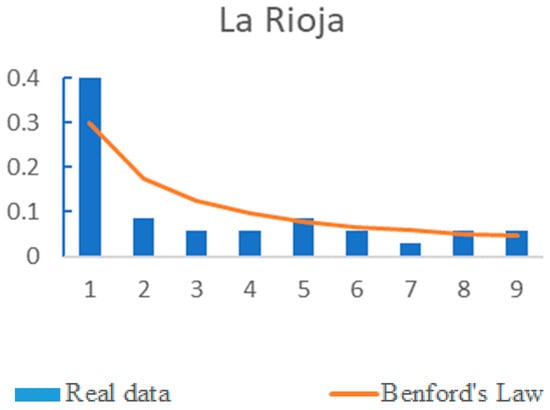
Figure 3.
Frequency distribution of the first digit of the number of COVID deaths per day by AA.CC. (As in Figure 2, in this figure, the Y axes represent the frequency and X axes represent the first digit of the number of COVID deaths.).
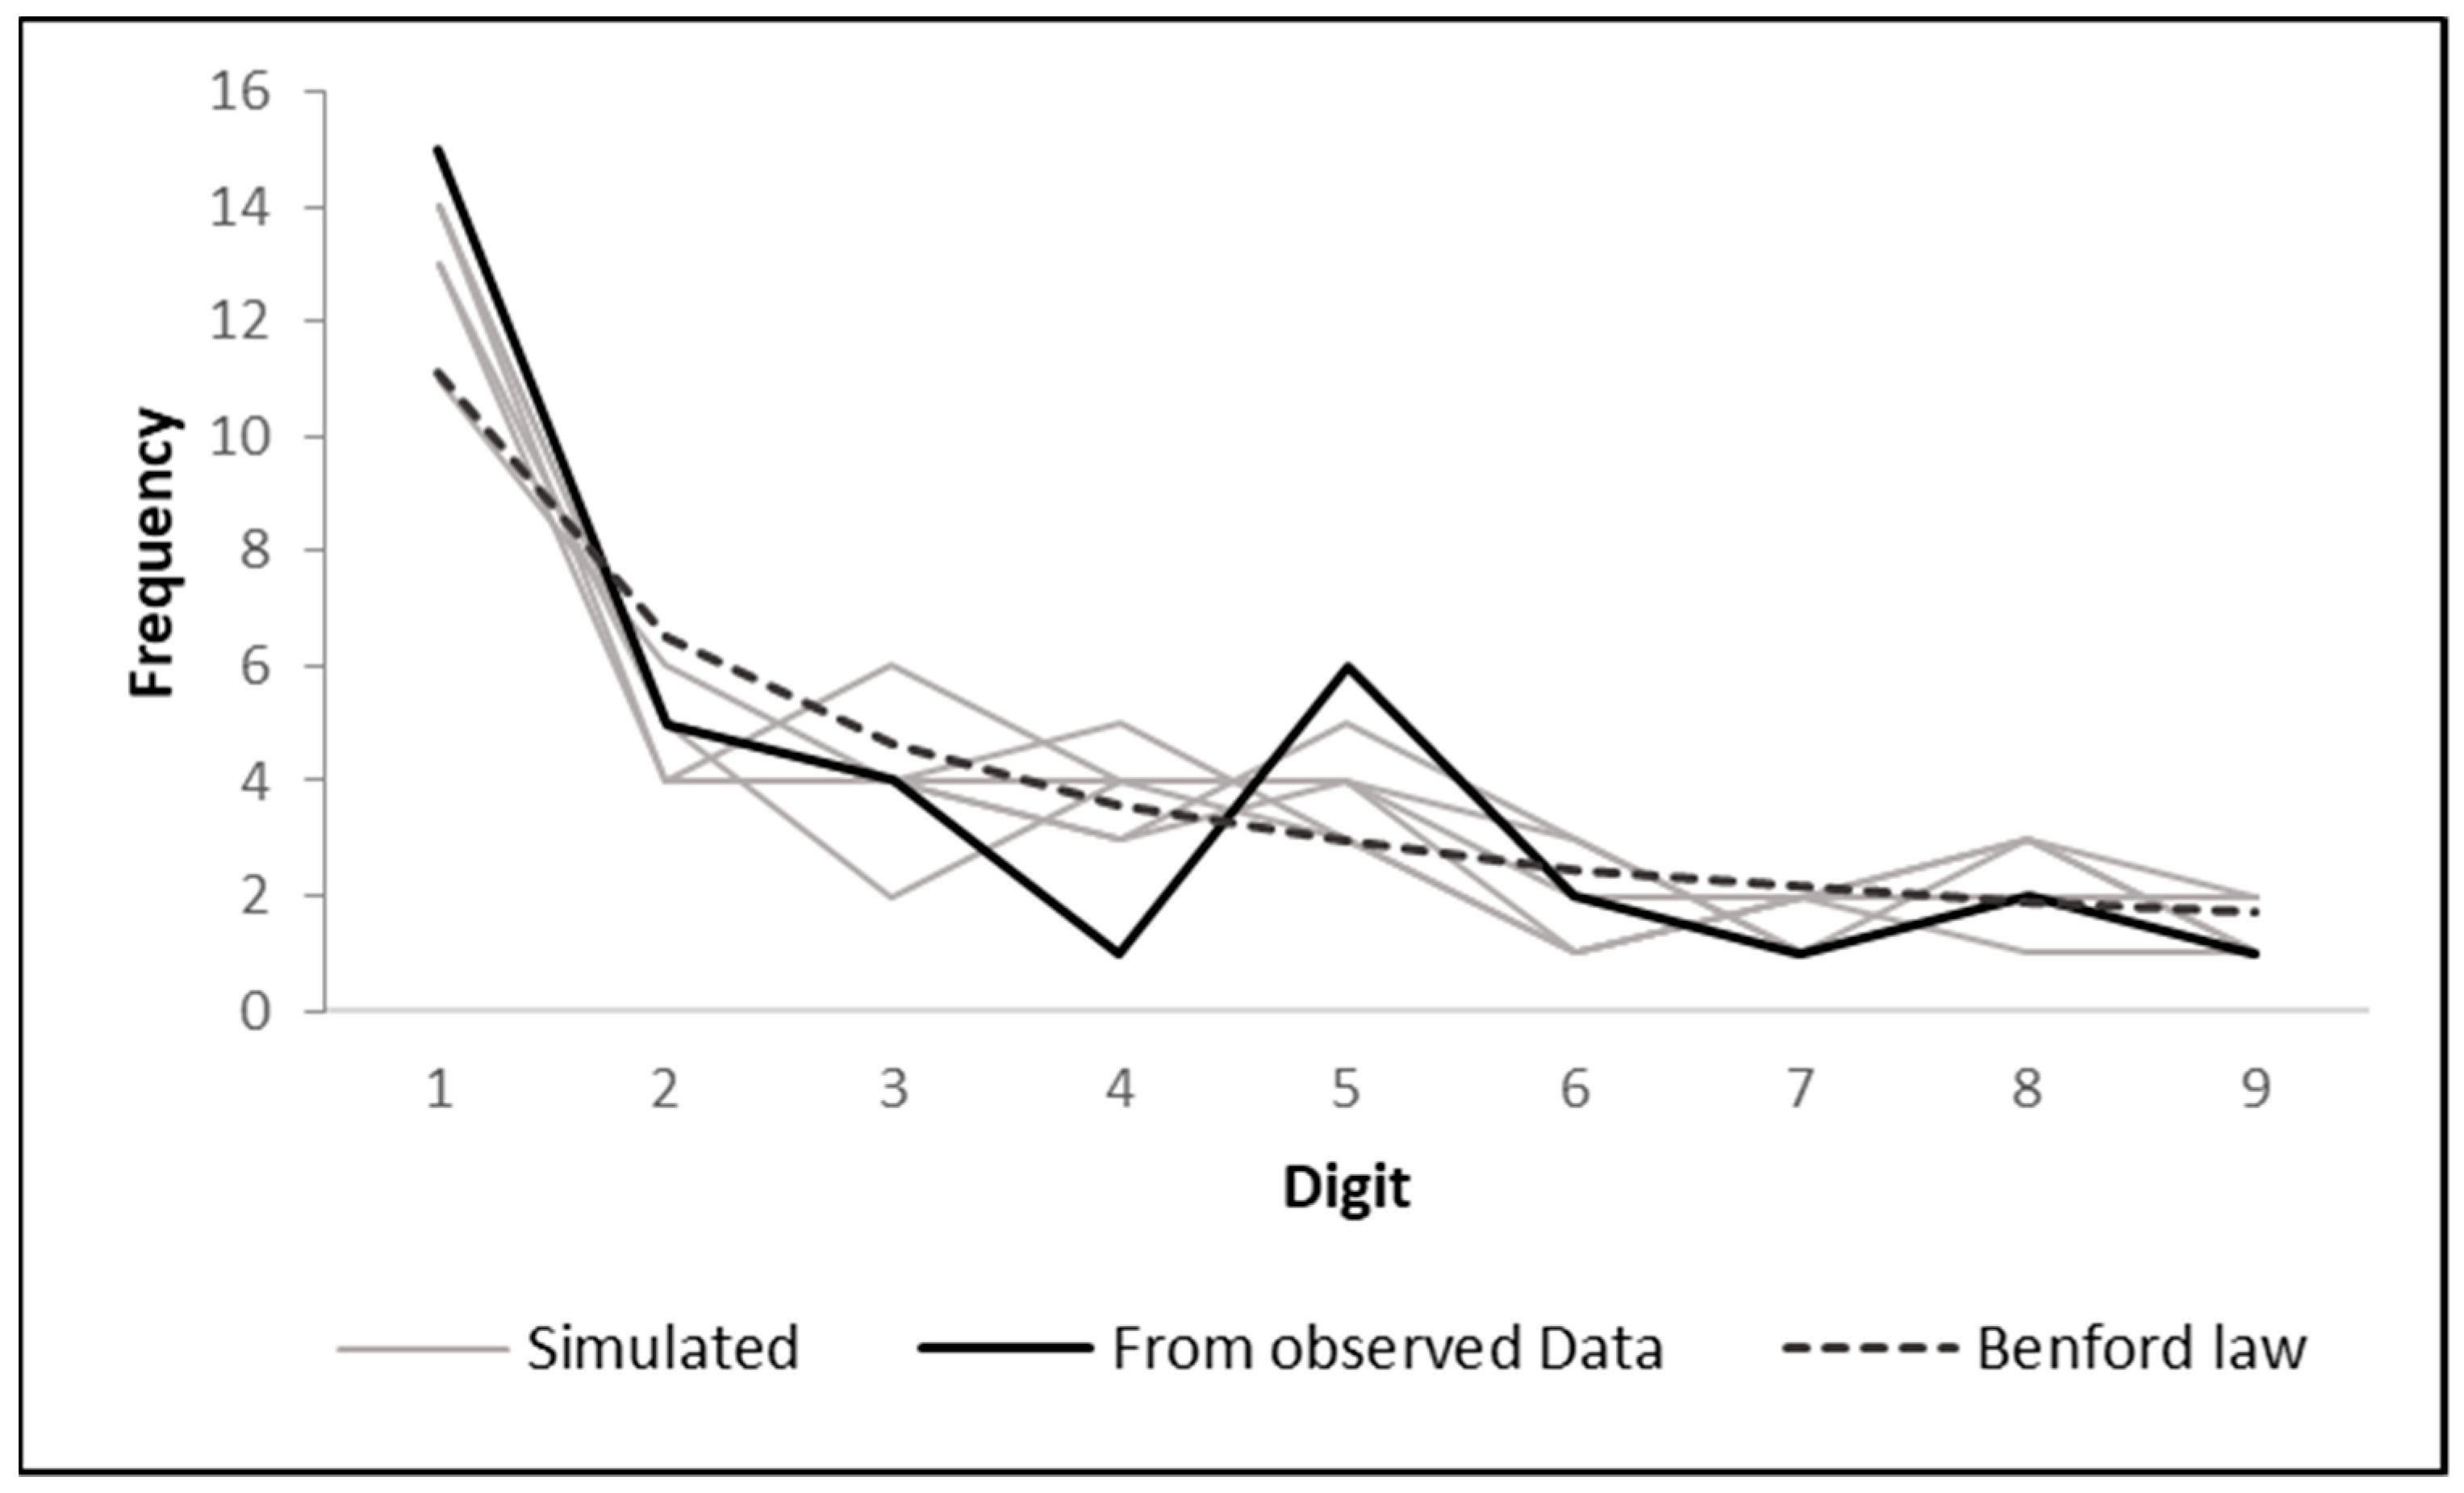
Then, as described within Section 2, in order to verify the reliability of results showing in Table 2 regarding whether the AC data follow BL, we ran a sensitivity analysis. Figure 4 graphically shows a set of simulations modifying the observed values by random perturbations. Specifically, the figure displays the Benford count (colored lines) of the Spain observed data series (black line) and the Benford curve is taken as a reference (dotted line), for the considered period.
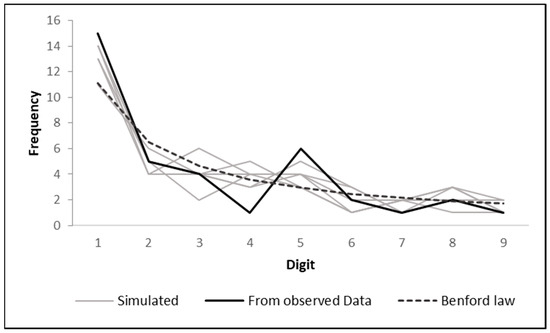
Figure 4.
Benford count. Observed series and simulations.
The sensitivity analysis allowed us to verify results provided by the chi-square test. Therefore, following the criteria detailed in Table 1, results of the sensitivity analysis for each AC are shown in Table 3 (As in Figure 2 and Figure 3, the Y axes represent the frequency and X axes represent the first digit of the number of COVID deaths.).

Table 3.
Showing the sensitivity analysis results for each AC.
As displayed in Table 3, we maintain the initial decision regarding BL fulfilment for all ACs. The sensitivity analysis, therefore, verifies and confirms the initial decision taken using the χ2 test.
In summary, we can use the BL fit test as an indicator of the reliability of the data recorded in terms of daily COVID deaths for the different regions. Furthermore, comparing this result with the mortality rate can help to interpret the specificities of each AC and identify whether we are dealing with an error in the data recording or a particularity in the trend of the pandemic for that specific region.
Actually, deviations and errors in the recording of data provided by the different ACs occurred above all in the first months of the pandemic. Subsequently, the records have improved and refined. In fact, if we apply the chi-square test for the second, third and fourth waves, the number of ACs that meet BL increases.
Our analyses reveal diversity in the profile across the different ACs, and point out those cases with greater deviations, which, therefore, require special attention as to the possible causes of such divergence.
In a country with the characteristics of Spain in terms of health organization, it is crucial to set common tools for the verification of data, in order to have reliable and homogeneous information available throughout the Spanish territory to serve as a basis for public health decisions.
5. Discussion
BL has already been used with different purposes within the COVID-19 pandemic context [16,26,41]. However, the proposal of this paper is to use BL as a health crisis management tool to audit the correctness of the recording of COVID figures for the different ACs and to identify deviations from the expected trend. Specifically, we use BL for detecting possible errors in the accounting of COVID deaths within the context of the Spanish ACs.
The first wave of the COVID pandemic has generated a great deal of controversy in Spain due to the discrepancy in the figures regarding the number of daily deaths provided by the different ACs. Differences both in the magnitudes of figures and the rate at which they are updated have created doubts about their reliability.
To understand the statistical deficiencies detected in the records of deaths due to COVID, several situations that have influenced this problem must be taken into account. In the first place, since it was an emerging and unknown disease until 2019, public administrations have had to face significant problems, such as the lack of homogenization and consensus at the time of registering COVID-related deaths. Likewise, the death registration system used in each region may have presented logical deficiencies in its operational dynamics in the face of a totally unforeseen situation. Thus, the clinical and diagnostic criteria to confirm a death due to COVID could differ from one administration to another. For example, especially at the beginning of the pandemic, it was very difficult to establish whether a death was due to COVID-19, since it was not possible to carry out confirmatory diagnostic tests on all suspected cases, nor was it possible to carry out diagnostic tests that would allow the evolution of the disease to be followed. This was especially evident in the social health centers, where, due to the lack of healthcare resources, it was very difficult to carry out an optimal follow-up of the disease. Furthermore, both under-registration and over-registration of deaths generate a distortion in the information that prevents a correct planning and management of the health resources to contain and control the pandemic. In addition, it also creates a situation of mistrust and misinformation among public opinion.
However, having reliable and homogenous information on the state of the pandemic throughout the country is crucial for good pandemic management. For this reason, the development of models and indicators that serve as guidelines for the correct recording of data is a key ally for health administrations at all management levels.
This article shows how BL can be taken as a reference for the control of the registration of the number of daily COVID-related deaths. Specifically, we proposed to test the hypothesis that the frequency of the daily number of deaths follows BL through a chi-square test as an audit test for data reliability. Non-compliance with BL points to those regions that may have errors in the recording of COVID deaths. This tells us where the focus should be placed to analyze the possible causes of these deviations from the expected trend. While accepting the hypothesis of BL, compliance is a good indicator of the reliability of the data.
In addition, in order to validate our results, we ran a sensitivity analysis that allowed us to confirm the decisions about the hypothesis of BL fulfilment. In fact, the sensitivity test yielded the same results as using the chi-square test, hence we maintained the decision on those ACs that do not follow BL.
As already mentioned, the recording of the number of daily deaths is particularly sensitive as it presents medical and administrative difficulties. Moreover, in general terms, few administrations were ready to deal with a pandemic of the magnitude of COVID-19. However, professionals in the sector have reacted quickly and efficiently and have adapted processes and protocols to the new health reality, improving and refining the correct recording of data. In fact, if we were to carry out the same analysis presented in this paper with data from the third or fourth wave, we would find that the numbers of daily deaths for practically all the ACs complied with BL. As the recording of the numbers of daily deaths has improved and the data have become more reliable, there is more compliance with BL.
We believe that this paper may be useful to set common tools for the verification of data, in order to have reliable and homogeneous information available throughout the Spanish territory to serve as a basis for public health decisions.
However, we are considering future research lines to improve our work as a result of the identification of some limitations. For instance, in this paper we assumed a geometric growth of the pandemic, however we could consider other growth trends based on laws such as Weibull [42] or gamma [13,43], among others.
Furthermore, in future research, it would be interesting to study the effects of different containment policies or lockdown measures on the pandemic exponential decline among the different ACs.
6. Conclusions
As already mentioned, we focused our analysis on the Spanish case, where significant differences in COVID figures have been found during the current pandemic among the different ACs. According to our results, while we accept the hypothesis for the aggregate data for Spain, in various ACs we observed some discrepancies, as not all the ACs fulfil BL.
Once we identified those ACs whose recording of daily deaths did not comply with BL, we compared it with the ranking of the mortality rate as a reference to find possible causes for the deviation from the expected trend. In fact, the majority of ACs for which we rejected the H0 are ranked at the top of the mortality rate ranking (above the Spanish rate). In these cases, the explanation for the deviation from BL relates to mistakes in the registration of the daily number of deaths (this is the case with Cataluña, Navarra and Madrid among others). These mistakes in data registration may be due to delays in information reporting (events on a specific day may be recorded afterwards), human error and differences in counting or recording criteria, among others. In fact, anomalous figures, such as the case of Catalonia, have been often reported in the press. In this AC, one of the main recording errors was the delay in reporting and recording information (sometimes attributing to a single day death cases from previous days) [44].
However, there are two ACs (Galicia and Extremadura) that do not fulfil BL but present a mortality rate below the average. In these cases, the non-accomplishment of BL is due to the low number of daily deaths. When on the majority of the days there were just one, two or zero deaths, this set of numbers did not grow exponentially, and therefore the probability distribution for the leading digit does not follow BL.
For those ACs for which we cannot reject the null hypothesis, or in other words, for which the number of daily deaths follows BL, this can be considered as an indicator of data reliability.
To summarize, by comparing the results of the BL hypothesis test with the mortality rate, we can better interpret the results. Thus, we obtain two possible explanations for those ACs that do not conform to BL: either there was an error in the recording of the data, or the pandemic was following a positive evolution and the number of deaths per day was very low, therefore the phenomenon does not follow the exponential trend described by BL.
In this way, BL can be used as an auditing tool in the recording of COVID data, specifically for the number of daily deaths, and therefore can help to provide reliable data to health administrations in their different management levels. Thus, BL can be used as an epidemiological tool to generate information on the precision in the registration of notified cases and number of daily deaths for the evaluation of different intervention strategies [27]. Especially in contexts where health competencies are decentralized, as is the case in Spain, coordination among CAs and the provision of homogenous information are crucial for public health management. This coordination requires the setting of common tools and procedures for data auditing at a national level.
Author Contributions
Conceptualization, F.G.M.-J. and M.C.-T.; methodology, F.G.M.-J.; software, F.G.M.-J.; validation, F.G.M.-J., M.C.-T. and V.C.-T.; formal analysis, F.G.M.-J., M.C.-T. and V.C.-T.; investigation, M.C.-T., V.C.-T. and F.G.M.-J.; writing—original draft preparation, M.C.-T. and V.C.-T.; writing—review and editing, F.G.M.-J., M.C.-T. and V.C.-T.; visualization, F.G.M.-J., M.C.-T. and V.C.-T.; supervision, F.G.M.-J., M.C.-T. and V.C.-T. All authors have read and agreed to the published version of the manuscript.
Funding
This research received no external funding.
Institutional Review Board Statement
Not applicable.
Informed Consent Statement
Not applicable.
Data Availability Statement
Not applicable.
Conflicts of Interest
The authors declare no conflict of interest.
References
- Anirudh, A. Mathematical modeling and the transmission dynamics in predicting the COVID-19—What next in combating the pandemic. Infect. Dis. Model. 2020, 5, 366–374. [Google Scholar] [CrossRef] [PubMed]
- Mohamadou, Y.; Halidou, A.; Kapen, P.T. A review of mathematical modeling, artificial intelligence and datasets used in the study, prediction and management of COVID-19. Appl. Intell. 2020, 50, 3913–3925. [Google Scholar] [CrossRef] [PubMed]
- Ahmad, F.; Almuayqil, S.N.; Humayun, M.; Naseem, S.; Khan, W.A.; Junaid, K. Prediction of COVID-19 Cases Using Machine Learning for Effective Public Health Management. Comput. Mater. Contin. 2021, 66, 2265–2282. [Google Scholar] [CrossRef]
- Yadav, D.; Maheshwari, H.; Chandra, U. Outbreak prediction of covid-19 in most susceptible countries. Glob. J. Environ. Sci. Manag. 2020, 6, 11–20. [Google Scholar] [CrossRef]
- Li, S.; Lin, Y.; Zhu, T.; Fan, M.; Xu, S.; Qiu, W.; Chen, C.; Li, L.; Wang, Y.; Yan, J.; et al. Development and external evaluation of predictions models for mortality of COVID-19 patients using machine learning method. Neural Comput. Appl. 2021, 1–10, Epub ahead of print. [Google Scholar] [CrossRef]
- Giuliani, D.; Dickson, M.M.; Espa, G.; Santi, F. Modelling and predicting the spatio-temporal spread of COVID-19 in Italy. BMC Infect. Dis. 2020, 20, 700. [Google Scholar] [CrossRef]
- Alboaneen, D.; Pranggono, B.; Alshammari, D.; Alqahtani, N.; Alyaffer, R. Predicting the Epidemiological Outbreak of the Coronavirus Disease 2019 (COVID-19) in Saudi Arabia. Int. J. Environ. Res. Public Health 2020, 17, 4568. [Google Scholar] [CrossRef]
- Alsayed, A.; Sadir, H.; Kamil, R.; Sari, H. Prediction of Epidemic Peak and Infected Cases for COVID-19 Disease in Malaysia, 2020. Int. J. Environ. Res. Public Health 2020, 17, 4076. [Google Scholar] [CrossRef]
- Jia, L.; Li, K.; Jiang, Y.; Guo, X.; Zhao, T. Prediction and Analysis of Coronavirus Disease 2019. arXiv 2020, arXiv:2003.05447. [Google Scholar]
- Qin, L.; Sun, Q.; Wang, Y.; Wu, K.-F.; Chen, M.; Shia, B.-C.; Wu, S.-Y. Prediction of Number of Cases of 2019 Novel Coronavirus (COVID-19) Using Social Media Search Index. Int. J. Environ. Res. Public Health 2020, 17, 2365. [Google Scholar] [CrossRef]
- Ayyoubzadeh, S.M.; Ayyoubzadeh, S.M.; Zahedi, H.; Ahmadi, M.; Niakan Kalhori, S.R. Predicting COVID-19 Incidence Through Analysis of Google Trends Data in Iran: Data Mining and Deep Learning Pilot Study. JMIR Public Health Surveill. 2020, 6, e18828. [Google Scholar] [CrossRef] [PubMed]
- Ganasegeran, K.; Ch’ng, A.S.H.; Looi, I. What Is the Estimated COVID-19 Reproduction Number and the Proportion of the Population That Needs to Be Immunized to Achieve Herd Immunity in Malaysia? A Mathematical Epidemiology Synthesis. COVID 2021, 1, 13–19. [Google Scholar] [CrossRef]
- Park, S.W.; Champredon, D.; Weitz, J.S.; Dushoff, J. A practical generation-interval-based approach to inferring the strength of epidemics from their speed. Epidemics 2019, 27, 12–18. [Google Scholar] [CrossRef]
- Caballer-Tarazona, M.; Moya-Clemente, I.; Vivas-Consuelo, D.; Barrachina-Martínez, I. A model to measure the efficiency of hospital performance. Math. Comput. Model. 2010, 52, 1095–1102. [Google Scholar] [CrossRef]
- Benford, F. The Law of Anomalous Numbers. Proc. Am. Philos. Soc. 1938, 78, 551–572. Available online: http://www.jstor.org/stable/984802 (accessed on 20 January 2021).
- Lee, K.-B.; Han, S.; Jeong, Y. COVID-19, flattening the curve, and Benford’s law. Phys. A 2020, 559, 125090. [Google Scholar] [CrossRef]
- Maher, M.; Akers, M. Using Benfords Law to Detect Fraud in the Insurance Industry. Account. Fac. Res. Publ. 2011, 1, 1–4. [Google Scholar] [CrossRef][Green Version]
- Cabeza García, P.M. Aplicación de la ley de Benford en la detección de fraudes. Rev. Univ. Soc. 2019, 11, 421–427. [Google Scholar]
- Cerioli, A.; Barabesi, L.; Cerasa, A.; Menegatti, M.; Perrotta, D. Newcomb–Benford law and the detection of frauds in international trade. Proc. Natl. Acad. Sci. USA 2019, 116, 106–115. [Google Scholar] [CrossRef] [PubMed]
- Barabesi, L.; Cerasa, A.; Cerioli, A.; Perrotta, D. Goodness-of-Fit Testing for the Newcomb-Benford Law with Application to the Detection of Customs Fraud. J. Bus. Econ. Stat. 2018, 36, 346–358. [Google Scholar] [CrossRef]
- Diekmann, A. Not the First Digit! Using Benford’s Law to Detect Fraudulent Scientif ic Data. J. Appl. Stat. 2007, 34, 321–329. [Google Scholar] [CrossRef]
- Stoerk, T. Statistical corruption in Beijing’s air quality data has likely ended in 2012. Atmos. Environ. 2016, 127, 365–371. [Google Scholar] [CrossRef]
- Gómez-Camponovo, M.; Moreno, J.; Idrovo, Á.J.; Páez, M.; Achkar, M. Monitoring the Paraguayan epidemiological dengue surveillance system (2009–2011) using Benford’s law. Biomedica 2016, 36, 583–592. [Google Scholar] [CrossRef] [PubMed]
- Burlac, L.; Giannakis, N. Benford’s Law: Analysis of the Trustworthiness of COVID-19 Reporting in the Context of Different Political Regimes; School of Education, Culture and Communication, Mälardalen University: Vasteros, Sweden, 2021. [Google Scholar]
- Tasri, Y.D.; Tasri, E.S. Improving clinical records: Their role in decision-making and healthcare management—COVID-19 perspectives. Int. J. Healthc. Manag. 2020, 13, 325–336. [Google Scholar] [CrossRef]
- Koch, C.; Okamura, K. Benford’s Law and COVID-19 reporting. Econ. Lett. 2020, 196, 109573. [Google Scholar] [CrossRef] [PubMed]
- Iosa, M.; Paolucci, S.; Morone, G. Covid-19: A Dynamic Analysis of Fatality Risk in Italy. Front. Med. 2020, 7, 185. [Google Scholar] [CrossRef]
- Armocida, B.; Formenti, B.; Ussai, S.; Palestra, F.; Missoni, E. The Italian health system and the COVID-19 challenge. Lancet Public Health 2020, 5, e253. [Google Scholar] [CrossRef]
- Caballer-Tarazona, M.; Clemente-Collado, A.; Vivas-Consuelo, D. A cost and performance comparison of Public Private Partnership and public hospitals in Spain. Health Econ. Rev. 2016, 6, 17. [Google Scholar] [CrossRef]
- De Sanidad, M. BOE-A-2020-3953. «BOE» Núm. 78, de 21 de Marzo de 2020, Páginas 26505 a 26510 (6 Págs.). 2020. Available online: https://www.boe.es/diario_boe/txt.php?id=BOE-A-2020-3953 (accessed on 14 January 2021).
- Moreno Küstner, B. La información sanitaria se enreda en la informática. Gac. Sanit. 2011, 25, 343–344. [Google Scholar] [CrossRef]
- Gil-Suay, V. Los Sistemas de información sanitaria en el marco de un Sistema Nacional de Salud descentralizado. Arbor 2005, 180, 327–342. [Google Scholar] [CrossRef][Green Version]
- Kazemitabar, J.; Kazemitabar, J. Measuring the conformity of distributions to Benford’s law. Commun. Stat.-Theory Methods 2020, 49, 3530–3536. [Google Scholar] [CrossRef]
- Sambridge, M.; Tkalčić, H.; Jackson, A. Benford’s law in the natural sciences. Geophys. Res. Lett. 2010, 37. [Google Scholar] [CrossRef]
- Giles, D.E. Benford’s law and naturally occurring prices in certain ebaY auctions. Appl. Econ. Lett. 2007, 14, 157–161. [Google Scholar] [CrossRef]
- Nigrini, M.J. A taxpayer compliance application of Benford’s Law. J. Am. Tax. Assoc. 1996, 18, 72. Available online: https://www.proquest.com/scholarly-journals/taxpayer-compliance-application-benfords-law/docview/211023799/se-2?accountid=14777 (accessed on 22 January 2021).
- Goh, C. Applying visual analytics to fraud detection using Benford’s law. J. Corp. Account. Financ. 2020, 31, 202–208. [Google Scholar] [CrossRef]
- Lesperance, M.; Reed, W.J.; Stephens, M.A.; Tsao, C.; Wilton, B. Assessing Conformance with Benford’s Law: Goodness-of-Fit Tests and Simultaneous Confidence Intervals. PLoS ONE 2016, 11, e0151235. [Google Scholar] [CrossRef]
- Whyman, G.; Shulzinger, E.; Bormashenko, E. Intuitive considerations clarifying the origin and applicability of the Benford law. Results Phys. 2016, 6, 3–6. [Google Scholar] [CrossRef]
- DATADISTA. Coronavirus Disease 2019 (COVID-19) in Spain. 2020. Available online: https://dataverse.harvard.edu/dataset.xhtml?persistentId=doi:10.7910/DVN/GPFFAQ (accessed on 23 January 2021).
- Silva, L.; Figueiredo Filho, D. Using Benford’s law to assess the quality of COVID-19 register data in Brazil. J. Public Health 2021, 43, 107–110. [Google Scholar] [CrossRef]
- Roy, D.; Mukherjee, S.P. A Note on Characterisations of the Weibull Distribution. Sankhyā Indian J. Stat. Ser. A 1986, 48, 250–253. Available online: http://www.jstor.org/stable/25050594 (accessed on 27 January 2021).
- Vazquez, A. Exact solution of infection dynamics with gamma distribution of generation intervals. Phys. Rev. E 2021, 103, 42306. [Google Scholar] [CrossRef]
- Sevillano, E.; Linde, P. El Desbarajuste de las cifras del Coronavirus: Sanidad Rebaja en casi 2.000 las Muertes desde que Empezó la Pandemia; El País: Madrid, Spain, 2020. [Google Scholar]
Publisher’s Note: MDPI stays neutral with regard to jurisdictional claims in published maps and institutional affiliations. |
© 2021 by the authors. Licensee MDPI, Basel, Switzerland. This article is an open access article distributed under the terms and conditions of the Creative Commons Attribution (CC BY) license (https://creativecommons.org/licenses/by/4.0/).

