Article

Mathematical Model and Numerical Simulation Study of the Mining Area with Multiple Air Leakage Paths

1
School of Mining Engineering, North China University of Science and Technology, Tangshan 063000, China
2
Hebei Province Key Laboratory of Mine Development and Safety Technology, Tangshan 063000, China
*
Author to whom correspondence should be addressed.
Mathematics 2022, 10(14), 2484; https://doi.org/10.3390/math10142484
Submission received: 19 May 2022 / Revised: 20 June 2022 / Accepted: 12 July 2022 / Published: 16 July 2022
(This article belongs to the Special Issue Engineering Calculation and Data Modeling)

Abstract

:
The natural fire in the mining area is the main source of mine fires, and the distribution of spontaneous combustion “three zones” is a key issue in mine fire prevention and suppression. In order to study the change law of spontaneous combustion “three zones” in the mining area with multiple air leakage paths, a segmented numerical simulation method is proposed. In order to consider the common influence of various factors, we firstly establish the coupled model of oxygen consumption rate of coal relics, the regional fluidity model of the porous medium and the three-dimensional distribution model of void rate in the mining area. Then, based on this, the corresponding conditions of air leakage speed, air leakage location and oxygen concentration are set in each stage of numerical simulation. The mathematical model shows that: the oxygen consumption rate of coal shows an approximate exponential growth trend with the increase in temperature, which is proportional to the original oxygen concentration; the void rate of the mining area shows a logarithmic distribution with a tendency of “double hump” proportional coupling. The numerical simulation results show that: the width of the “oxidation zone” decreases gradually along the tendency when there is only air leakage from the working face; the smaller airflow and lower oxygen concentration in the overlying mining area will increase the width of the “oxidation zone” in the coverage area; air leakage from the shelf road will form an “oxidation zone” near the entrance of the shelf road. The leakage of air from the shelf road will form an “oxidized zone” near the entrance of the shelf road; the leakage of air from the adjacent mining area will increase the width of the overall “dispersal zone” and “oxidized zone” due to the larger air flow and higher oxygen concentration. The comparison with the monitoring data of the downhole bundle tube verifies the rationality of the mathematical model and the accuracy of the numerical simulation results.

1. Introduction

The percentage of mines with natural fires in China’s current production mines is as high as 56%, with natural fires in the mining area accounting for 70% of the total [1,2,3]. The fires in the mining area originate from the spontaneous oxidative combustion of the relict coal, and the oxygen consumption rate is an important index to evaluate the degree of coal oxidation. The oxygen consumption rate of relic coal is influenced by various factors such as temperature, oxygen concentration, and air supply [4,5,6]. An et al. [7] calculated the characteristic temperature at each stage of the oxidation process by fitting the oxygen concentration curve in segments. Xue et al. [8] investigated the effect of different particle sizes on coal oxidation rate and found that the larger the particle size, the higher the oxygen consumption rate. Zhang [9] found that the oxygen consumption rate of relic coal varies with temperature in accordance with the Gaussian function. Spontaneous combustion in the mining area is the coupled effect of air seepage, oxygen diffusion and heat transfer. The study of the flow field in the mining area can provide a theoretical basis for the prediction of the “three zones” of spontaneous combustion in the mining area. Zhang [10] established a mathematical model of the flow field and oxygen concentration field in dynamic coordinates to study the effect of coal relic thickness on the oxygen concentration field. Yang [11] solved the flow field in the mining area based on the law of conservation of energy and mass and derived the dynamic propagation law of the gas source term. The void ratio is an important parameter affecting the simulation of the flow field and oxygen concentration field in the quarry area. There are a large number of voids in the porous media area composed of coal relics and collapsed rocks, and the gases in the quarry area circulate among the voids. In the middle and rear part of the mining area, the coal relics and rocks are mixed, and the voids are small, which provides favorable conditions for the spontaneous combustion of coal relics and gas accumulation and is the key research area of the “three zones” of spontaneous combustion in the mining area. Du [12] established a void rate evolution model with the coefficient of fragmentation and expansion of collapsed rock in the mining area to study the leakage flow field in the mining area. Xu et al. [13] established the void rate distribution model and three-dimensional permeability model based on the “O” circle theory to study gas transport in the mining area. Wang [14] studied the permeability evolution of overburdened rocks in coal seams with different mining thicknesses and found that the effect of increasing mining thickness on the permeability of rock seams decreases farther away from the coal seam. Liu et al. [15] studied concrete mechanics and damage behavior and established a concrete construction damage intrinsic model to describe the mechanical effects of concrete uniaxially compressed construction. Li et al. [16] conducted a numerical simulation study on the stress changes on the fault surface in different mining advance directions, and the results showed that the shear stress changes drastically when mining advances from the upper plate and advances from the lower plate are unfavorable to the risk of sudden water. Most coal mines in China have entered the deep part [17], causing the deep mining void area to form multiple wind leakage pathways with the original mining void area, increasing the possibility of natural fire [18]. The multi-leakage air mining area is different from one source and one sink, and the legacy coal oxidation, flow field and oxygen concentration field are more complex. Wan et al. [19] set up a “multi-source and multi-sink” leakage flow field for four leakage lines in the mining area for simulation. Zhao et al. [20] analyzed the difference in bubble fall structure at different stages by simulating the wind flow field and oxygen concentration field in the mining area. Wang [21] found that the coal seam inclination mainly influenced the distribution of void ratio in the mining area and thus the distribution of the “three zones” of spontaneous combustion. Shen et al. [22] studied the distribution law of spontaneous combustion “three zones” in the mining area under different wind speeds.
In order to study the change law of “three zones” of spontaneous combustion in the complex mining area with multiple air leakage paths, the method of establishing an oxygen concentration field model, mining area flow field model and three-dimensional distribution model of void rate is proposed, and the multiple mathematical models interact with each other through UDF compilation in the numerical simulation. The oxygen concentration field model was verified by studying the oxygen consumption rate at different temperatures and different oxygen concentrations in the coal body. According to the three-dimensional distribution model of void rate, the change in the three-dimensional distribution of void rate in the mining area during the advancing of the working face is calculated. In addition, according to the advancing situation of the working face and the relationship with the adjacent void area, the segmented numerical simulation method is creatively proposed, setting a different air leakage area, air leakage speed and oxygen content in each stage, and the distribution law of spontaneous combustion “three zones” in the void area under different conditions is obtained through segmented numerical simulation. This method is also applicable to the determination of the spontaneous combustion “three zones” in the mining area under different wind leakage conditions such as buried pipe extraction, high drilling extraction, etc., providing a theoretical basis for mine fire prevention work. Finally, the accuracy of the numerical simulation results was verified by the field monitoring results.

2. Oxygen Concentration Field Model in the Mining Area

Because the chemical reaction between the coal body and oxygen in the mining area leads to the consumption of oxygen, and the interior of the mining area is a porous media area composed of loose coal body and broken rock, the internal pores are not uniformly distributed in the mining area [23]. Therefore, the oxygen concentration field model of the mining area should be established when a numerical simulation of oxygen concentration distribution and gas flow in the mining area is performed.

2.1. Programmed Warming Experiment and Result Analysis

The experimental coal samples were put into sealed bags and sent to the laboratory. The raw coal samples were ground, crushed and sieved to make samples as required. The physical and chemical parameters of the coal samples are shown in Table 1.
A programmed warming experiment was conducted on the coal samples, and the device included a programmed warming–gas chromatography system, as shown in Figure 1. A 60~80 mesh coal sample of 60 g was put into the coal sample tank. The air generator and flow meter were connected to the bottom of the coal sample jar to provide a continuous and stable oxygen supply for the coal sample, and the air flow rate was 100 mL/min. The programmed heating oven set the programmed heating rate from room temperature to 30 °C for 10 min, and the constant temperature was maintained at 30 °C for 20 min, and then increased to 240 °C at a rate of 0.6 °C/min. The temperature probe monitors the coal sample and the gas temperature in the jar in real time. The gas samples were collected at 10 °C intervals, and the collected gas samples were connected to the gas chromatograph for the analysis of O2, N2, CO, CO2, CH4, C2H6, C2H4 and so on; finally, the data were exported through a computer. The changes in temperature, outlet oxygen concentration and generated gas concentration in the process of coal warming were recorded, and the coupled model of oxygen consumption rate of relic coal under different temperature and oxygen concentration conditions was established based on the experimental data to calculate the oxygen consumption rate in the process of coal warming.
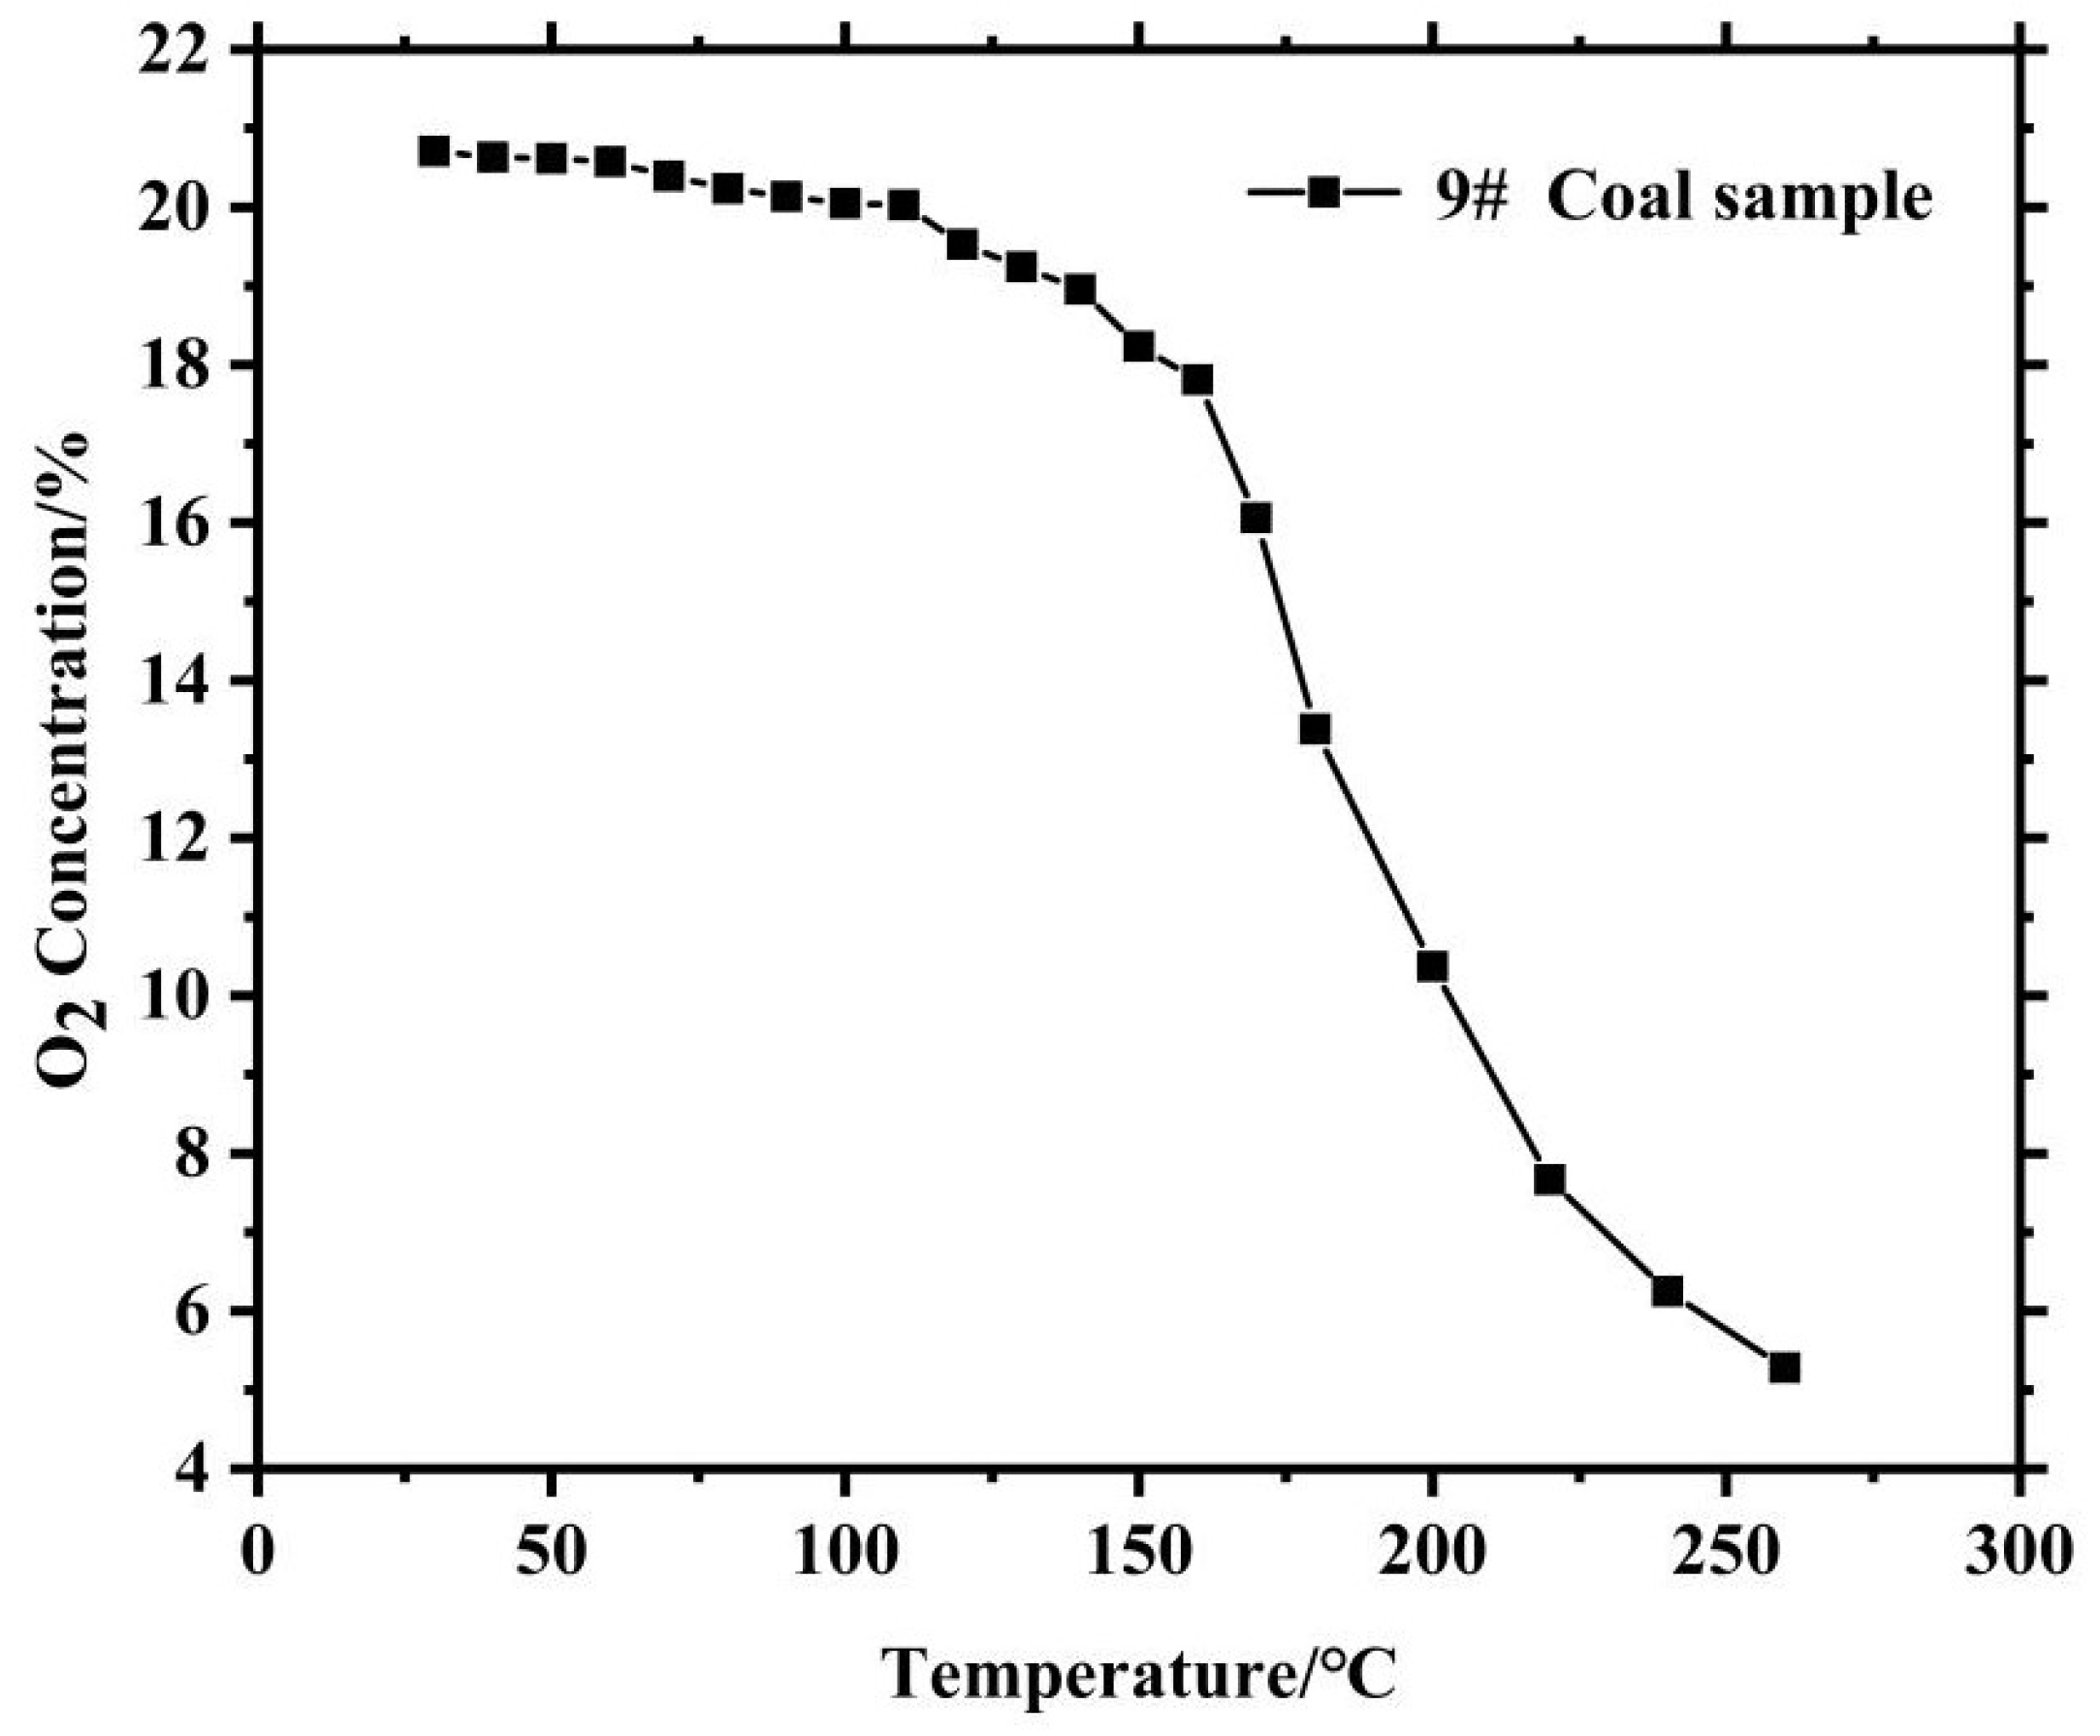
The collected gases were collected and analyzed using a gas chromatograph. The experimentally measured oxygen concentration data with temperature are shown in Figure 2.
From the above graph, it can be seen that the oxygen concentration shows a decreasing trend with the increase in temperature, which indicates that there has been oxygen consumption of the coal sample during the warming process. At the early stage of warming and oxidation, the oxidation reaction was not strong, and the oxygen concentration did not change significantly; after 160 °C, the oxidation reaction gradually accelerated, and the oxygen concentration decreased sharply.

2.2. Coupled Model of Oxygen Consumption Rate of Coal Relics

The oxidation reaction of the crushed coal body is affected by various factors such as temperature, gas flow, oxygen concentration and diffusion of oxygen molecules [24]. In this experiment, the temperature of the coal body in the sample tank is considered uniform due to the slow heating rate, the diameter of the sample tank chosen for the experiment is small and the location of the air inlet is laid with cotton resulting in a reduced airflow velocity, so it is considered that the gas flows in the tank all along the axial direction of the coal sample as a one-dimensional flow. The standard oxygen consumption rate equation is shown in Equation (1).
V 0 ( T ) = Q C O 2 0 S L ln C O 2 1 C O 2 2
Equation:
  • V 0 ( T ) —Standard oxygen consumption rate, mol/(cm3/s);
  • Q —Gas flow rate, cm3/min;
  • C O 2 0 —Fresh air flow oxygen concentration, 9.375 mol/m3;
  • S —Cross-sectional area of the coal sample tank, cm2;
  • L —Height of the coal sample in the coal sample tank, cm;
  • C O 2 1 , C O 2 2 —Are the inlet and outlet oxygen concentrations of the coal sample tank, respectively, mol/m3.
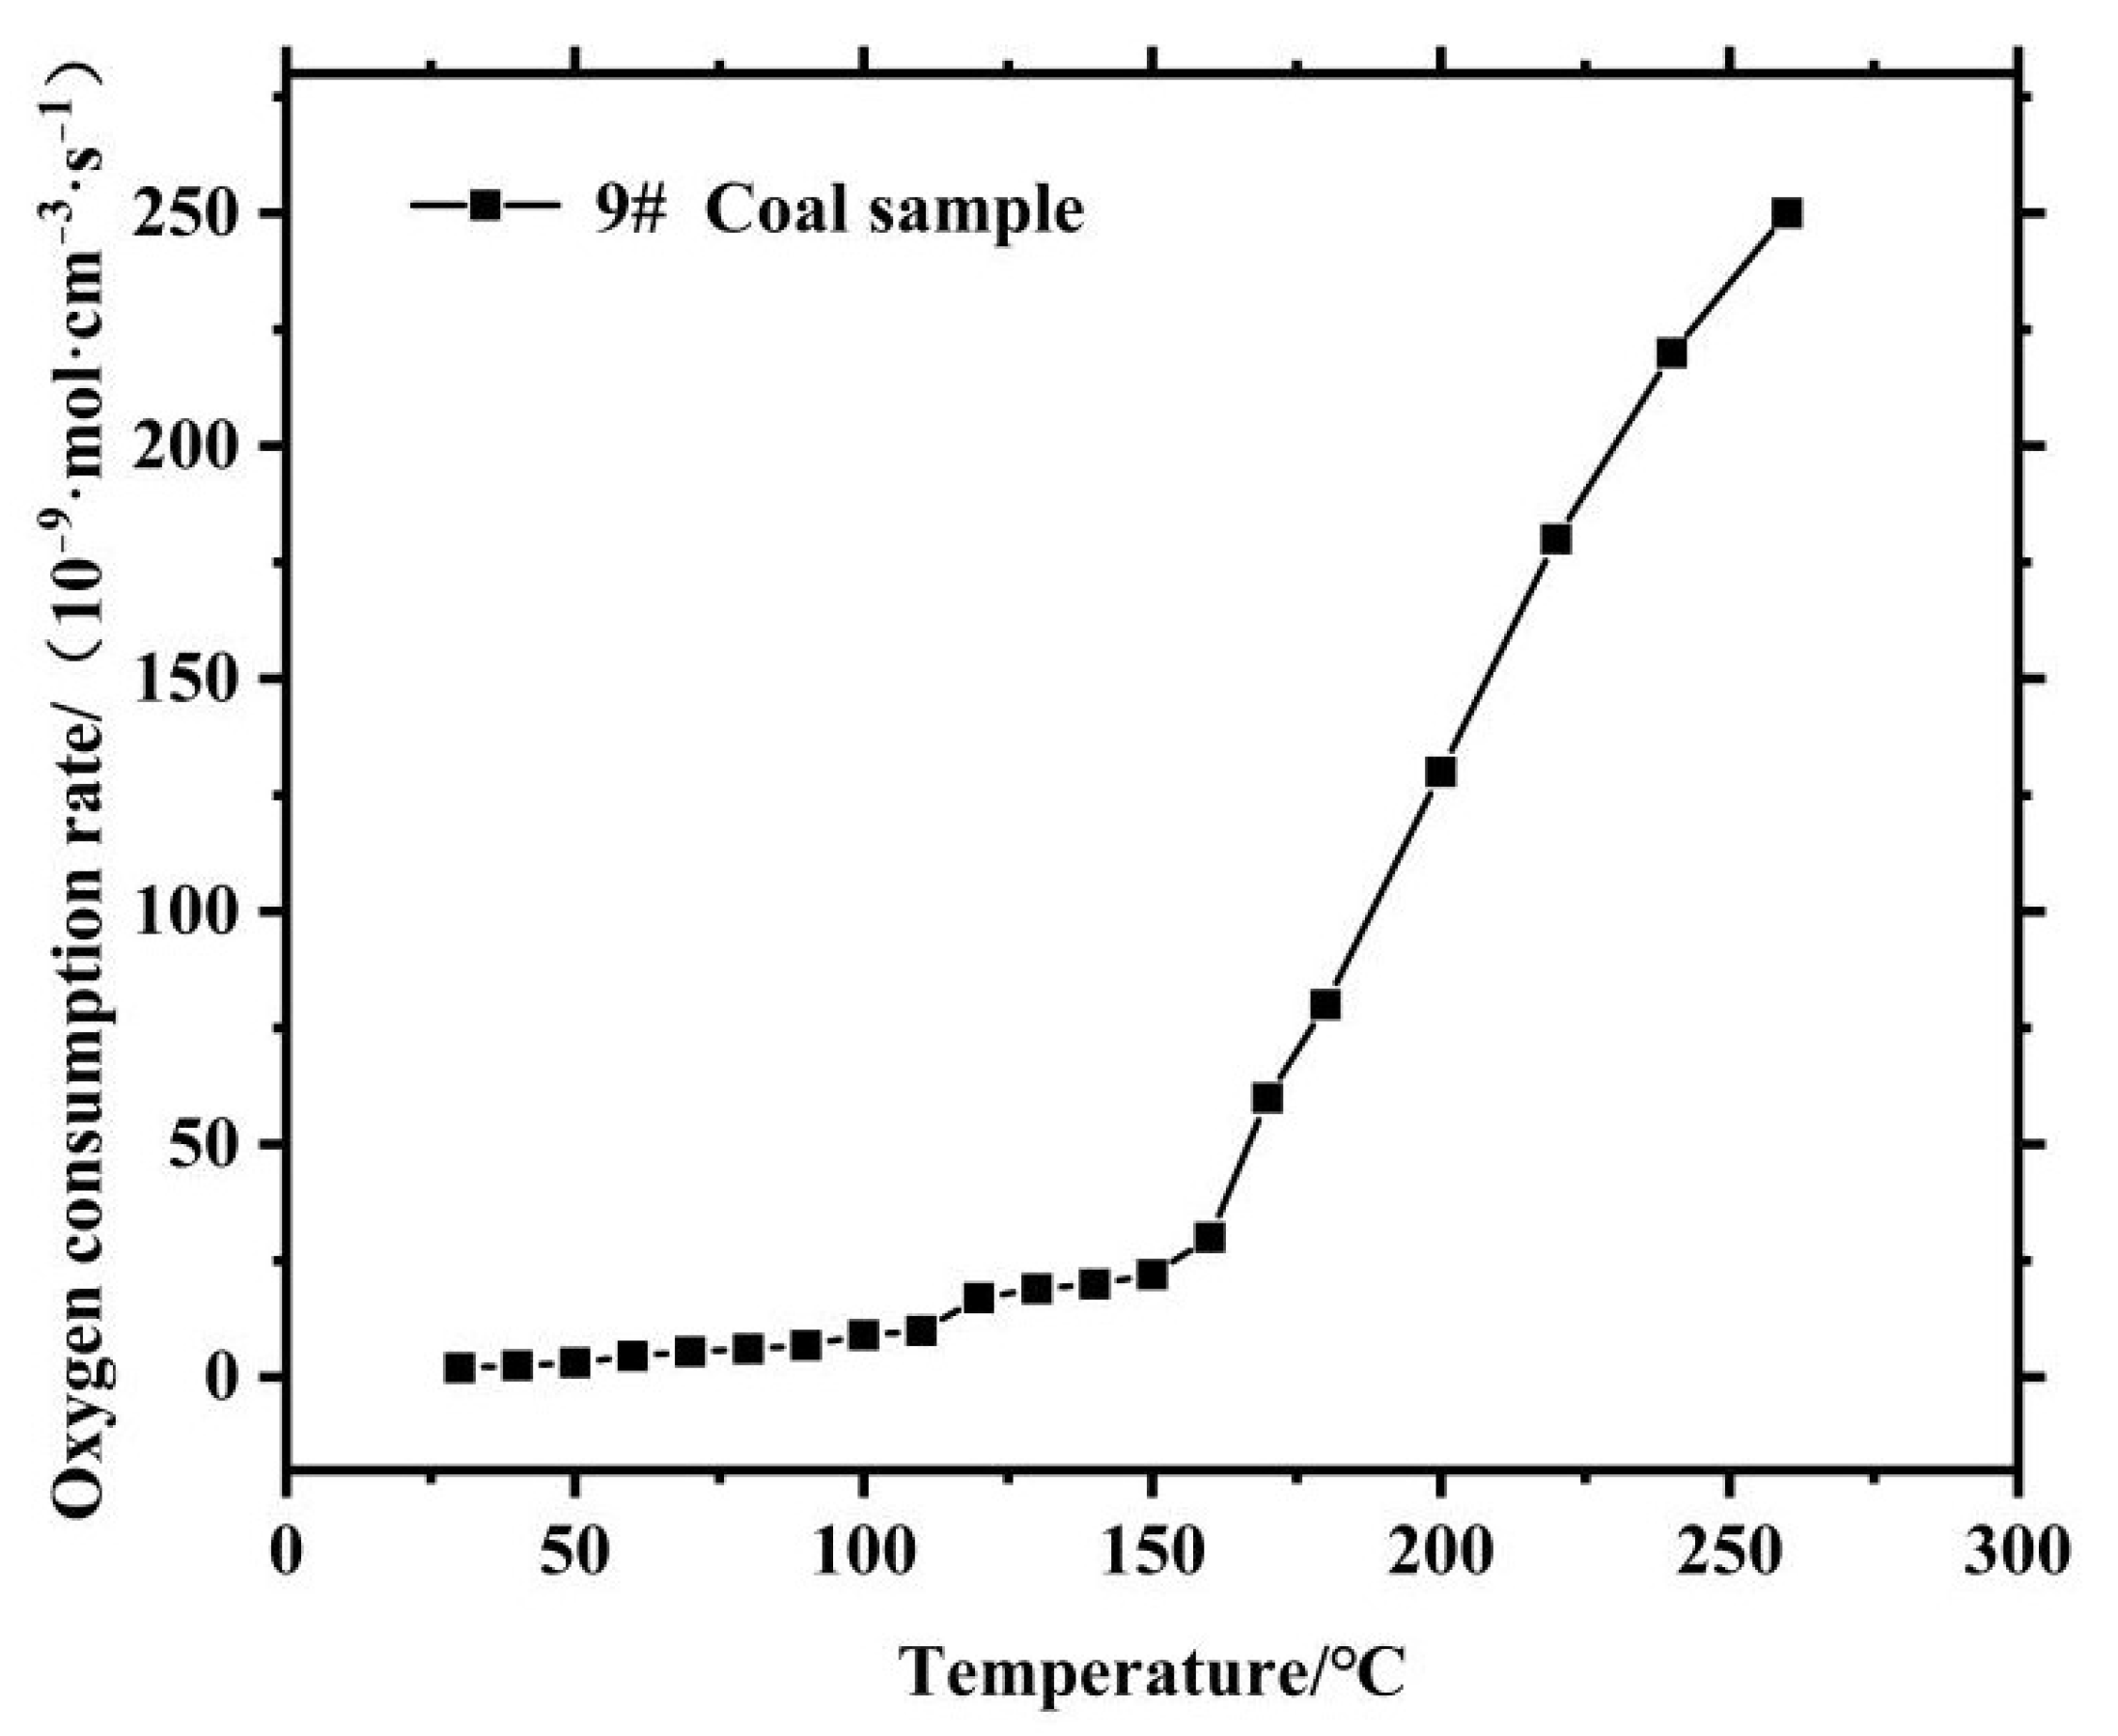
Equation (1) reflects the oxygen consumption per unit volume of coal sample in the fresh air flow per unit time. The oxygen consumption rate of the coal sample at different temperatures can be calculated according to the standard oxygen consumption rate equation, as shown in Figure 3.
From the above figure, it can be seen that the standard oxygen consumption rate of the coal body has a certain function relationship with temperature. Before 160 °C, the oxygen consumption rate of coal relics is low and increases slowly with the increase of temperature; after 160 °C, the oxygen consumption rate increases rapidly. With the increase in temperature, the standard oxygen consumption rate of coal samples increased approximately exponentially.
The rate of oxygen consumption is proportional to the oxygen mass fraction, as shown in Equation (2).
V ( T ) = C C 0 V 0 ( T )
Equation:
  • C 0 —Fresh air flow oxygen mass fraction, 23%.
Equation (2) reflects the relationship between the oxygen consumption rate of the legacy coal and the initial oxygen concentration; the higher the initial oxygen concentration, the greater the oxygen consumption rate of the coal body. Combining Equations (1) and (2), the oxygen consumption rate of the legacy coal can be calculated under different temperature and original oxygen concentration conditions.

3. Mathematical Model of the Flow Field in the Mining Area

The leakage wind flow is considered to flow in porous media, = according to Darcy’s law. Hence, the flow rate of fluid through the porous media region and the permeability of porous media, pressure distribution and seepage cross-section are related to fluid viscosity. The fluid flow rate in the porous media region is shown in Equation (3).
Q = k A d P μ d x
where:
  • Q —Flow rate of fluid through the porous media area, m3/s;
  • k —Permeability of porous media, %;
  • A —Area of porous media overflow cross-section, m2;
  • μ —Aerodynamic viscosity coefficient, Pa·s;
  • d P / d x —Porous media pressure gradient, Pa/m.
The interior of the mining area is a porous media region consisting of loose media and broken rocks with a chaotic internal pore structure [25], but for the convenience of the calculation, it is assumed that the wind flow in the seepage area has a constant density when passing through the pores of the coal body. The controlling equation is shown in Equation (4).
Q x ¯ x + Q y ¯ y + Q z ¯ z = 0
where:
  • x , y , z —Distance in each direction of the coordinate axis, m;
  • Q x ¯ , Q y ¯ , Q z ¯ —Are the air leakage intensity in x , y and z direction components, m3/(m2·s), respectively.
As the void in the fissure zone of the mining area and the wind flow are slow, the gas flow in the fissure zone is regarded as laminar flow, and Darcy’s law can be applied. The formula is shown in Equation (5).
{ Q x ¯ = K x H x Q y ¯ = K y H y Q z ¯ = K z H z
where:
  • H —Pressure measuring head, m;
  • Q x ¯ , Q y ¯ , Q z ¯ —Are the air leakage intensity in x , y and z direction components, m3/(m2·s), respectively.
For a point within the extraction zone, the gas has the same permeability capacity in the x , y and z directions, and the permeability coefficient is related to the spatial coordinates, so K = K x = K y = K z , the controlling equation for the permeability coefficient can be obtained as shown in Equation (6).
x ( K H x ) + y ( K H y ) + z ( K H z ) = 0
By establishing a mathematical model of the flow field in the mining area, the fluid flow in the porous media area in the mining area is simplified, and the conditions of inertial resistance, viscous resistance and permeability in the porous media area in the bubble fall zone and fracture zone in the mining area are restricted using UDF compilation, respectively, to provide data support for the numerical simulation of the mining area.

4. Three-Dimensional Distribution Model of Void Ratio in the Mining Area

The inner part of the mining area is a porous medium, and its void rate changes continuously with the advancement of the working face. Setting the void rate of the mining area as a function related to the spatial location of the mining area is beneficial to the calculation of numerical simulation, and the actual situation of this coal seam is combined with the calculation of the three-dimensional distribution law of the void rate of the mining area and the overlying rock layer.
The void ratio of the fractured rock is shown in Equation (7).
ϕ = 1 1 K p
where:
  • ϕ —Validity of fractured rock mass, %;
  • K p —Fracture expansion coefficient of broken rock mass.
The coefficient of fragmentation and expansion of the broken rock is shown in Equations (8) and (9).
K p = h d + H w b ( y = 0 ) h d
w b ( y = 0 ) = [ H h d ( K pb 1 ) ] ( 1 e x 2 I )
where:
  • h d —Direct top thickness, m;
  • H —Mining height or extraction and release height, m;
  • K pb —Residual fragmentation and swelling coefficient of the directly top broken rock mass;
  • I —Length of the basic top breaking rock body, m;
  • x —The distance towards the upper offset of the x-axis origin, m
According to the theory of the “O” circle and the field measurement, in the working face tendency, the void rate in the mining area near the end of the upper and lower lane is larger than that in the middle of the mining area. The variation coefficient of void rate on the inclination of the working face deviating from the origin of the y-axis is shown in Equation (10).
ϕ G , y = 1 + e 0.15 ( L y 2 | y | )
where:
  • L y —Tendency distance of mining area, m;
  • y —Distance from the origin of the y-axis on the tendency offset, m.
According to the polynomial regression equation of the variation law of fractured rock with axial stress is shown in Equation (11).
ϕ γ = β 3 σ 3 + β 2 σ 2 + β 1 σ + β 0
where:
  • ϕ γ —Void ratio of loose media subjected to axial stress, %;
  • σ —Relative axial stress, MPa;
  • β i —Regression coefficient;
  • β 0 —Vacancy of crushed rock before axial stress, %.
The coal seam or working face inclination is generally small, coupled with the influence of loose rock pores, the compressive stress caused by the self-weight of the rock is often small in general, so the secondary and tertiary terms in Equation can be ignored. Compressive stresses in arbitrary cross-sections at inclination is shown in Equation (12).
σ = ( 1 ϕ G ) γ ( L y 2 y ) sin α σ 0
where:
  • γ —Capacity weight of rock fall, N/m3, generally 2 × 10⁴~3 × 10⁴ N/m3;
  • σ 0 —1 MPa.
From the above equation, we can obtain the void rate of rock falling from the extraction area considering the influence of gravity, as shown in Equation (13).
ϕ G ( x , y ) = 1 + [ 1 + e 0.15 ( L y 2 | y | ) ] { 1 h d h d + H [ H h d ( K pb 1 ) ] ( 1 e x 2 I ) } 1 1 + σ 0 1 β 1 γ ( L y 2 y ) sin α
where:
  • β 1 —−0.0488 when the rock fall is shale, −0.025 when the rock fall is mudstone, −0.0254 when the rock fall is sandstone;
  • α —Coal seam dip angle.
Finally, we get the void ratio of the mining area of this working face, as shown in Equation (14).
ϕ = ( 1 + e 0.15 ( 71 | y | ) ) { 1 6 9.6 3.528 ( 1 e x 71 ) }
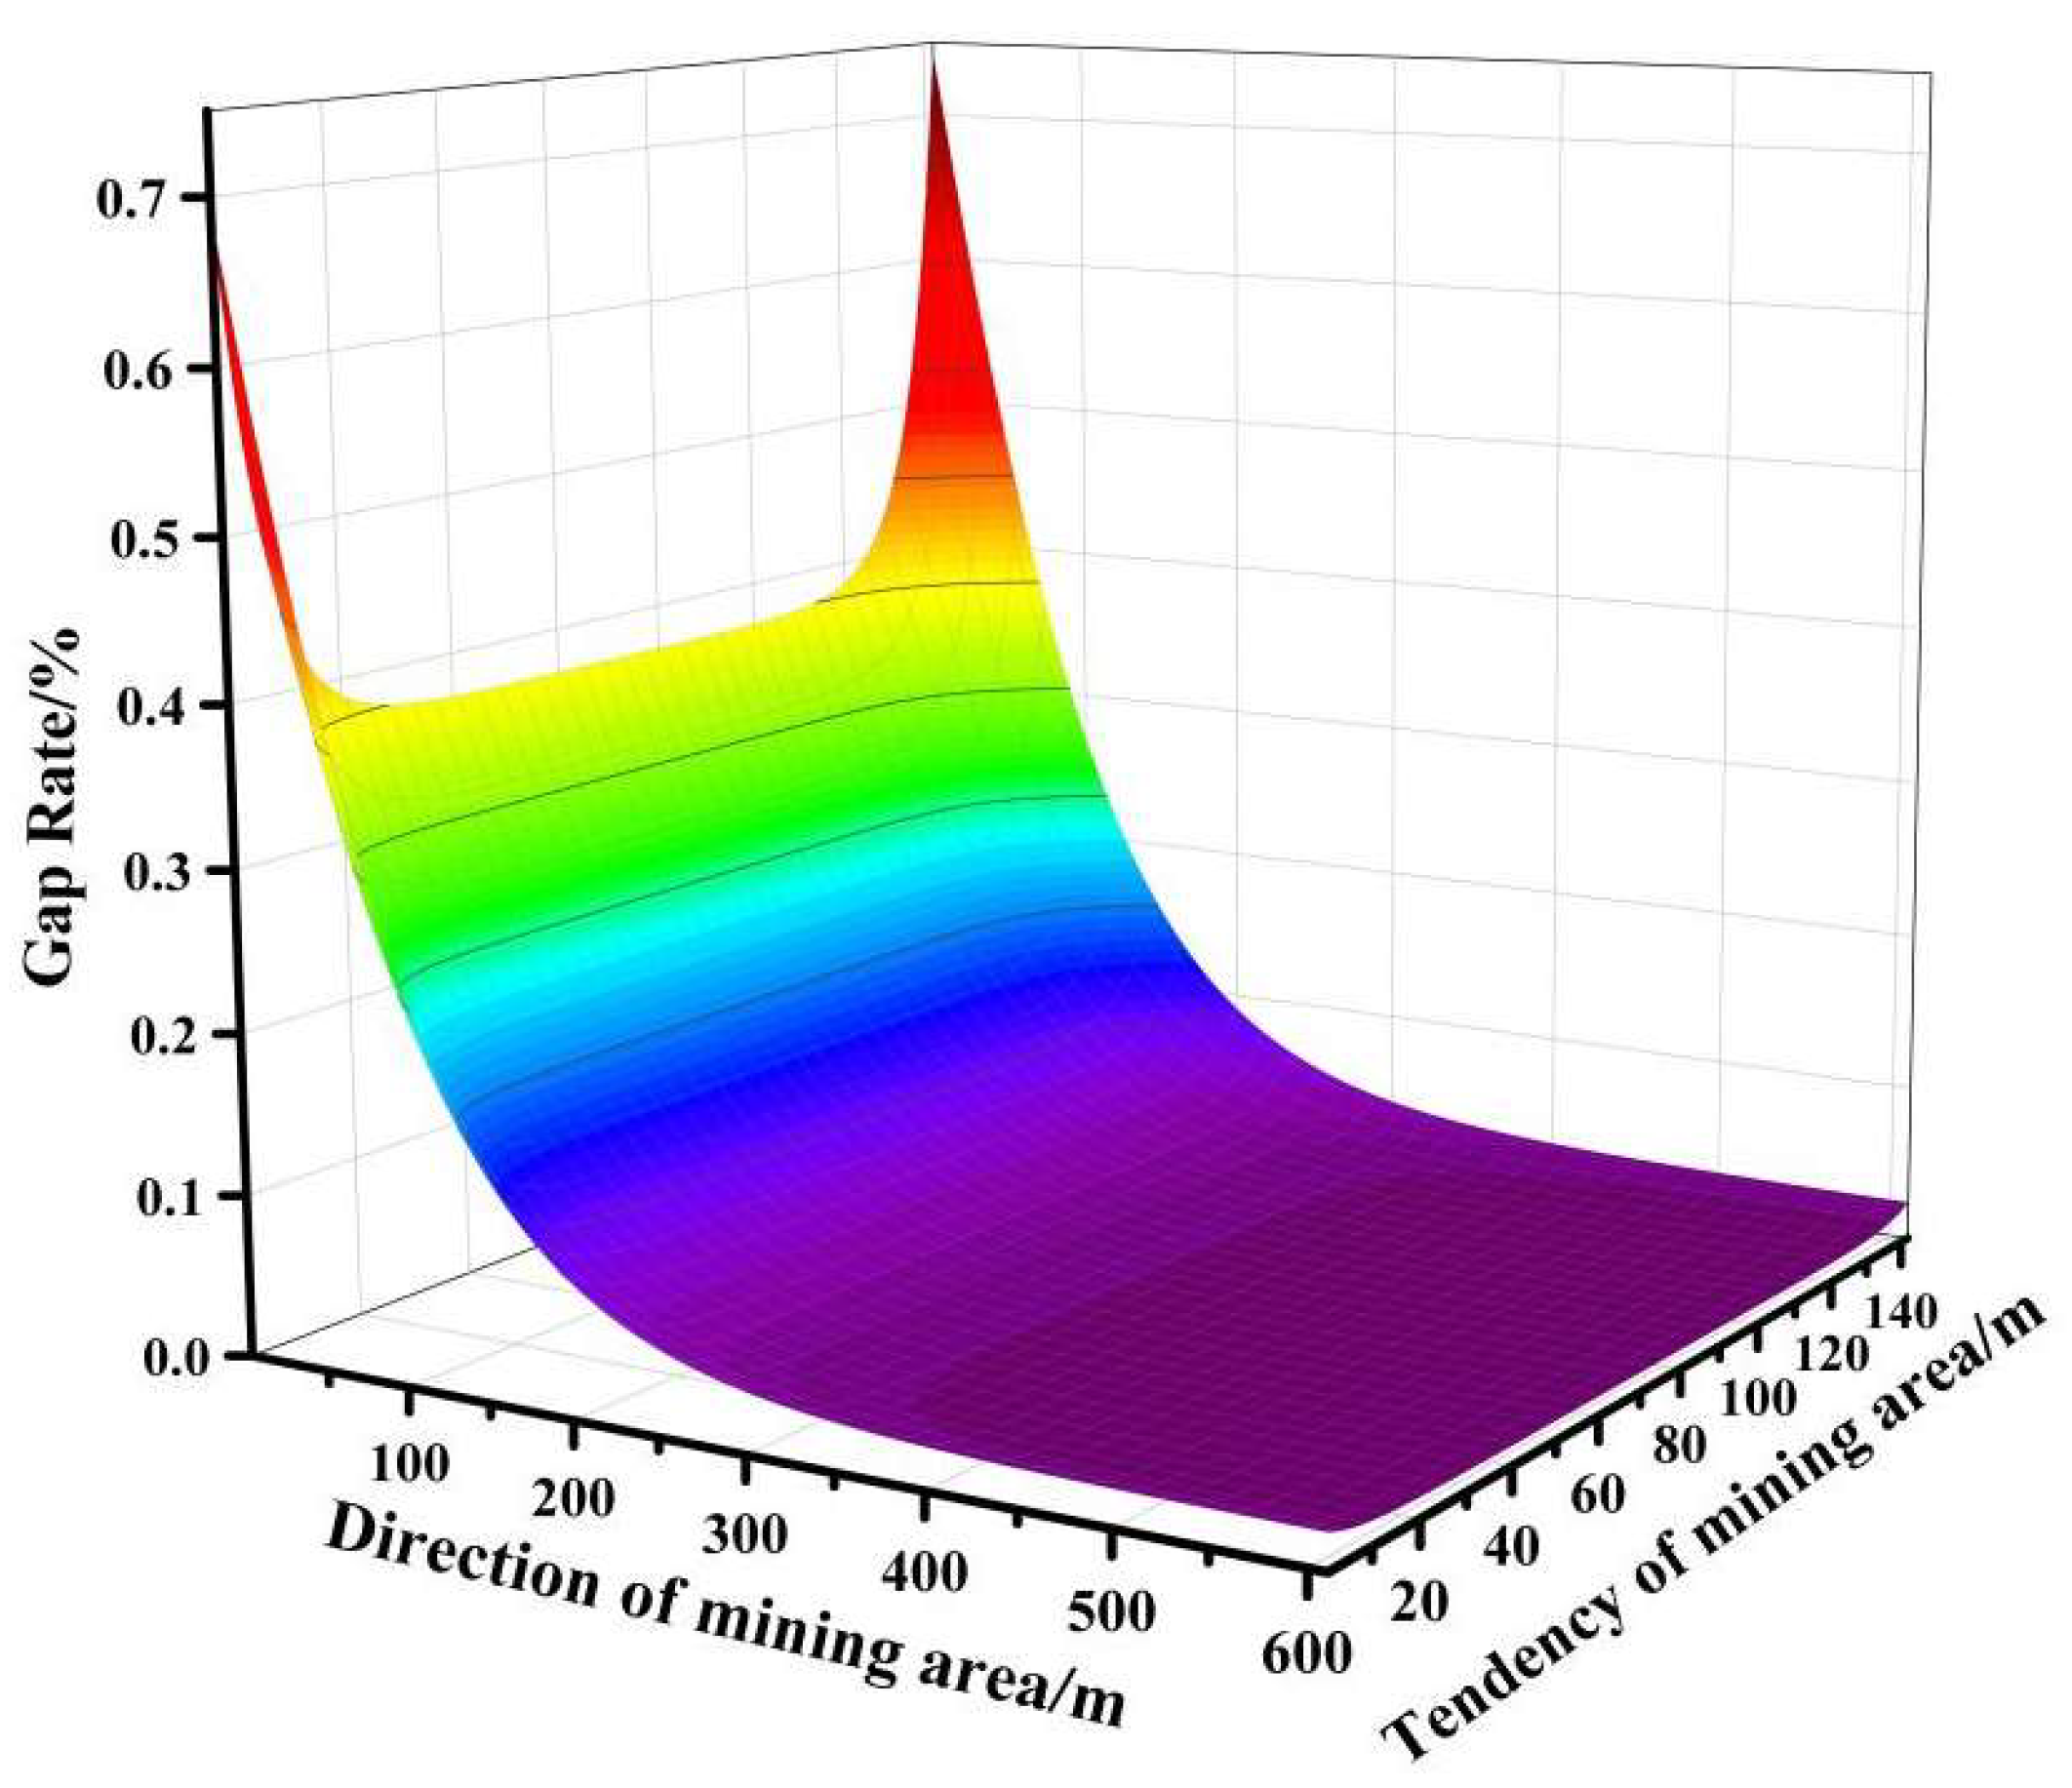
The calculation of Equation (16) can be derived from the distribution of the void rate in the mining area after the working face is advanced 610 m, as shown in Figure 4.
From the above figure, we can see that the void rate in the xy plane distribution of the mining area is a “bathtub”; along the direction of the void rate, it is approximately a logarithmic form of reduction; the direction of the 0~200 m from the work surface void rate is rapidly reduced after the distance from the work surface is greater than 200 m, and the void rate change is not obvious. The tendency presents a “double peak hump” proportional coupling form change, the area near the two lanes is a “convex peak”, the void rate is large, the area near the middle of the mining area is a “concave peak”, and the void rate is smaller. The void rate over the two lanes from 0~20 m in the tendency direction changes obviously, and the void rate in the middle area, which is more than 20 m from the two lanes in the tendency direction, has almost no change. This is because the area near the two lanes and the working face has a large coefficient of rock fragmentation and expansion and is subject to a larger sinking obstruction force. The rock body is far away from the two lanes, and the working face keeps the sinking inertia due to the existence of off-layer voids and is gradually compacted as the working face advances. In this way, due to the uncoordinated sinking speed and sinking amount of each part of the rock, the void rate of the mining area shows such a distribution. The above three-dimensional distribution law of the void rate in the mining area can reflect the spatial characteristics of gas transport and air leakage and oxygen supply in the working face of the mining area and provide important parameters for the prevention and control of spontaneous coal combustion.

5. Numerical Simulation

5.1. Overview of the Mine

A mine 0291 comprehensive release working face is located in the south five mining area, the working face is 8, 9 coal seam split area, coal seam thickness 8.6~11.7 m and average thickness of 10.5 m. The coal seam dip angle is gentle, and mining conditions are good. The working face is ventilated by full wind pressure, the air distribution capacity is 1800 m3/min, the inclined length of the working face is 142 m, the recoverable strike length is 610 m, the mining height is 3.0 m, the extraction and release ratio is 1:2.5, the recovery rate of the working face is 93%, the roadway cross-section area is 14 m2 and the absolute gas gushing volume of the working face is about 20 m3/min.
The workings have a number of adjacent and overlying mining areas, with 9280 slant shaft and 4070C roadway in the north of the workings, 0291 exploration cave in the south, 0250 and 0251 overlying five coal seams, 0290 mined workings in the west and 9173 exploration cave and 0043 return roadway in the east, with complex forms of wind leakage.

5.2. Physical Model and Boundary Condition Setting of the Mining Area

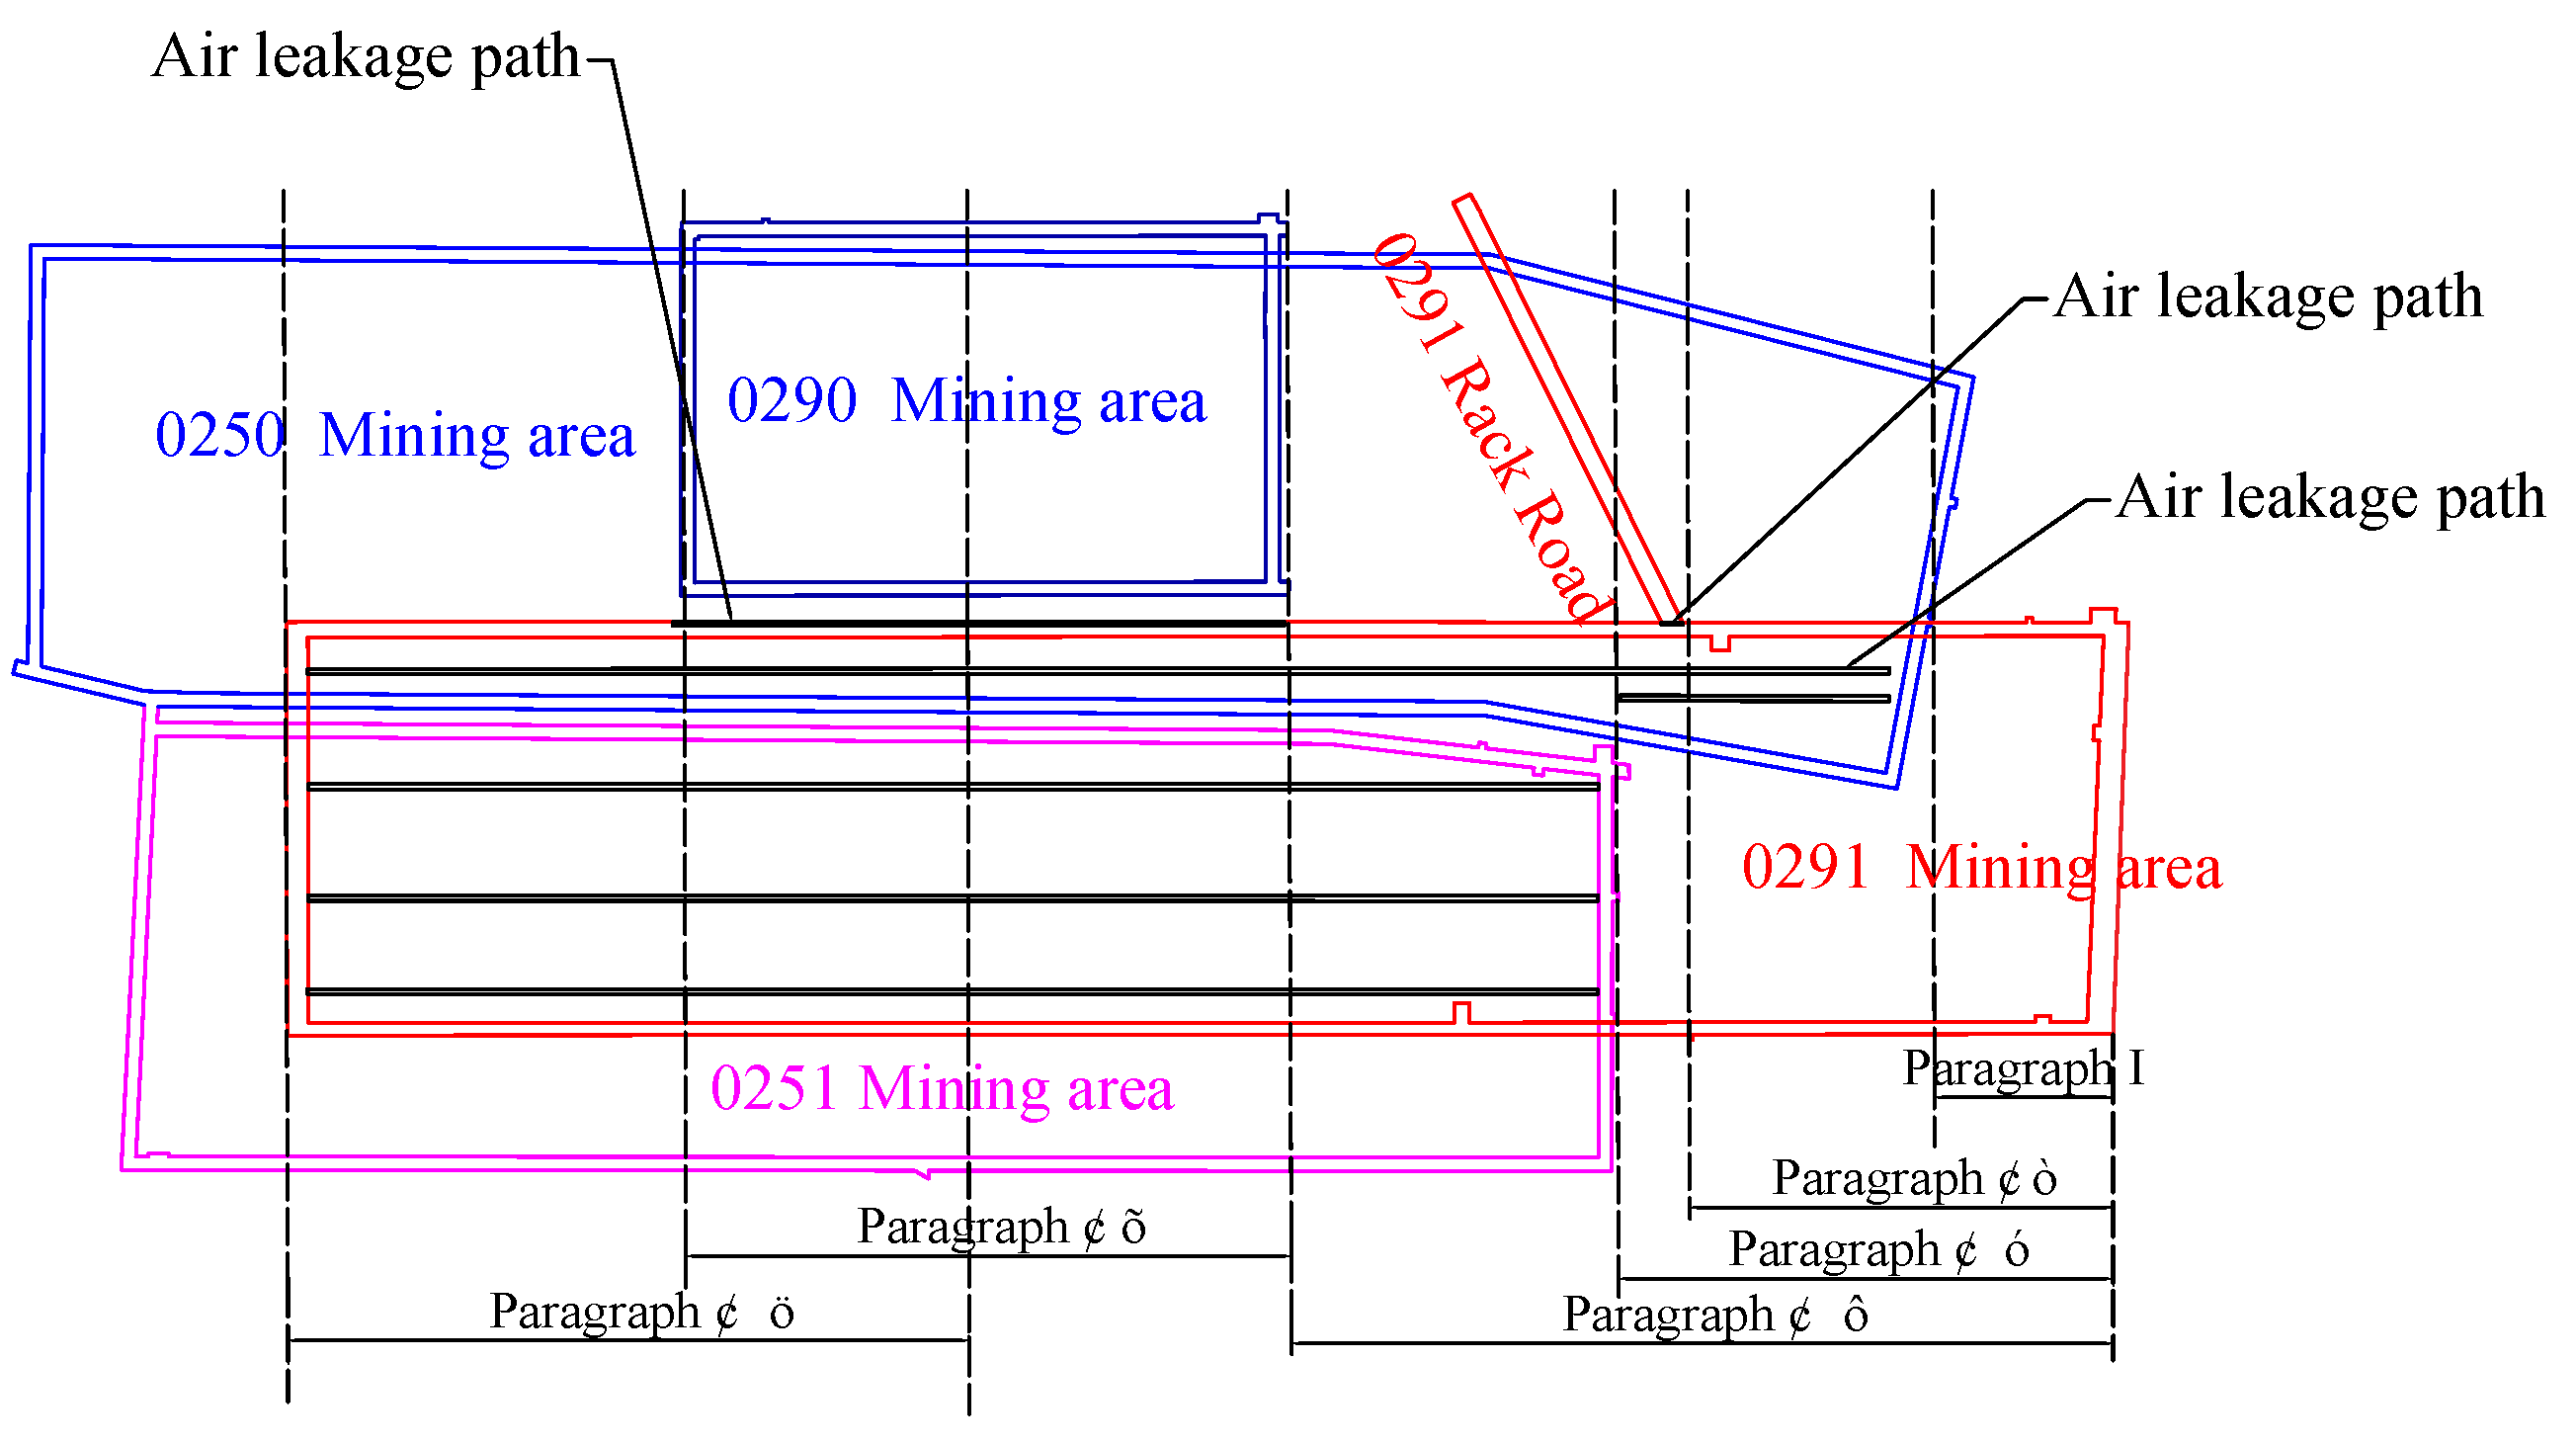
As a mine 0291 workings face a complex environment in the near mining area, with the initial mining position of nine coal seams as the starting point, the overlying 0250 mining area in a 0291 mining area, the strike coverage area is 76~610 m, the tendency coverage area is 100~142 m. The 0291 shelf road is located towards the workings towards 132~137 m; the overlying 0251 mining area strike coverage area is 165~610 m, the tendency coverage area of 0~95 m; the adjacent 0250 mining area on the return wind side tendency coverage area is 280~490 m. Under the influence of mining, the top plate fissures will connect with the overlying and adjacent mining areas to form fissures, and these fissures will form wind leakage paths because of the pressure difference between mining areas. In order to more accurately study the impact of wind leakage from the adjacent mining area on the spontaneous combustion “three zones” in the 0291 mining area, segmentation simulation is proposed. The segmentation situation is shown in Figure 5.
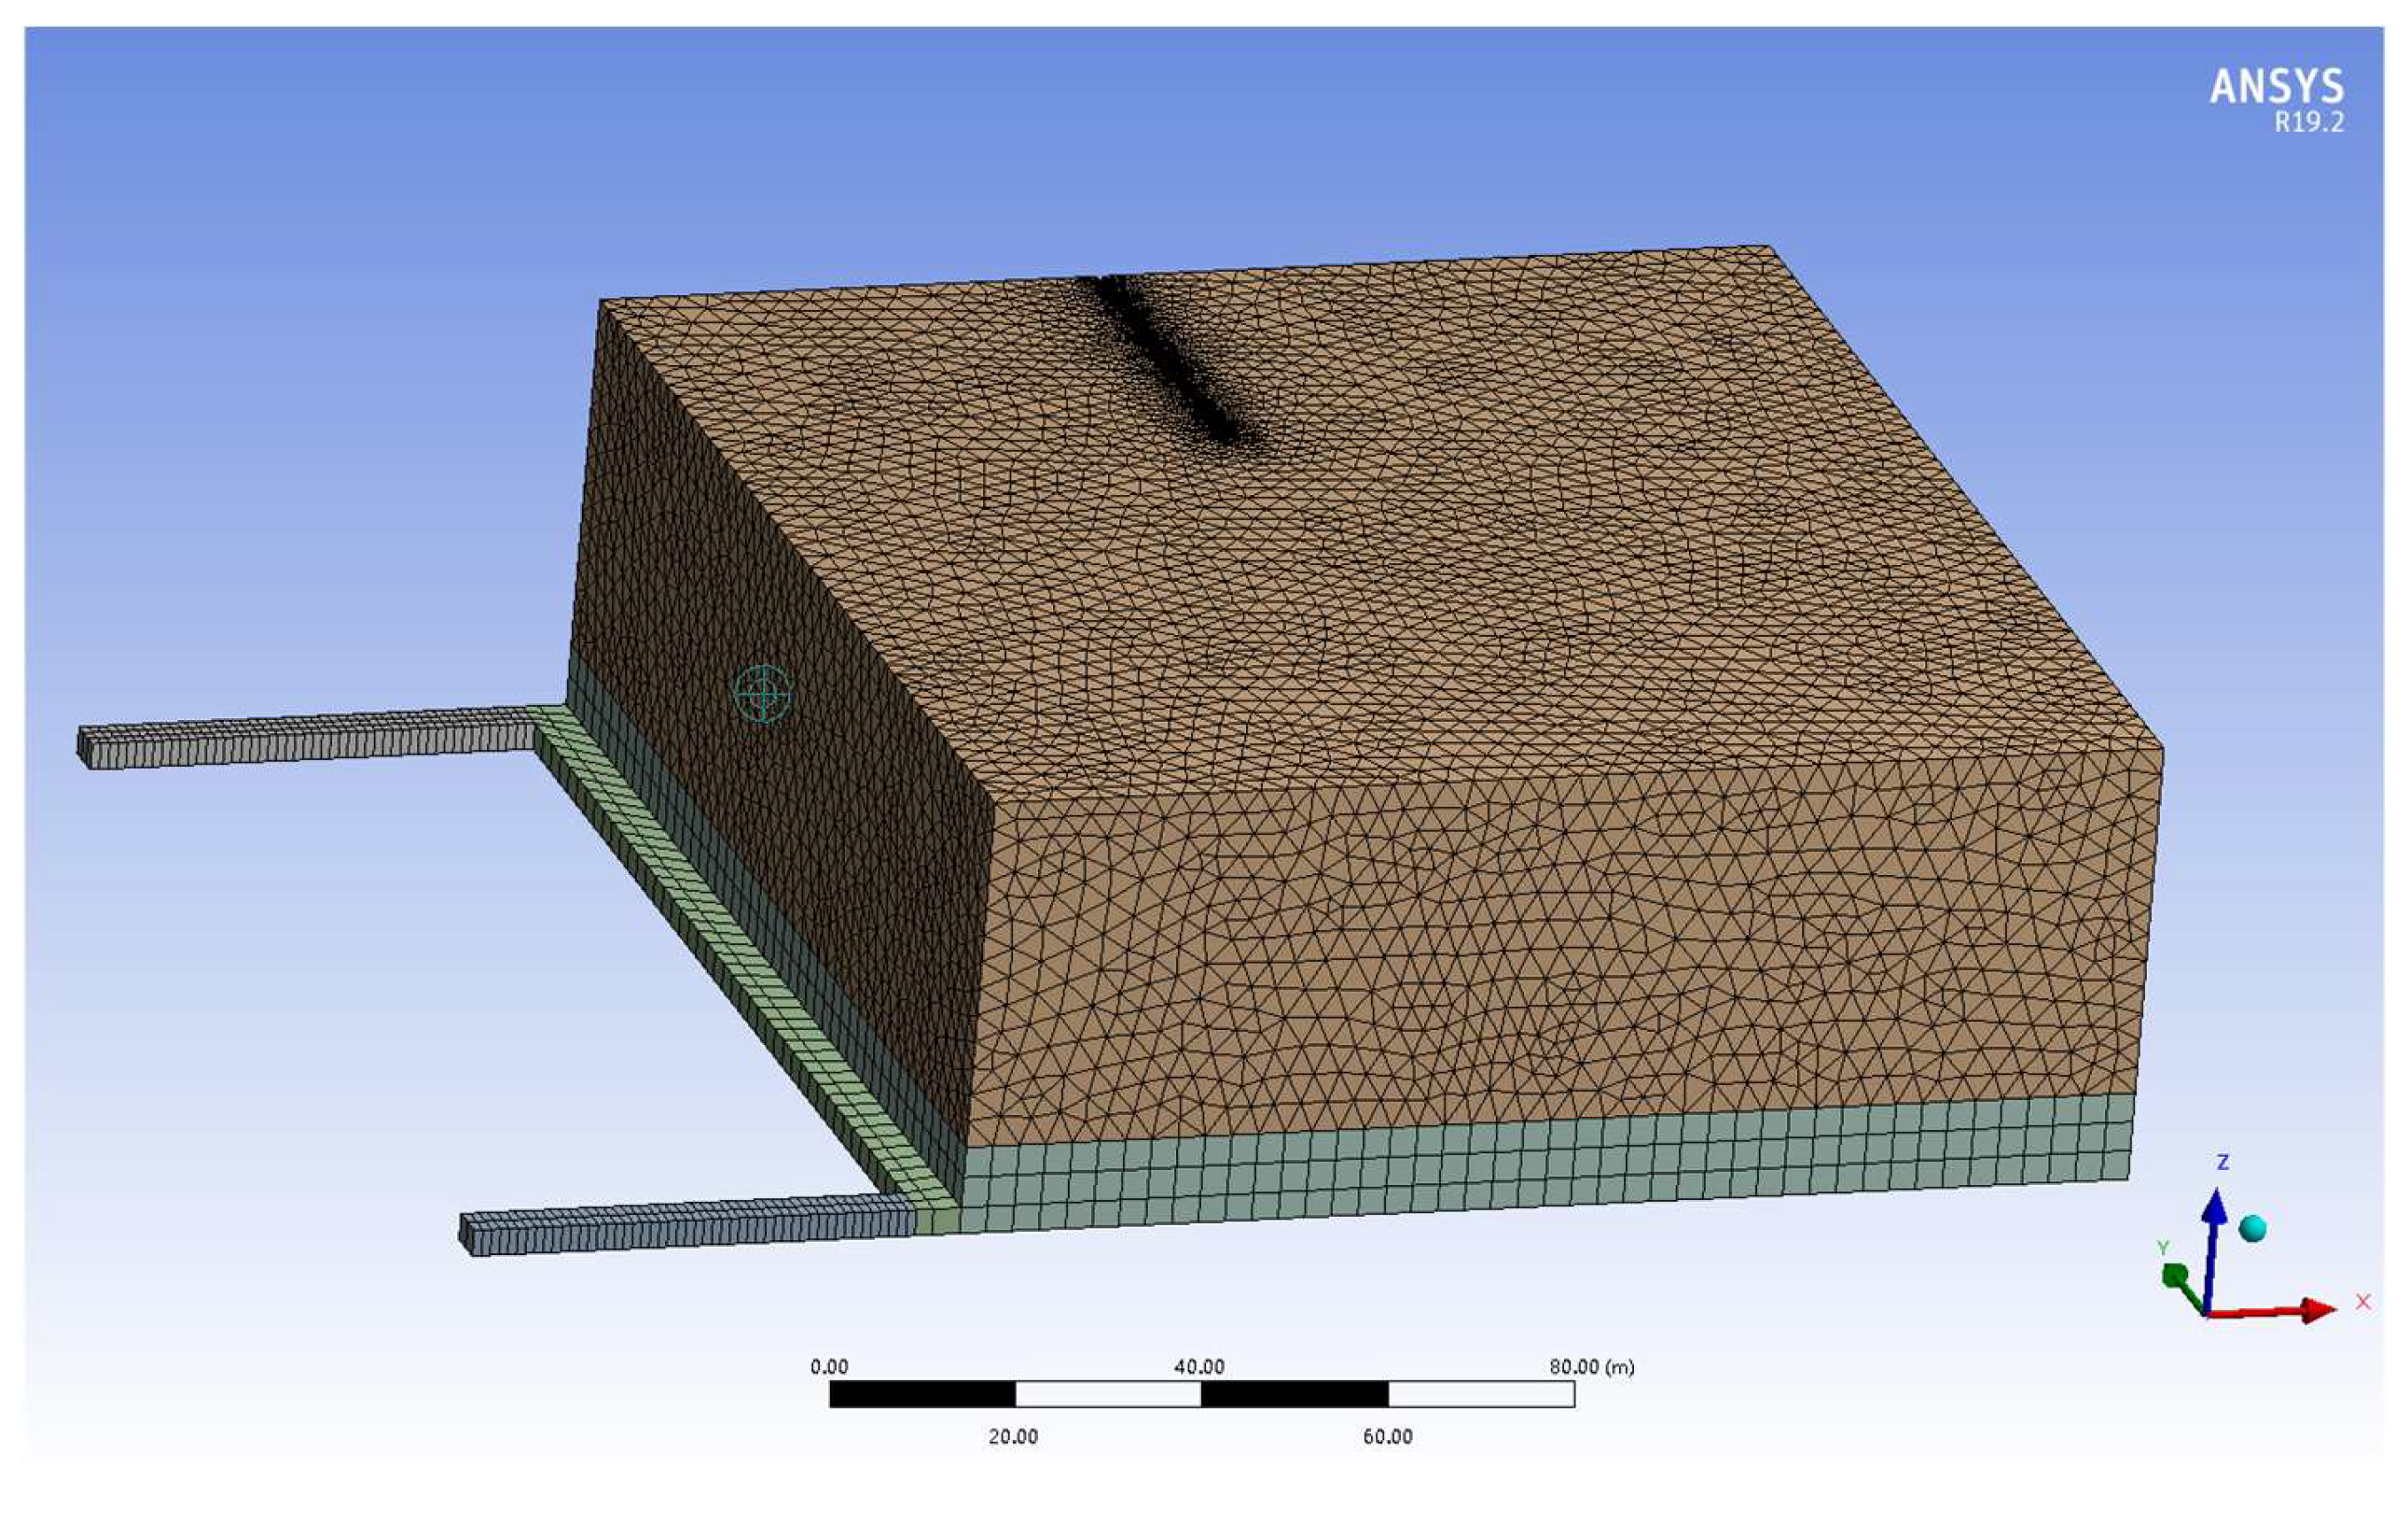
Combined with the actual situation of the mine, the ventilation method is a “U” ventilation, and the mining area is divided into a bubble zone and fissure zone, the height is calculated by Formulas (15) and (16) and the physical model of the mining area is established. The size of the inlet and return air tunnel is 50 m × 3 m × 4 m; the size of the working face is 142 m × 4 m × 4 m; the bubble zone is 142 m wide and 10 m high; the fissure zone is 142 m wide and 40 m high. The grid is divided into a hexahedral grid, with a single grid size of 2 m in the mining area and a single grid size of 1 m in the inlet and return air tunnel and the working face area and the grid of the air leakage path is encrypted and refined to ensure the accuracy of the simulation, as shown in Figure 6.
The height of the bubble fall zone is shown in Equation (15).
H M = 100 h 4.7 h + 19 ± 2.2
where:
  • H M —Height of bubble fall zone, m;
  • h —The working face mining height, m.
The fracture zone height is shown in Equation (16).
H D = 100 h 1.6 h + 3.6 ± 5.6
where:
  • H D —Height of the rift zone, m.
The boundary conditions are set as shown in Table 2.

5.3. Numerical Simulation Results and Analysis

Oxygen concentration, heat accumulation and wind speed are the main factors influencing the spontaneous combustion of coal left in the mining area. Since the current underground beam tube monitoring system can only monitor the gas concentration in the mining area, in order to compare with the beam tube data to determine the accuracy of the numerical simulation, the division of the “three zones” of spontaneous combustion in the mining area in this paper only considers the distribution of oxygen concentration. Therefore, only the distribution of oxygen concentration is considered in this paper. Thus, the range of the “dispersal zone” is 0.18 C , the range of the “oxidation zone” is 0.08 C 0.18 and the range of the “asphyxiation zone” is C 0.08 .

5.3.1. Stage I~IV Spontaneous Combustion “Three Belt” Distribution Law

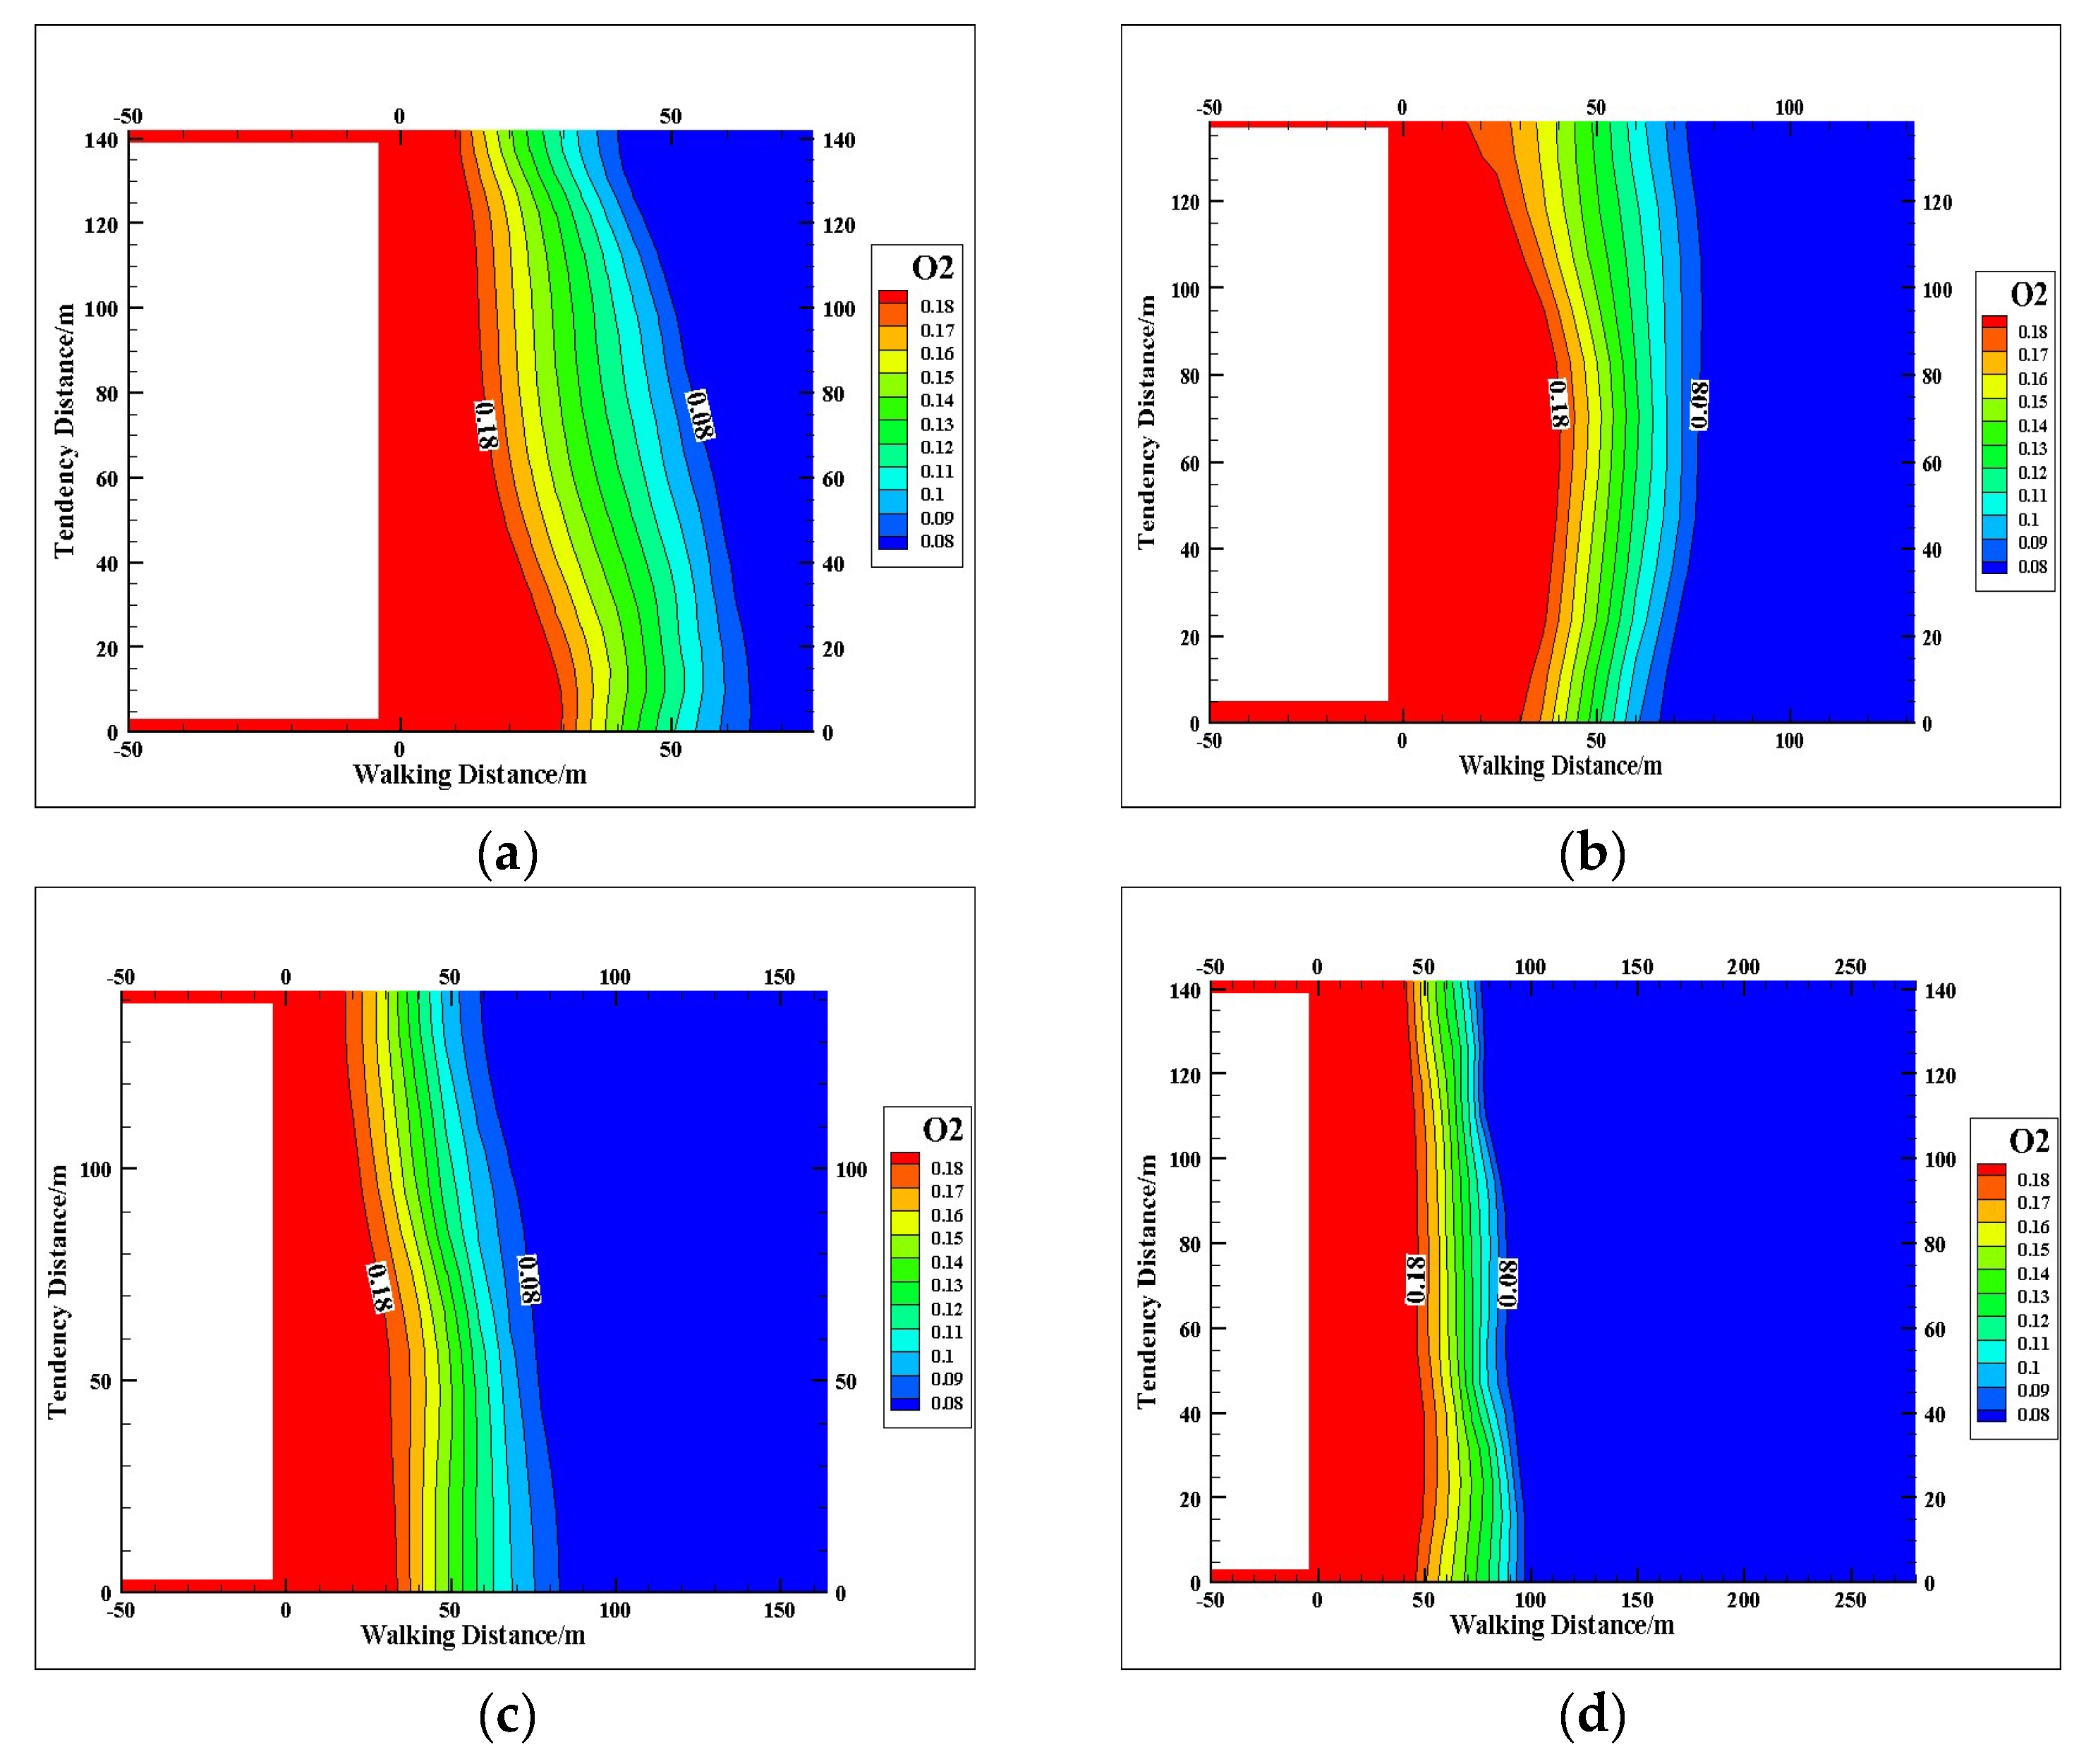
According to the numerical simulation results, interception stage I strike length 0~76 m, stage II strike length 0~132 m, stage III strike length 0~164 m, stage IV strike length 0~280 m, 2 m height plane oxygen concentration distribution from the bottom plate of the mining area, as shown in Figure 7.
From the above figure, we can see that in stage I, when the working face is advanced to 73 m, there is only air leakage from the working face, and the width of the “scattering zone” is 27 m in the inlet lane side, 14 m in the middle of the mining area, and 11 m in the return lane side. The width of the “oxidation zone” is 37 m in the inlet lane side, 36 m in the middle of the mining area, and 29 m in the return lane side. Due to the oxygen consumption of the coal left in the mining area and the influence of transport resistance in the process of gas diffusion, the width of the “oxidation zone” gradually decreases from the inlet to the return side, and the oxygen concentration is higher on the inlet side than on the return side due to the same directional distance from the working face. In stage Ⅱ, the working face is advanced to 132 m; at this time, the air leakage from the fissure of the overlying 0250 mining area on the return airway side is increased, the width of the “scattering zone” is 25 m on the incoming airway side, 22 m in the middle of the mining area and 11 m on the return airway side; the width of the “oxidation zone” is 40 m on the incoming airway side, 41 m in the middle of the mining area and 53 m on the return airway side. The width of the “scattering zone” and “oxidation zone” is almost unchanged on the side of the inlet tunnel. The width of the “scattering zone” and “oxidation zone” in the middle of the mining area increases, and the width of the “oxidation zone” in the return wind tunnel side increases. The reasons for the above phenomenon are: (1) there is air leakage from the overlying 0250 mining area to this mining area, and the coverage of the overlying 0250 mining area is within 100~142 m in the tendency direction of the return wind lane side, so it has more influence on the middle of the mining area and the return wind lane side and less influence on the incoming wind lane side; (2) the air leakage from the overlying mining area is different from the air leakage from the working face, and its oxygen concentration is lower than the oxygen concentration of the fresh air flow. Therefore, the width of the “oxidation zone” on the side of the return air tunnel increases, while the width of the “dispersal zone” does not change significantly. In stage III, the working face was advanced to 165 m; at this time, the air leakage from 0291 shelf road was increased, and the width of the “scattering zone” was 32 m in the inlet lane side, 30 m in the middle of the extraction area and 17 m in the return lane side. The width of the “oxidation zone” was 51 m in the inlet lane side, 47 m in the middle of the mining area and 42 m on the return airway side. As the air leakage from the shelf road is the leakage from the air mining area to the adjacent air mining area, it intensifies the air leakage from the working face, resulting in the overall increase of the width of the “scattering zone” and the “oxidation zone”. Because of the large wind volume on the side of the inlet lane, the solid surrounding rocks on both sides, and the large void rate of coal relics, the change on the side of the return lane is especially obvious. In stage Ⅳ, the working face advanced to 280 m; at this time, the air leakage from the fissure in the overlying 0251 mining area increased, and the width of the “scattering zone” was 35 m in the inlet lane side, 33 m in the middle of the mining area and 32 m in the return lane side; the width of the “oxidation zone” was 65 m in the inlet lane side, 59 m in the middle of the mining area and 48 m in the return lane side. At this stage, the overlying 0251 mining area covers a range of 0~95 m in the tendency direction of the inlet lane side, which has a greater influence on the width of the “oxidation zone” on the inlet lane side and the middle of the mining area; as the fissure in the 0250 mining area continues to extend with the advance of the working face, the “oxidation zone” on the return lane side has a greater influence on the width of the “oxidation zone” on the inlet lane side and the middle of the mining area. Therefore, the width of the “oxidation zone” on the side of the return wind tunnel has also increased. There is a small section of the “oxidized zone” on the side of the return wind lane, about 150 m, which is caused by the leakage of air at the entrance of the shelf tunnel.

5.3.2. Stage V~VI Spontaneous Combustion “Three Belt” Distribution Law

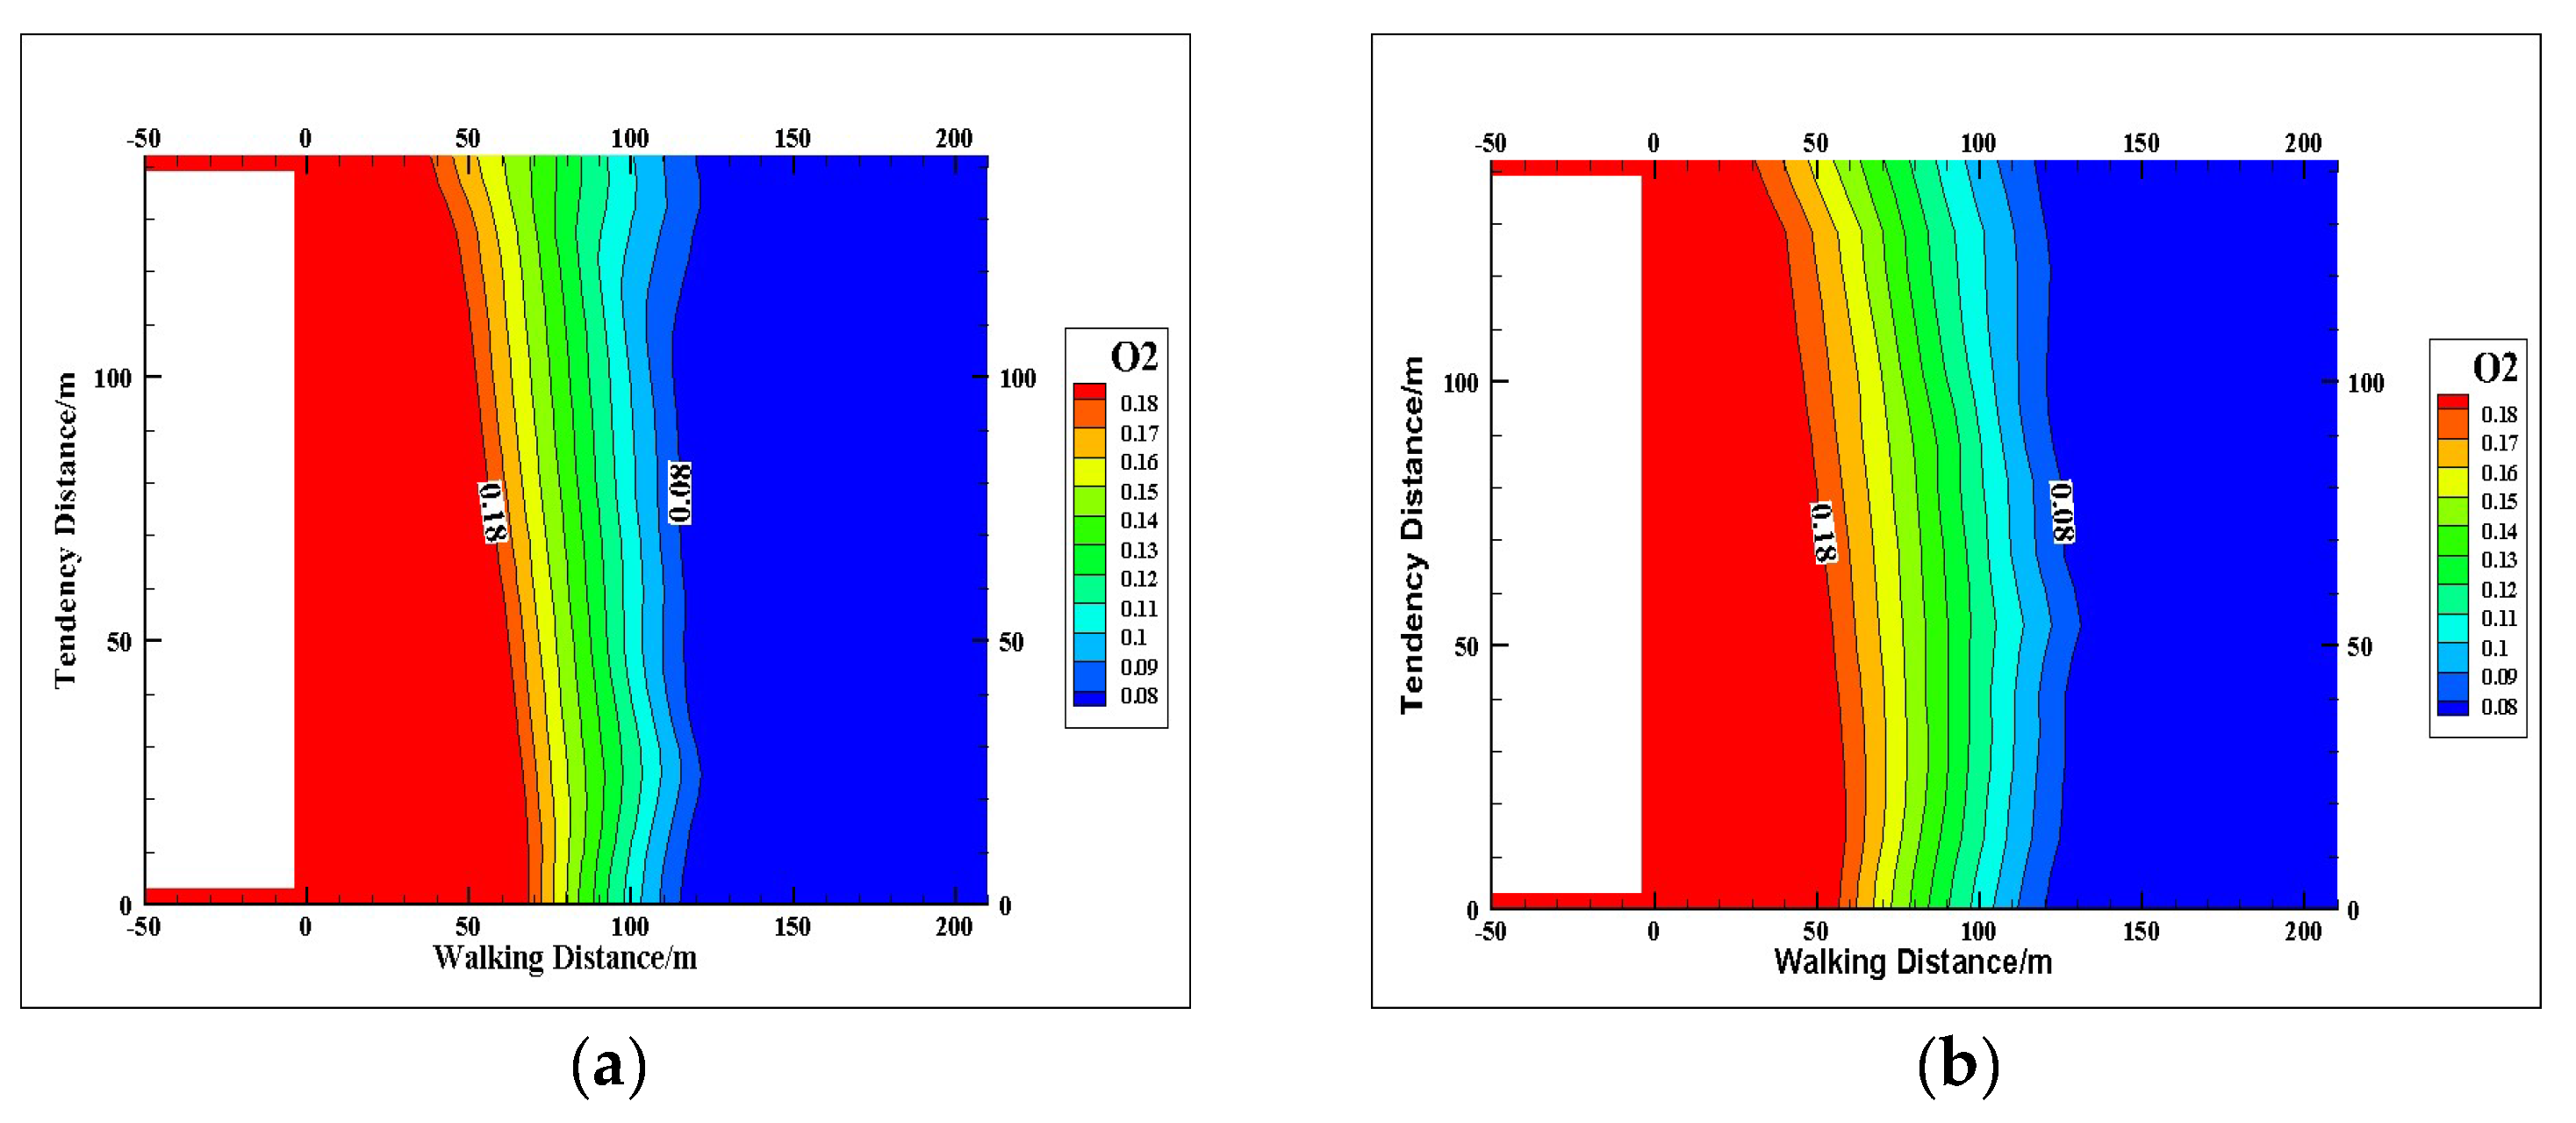
According to the numerical simulation results, intercepted stage V towards the length of 280~490 m from the bottom 2 m height, stage VI towards the length of 400~610 m from the bottom 2 m height plane oxygen concentration distribution, as shown in Figure 8.
From the above figure, it can be seen that in stage V, when the working face advanced to 490 m, the air leakage from the fissure near the 0290 mining area increased, and the width of the “scattering zone” was 63 m on the inlet side, 51 m in the middle of the mining area and 25 m on the return side; the width of the “oxidation zone” was 52 m on the inlet side, 66 m in the middle of the mining area and 98 m on the return side. At this stage, the width of the “oxidation zone” on the side of the return lane increases significantly because, unlike the overlying mining area, the adjacent mining area is closer to the location of the present mining area, and the intensity of wind leakage is greater, and the oxygen concentration in the two lanes from the adjacent mining area is higher. In addition, the air leakage from the near mining area to the present mining area is concentrated in the return air lane side, so it has a more obvious impact on the width of the “three belts” in the return air lane side. In stage VI, the working face advances to 610 m; at this time, the adjacent 0290 mining area is no longer extended, the overlying 0250, 0251 mining area in the return air alley side of the fissure leakage continues to be extended, the width of the “scattering zone” is 56 m in the incoming air alley side, 47 m in the middle of the mining area and 30 m in the return air alley side. “The width of the “oxidation zone” is 74 m in the side of the inlet tunnel, 82 m in the middle of the mining area and 97 m in the side of the return tunnel. The width of the “dispersion zone” on the side of the inlet tunnel and the middle of the mining area is slightly reduced, the width of the “oxidation zone” is substantially increased and the width of the “oxidation zone” on the side of the return tunnel is almost unchanged. The reasons for the above phenomena are: (1) the approach distance of 0290 mining area at this stage is shorter and no longer in contact with this mining area, so there is no longer wind leakage from the approaching mining area after 490 m; (2) the overlying 0250 and 0251 mining areas continue to be extended, so wind leakage from the fissures of the overlying mining area still exists.

6. Field Measurement Comparison Analysis

According to the actual mining situation of the working face, the beam pipe was buried when the working face was 186 m away, and two bundle pipes were buried in total. 1# bundle pipe monitoring point was arranged in the upper corner, and 2# bundle pipe monitoring point was arranged at the back of the working face support 30 m away from the upper corner. The beam tube monitoring data and numerical simulation prediction curve are shown in Figure 9.
The regression equation for the numerical simulation prediction curve based on the data in Figure 9 is shown in Equation (17), and the correlation coefficient is shown in Equation (18).
Y n = 0.1619 x + 21.625
R n 2 = 0.994
where:
  • Y n —numerical simulation predicted O2 concentration, %;
  • x —distance, m;
  • R n 2 —correlation coefficient of the regression equation of the numerical simulation prediction curve.
Bringing the monitoring data of beam pipes 1# and 2# into the above equation for residual analysis yields the correlation coefficients of its regression equation with the numerical simulation prediction curve as 0.994 and 0.989, respectively, with good correlation, indicating that the numerical simulation results match with the actual situation.
Due to space limitations, only partial monitoring data were extracted for oxygen concentrations of 8% and 18%, as shown in Table 3.
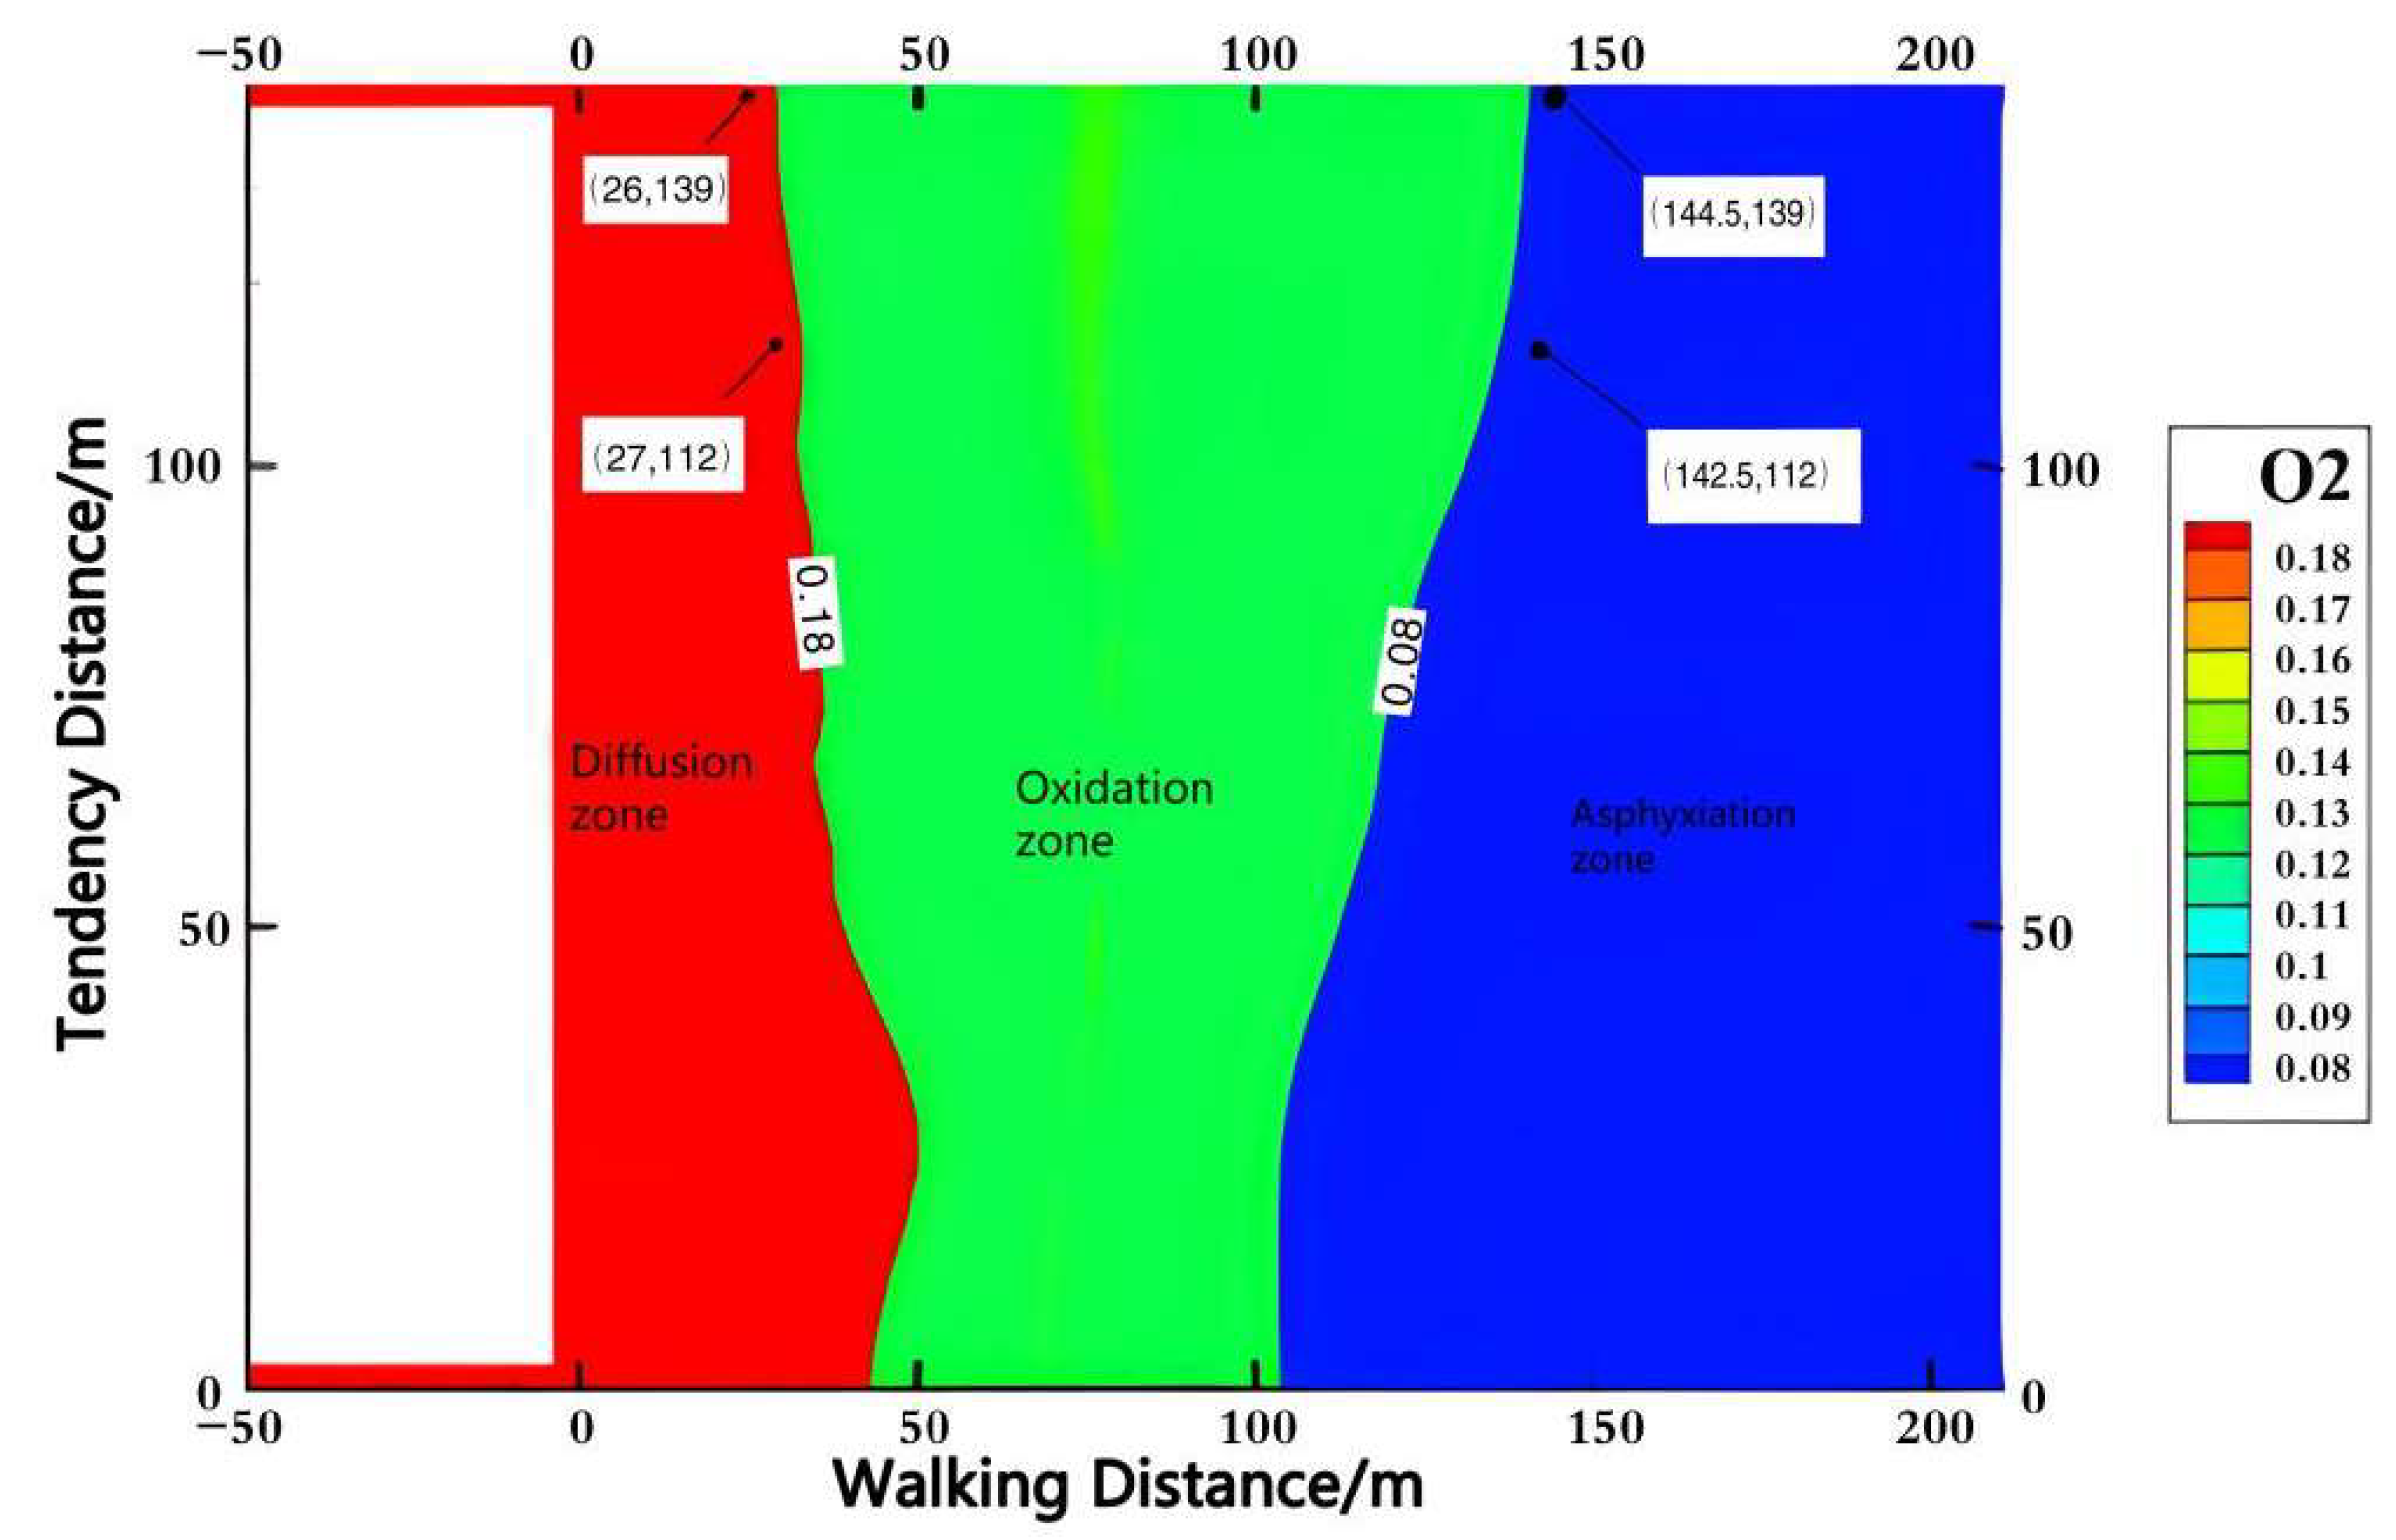
From the above table, it can be seen that the 1# monitoring point monitors oxygen concentration at 18% at a distance of 26 m from the working face and monitors oxygen concentration at 8% at a distance of 144.5 m from the working face, which results in the width of the oxidation zone monitored at the 1# monitoring point being 118.5 m. Similarly, the width of the oxygen zone monitored at the 2# monitoring point is 115.5 m. Numerical simulations were conducted for 186~396 m of the mining area. In order to more intuitively show the comparison results, four coordinate points (26, 139), (27, 112), (144.5, 139), (142.5, 112) with oxygen concentrations of 18% and 8% of the beam pipe data were plotted into the simulation results, as shown in Figure 10.
At this stage, the air leakage is complicated, and there is air leakage from the working face, air leakage from the fissures in the overlying 0250 and 0251 mining areas, air leakage from the 0291 shelfway entrance and air leakage from the fissures in the adjacent 0291 mining area at the same time. From the above figure, it can be seen that the beam pipe data basically match the simulation results, which proves the accuracy of the numerical simulation results.

7. Conclusions

In this paper, a segmented numerical simulation method is proposed for complex mining areas with multiple air leakage channels to study the change law of “three zones” of spontaneous combustion in the mining area. Firstly, the oxygen consumption rate model of coal relics is established through programmed warming experiments. Then, the flow field model of the porous media area is established according to Darcy’s law, and the three-dimensional distribution model of void rate is established according to the “O” circle theory. Finally, the mathematical model is used as the basis for numerical simulation by setting different boundary conditions such as air leakage velocity, air leakage location and oxygen concentration. The main conclusions are summarized as follows.
(1)
The standard oxygen consumption rate is calculated through the programmed warming experiment, and the oxygen consumption rate is combined with the oxygen concentration relationship equation to establish a coupled model of the oxygen consumption rate of the legacy coal. The results show that the oxygen consumption rate of the coal body shows an approximate exponential growth trend with the increase in temperature, which is proportional to the original oxygen concentration in the environment. The percolation of porous media in the mining area is simplified to the ideal state, and the flow field model in the mining area is established according to Darcy’s law, which defines the conditions of inertial resistance, viscous resistance and permeability in the mining area. The inertial resistance, viscous resistance, permeability and other conditions of porous media in the mining area provide data support for numerical simulation according to the “O” circle theory to establish a three-dimensional distribution model of void rate in the mining area. It is found that the distribution of void rate is in the shape of a “bathtub”, the void rate in the outer area is greater than that in the inner area and the void rate in the outer area is greater than that in the inner area. The void rate in the outer area is larger than that in the inner area, the void rate along the direction of the mining area decreases logarithmically with the increase of the direction length and the proportional coupling of “double hump” changes along the tendency direction.
(2)
A segmented simulation method is proposed for the multiple air leakage paths mining area. According to the distribution of air leakage paths in the mining area, the mining area is divided into six stages, and each stage is set with the corresponding air leakage speed, air leakage paths and oxygen concentration according to the location relationship with the adjacent mining area. Through comparative analysis of different stages, we found that: the width of the “oxidation zone” decreases gradually along the tendency when only the working face is leaking; the leaking wind flow in the overlying mining area is smaller and the oxygen concentration is lower, which increases the width of the “oxidation zone” in the coverage area; the leaking wind in the shelf road forms an “oxidation zone” near the shelf. The air leakage from the shelf road forms an “oxidized zone” area near the entrance of the shelf road; the larger air leakage from the adjacent mining area and higher oxygen concentration increases the width of the overall “dispersal zone” and “oxidized zone”. The simulation results well reflect the change law of “three zones” of spontaneous combustion in the mining area under different conditions, which is also applicable to the conditions of buried pipe extraction and high-level drilling extraction in practical application.
(3)
The comparison between the downhole beam tube monitoring data and the numerical simulation results of the corresponding area reveals that the two results are basically consistent in delineating the range of the “three zones” of spontaneous combustion in the mining area, thus verifying the rationality of the mathematical model and the accuracy of the numerical simulation results.

Author Contributions

Conceptualization, J.Z.; methodology, G.R.; software, G.R.; validation, J.Z. and G.R.; formal analysis, J.Z. and G.R.; investigation, Y.B. and T.N.; resources, J.Z. and G.R.; data curation, G.R.; writing—original draft preparation, G.R.; writing—review and editing, J.Z.; visualization, G.R.; supervision, J.Z.; project administration, J.Z.; funding acquisition, J.Z. All authors have read and agreed to the published version of the manuscript.

Funding

This research received no external funding.

Institutional Review Board Statement

Not applicable.

Informed Consent Statement

Not applicable.

Data Availability Statement

Not applicable.

Conflicts of Interest

The authors declare no conflict of interest.

References

  1. Wang, J.; Cui, S.; Cao, J. Interference analysis of equipment installation in 8.8 m super high mining workings. Coal Eng. 2020, 52, 33–37. [Google Scholar]
  2. Liang, Y.; Wang, X.; Zhang, X. Analysis of anomalies in the distribution of spontaneous combustion “three zones” in the mining area of He Mo coal mine. Coal Mine Saf. 2015, 46, 166–168+172. [Google Scholar]
  3. Hua, H.; Liu, Z.; Si, J. Research on comprehensive fire prevention and fire suppression technology for coal pillarless mining workings in Qidong coal mine of Wanbei Coal Power. J. North China Inst. Sci. Technol. 2019, 16, 7–11. [Google Scholar]
  4. Zhou, X.; Jiang, Y.; Bai, G.; Li, D.; Hao, H. Experimental study on the parameters of spontaneous combustion characteristics of sulfur-containing anthracite coal affected by oxygen concentration. Coal Sci. Technol. 2022, 1–12. [Google Scholar] [CrossRef]
  5. Zhou, X.; Niu, Y.; Bai, G. Experimental study on the effect of air supply on the parameters of lignite spontaneous combustion characteristics. Min. Saf. Environ. Prot. 2020, 47, 31–35. [Google Scholar]
  6. Pan, Y.; Zhou, P.; Yan, Y.; Agrawal, A.; Wang, Y. New insights into the methods for predicting ground surface roughness in the age of digitalization. Precis. Eng. 2021, 67, 393–418. [Google Scholar] [CrossRef]
  7. An, J.; Zhang, J.; Ji, D.; Cai, M.; Xu, B.; Zhang, P. Study on the preferential selection of coal spontaneous combustion index gas based on segment fitting. China Sci. Technol. Saf. Prod. 2021, 17, 25–31. [Google Scholar]
  8. Xue, C.; Qin, R.; Zhang, S.; Dai, G.; Hou, S.; Luo, D. Experimental study on the oxidation of spontaneously combustible coal with different particle sizes at room temperature. China Saf. Prod. Sci. Technol. 2021, 17, 64–69. [Google Scholar]
  9. Zhang, F. Variation of spontaneous combustion limit parameters of coal relics in composite mining areas and determination of hazardous areas. Min. Saf. Environ. Prot. 2020, 47, 66–72. [Google Scholar]
  10. Zhang, S.; Qin, Y.; Liu, W.; Gao, P. Model analysis and numerical simulation study of flow field and oxygen concentration field in mining area. Coal Eng. 2019, 51, 104–108. [Google Scholar]
  11. Yang, Z. Research on Multifield Coupled Three-Dimensional Dynamic Numerical Solution Model of Mining Area Based on Flow Pipe. Ph.D. Thesis, China University of Mining and Technology, Beijing, China, 2017. [Google Scholar]
  12. Du, Y. Research on the Characteristics of Air Leakage in the Mining Area under the Y-Shaped Ventilation Mode of the Top-Cutting and Pressure-Relief Stay Lane. Master’s Thesis, Henan University of Technology, Zhengzhou, China, 2018. [Google Scholar]
  13. Xu, C.; Cao, M.; Li, X.; Sun, H.; Yan, Z. Gas transport and enrichment patterns in mining areas based on three-dimensional void rate model. Coal Mine Saf. 2021, 52, 7–13. [Google Scholar]
  14. Wang, Z. Study on the Evolution of Permeability Law of Overburden Rock in Lao San Gou Coal Mine with Extra-Thick Coal Seam Mining. Ph.D. Thesis, China University of Mining and Technology, Beijing, China, 2017. [Google Scholar]
  15. Liu, K.; Jin, S.; Rui, Y.; Huang, J.; Zhou, Z. Effect of Lithology on Mechanical and Damage Behaviors of Concrete in Concrete-Rock Combined Specimen. Mathematics 2022, 10, 727. [Google Scholar] [CrossRef]
  16. Li, C.; Xu, Z. Numerical Modeling and Investigation of Fault-Induced Water Inrush Hazard under Different Mining Advancing Directions. Mathematics 2022, 10, 1561. [Google Scholar] [CrossRef]
  17. Xuan, D.; Shen, C.; Li, X. Exploration of coal mine re-mining. Min. Technol. 2008, 23–24. [Google Scholar] [CrossRef]
  18. Li, Z.; Xuan, P.; Guo, Y. Analysis of the mechanism of coal spontaneous combustion phenomenon and prevention means. Inn. Mong. Coal Econ. 2021, 86–87. [Google Scholar] [CrossRef]
  19. Wan, L.; Sun, M.; Zhao, J.; Cai, D.; Ma, S. Research on wind leakage pattern and prevention and control technology in complex mining area of close coal seam. China Min. Ind. 2022, 31, 114–120. [Google Scholar]
  20. Zhao, W.; Zhang, W.; Liu, H.; Shi, X.; Wang, Z.; Li, Z. Study on the distribution law of three-dimensional spontaneous combustion zone in different stages of mining area of coal release from header mining. Min. Res. Dev. 2021, 41, 44–51. [Google Scholar]
  21. Wang, Y. Study on the distribution of “three zones” of spontaneous combustion in the shallow buried deep inclined workings. Coal Technol. 2021, 40, 110–114. [Google Scholar]
  22. Shen, Y.; Zhang, J.; Wu, J.; Feng, P.; Shen, Y. Numerical simulation of fire source temperature distribution law in mining area under different wind speeds. J. North China Univ. Technol. Nat. Sci. Ed. 2021, 43, 134–140. [Google Scholar]
  23. Wen, H.; Cheng, X.; Xu, Y.; Fan, S.; Hu, W.; Liu, H.; Guo, J. Influence of different air leakage source locations on the distribution of spontaneous combustion zone in the heaving working face of extra-thick coal seam. Coal Mine Saf. 2018, 49, 138–142. [Google Scholar]
  24. Liu, W.; Qin, Y.; Qiao, S.; Ma, B. Calculation and experimental demonstration of oxygen consumption rate and CO generation rate of coal. J. China Univ. Min. Technol. 2016, 45, 1141–1147. [Google Scholar]
  25. Si, J.; Cheng, G.; Zhu, J.; Chu, T. Three-dimensional modeling and application of permeability characteristics of non-homogeneous porous media in mining areas. Coal Sci. Technol. 2019, 47, 220–224. [Google Scholar]
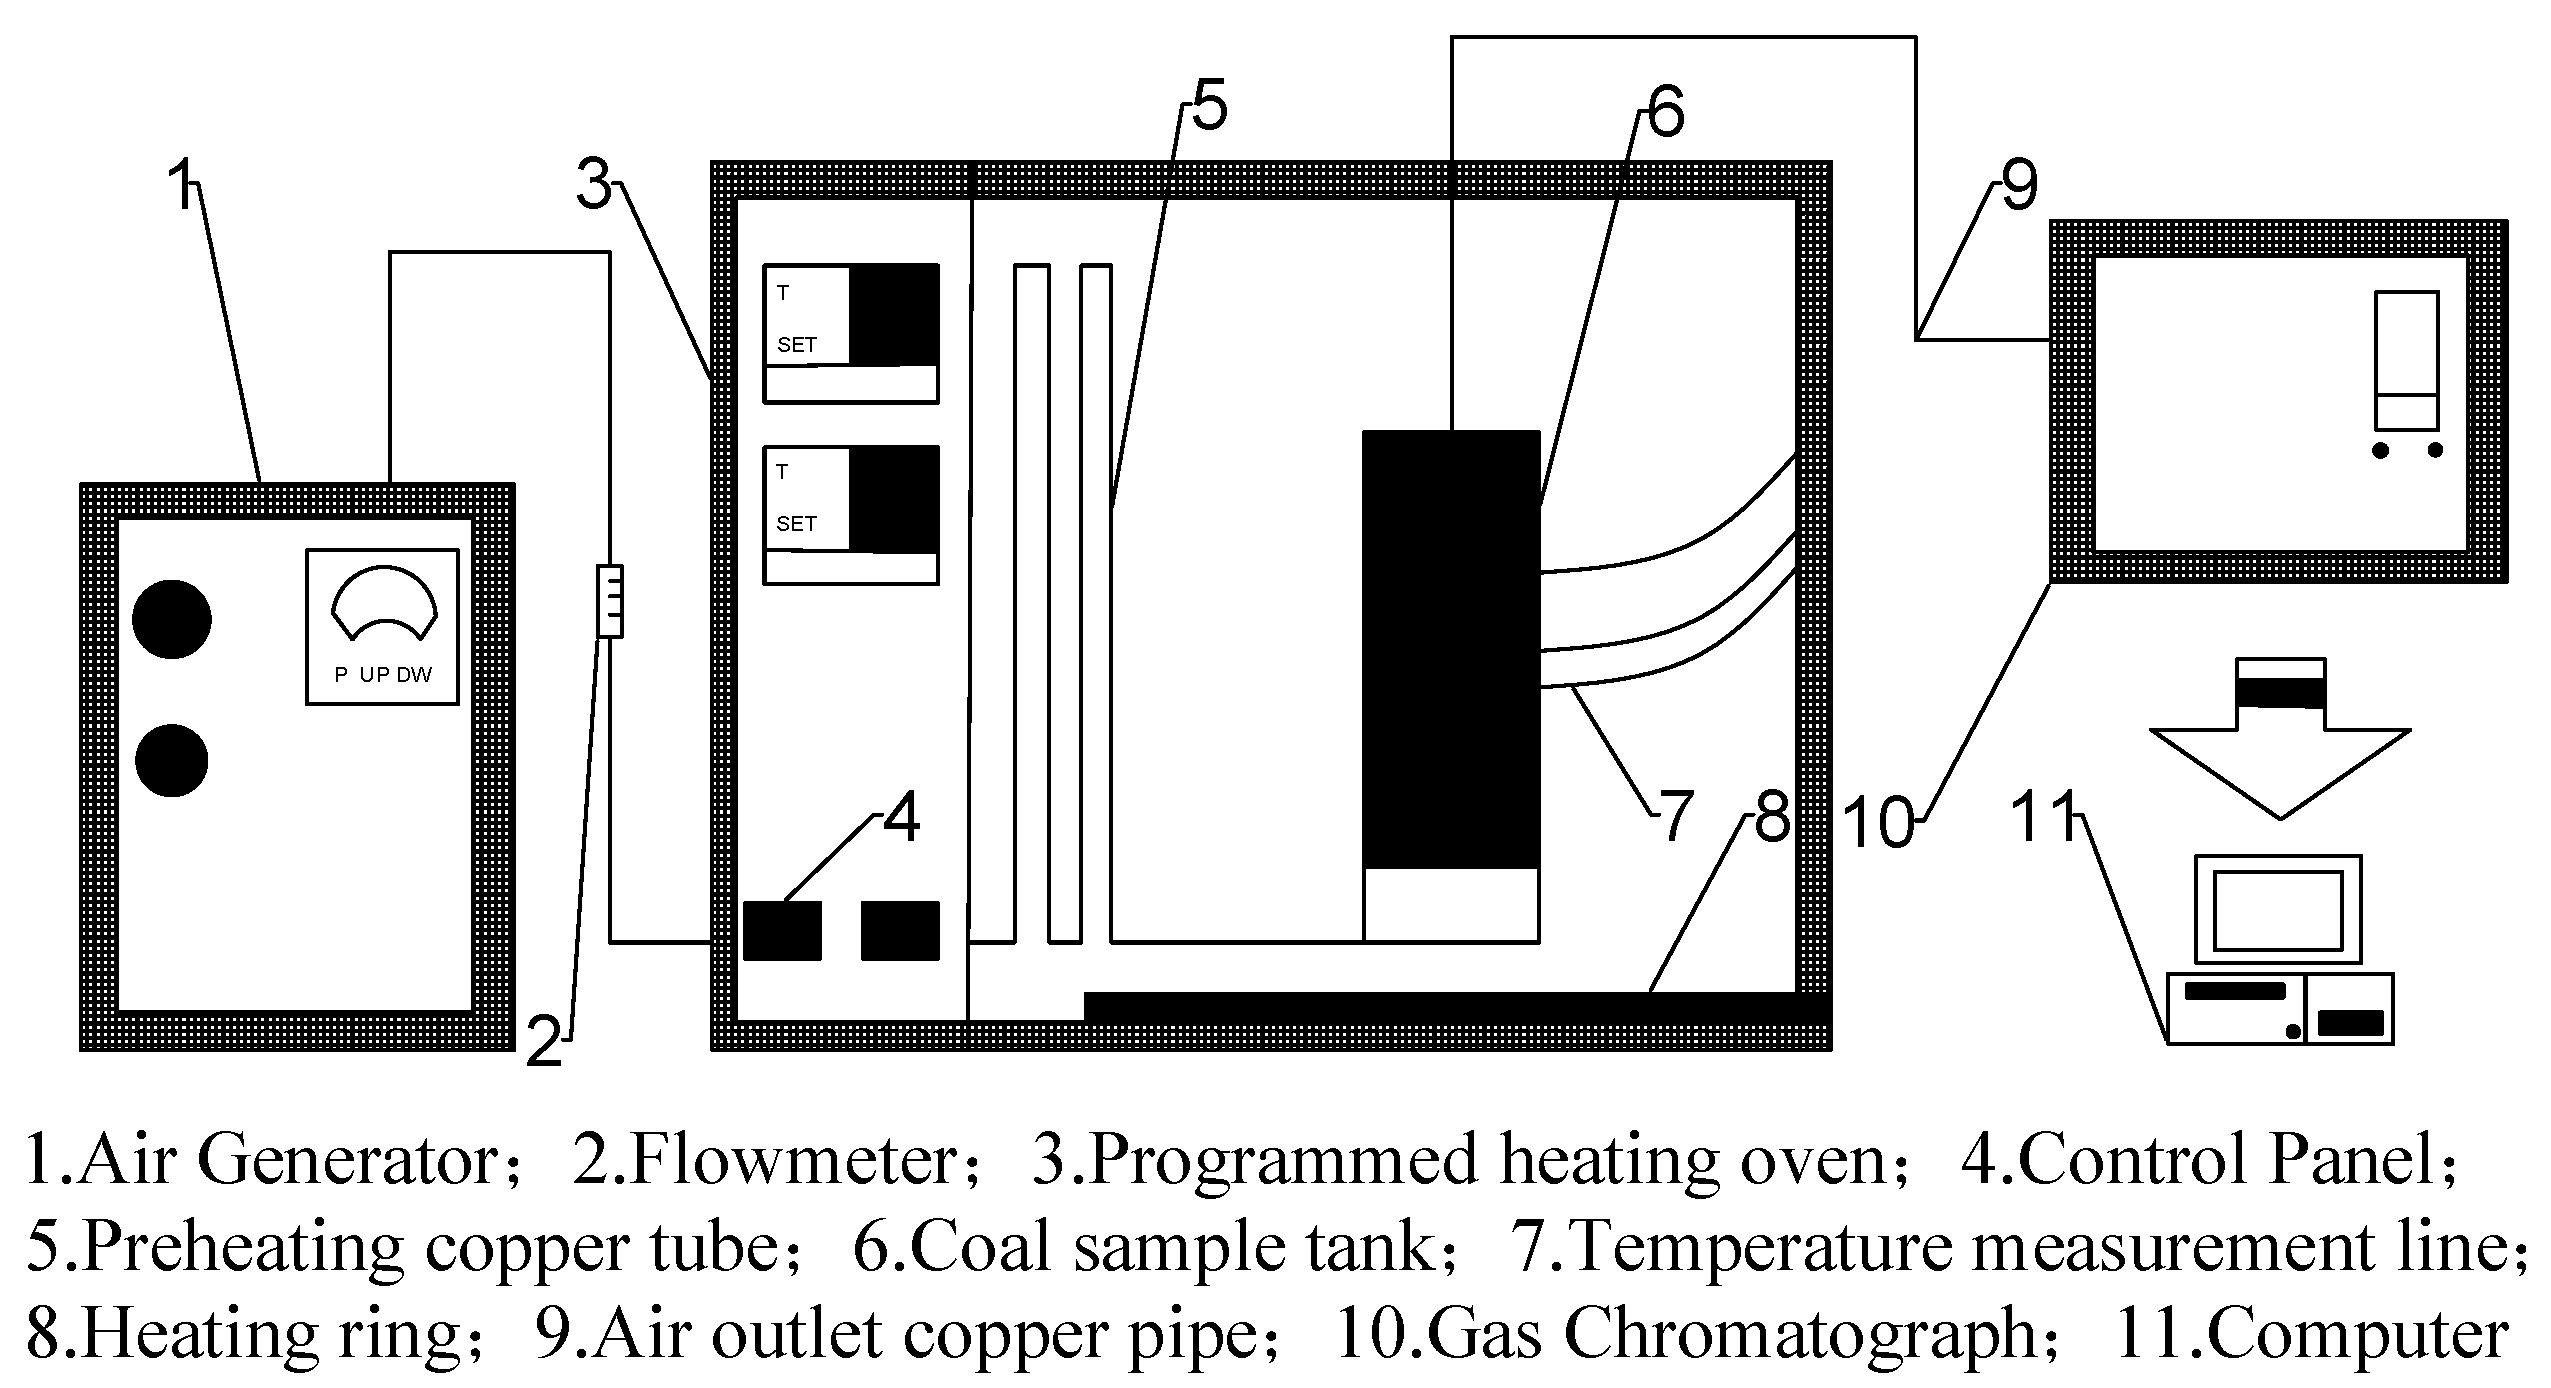
Figure 1. Programmed temperature rise—gas chromatography system.
Mathematics 10 02484 g001
Figure 2. Trend of O2 concentration with temperature during the warming process of coal sample.
Mathematics 10 02484 g002
Figure 3. The trend of oxygen consumption rate with temperature during the warming process of the coal sample.
Mathematics 10 02484 g003
Figure 4. Distribution of void ratio in the extraction area.
Mathematics 10 02484 g004
Figure 5. Schematic diagram of the sectioning situation of the mining area.
Mathematics 10 02484 g005
Figure 6. Physical model of the extraction area.
Mathematics 10 02484 g006
Figure 7. Oxygen concentration distribution in the mining area of stage I~IV: (a) Stage I, (b) Stage II, (c) Stage III, (d) Stage IV.
Mathematics 10 02484 g007
Figure 8. Oxygen concentration distribution in the mining area of stage V~VI: (a) Stage V, (b) Stage VI.
Mathematics 10 02484 g008
Figure 9. Beam tube monitoring data and numerical simulation prediction curve.
Mathematics 10 02484 g009
Figure 10. Comparison of beam tube data and numerical simulation.
Mathematics 10 02484 g010
Table 1. Industrial analysis and elemental analysis data of coal samples.
Coal Sample NameMoisture/%Ash
Content/%
Volatile Fraction/%Fixed
Carbon/%
C/%H/%O/%N/%S/%True
Density/(g/cm3)
9# mine0.9514.6623.5461.4375.724.217.021.510.461.56
Table 2. Physical model parameters of the extraction area.
Boundary ConditionsOptionsParameters
Air inletVelocity-inlet2.5 m/s
Return air outletOutletOutflow
Regional InterfacesInterior
Regional BoundariesWall
Gas volume fractionO221%
Table 3. Beam tube monitoring partial data.
Distance/m2526272829138.8140142.5144.5146
1# Oxygen concentration/%18.118.017.817.617.38.58.38.38.07.8
2# Oxygen concentration/%18.518.318.017.616.58.28.28.07.87.6
Publisher’s Note: MDPI stays neutral with regard to jurisdictional claims in published maps and institutional affiliations.