Article

FEM-Based Simulative Study for Multi-Response Optimization of Powder Bed Fusion Process

1
Department of Manufacturing Engineering, National Institute of Foundry and Forge Technology, Hatia, Ranchi 834003, India
2
Department of Mechanical Engineering, Faculty of Engineering and Technology, Jamia Millia Islamia (JMI) University, New Delhi 110025, India
3
Mechanical Engineering Department, College of Engineering, King Khalid University, Abha 61413, Saudi Arabia
4
Department of Chemistry, Faculty of Science, King Khalid University, P.O. Box 9004, Abha 61413, Saudi Arabia
5
Pesticide Formulation Department, Central Agricultural Pesticide Laboratory, Agricultural Research Center, Dokki, Giza 12618, Egypt
*
Authors to whom correspondence should be addressed.
Mathematics 2022, 10(14), 2505; https://doi.org/10.3390/math10142505
Submission received: 13 May 2022 / Revised: 22 June 2022 / Accepted: 25 June 2022 / Published: 19 July 2022
(This article belongs to the Special Issue Mathematical Problems in Mechanical Engineering)

Abstract

:
Laser powder bed fusion (LPBF) is an additive manufacturing technology which uses a heat source (laser) to sinter or fuse atomized powder particles together. A new layer of powder is spread over the previous layer using a roller, and then the laser power fuses them. This mechanism is repeated until the part model is completed. To reduce the time, effort, and cost, the present study incorporated the design of an experimental approach conjoined with finite element analysis (FEA) to simulate the LPBF process. A three-dimensional (3D) bi-material model was subjected to FEA with variations in temporal and spatial material characteristics. A Gaussian moving heat source model for the multi-scanning of a single layer was developed to understand the effect of process parameters, namely laser power, scan speed, and scan pattern on melt pool dimensions. Although, similar simulation models have been reported in the literature, the majority of these did not consider parametric variations. A few studies adopted multiple parameters which varied simultaneously, but the major limitation of these studies was that most of them did not consider multiple characteristics under a constrained environment. In the present research, the multi-parameter multi-level simulation study was performed to understand the process mechanism with fewer simulations. Results showed that the studied dimensions were sensitive to parameter setting, and that temperature variation within the melt pool was dependant on the material phase in the vicinity of the melt pool. This research proposed that melt pool dimensions must be accurately controlled for optimum process performance to achieve proper overlap between the adjacent scan lines and sufficient depth to complete bonding with the bottom layer. Since the involved criteria were of a conflicting nature, the problem of determining a single factor setting to obtain the desired results was solved using grey relational analysis (GRA). It was found that, among all the considered process parameters, scan velocity was the most significant one. This research recommended a maximum scan velocity i.e., v = 1.5 m/s, with a minimum laser power i.e., P = 80 W. In addition, it was also suggested that low energy density be used to melt the powder layer properly.

1. Introduction

Additive manufacturing (AM) is a material deposition process based on the consolidation of feedstock as per the three-dimensional (3D) computer-aided design (CAD) model of the resulting part, developed using a numerically controlled material and energy deposition mechanisms [1]. As such, AM has evolved as a viable alternative to manufacturing complex functional parts with homogeneous or heterogeneous material compositions using various polymers, ceramics, metals/alloys, and consolidated products [1]. Indeed, AM is adopted in multiple applications, such as in the aerospace, automotive, medical implants, and machinery industries, and in sandwiched structures, such as panels [2]. The manufacturing of metal parts is one of the fastest growing applications of AM. Most metal AM systems utilize a powder bed fusion (PBF) process [3]. In this process, a layer of powder is spread over a table or previously solidified layer, and a laser scans the powder bed at a controlled rate for localized powder melting. The molten metal fuses with the previously deposited material to create a layered profile. After this, the build table moves downward at a distance equal to the layer thickness, and this process is repeated until the entire part is built in the controlled environment. The part densification depends upon the type of sintering mechanism, namely liquid phase sintering and complete melting [4]. Partial melting of powder occurs in the former, while, in the latter, powder is melted completely. Due to its ability to produce fully dense parts of mechanical properties equivalent to or better than forged or cast parts [5] and its suitability for processing non-ferrous pure metals and alloys [6], total melting is preferable for building AM parts. The intrinsic nature of the process results in rapid heating of a narrow region for a short period using a high intensity focused laser. Laser powder interaction results in the melting of both the powder and the material beneath it due to heat conduction. Melting is followed by the rapid cooling of the heat-affected zone. Coupled with this heating and cooling cycle are the re-melting and re-solidifying of material adjacent to the heat-affected zone, and the phase changes involved within the part and the melt zone. The amount of input energy dictates the transient and spatial temperature variation in the part and controls the melt pool growth [7]. To form a good bond, sufficient input energy must be supplied to melt the powder and the surface below it. There is a threshold limit beyond which input energy results in the evaporation of alloy constituents. The melt vapour increases the laser absorption, causing an increase in melt pool depth. The entrapped vapour may collapse during the solidification of the melt, resulting in the formation of voids [8].
In some cases, such as in high carbon steels, the formation of interfacial carbides increases the brittleness. Increasing the heat input favours the dissolution of carbides and, accordingly, homogenizes the distribution of alloying elements [9]. The input energy depends upon various factors, such as laser power, scan speed, scan pattern, layer thickness, and hatch spacing [10]. The selection of layer thickness and hatch spacing depends on the average powder particle size, scan area, and the desired resolution. Depending upon laser power and scan speed, the entire process window can be divided into four zones, as follows: total melting, over melting, incomplete melting, and overheating [11].
A porosity-free part is produced in a total melting region. Over melting causes porosity because of entrapped gases, whereas incomplete melting results in insufficient overlapping between melt regions, leading to a lack of fusion or crack formation. Excessive distortion due to overheating may hamper the part build. Due to the moving energy source, a non-symmetric melt pool can develop in the vicinity of the high energy irradiance region, which alters the cooling rate across the melt pool boundary [12]. Melt pool size affects the cooling rate and temperature gradient development and is correlated with the build part’s microstructures and properties [13]. Spatial temperature variation results in anisotropy in the microstructure [14]. The multi-component and multi-phase composition of most alloys, such as Ti6Al4V, enables the diverse microstructure patterns under non-uniform and dynamically changing temperature distribution [15]. Oxygen content in the atmosphere, laser power, layer thickness, and scan speed have a mitigating effect on the layer formation, as they affect the wetting ability of the melt [16]. Laser power, scan speed, hatch space, and scan pattern affect the melting pool’s rheology and the formation of pore structures [17]. The past activities to improve part quality are related to in-situ process monitoring and control [18]. These activities acquire and process the data in real-time to affect an on-the-fly response. The major hindrance is selecting a data acquisition device and its location inside the build chamber [19]. Such a feedback control mechanism works well when parameters are set to near optimum values, especially when there is a minimal response time, as in the AM process. Many studies utilized experimental methods to understand the influence of the process parameters [20]. The experimental studies are time-consuming, cumbersome, and costly. Most of the time, results depend upon the skills of an experimenter and the accuracy of measuring equipment, as well as the type and range of parameters selected. The interrelation between various parameters on the studied properties is difficult to determine, especially under the transient nature of the process and spatially varying properties. The alternate approach is to simulate the process. Compared to the experimental methods, the modelling and simulation (M&S) are more economical and efficient in optimizing process parameters to produce a part with improved mechanical properties [21]. The M&S approach can be implemented to detect defects, to improve part distortion, to predict residual stress in part, and to understand microstructure growth and melt pool dynamics [22,23,24,25,26]. Many of these studies incorporated a single parameter setting approach to study the chosen characteristics. A few adopted multiple parameters varied simultaneously to study their effect on the characteristics of interest. However, the major limitation of these studies was that most of them did not consider multiple characteristics under a constrained environment. The present study utilizes the M&S approach to study the LPBF process under a multi-parameter multi-response environment.
The novelty of the work lies in integrating the simulation modelling, design of experiment, and optimization technique to study the physics of the LPBF process. This research presented a multi-parameter multi-level simulation study to understand the process mechanism with fewer simulations, as previous researchers only presented the simulation model without considering variation in the considered parameters. In the present study, not only the effect of individual parameter but their interaction effects were also investigated with an aim to bridge the existing gap. In addition, this study made a successful attempt to relate scan criteria with laser power and scan speed, and also explained the relation between melt pool dimensions and scanning pattern. Lastly, the complete methodology with all necessary information is presented in Section 2 in order to provide readers and researchers with an easy understanding of how to use FEA-based software to develop models which can reproduce the desired results. Obtained results and related discussions are presented in Section 3, and the major conclusions of the study are presented in Section 4.

2. Methods and Materials

The material chosen for the part fabrication is Ti6Al4V alloy. This material is widely used in aerospace, petrochemical, biomedical, and other fields because of its low density, high specific strength, excellent corrosion resistance, and good welding performance [27]. The process parameters considered are laser power (P), scan speed (v), and scanning pattern (sp). These processing parameters’ influence and interaction on the temperature distribution in the melt pool and melt pool size are studied. The study considered that the maximum temperature for complete melting must be as small as possible to prevent overheating of the melt and to prevent residual stress and thermal distortion-related problems.
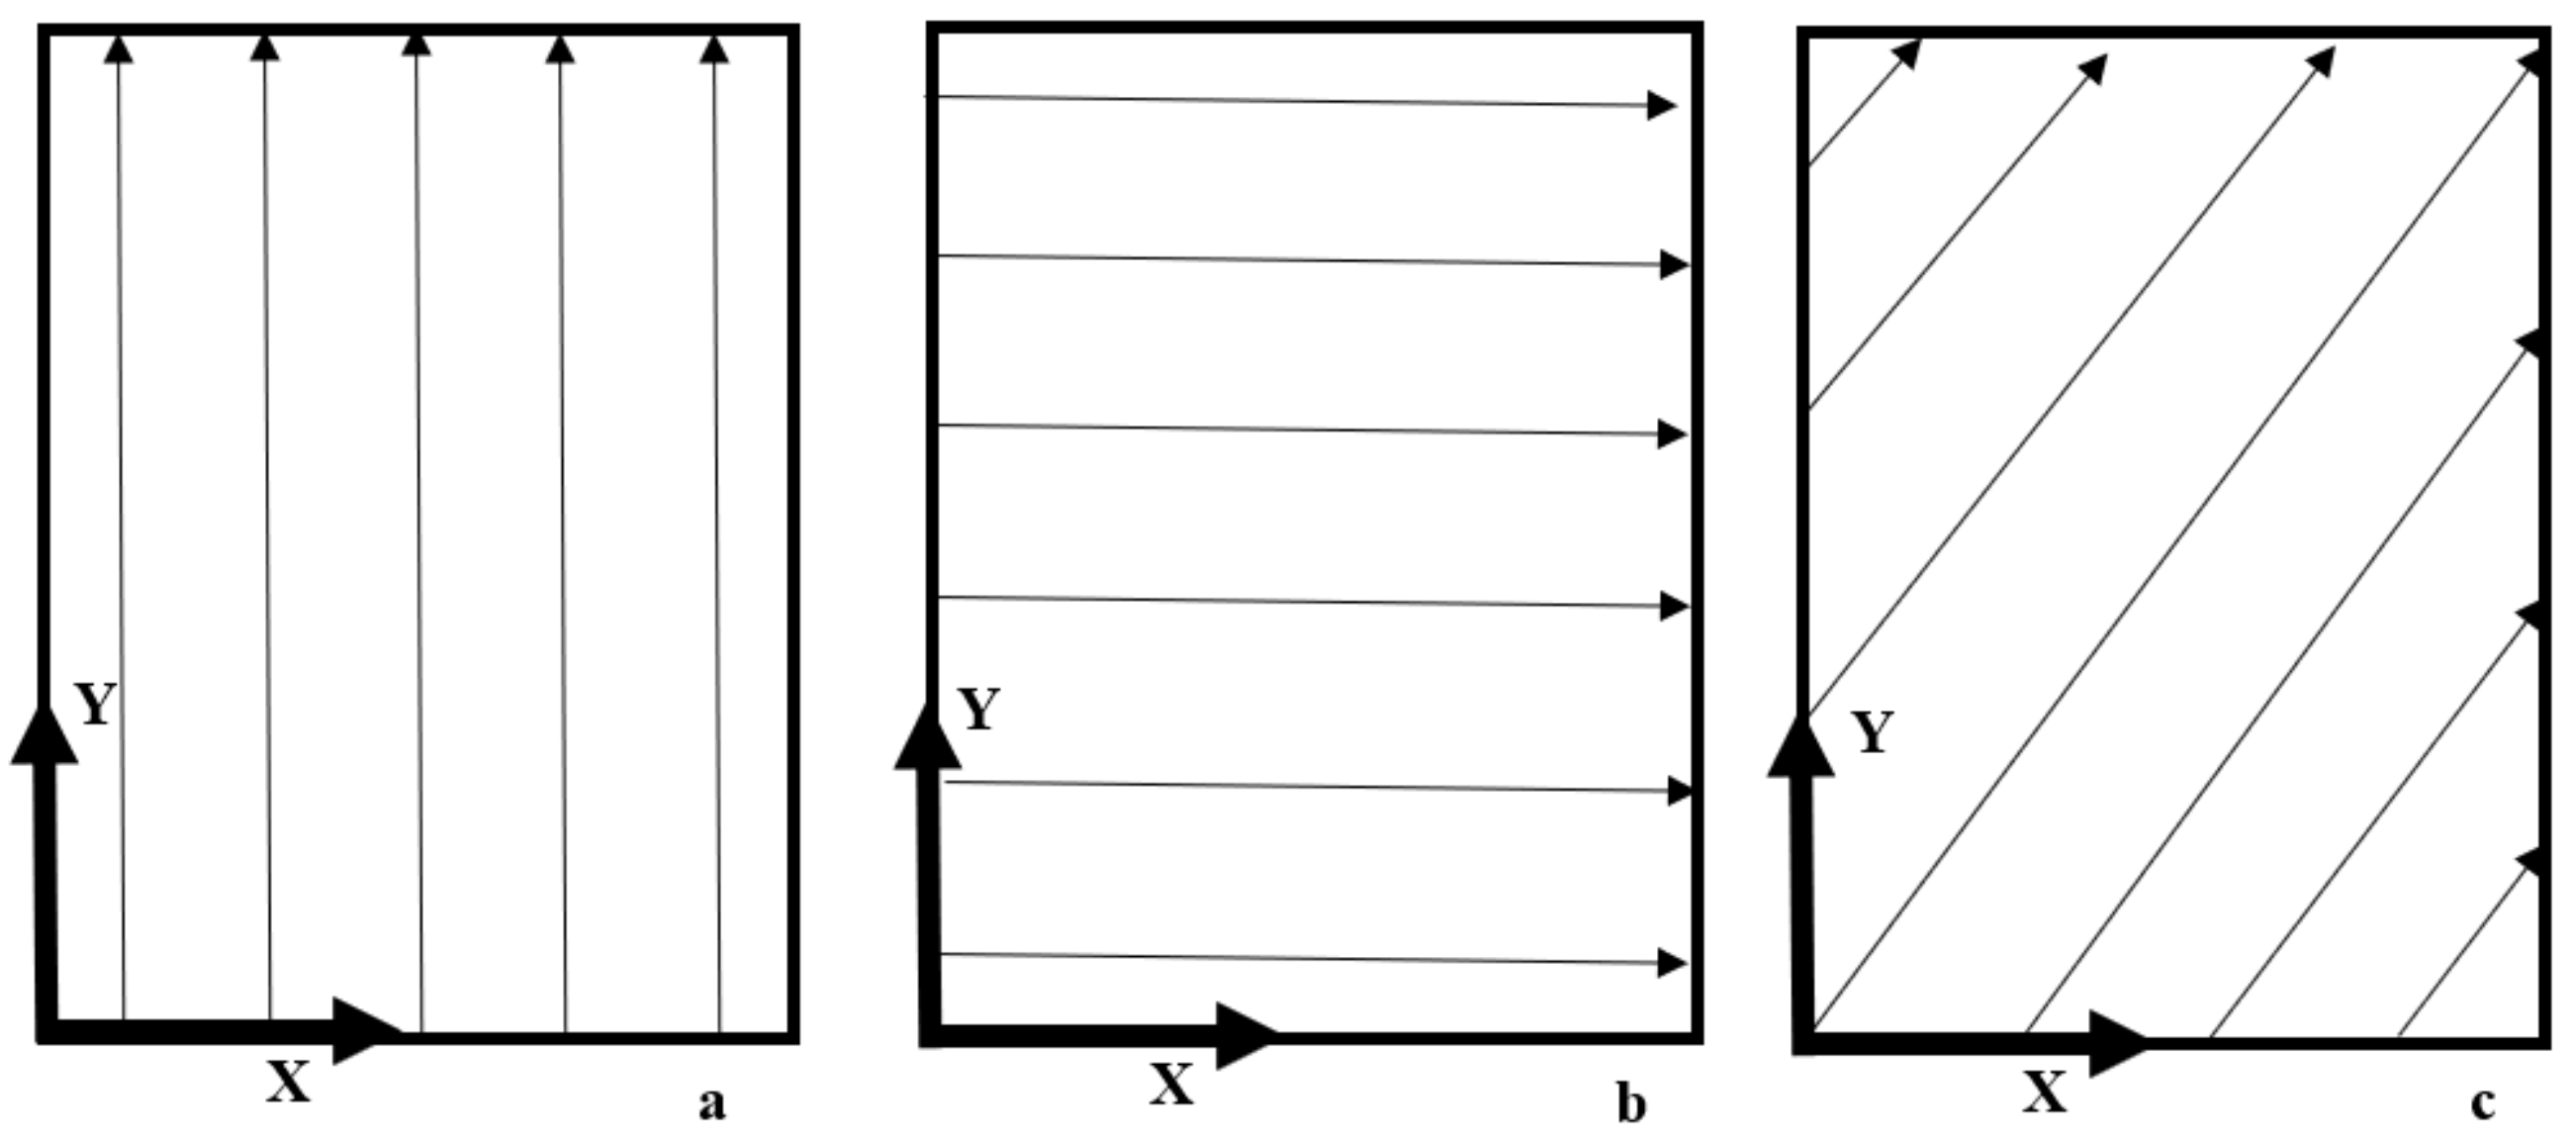
Furthermore, the melt pool dimensions must be accurately controlled to achieve proper overlap between the adjacent scan lines and sufficient depth to bond with the bottom layer. These criteria are conflicting, so the problem of determining a single factor setting to achieve all the desired results is solved by Taguchi-based grey relational analysis (GRA). The generic methodology adopted in Taguchi-based GRA is depicted in Figure 1. The detail of the process can be found elsewhere in the literature [28,29,30,31,32,33,34,35]. The selection of a suitable design matrix depends upon the number of factors, their levels, and the interaction of interest. In this study, three factors, namely laser power (P), scan speed (v), and scan pattern (sp), were each considered at three levels, as shown in Table 1. In this case, P and v are quantitative factors, whereas sp is a qualitative factor. Additionally, sp is a direction along which laser moves, and is pictorially defined in Figure 2. The present study also analyzed the interaction between P, v ( P × v ); P, sp P × s p , and v, sp   v × s p . Therefore, 3 factors at 3 levels and 3 interactions result in the total degree of freedom equal to 18. Therefore, the appropriate orthogonal array for this case is the L27 array. In this array, factors are assigned per the three-level interaction graph depicted in Figure 3. In Figure 3, the column number is indicated by numeric value, and the assigned factor or interaction is written inside the parenthesis.
The problem at hand is to model a transient process consisting of a moving heat source, temperature-dependent material properties, material states, phase changes, and various heat and mass transfer mechanisms. The analysis domain is closely packed with discrete particles, having a non-uniform distribution in size and shape. The laser heat source is applied briefly at a localized area, with the intensity decaying outward from the point of application. There may be variation in the build chamber temperature during the part build. Lower melting point constituents may vaporize, resulting in composition change and, hence, a change in material properties. Spattering at a melt pool or denudation of powder near the laser movement may affect the smooth functioning of the process. In addition, several other complicated, stochastic occurrences and interlink phenomena may not be understood or identified. A large number of complications make the LPBF process simulation a challenging task. Therefore, the model adopted in most studies is a simplified version of the actual scenario [22,23,24,25,26]. The assumptions made in the simulation modelling are mentioned as follows:
  • The present study intends to understand the physics of the process by incorporating changes in the process parameters of interest. Thus, freeform or complicated geometries are neglected to reduce the complexity of the simulation. The part created is a rectangular prism situated in a three-dimensional space.
  • In the LPBF process, powder particles are small and closely packed. While spreading the powder, the re-coater blade or roller vibrates to tap the spread powder, increasing the packing density. Hence, the problem of discrete particle analysis can be simplified by considering the continuous domain of analysis. On the other hand, the effect of bed porosity is not neglected completely, and is incorporated by considering material properties of interest as a function of powder bed porosity.
  • Three heat transfer modes are involved in the process, namely conduction, convection, and radiation. Powder particles are closely packed, and their change in state from powder to the liquid and finally to solid takes place in a minimal time interval. Therefore, this time gap mode of heat transfer within the part by convection and radiation can be considered negligible.
  • Free convection is the only mode of heat loss to the surrounding, and any radiation loss is negligible. This is a fair assumption for the LPBF process, which takes place in an inert environment. The inert gas surrounding the part allows for the convective cooling of the surface of the build and becomes a dominant cause for heat dissipation.
  • Any mode of mass transfer is neglected. Therefore, heat transfer through melt mass transport is not directly simulated in this study.
  • The properties, namely thermal conductivity, specific heat capacity, and density used in this study, are temperature- and powder bed porosity-dependent, but their spatial variation is neglected. Any other material properties are constant, and are not temperature-, porosity-, or position-dependent.
  • Composition and, hence, material property change due to constituent vaporization is not considered.
  • The process is assumed to be continuous without a break, so the cooling period is neglected.
  • Build chamber temperature is assumed constant even in the vicinity of the part.
  • Changes in dimensions due to temperature-induced differences in density, phase changes, or cooling-induced shrinkage are neglected.
The essential elements in simulation modelling (using ANSYS) are as follows: defining the geometry and shape of the domain of analysis, discretizing the domain into elements of finite size, assigning material properties, applying external heat flux, and solving transient thermal analysis problems. Details of these elements are presented in the following sections.

2.1. Geometric Part Model

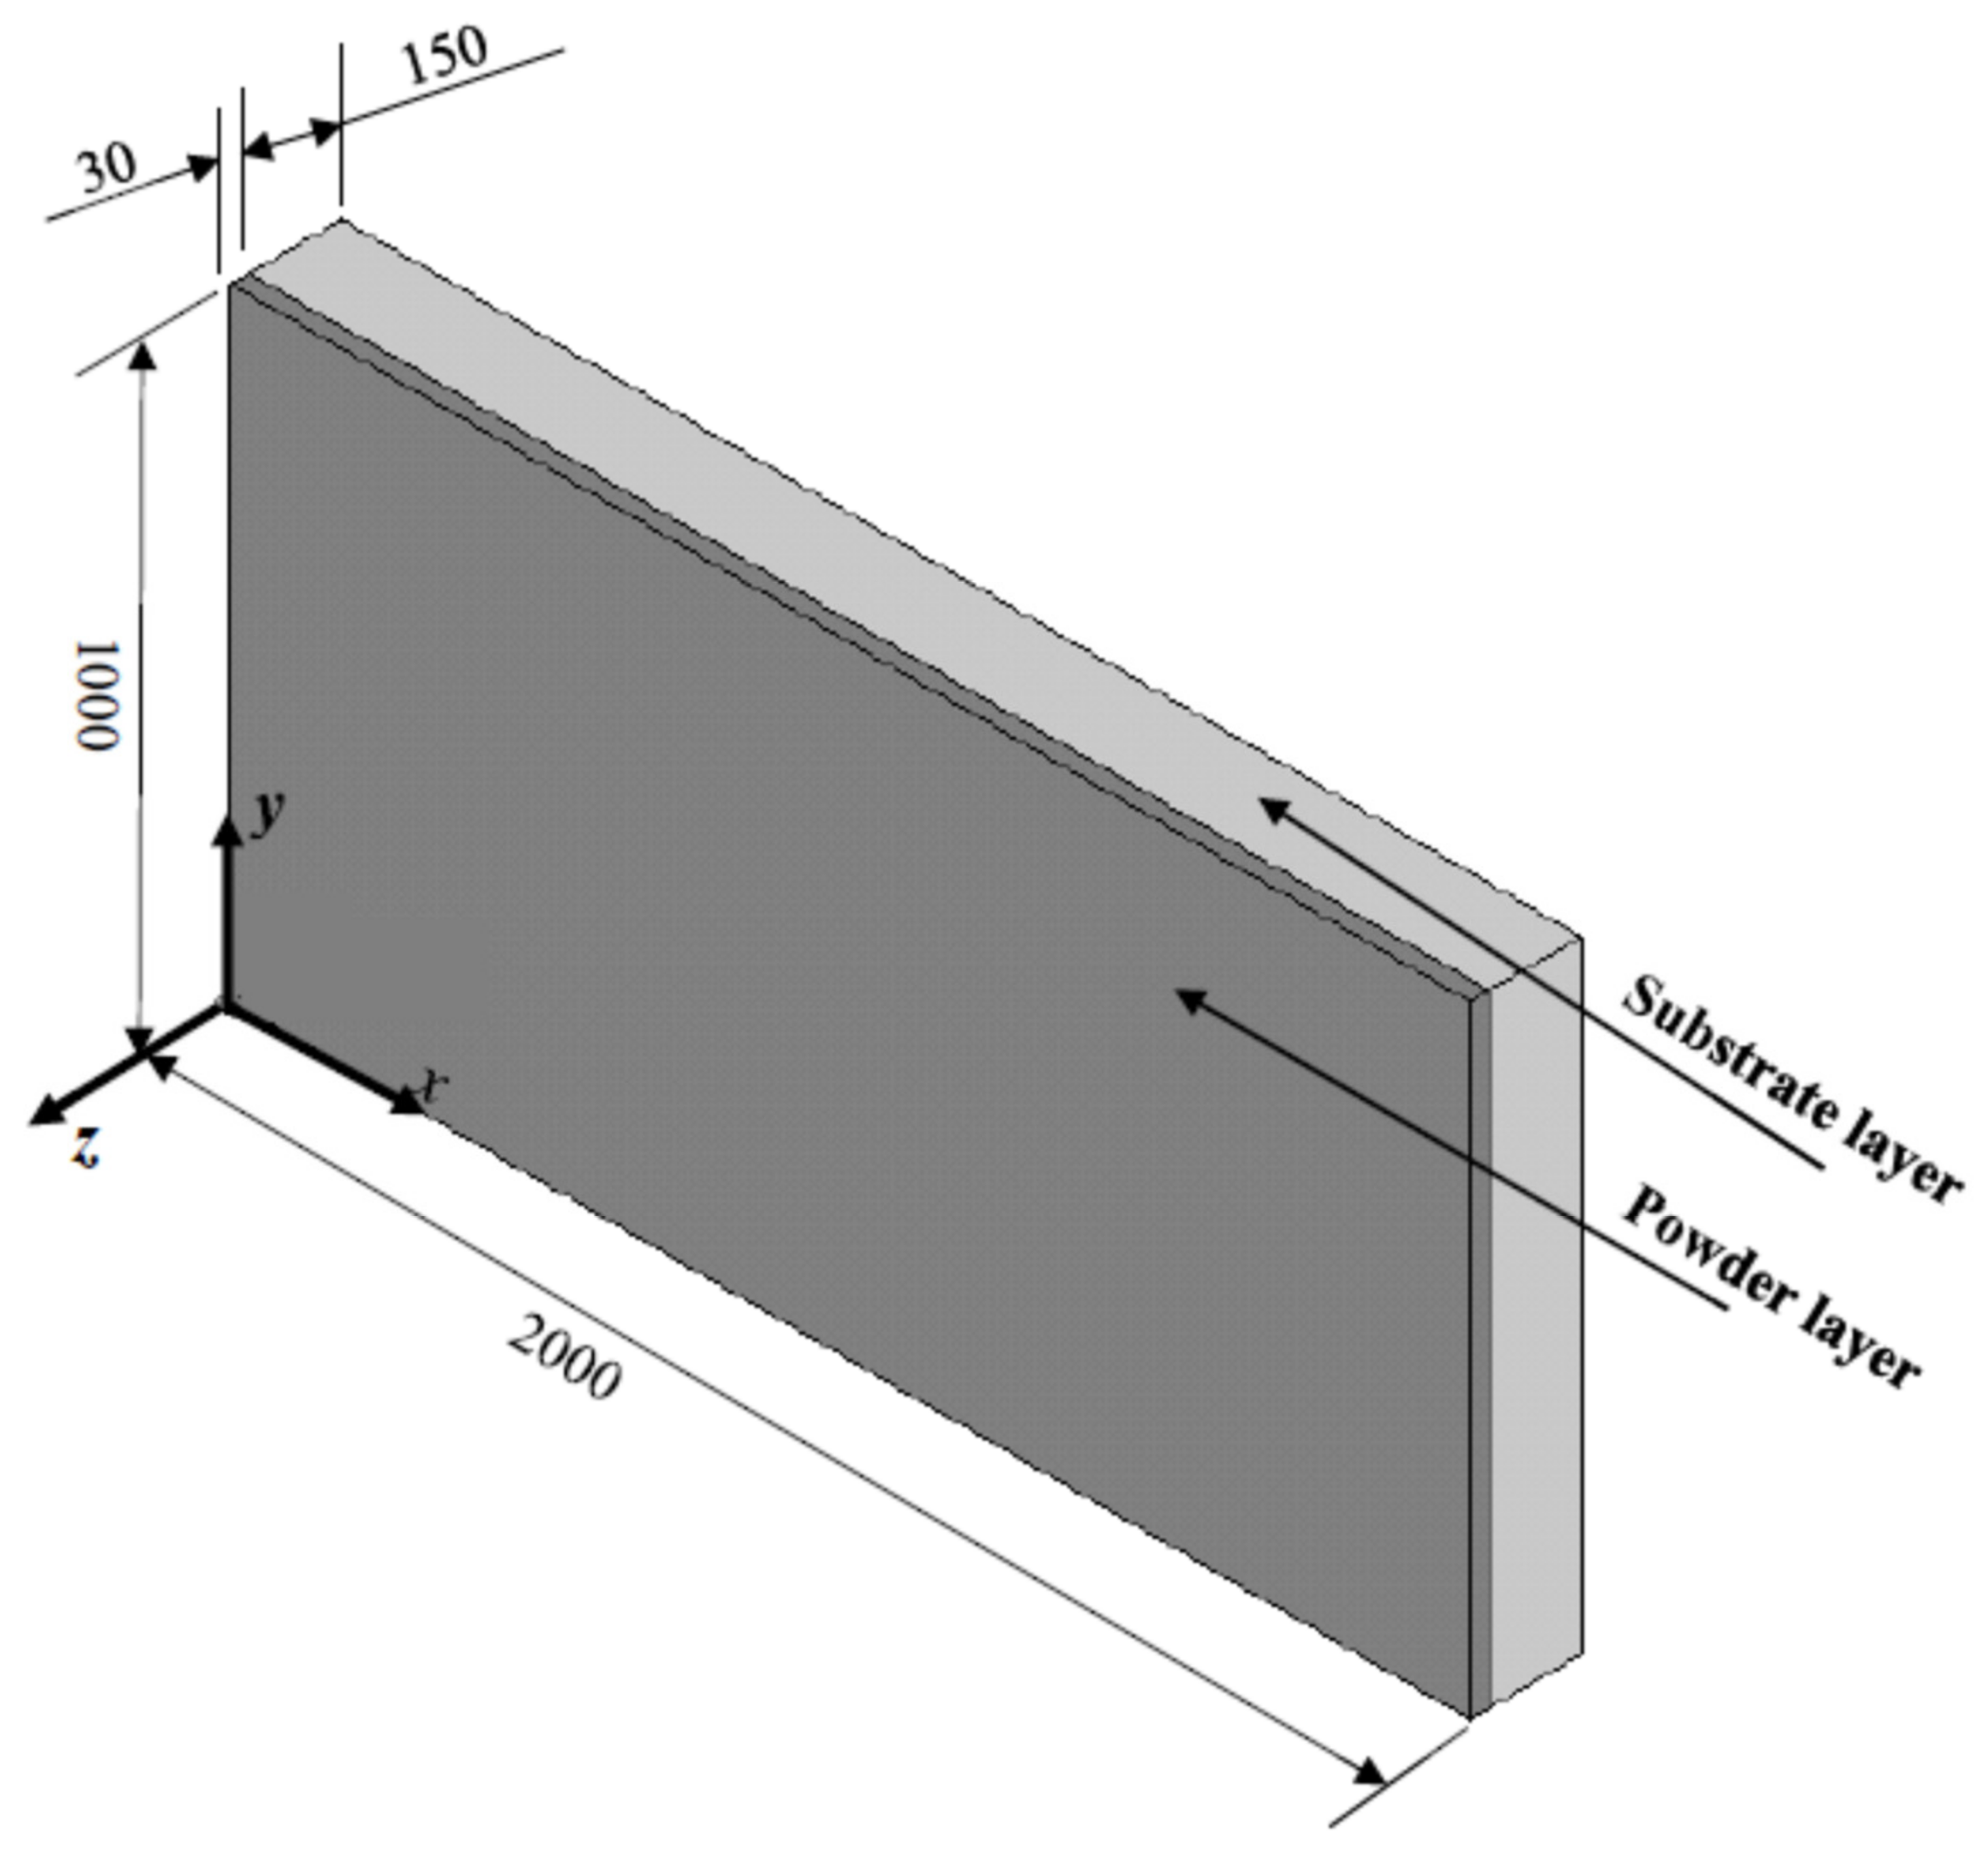
The part geometry used in the study is shown in Figure 4. The bottom layer is a substrate of dimension 2000 μm × 1000 μm × 150 μm, and is made of solid Ti6Al4V alloy. The powder layer of Ti6Al4V alloy deposited over the substrate is the top layer of the part geometry, as shown in Figure 4. The dimension of the top layer is 2000 μm × 1000 μm × 30 μm. It is assumed that the average particle size of the powder is 30 μm [27].

2.2. Part Mesh Model

The accuracy of the finite element-based analysis mostly depends upon the mesh size or the number of elements, and needs to be balanced with the computational time involved. In general, for the LPBF process, it is recommended that element size must be one-fourth of the spot diameter or less. In the present study, the spot diameter of the laser is 200 µm and, based on the convergence of the solution and to reduce the simulation time, the powder bed is a mapped mesh with a meshing size of 15 μm, and the substrate is a mapped mesh with a mesh size of 25 μm. For meshing the powder bed, 20-nodes-solid-90 elements are used, and for substrate meshing, 8-nodes-solid-70 elements are used [36]. Both the elements are applicable for 3D transient thermal analysis with a single degree of freedom, that is, the temperature at each node.

2.3. Material Model

The temperature in LPBF varies from hundreds to thousands of kelvin. Most of the material properties of interest within these temperature ranges, namely specific heat, thermal conductivity, and density, change drastically [37]. Additionally, the properties and behaviour of a powder material are entirely different from the bulk material [7]. For solid Ti6Al4V alloy, temperature-dependent material properties are given in mills [37]. For powder, properties are different from the bulk, and mainly depend upon the porosity, entrapped gases, and phase change from powder to the liquid and finally to solid [38]. Empirical relations relating powder and solid material properties used in the present study are given in Equation (1) for effective powder density ( ρ e ), Equation (2) for adequate powder-specific heat ( C e ), and Equation (3) for effective powder thermal conductivity ( K e ).
ρ e = 1 ρ s 1 + × ( T T s o l / ( T l i q T s o l ) ) ρ s ρ s T o T T s o l                             T s o l < T < T l i q T T l i q
C e = 1 C s + C a C s + 2 L f × ( T T s o l ) / T l i q T s o l 2 C s + 2 L v × T T l i q / T v T l i q 2 T o T T s o l                             T s o l < T < T l i q T T l i q
K e =                                           0.1 K s                                                                       T o T T s o l K s l i q K s s o l T l i q T s o l T T s o l + 0.1 K s s o l K s                                                                                                                 T T l i q                   T s o l < T < T l i q
In these equations, K s , C s , and ρ s are thermal conductivity, specific heat, and density of solid material, respectively. Additionally, T is the temperature at any instant during the simulation, and To, Tsol, Tliq, and Tv are initial, solidus, liquidus, and material evaporation temperatures, respectively. Latent heat fusion is Lf, and Lv is the latent heat of evaporation. The powder bed porosity is , and C a is the temperature-dependent specific heat of air. Finally, K s s o l and K s l i q are the thermal conductivity of bulk material at liquidus and solidus temperature, respectively.

2.4. Heat Source Model

In the LPBF process, the laser beam scans the powder layer’s top surface. The powder distribution may result in irregularity and voids, which may cause multiple reflections of an incident ray attenuating the amount of the incident energy, and partial absorption of a laser. When the powder particles are small and fairly distributed, most of the laser energy is absorbed by the skin of the uppermost powder particles. Only a small amount is transferred downward because of the 3D nature of laser reflection. The most common mode of energy transfer between the powder particles and the surface beneath is conduction [8]. Thus, the laser beam’s intensity is considered the surface heat flux. This surface heat flux depends upon the laser power and beam radius, and follows the Gaussian distribution of the fundamental mode given by the following Equation (4) [7]:
q x , y , t = α P π r o 2 exp 2 x v x t 2 + y v y t 2 r o 2
where q is the surface heat flux, α is the laser absorptivity, P is the laser power, ro is the beam radius, t is the time, and vx and vy are scan speed components along the x and y directions, respectively, defined as v x = v c o s θ   and v y = v s i n θ . Furthermore, v is the scan speed, and θ is the angle of inclination of scan direction with the x-axis. In the present study, for X the scan pattern θ = 0 , for Y the scan pattern θ = 90 o , and for XY the scan pattern θ = 45 0 .

2.5. Thermal Model

The governing equation, i.e., Equation (5) [39], used in the present analysis is a 3D heat transfer equation for isotropic material with the assumption that there is no internal heat sink or heat generation. It is shown as follows:
ρ C T t = K 2 T x 2 + 2 T y 2 + 2 T z 2
where, T is the temperature and function of position and time t; ρ , C and K are temperature-dependent density, specific heat, and thermal conductivity, respectively.
The initial condition for this second-order boundary value problem is given by Equation (6), as follows
T x , y , z , 0 = T o
where, T o is the powder bed preheat temperature assumed to be the same as the constant build chamber temperature.
Convection heat loss ( q c ) from the surfaces of powder bed and substrate is represented by Equation (7), as follows.
q c = h c T s u r f T o
where, h c is the convection heat transfer coefficient and T s u r f is the surface temperature.

2.6. Simulation

In total, 27 simulations were conducted per the experiment plan in Table 2. The data used to calculate the material properties of powder Ti6Al4V [40] and the process parameters kept constant in the simulation are given in Table 3. The powder surface is scanned with the unidirectional movement of the laser. For the first scan line, simulation starts with an assumed initial condition. However, for successive scans, temperature distribution generated from the previous movement of the laser is taken as an initial condition.
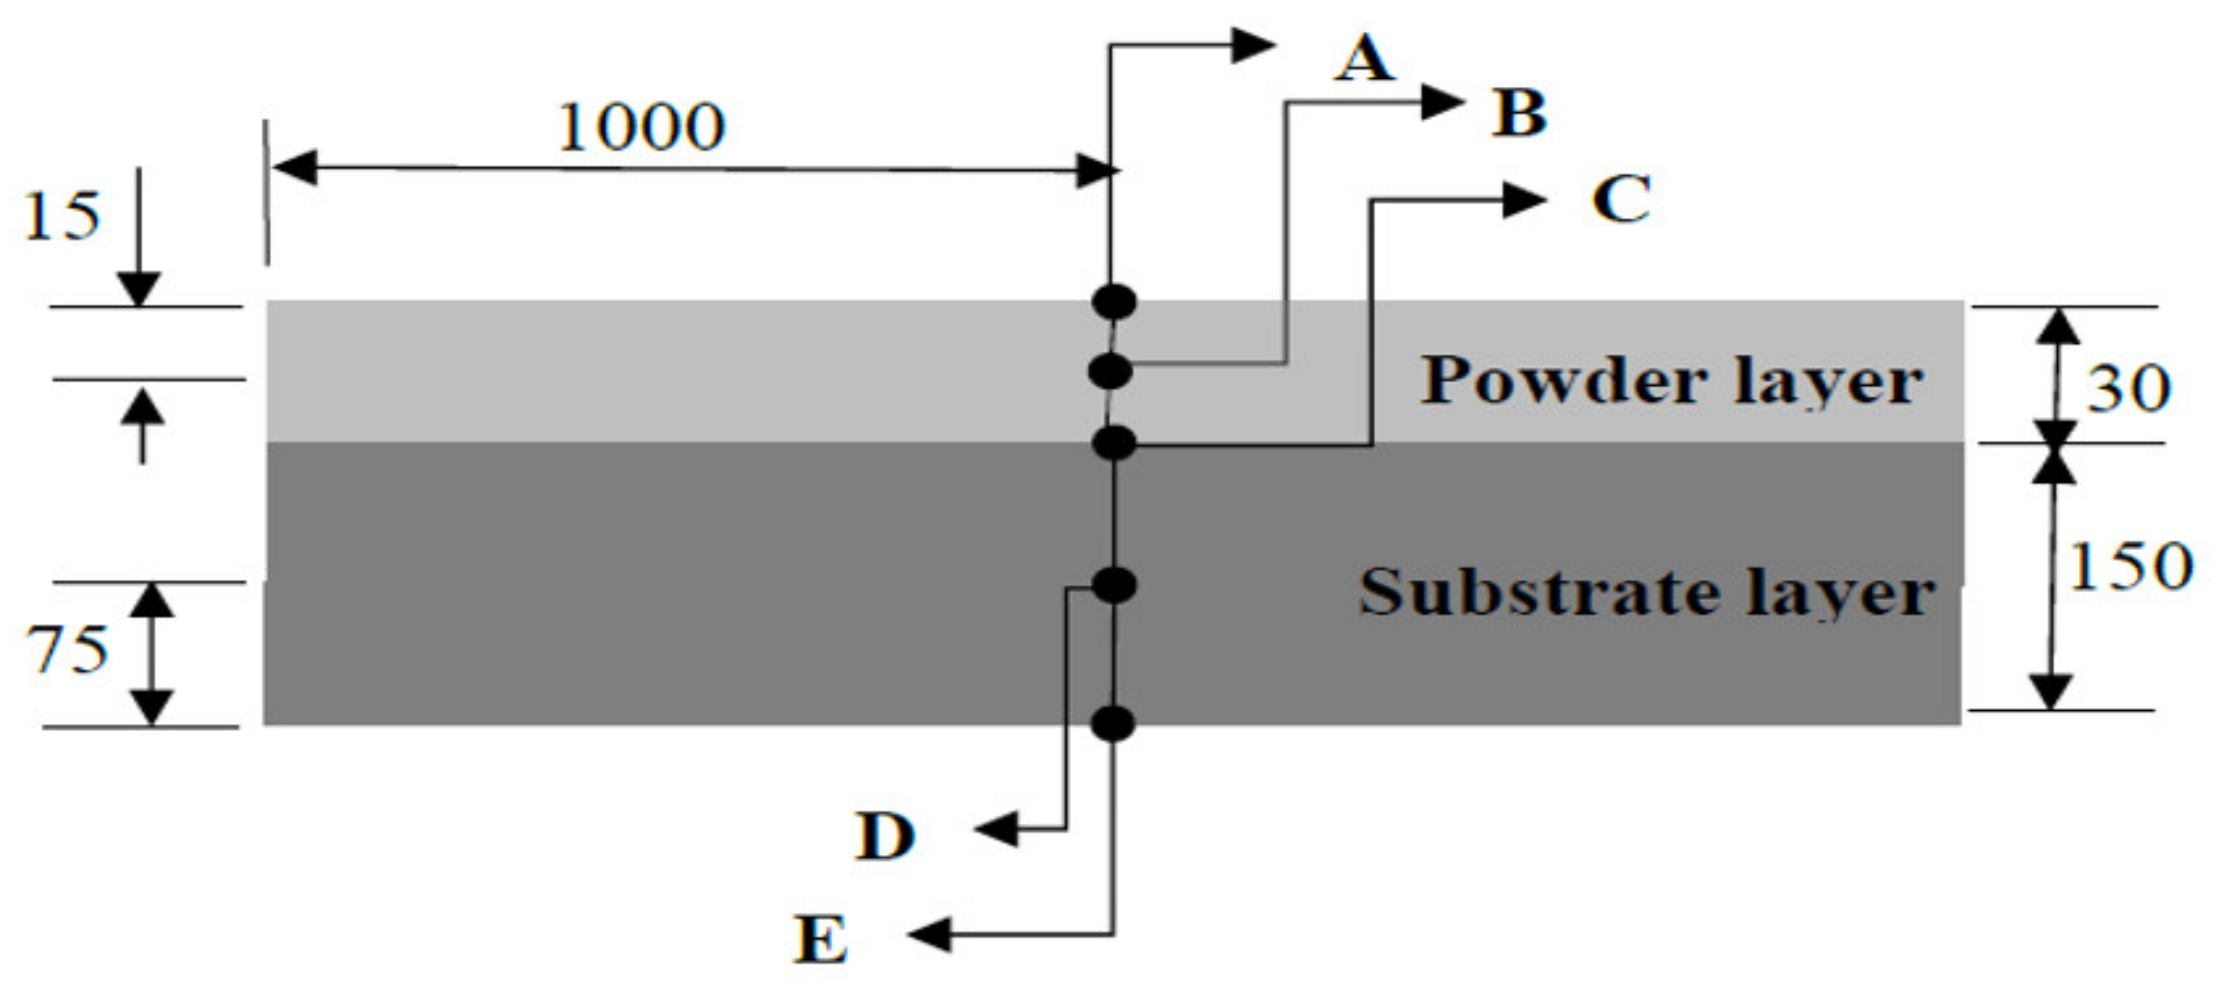
The temperature at five points, namely A, B, C, D, and E (refer to Figure 5), is calculated for each simulation. These points are located in the middle of the layer, and are in the same vertical plane.
A melt pool is defined as a region of a heat-affected zone having a temperature more than the Tsol of the material. The dimension of the melt pool along the scan line is considered as its length (l). Melt pool width (w) is measured perpendicular to the scan direction along the line passing through the centre of heat flux application. Both the l and w of melt pool are measured in the plane of heat flux application. Depth (d) of the melt pool is also measured from the centre of heat flux, but in the downward direction perpendicular to the plane of heat flux application.
For a complete powder melting, any temperature value higher than this desired minimum is a waste of input energy, and is responsible for residual stress development and part build failure. The higher surface temperature may induce instability in the melt pool and result in a keyhole mode of heat transfer. For the complete melting of powder and proper fusion with the bottom surface, d must be greater than the layer thickness (lt). Excessive melting of bottom layers may induce residual stresses, distortion in the part, and the formation of cracks, pores, and a non-uniform microstructure. Therefore, d must be in between lt and twice lt. As no guiding principle is available, in the present case, the superior value of d is taken as equal to lt. For adequate overlapping of melt pools of successive scan lines, the ideal value of w must be more than the hatch spacing (H) [41]. This implies that the difference between w and H must be maximized.
Similarly, for sufficient overlapping of successive melt pools along a scan line and to prevent excessive heating, l is equal to the laser beam’s spot diameter (2ro). The ANOVA and main effect plots determine significant parameters, interactions, and parameter levels. The obtained results show a different set of optimum and significant parameters and interactions for each studied response, each at a different level. Therefore, to select the process setting which optimizes all the studied responses simultaneously, GRG is calculated.

3. Results and Discussion

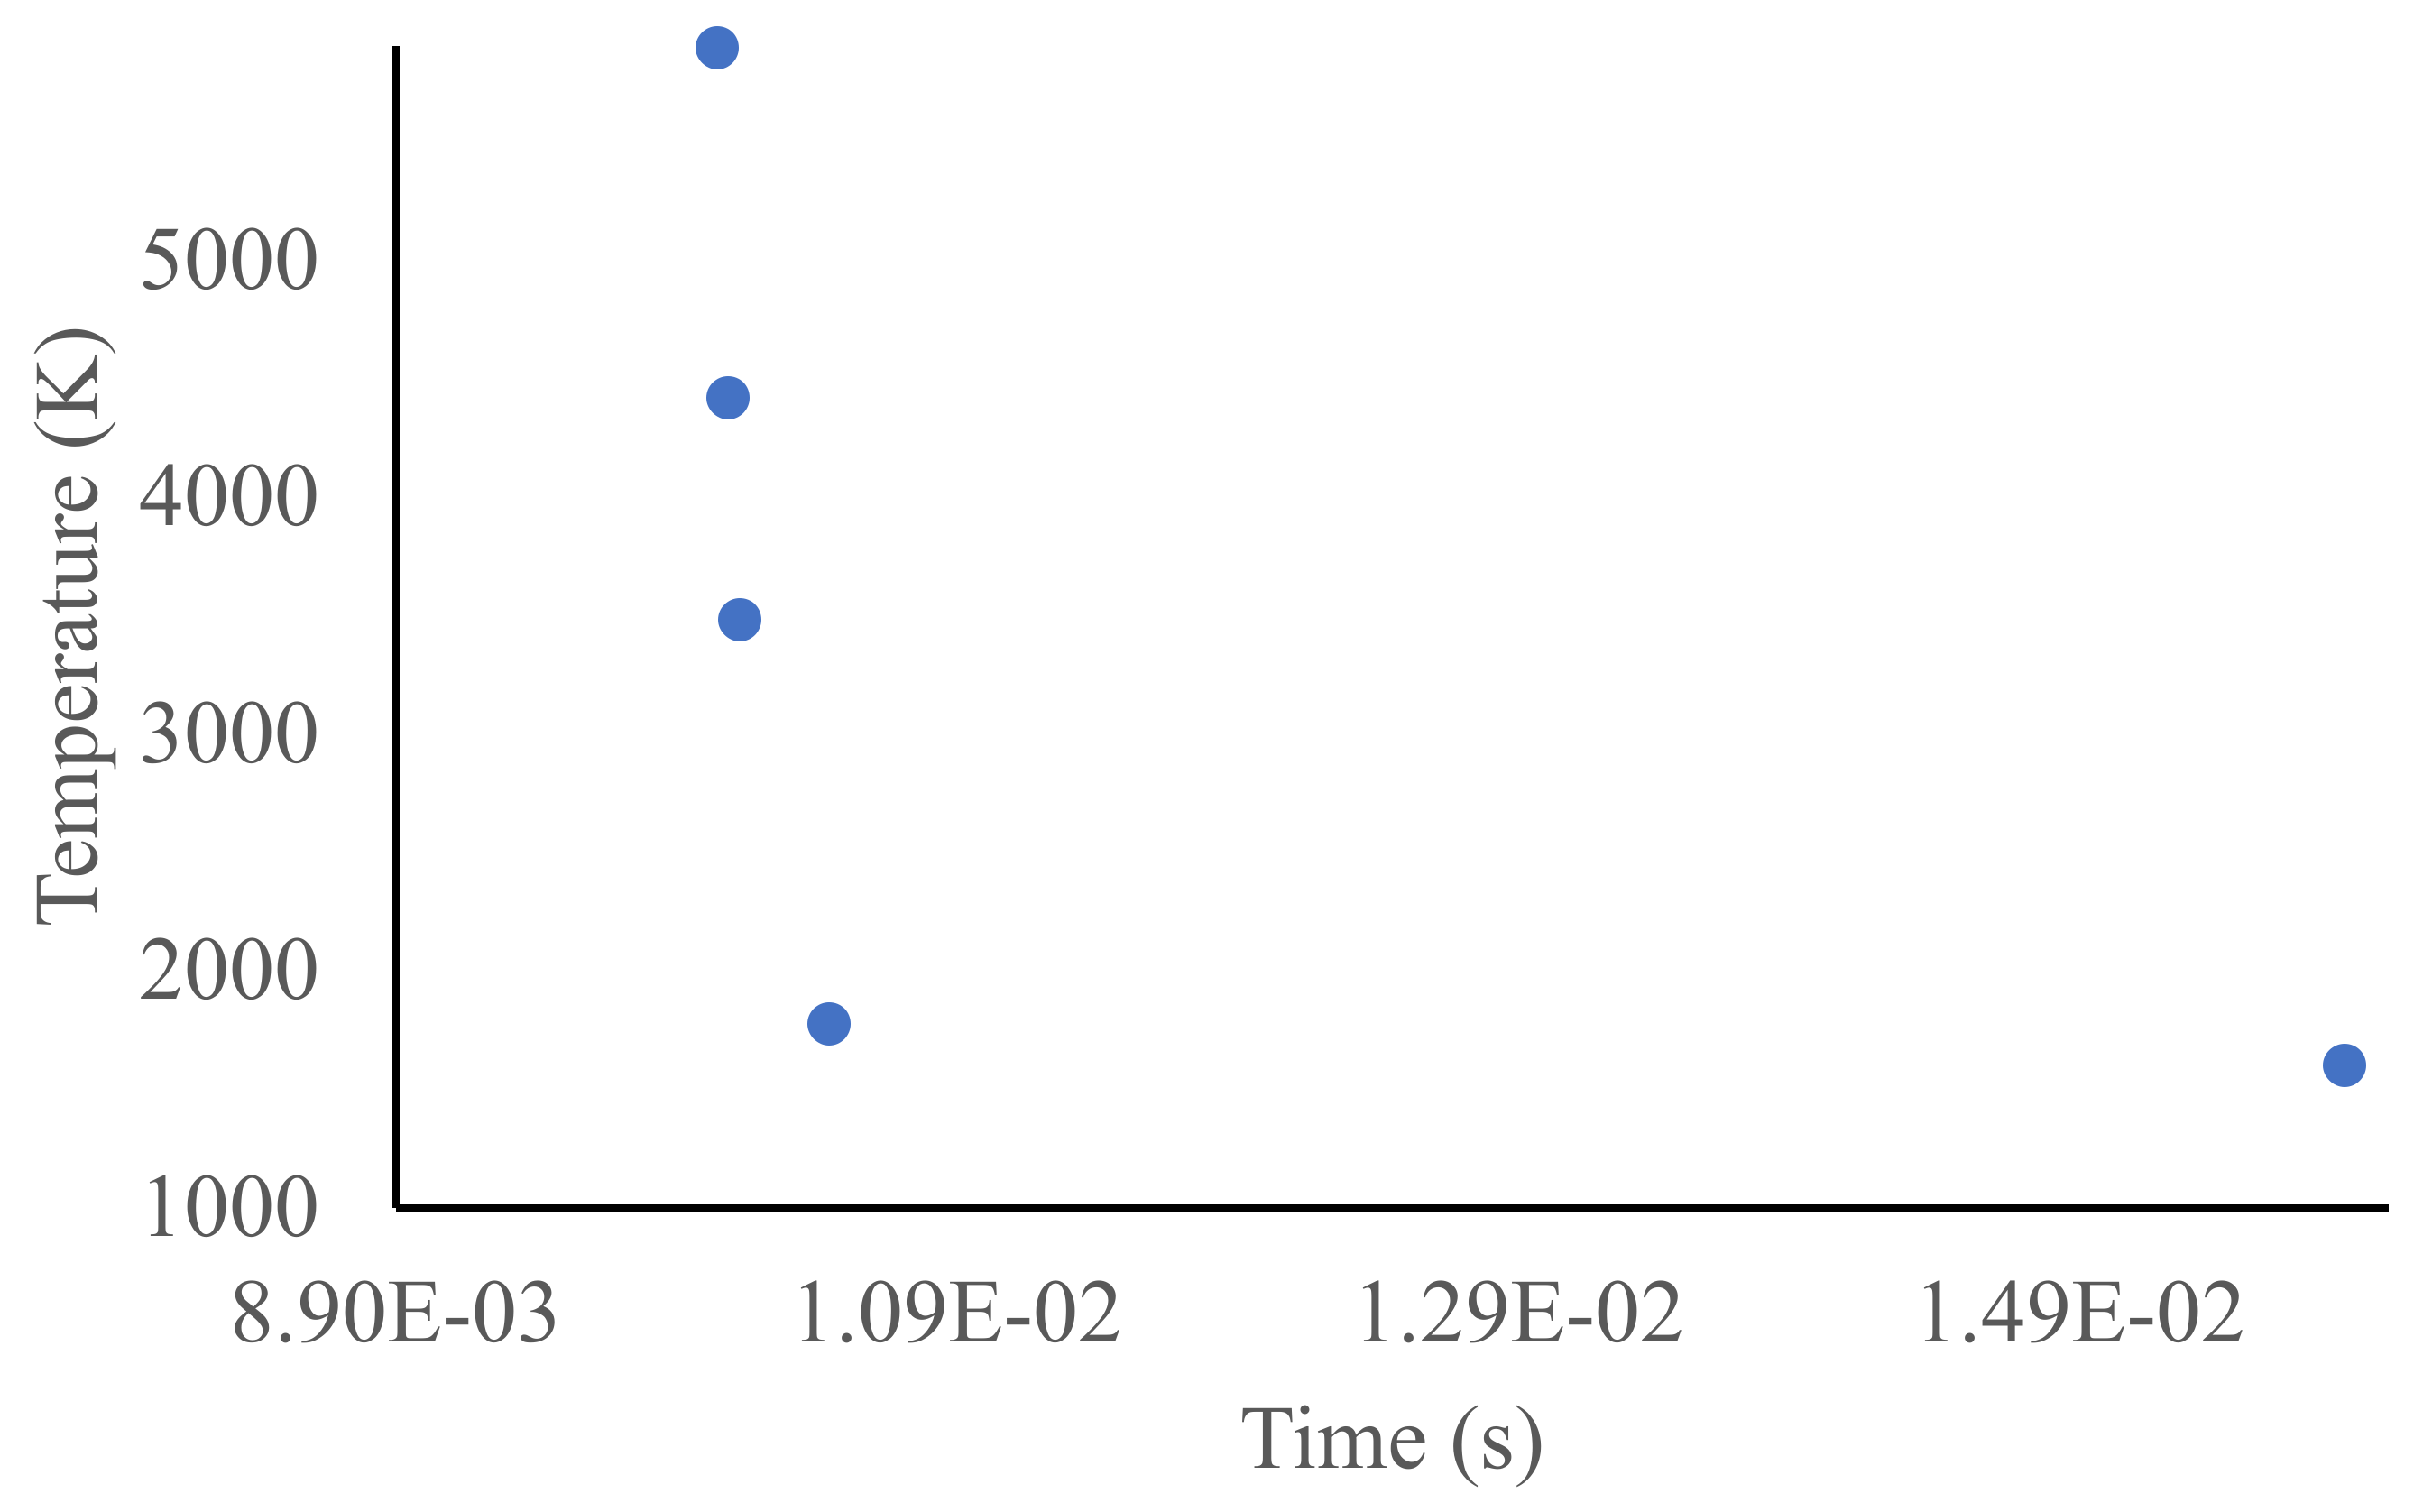
Variation of temperature with time at five points of interest, namely A, B, C, D, and E, is shown in Figure 6. It is observed from Figure 6 that the temperature at these points increases as the laser moves closer to them and then decreases with the movement of the laser away from them. Thus, the temperature of point A is at its maximum when the laser is above it. For points B, C, D, and E, the temperature is at its maximum after a certain time lag from when the laser is vertically above them (refer to Figure 7). As shown in Figure 6, for low scan speed, the temperature rise is not gradual but takes place in small steps. For high scan speed, temperature increases gradually, showing a sudden sharp rise and falling when the laser crosses point A. After a specific time interval from when a laser crosses the middle of the layer, the temperatures of all the points A, B, C, D, and E tend towards the same value and become constant but higher than the initial temperature. In all the cases, the temperature of points above the interface (point C) is more than the liquidus temperature.
From the above discussion, it can be inferred that temperature increases as the heat source moves closer to the points of interest. This increase is greater if the heat source moves slowly, increasing the heat application time. Moreover, there is no cooling period considered; hence, temperature decreases because of the movement of the heat source away from the points. The powder has a lower thermal conductivity and, therefore, conducts less heat downward, resulting in a lower temperature in the lower portion and a time lag between the maximum temperatures of A, B, C, D, and E.
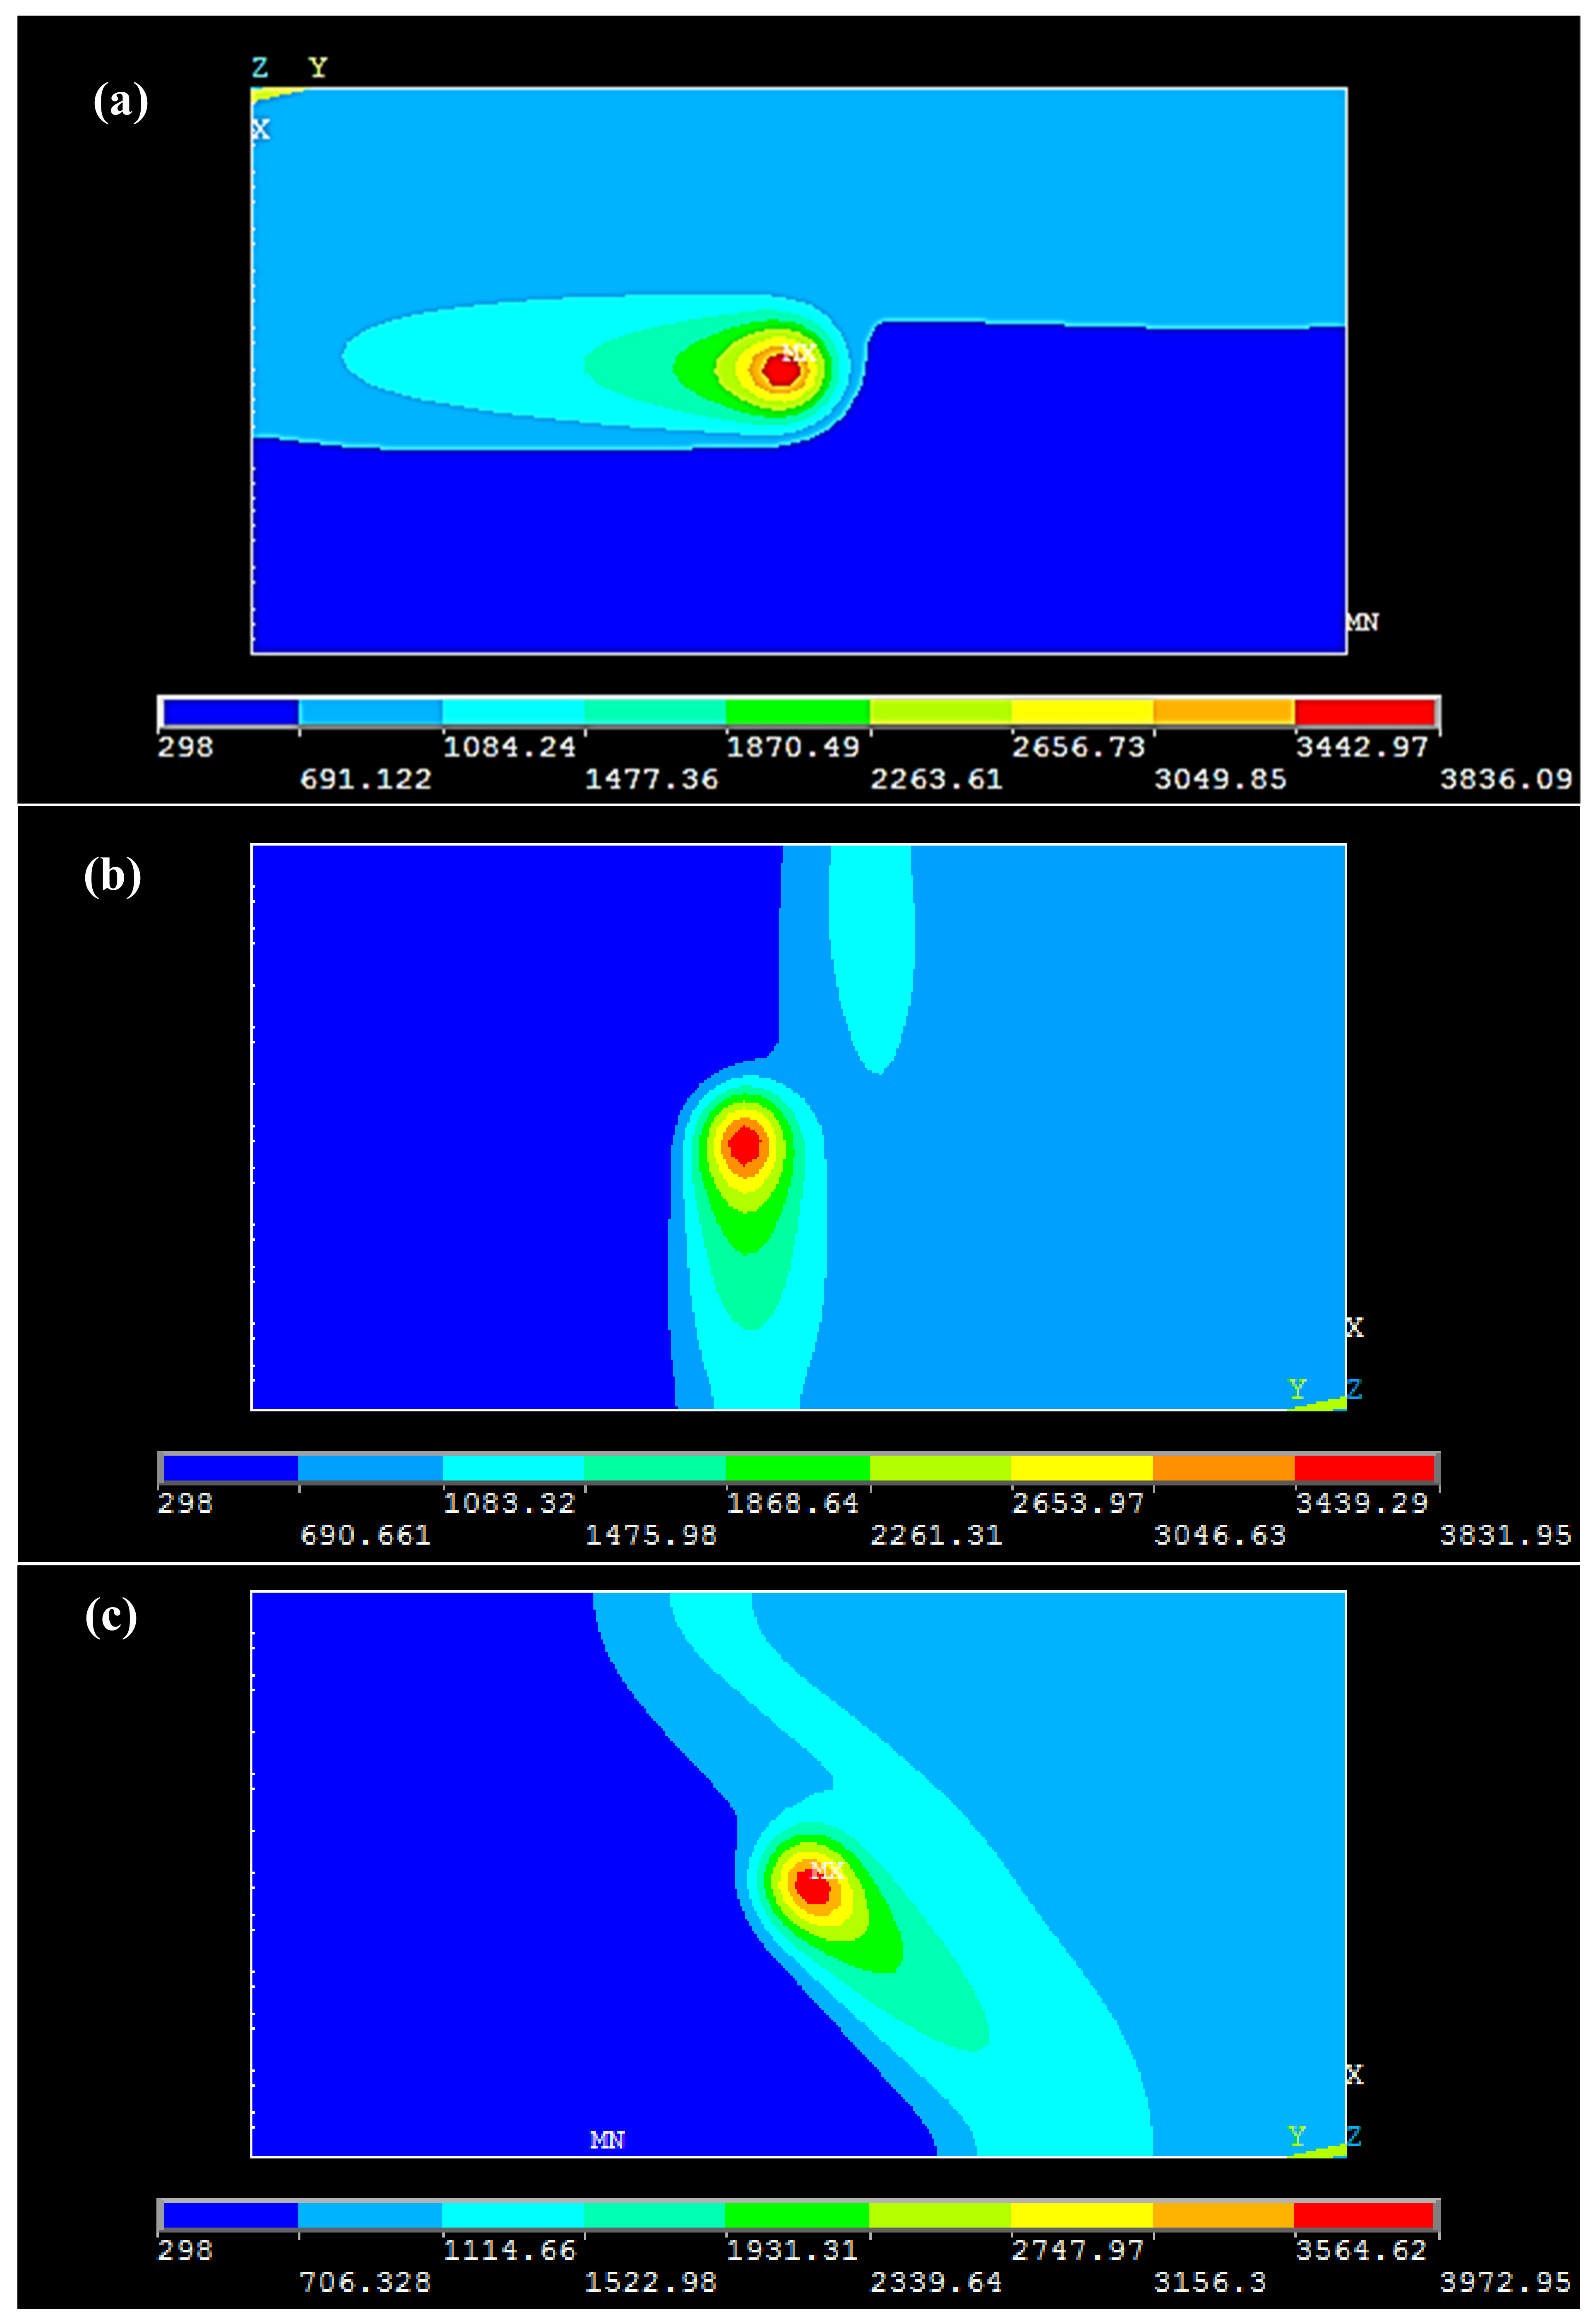
The heat-affected zone for the three-scan pattern is shown in Figure 8. It can be observed that the melt pool is slightly enlarged at the front (the direction of movement of laser) and tapers in the backward direction. Temperature variation along the length (l), width (w), and depth (d) of the melt pool are shown in Figure 9. The temperature is at its maximum at the center along the l direction but decreases on both sides from the center (Figure 9a). This decrease is sharper on the right (on the front of laser movement), whereas there is a gradual temperature decrease on the left. The temperature gradient along the w is slightly higher in the right (the unscanned region of powder layer) compared to the left (Figure 9b). The temperature decreases along with the d from top to bottom (Figure 9c).
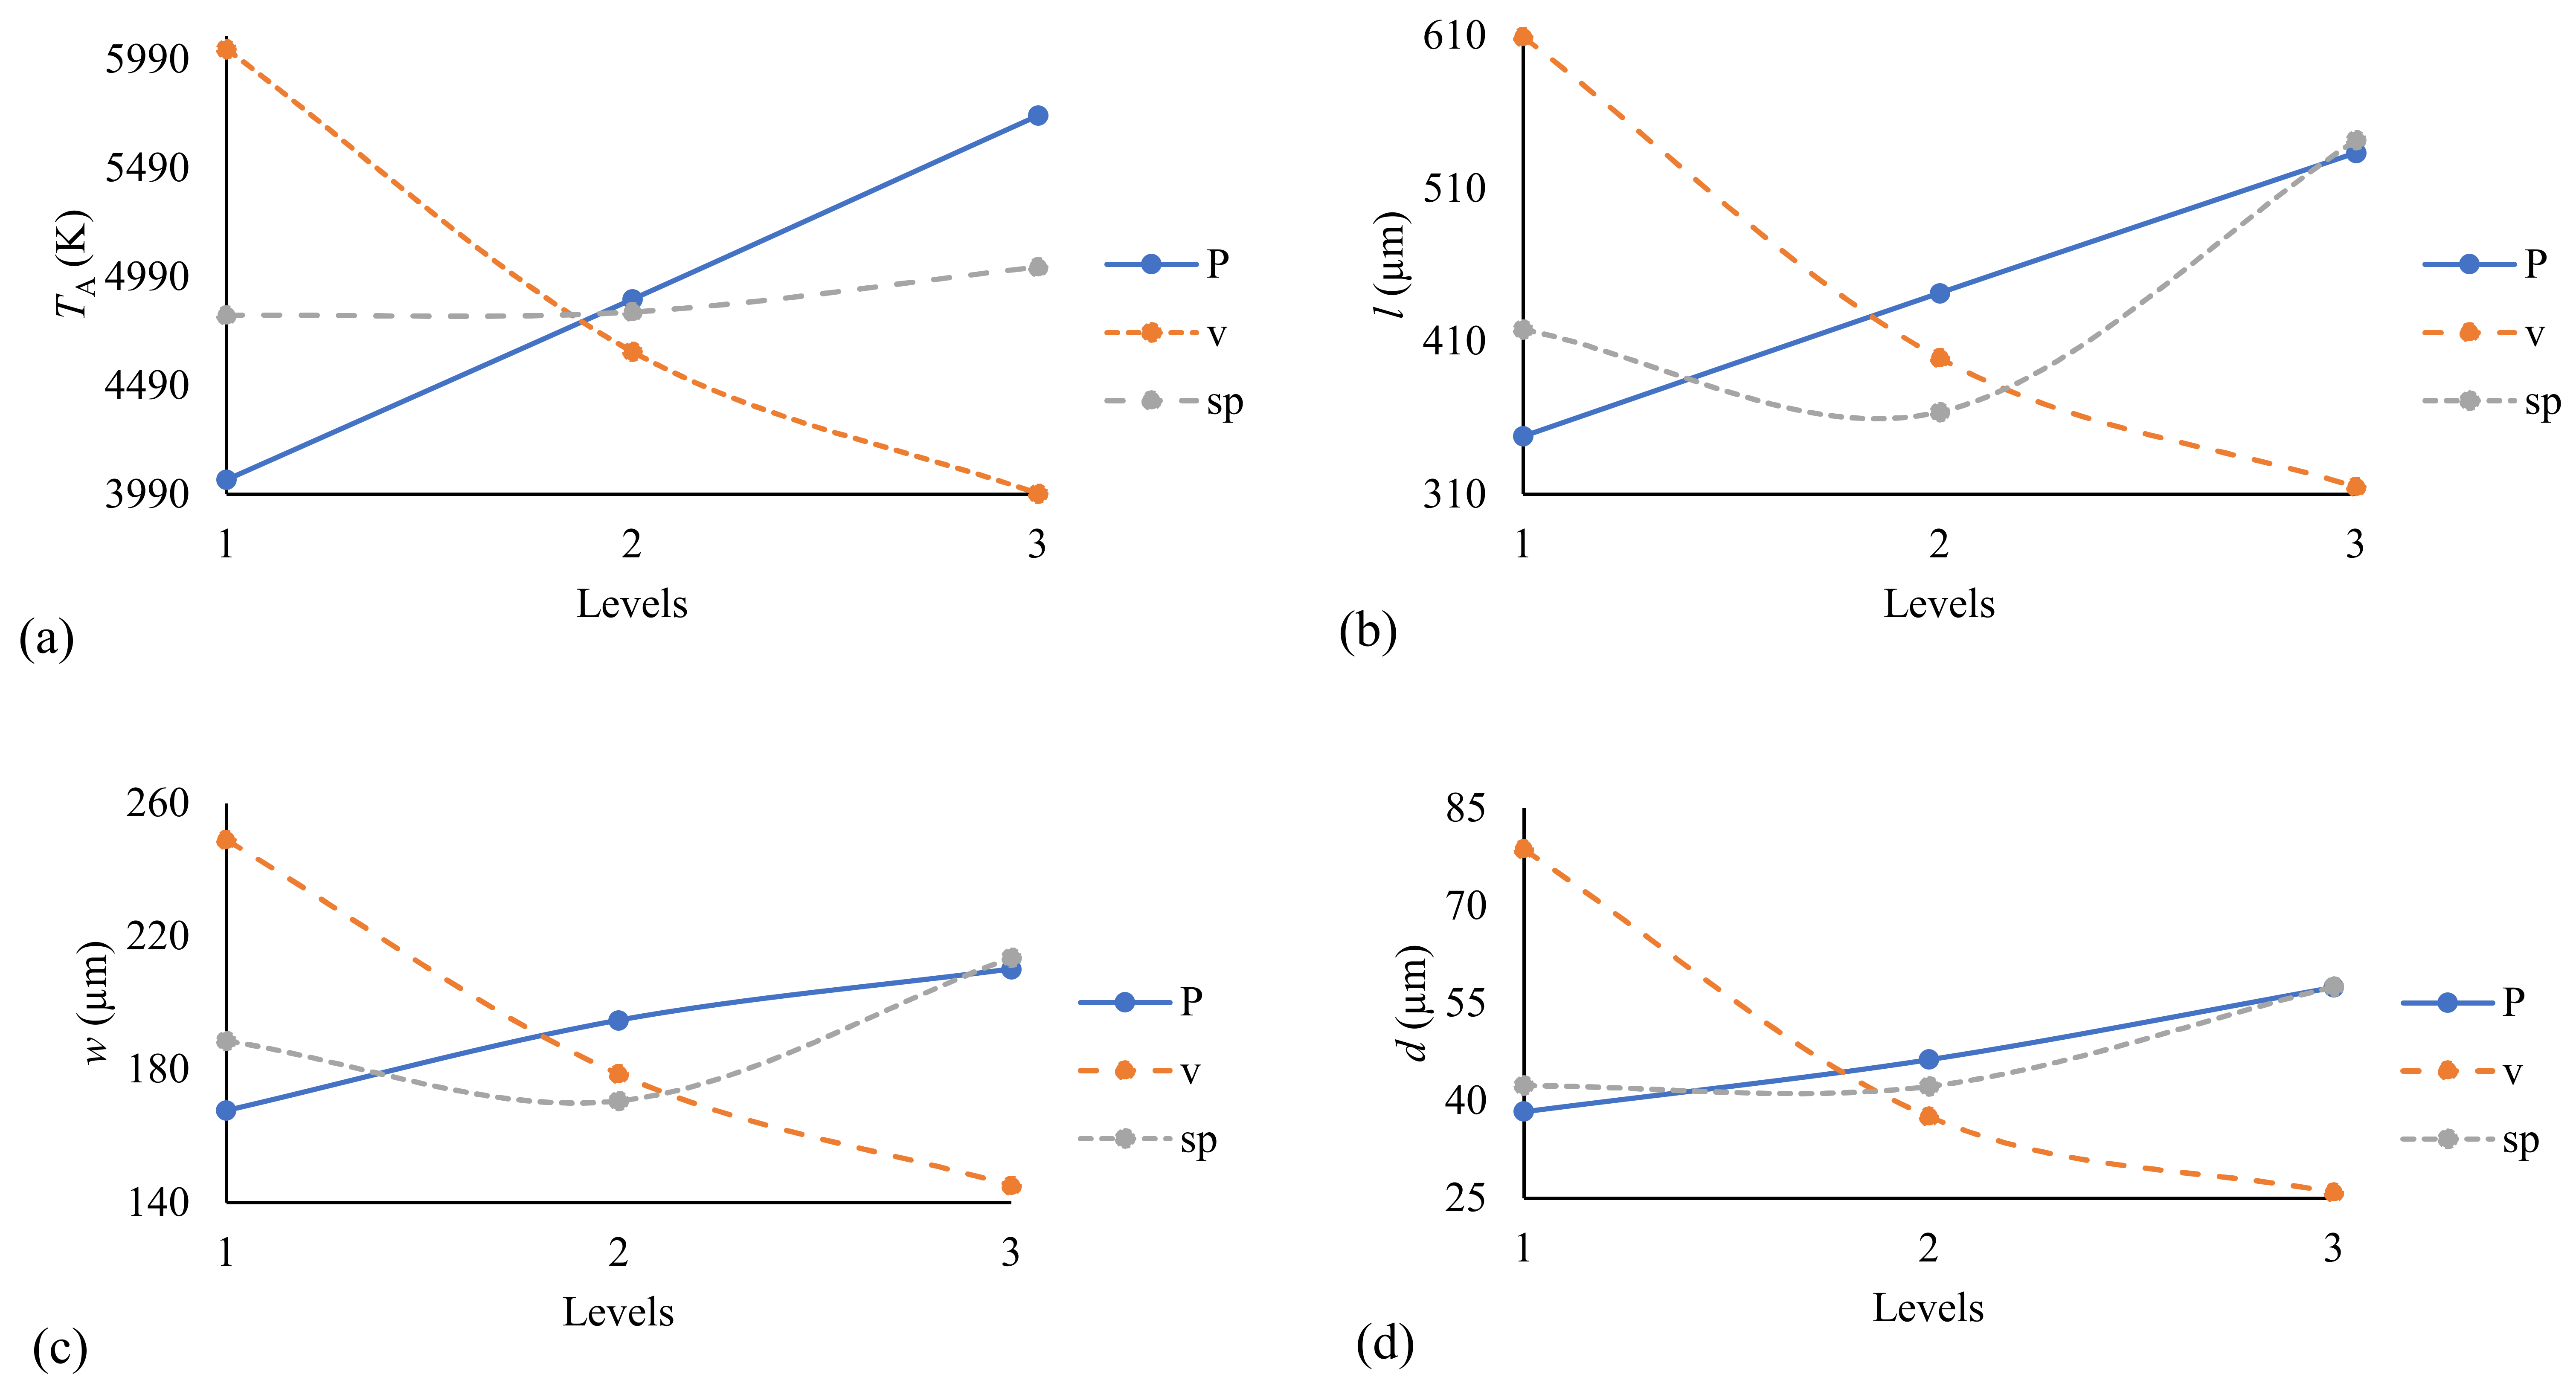
This non-uniform temperature variation and melt pool shape is related to the excessive heat concentration because of the poor thermal conductivity of the powder on one side of the melt pool compared to the other, where the material is in a solid/liquid state. When the laser center is at location A, the maximum temperature (TA), l, w, and d are determined and presented in Table 2. The results are in agreement with the simulation work performed by Huang et al. [42] and Romano et al. [7], and the temperature predicted is within the range obtained by Verhaeghe et al. [43] experimentally. Variation of TA, l, w, and d concerning P, v, and sp is presented in Figure 10. Levels 1, 2, and 3 correspond to low, medium and high values of the selected process parameters P, v, and sp, respectively, and are given in Table 1. From Figure 11, it is observed that with an increase in P, all responses increase linearly except w, which shows a nonlinear increase. Furthermore, it is also observed that an increase in v results in a nonlinear decrease in all the studied responses. These observations are attributed to the absorbed energy density, which is proportional to P v [26]. Higher energy density corresponds to more heat input into the system, resulting in excessive melting. Thus, the melt pool is large with high P or low v. The temperature variation depends upon the scan vector length and number of scan lines. A shorter scan length deposits more heat than a longer scan length. Based on the part geometry considered, the scan length and the total number of scans vary, with X-scan having considerable scan length but fewer scans, followed by Y-scan having less scan length but many scans compared to X-scan. Compared to both X and Y-scan, the XY-scan has more scans with varying scan lengths and, as a result, this scan pattern produces a more significant maximum temperature than the other two scan patterns.

Grey-Taguchi Results

The ANOVA of the experimental results presented in Table 2 is carried out, and its results are presented in Table 4. The significance of each term in the ANOVA table is considered at a 95% confidence level (α = 0.05). It is evident from Table 4 that, for TA and d, all the studied factors and their mutual interactions are significant. However, for l and w, only P, v, sp, and v × sp affect the variation of results and are significant.
The objective of the present study is to minimize TA, to maximize the difference between w and H (w-H), and to consider l and d equal to ro and lt respectively; hence, w-H, TA and l, d are normalized. These respective normalized values, namely T ^ A (normalized value of TA), l ^ (normalized value of l), w ^ (normalized value of (w-H)), and d ^ (normalized value of d) are presented in Table 5. The normalization makes the desired value of each studied response equal to 1 or close to 1, whereas the worst value is zero or close to it. For converting these multiple responses into a single response, GRG is calculated and presented in Table 5.
The ANOVA results on the normalized values of the responses are presented in Table 6. In this table, the percentage contribution of individual terms on the studied response variation concerning factor level change was determined using Equation (8), as follows:
% c k = S S k S S T × 100
where % c k is the percentage contribution of kth term whose sum of square deviation is SSk, and SST is the total sum of a square.
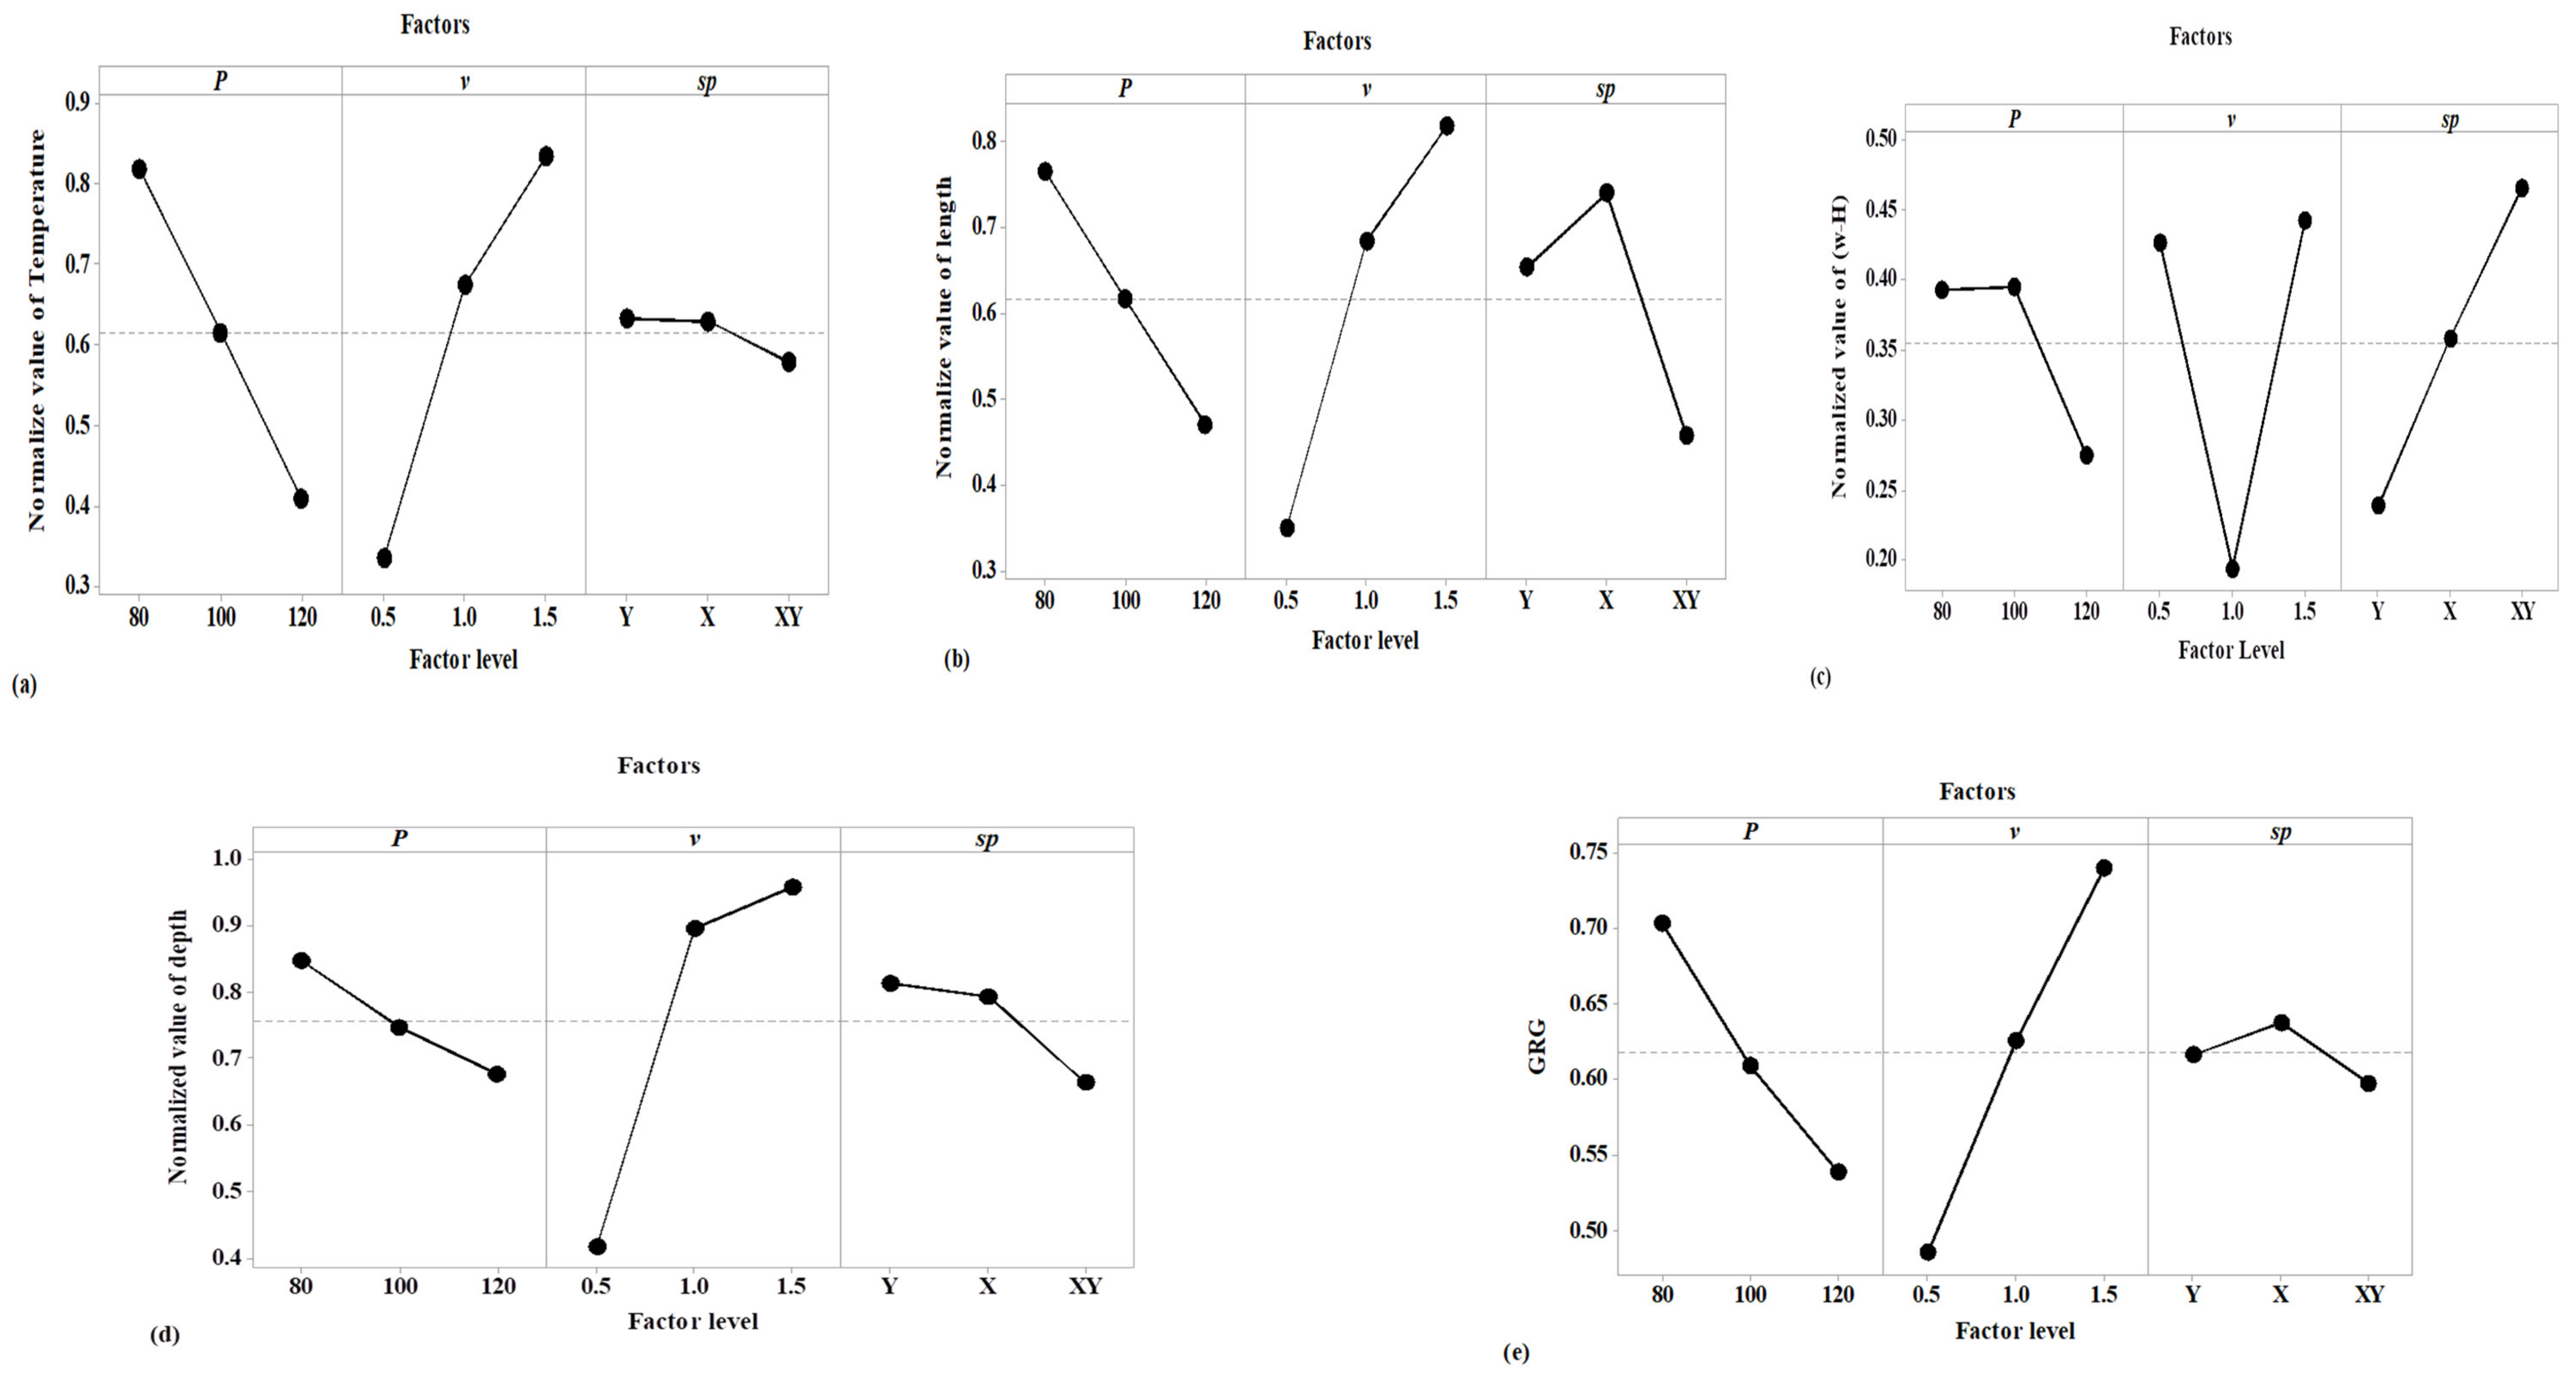
From Table 6, it can be seen that v has a maximum contribution to the results, and it is the most significant parameter affecting all responses. This is followed by P for T ^ , l ^ , and d ^ , and sp for w ^ . For w ^ , P is not a significant parameter independently, but p × v , is significant. Additionally, v × s p is an essential parameter for the maximization of w ^ . Due to constraints imposed on the normalized values, significant parameters and interactions are different compared to unconstrained responses. The main effect plots of the normalized data and GRG are presented in Figure 11. From these results, optimum factor levels, and significant factors and their interactions, are presented in Table 7
The ANOVA results for GRG and percentage contribution of each term are presented in Table 8. The main effect plot of GRG is given in Figure 11e. From Table 8 and Figure 11e, it can be concluded that scan velocity (v) significantly influences GRG variation. However, scan pattern (sp) does not significantly contribute to the variation in GRG; hence, the scan pattern can be neglected for optimum melt pool dimensions. This study recommends maximum scan velocity (v = 1.5 m/s) to maximise GRG with minimum laser power (P = 80 W). In other words, a low energy density is required to melt the powder layer.

4. Conclusions

This research explored the variation of process parameters, namely laser power, scan speed, and scan pattern, and their mutual interactions on the temperature distribution and melt pool dimensions. The novel approach proposed in this work provides a better understanding of the process mechanism and can consider multiple conflicting responses and their variation with parameter change. Furthermore, the simplicity of the proposed model makes it easy to implement, and the accuracy of results is within the expected range. Furthermore, simulation is advantageous for qualitatively explaining the LPBF process mechanism, which may be difficult to understand under actual part fabrication due to the limitations of the measuring devices and the complexity of the process itself. The major conclusions which can be drawn from the present study are as follows:
The temperature at various locations in the layer keeps on changing with time. This is because it depends on the location of the point concerning the laser position at that particular moment.
The powder has a poor heat dissipation capacity compared to the solid phase of the same material, which results in excessive temperature near the powder phase compared to the solidified portion.
The temperature variation within the melt pool along the three principal directions considered, namely length, width and depth, is not uniform, and depends on the material phase in the vicinity of the melt pool.
There may be a different set of significant process parameters for different types of responses considered. Therefore, it is difficult to have a single parameter setting that enables each response to achieve its best value.
Scan velocity is the most influential parameter of all the process parameters. Therefore, an optimum scan velocity is recommended to prevent over melting and an excessive temperature gradient in the melt pool or part.
The root cause of all the AM problems is excessive energy input into the system. The property of the fabricated part can be improved by inputting low energy density with a good scan pattern.

Author Contributions

Conceptualization: A.K.S.; methodology, A.K.S., A.E., Z.A.K.; formal analyses: I.A.B. and M.H.; Data Curation: I.A.B. and M.H.; Investigation: A.K.S. and A.E. writing—original draft, A.K.S. and A.E.; resources, I.A.B. and M.H.; supervision A.K.S. and Z.A.K. project administration, A.K.S. and Z.A.K.; review and editing, I.A.B. and M.H.; funding, I.A.B. and M.H. All authors have read and agreed to the published version of the manuscript.

Funding

This research was funded by King Khalid University (R.G.P. 2/1/43).

Institutional Review Board Statement

Not applicable.

Informed Consent Statement

Not applicable.

Data Availability Statement

The data is available in the article itself.

Acknowledgments

The authors extend their appreciation to the Deanship of Scientific Research at King Khalid University for funding this work through the Large Groups Project under grant number R.G.P. 2/1/43.

Conflicts of Interest

The authors declare no conflict of interest.

References

  1. Equbal, A.; Equbal, I.; Sood, A.K. An investigation on the feasibility of fused deposition modelling process in EDM electrode manufacturing. CIRP J. Manuf. Sci. Technol. 2019, 26, 10–25. [Google Scholar] [CrossRef]
  2. Acanfora, V.; Castaldo, R.; Riccio, A. On the Effects of Core Microstructure on Energy Absorbing Capabilities of Sandwich Panels Intended for Additive Manufacturing. Materials 2022, 15, 1291. [Google Scholar] [CrossRef] [PubMed]
  3. King, W.E.; Anderson, A.T.; Ferencz, R.M.; Hodge, N.E.; Kamath, C.; Khairallah, S.A.; Rubenchik, A.M. Laser powder bed fusion additive manufacturing of metals: Physics, computational, and materials challenges. Appl. Phys. Rev. 2015, 2, 041304. [Google Scholar] [CrossRef]
  4. Zhechao, F.; Hongwei, F. Study on selective laser melting and heat treatment of Ti-6Al-4V alloy. Results Phys. 2018, 10, 660–664. [Google Scholar]
  5. Caiazzo, F.; Alfieri, V.; Argenio, P.; Sergi, V. Additive manufacturing by means of laser-aided directed metal deposition of 2024 aluminium powder: Investigation and optimization. Adv. Mech. Eng. 2017, 9, 1–12. [Google Scholar] [CrossRef] [Green Version]
  6. Romano, J.; Ladani, L.; Sadowski, M. Temperature distribution and melt geometry in laser and electron-beam melting processes—A comparison among common materials. Addit. Manuf. 2015, 8, 1–11. [Google Scholar] [CrossRef]
  7. King, W.E.; Barth, H.D.; Castillo, V.M.; Gallegos, G.F.; Gibbs, J.W.; Hahn, D.E.; Kamath, C.; Rubenchik, A.M. Observation of keyhole-mode laser melting in laser powder-bed fusion additive manufacturing. J. Mater. Process. Technol. 2014, 214, 2915–2925. [Google Scholar] [CrossRef]
  8. Gu, D.; Meiners, W.; Wissenbach, K.; Poprawe, R. Laser additive manufacturing of metallic components: Materials, processes and mechanisms. Int. Mater. Rev. 2012, 57, 133–164. [Google Scholar] [CrossRef]
  9. Pasquale, G.D.; Luceri, F.; Riccio, M. Experimental evaluation of selective laser melting process for optimized lattice structures. Proc. Inst. Mech. Eng. Part E J. Process. Mech. Eng. 2018, 233, 763–775. [Google Scholar] [CrossRef]
  10. Gong, H.; Rafi, K.; Gu, H.; Starr, T.; Stucker, B. Analysis of defect generation in Ti–6Al–4V parts made using powder bed fusion additive manufacturing processes. Addit. Manuf. 2014, 1–4, 87–98. [Google Scholar] [CrossRef]
  11. Hooper, P.A. Melt pool temperature and cooling rates in laser powder bed fusion. Addit. Manuf. 2018, 22, 548–559. [Google Scholar] [CrossRef]
  12. Narr, S.P.; Scime, L.; Beuth, J. Integrated Control of Melt Pool Geometry and Microstructure in Laser Powder Bed Fusion of AlSi10Mg. Metall. Mater. Trans. A 2018, 49, 5097–5106. [Google Scholar] [CrossRef]
  13. Liu, X.; Zhao, C.; Zhou, X.; Shen, Z.; Liu, W. Microstructure of selective laser melted AlSi10Mg alloy. Mater. Des. 2019, 168, 107677. [Google Scholar] [CrossRef]
  14. Wang, Z.; Xiao, Z.; Tse, Y.; Huang, C. Optimization of processing parameters and establishment of a relationship between microstructure and mechanical properties of SLM titanium alloy. Opt. Lasers Technol. 2019, 112, 159–167. [Google Scholar] [CrossRef]
  15. Li, R.; Liu, J.; Shi, Y.; Wang, L.; Jiang, W. Balling behaviour of stainless steel and nickel powder during selective laser melting process. Int. J. Adv. Manuf. Technol. 2012, 59, 1025–1035. [Google Scholar] [CrossRef]
  16. Khorasani, A.; Gibson, I.; Awan, U.S.; Ghaderi, A. The effect of SLM process parameters on density, hardness, tensile strength and surface quality of Ti-6Al-4V. Addit. Manuf. 2019, 25, 176–186. [Google Scholar] [CrossRef]
  17. Malekipour, E.; El-Mounayri, H. Common defects and contributing parameters in powder bed fusion AM process and their classification for online monitoring and control: A review. Int. J. Adv. Manuf. Technol. 2018, 95, 527–550. [Google Scholar] [CrossRef]
  18. Everton, S.K.; Hirsch, M.; Stravroulakis, P.; Leacha, R.K.; Clarea, A.T. Review of in-situ process monitoring and in-situ metrology for metal additive manufacturing. Mater. Des. 2016, 95, 431–445. [Google Scholar] [CrossRef]
  19. Gockel, J.; Sheridan, L.; Koerper, B.; Whip, B. The influence of additive manufacturing processing parameters on surface roughness and fatigue life. Int. J. Fatigue 2019, 124, 380–388. [Google Scholar] [CrossRef]
  20. Luo, Z.; Zhao, Y. A survey of finite element analysis of temperature and thermal stress fields in powder bed fusion additive manufacturing. Addit. Manuf. 2018, 21, 318–332. [Google Scholar] [CrossRef] [Green Version]
  21. Paul, R.; Anand, S.; Gerner, F. Effect of Thermal Deformation on Part Errors in Metal Powder Based Additive Manufacturing Processes. J. Manuf. Sci. Eng. 2014, 136, 031009. [Google Scholar] [CrossRef]
  22. Vastola, G.; Zhang, G.; Pei, Q.X.; Zhang, Y.-W. Controlling of residual stress in additive manufacturing of Ti6Al4V by finite element modelling. Addit. Manuf. 2016, 12, 231–239. [Google Scholar]
  23. Irwin, J. Modeling Microstructure of AM Processes Using the FE Method. In Thermo-Mechanical Modeling of Additive Manufacturing; Gouge, M., Michaleris, P., Eds.; Elsevier: Amsterdam, The Netherlands, 2018; pp. 117–135. [Google Scholar]
  24. Arrizubieta, J.I.; Lamikiz, A.; Klocke, F.; Martínez, S.; Arntz, K.; Ukar, E. Evaluation of the relevance of melt pool dynamics in Laser Material Deposition process modelling. Int. J. Heat Mass Transfer 2017, 115, 80–91. [Google Scholar] [CrossRef]
  25. Zhang, Z.; Huang, Y.; Kasinathan, A.R.; Shahabad, S.I.; Ali, U.; Mahmoodkhani, Y.; Toyserkani, E. 3-Dimensional heat transfer modeling for laser powder-bed fusion additive manufacturing with volumetric heat sources based on varied thermal conductivity and absorptivity. Opt. Lasers Technol. 2019, 109, 297–312. [Google Scholar] [CrossRef]
  26. Liu, S.; Shin, Y.C. Additive manufacturing of Ti6Al4V alloy: A review. Mater. Des. 2019, 164, 107552. [Google Scholar] [CrossRef]
  27. Ross, P.J. Taguchi Techniques for Quality Engineering; Tata McGraw-Hill Publishing Company Limited: New Delhi, India, 2005. [Google Scholar]
  28. Sood, A.K.; Ohdar, R.K.; Mahapatra, S.S. Parametric appraisal of fused deposition modelling process using the grey Taguchi method. Proc. Inst. Mech. Eng. Part B J. Eng. Manuf. 2010, 224, 135–145. [Google Scholar] [CrossRef]
  29. Deng, J.L. Introduction to Grey system theory. J. Grey Syst. 1989, 1, 1–24. [Google Scholar]
  30. Liu, S.; Forrest, J.; Yang, Y. A brief introduction to grey systems theory. Grey Syst. Theory Appl. 2012, 2, 89–104. [Google Scholar] [CrossRef]
  31. Uzun, G. Analysis of grey relational method of the effects on machinability performance on austempered vermicular graphite cast irons. Measurement 2019, 142, 122–130. [Google Scholar] [CrossRef]
  32. Prabakaran, M.P.; Kannan, G.R. Optimization of laser welding process parameters in dissimilar joint of stainless steel AISI316/AISI1018 low carbon steel to attain the maximum level of mechanical properties through PWHT. Opt. Lasers Technol. 2019, 112, 314–322. [Google Scholar] [CrossRef]
  33. Krishnan, M.; Subramaniam, S. Multi-response optimization of friction stir corner welding of dissimilar thickness AA5086 and AA6061 aluminum alloys by Taguchi grey relational analysis. Proc. Inst. Mech. Eng. Part C J. Mech. Eng. Sci. 2018, 233, 3733–3742. [Google Scholar] [CrossRef]
  34. Solati, A.; Arab, N.B.M.; Mohammadi-Ahmar, A. Multi-criteria optimization of weld bead in pulsed Nd: YAG laser welding of stainless steel 316. Proc. Inst. Mech. Eng. Part E J. Process. Mech. Eng. 2019, 233, 151. [Google Scholar] [CrossRef]
  35. Ansys. ANSYS Mechanical APDL Element Reference, ANSYS, Inc. Release 15.0 South pointe 275 Technology Drive Canonsburg, PA 15317. 2013. Available online: https://www.google.com/url?sa=t&rct=j&q=&esrc=s&source=web&cd=&cad=rja&uact=8&ved=2ahUKEwi57dKc0db4AhVoUPUHHa3UAzkQFnoECAUQAQ&url=https%3A%2F%2Fwww.researchgate.net%2Ffile.PostFileLoader.html%3Fid%3D567c42a25f7f71f83b8b4567%26assetKey%3DAS%253A310263939567616%25401450984095215&usg=AOvVaw02rQ3lgSaKOTh3lDTHtPh2 (accessed on 11 May 2022).
  36. Mills, K.C. Recommended Values of Thermophysical Properties for Selected Commercial Alloys; Woodhead Publishing Limited: Cambridge, UK, 2002. [Google Scholar]
  37. Fu, G.; Zhang, D.Z.; He, A.N.; Mao, Z.; Zhang, K. Finite Element Analysis of Interaction of Laser Beam with Material in Laser Metal Powder Bed Fusion Process. Materials 2018, 11, 765. [Google Scholar] [CrossRef] [PubMed] [Green Version]
  38. Cengel, Y.A. Heat Transfer: A Practical Approach; Tata McGraw-Hill Publishing Company Limited: New Delhi, India, 2002. [Google Scholar]
  39. Fan, Z.; Liou, F. Numerical modeling of the additive manufacturing (AM) processes of titanium alloy. In Towards Achieving Enhanced Properties for Diversified Applications; Amin, A.K.M.N., Ed.; Intech: London, UK, 2012. [Google Scholar] [CrossRef] [Green Version]
  40. Tang, M.; Pistorius, P.C.; Beuth, J.L. Prediction of lack of fusion porosity for powder bed fusion. Addit. Manuf. 2017, 14, 39–48. [Google Scholar] [CrossRef]
  41. Huang, W.; Zhang, Y. Finite element simulation of thermal behaviour in single track multiple layers thin wall without support during selective laser melting. J. Manuf. Processes 2019, 42, 139–148. [Google Scholar] [CrossRef]
  42. Verhaeghe, F.; Craeghs, T.; Heulens, J.; Pandelaers, L. A pragmatic model for selective laser melting with evaporation. Acta Mater. 2009, 57, 6006–6012. [Google Scholar] [CrossRef]
  43. Ali, H.; Ghadbeigi, H.; Mumtaz, K. Effect of scanning strategies on residual stress and mechanical properties of Selective Laser Melted Ti6Al4V. Mater. Sci. Eng. A 2018, 712, 175–187. [Google Scholar] [CrossRef]
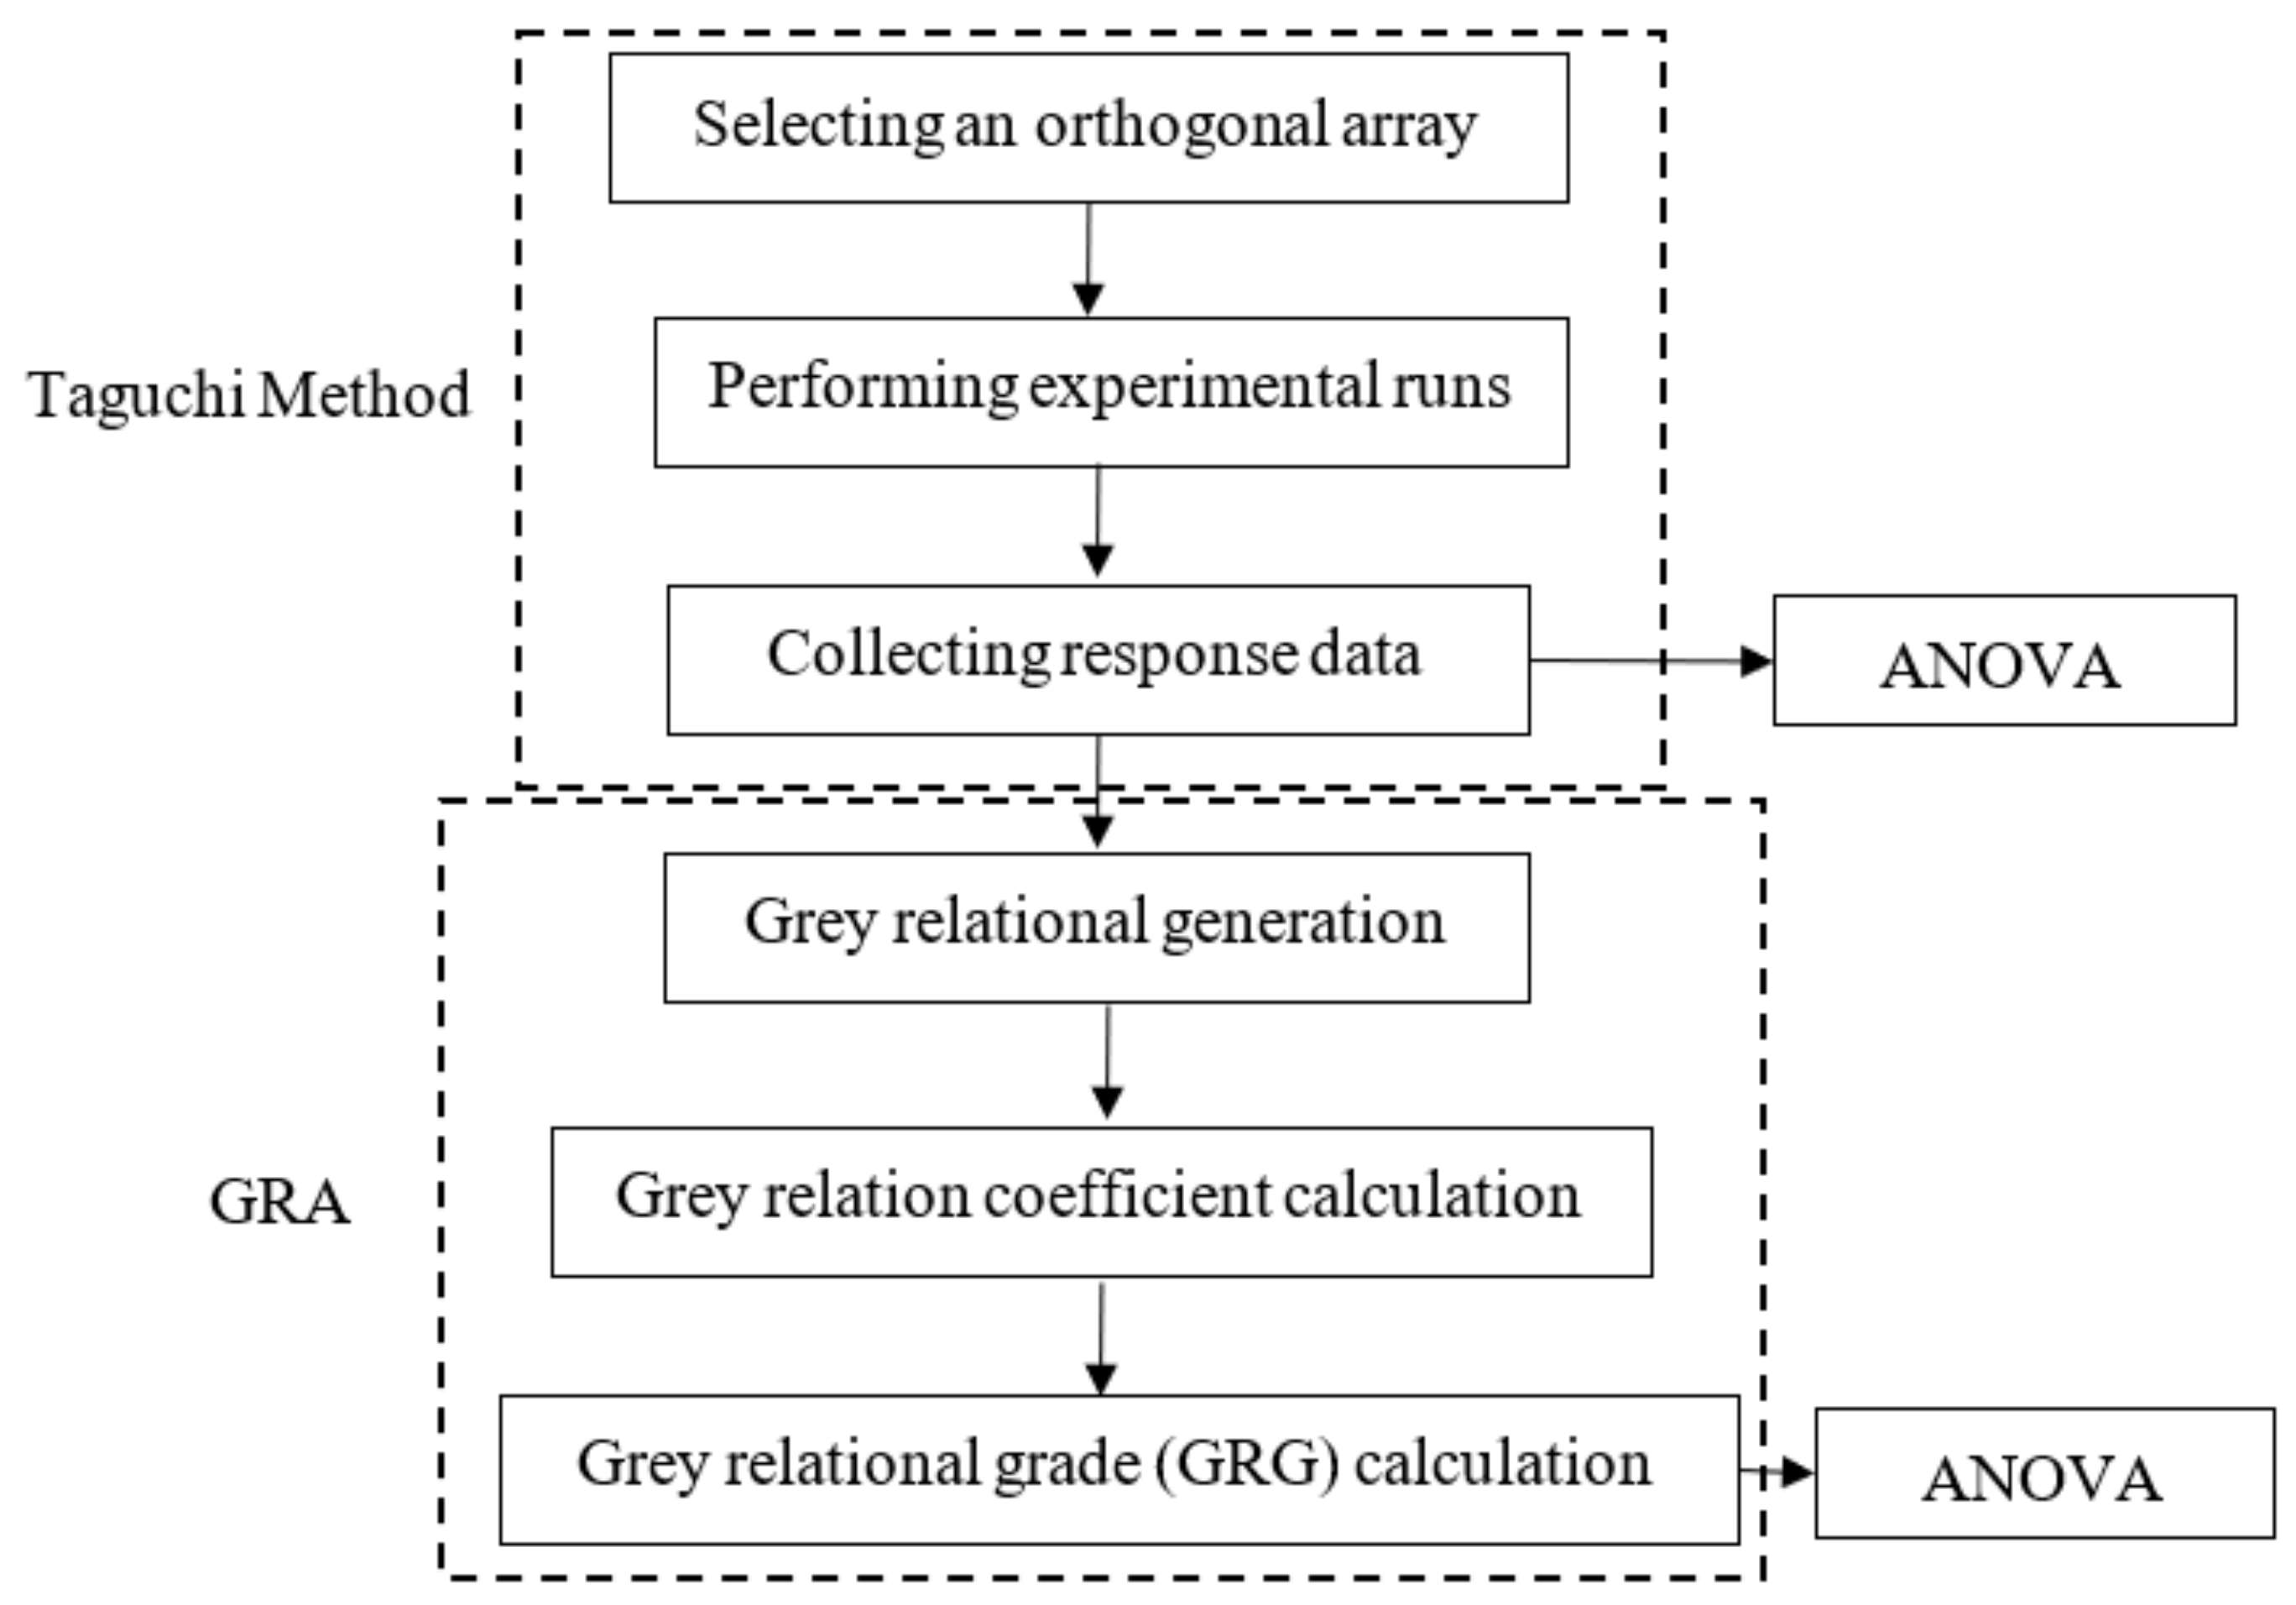
Figure 1. Flowchart of Taguchi based grey relation analysis (GRA).
Mathematics 10 02505 g001
Figure 2. Scan pattern (a) Y-scan (b) X-scan (c) XY-scan.
Mathematics 10 02505 g002
Figure 3. Linear graph for assigning factors and interaction in L27 array.
Mathematics 10 02505 g003
Figure 4. Geometric model used in the present analysis (all dimensions are in μm).
Mathematics 10 02505 g004
Figure 5. Location of points where temperatures were measured (all dimensions are in µm).
Mathematics 10 02505 g005
Figure 6. Variation of temperature of A, B, C, D, E. (Tliq is liquidus temperature) (a) P = 100 W, sp = Y, v = 0.5 m/s, (b) P = 100 W, sp = Y, v = 1.0 m/s, (c) P = 100 W, sp = Y, v = 1.5 m/s.
Mathematics 10 02505 g006
Figure 7. Time at which the temperature of points A, B, C, D and E is at its maximum (P = 100 W, sp = Y, v = 0.5 m/s).
Mathematics 10 02505 g007
Figure 8. Temperature distribution at the top powder top surface for laser movement along (a) Y-scan, (b) X-scan, (c) XY-scan path. For P = 80 W, v = 1 m/s.
Mathematics 10 02505 g008
Figure 9. Variation of temperature along (a) length, (b) width, (c) depth of melt pool. For the case P = 80 W, v = 1 m/s, sp = Y.
Mathematics 10 02505 g009
Figure 10. Variation of (a) maximum temperature at A (TA), (b) length of melt pool (l), (c) width of melt pool (w), (d) depth of melt pool (d) with process parameters.
Mathematics 10 02505 g010
Figure 11. Main effect plot of normalized response of (a) Temperature (b) Length (c) w-H (d) depth and (e) Main effect plot of GRG.
Mathematics 10 02505 g011
Table 1. Factors and their levels.
FactorSymbolUnitLevel
123
Laser powerPW80100120
Scan pattern sp---YXXY
Scan speedvm/s0.51.01.5
Table 2. L27 Orthogonal array and response data.
Exp. No.FactorsResponse
PspVTALWd
(W)---(ms−1)(K)(µm)(µm)(µm)
180Y0.5486440021060
280X0.5488735017555
380XY0.5514077826474
480Y1.0381230018030
580X1.0382027515028
680XY1.0395433016033
780Y1.5331823013022
880X1.5331520013019
980XY1.5341427011024
10100Y0.5590355024765
11100X0.5592245022570
12100XY0.5625680032190
13100Y1.0458240018035
14100X1.0459532515036
15100XY1.0475249820444
16100Y1.5394330015025
17100X1.5395530013024
18100XY1.5407135214628
19120Y0.5696272522574
20120X0.5699460025080
21120XY0.57410830324140
22120Y1.0536145520042
23120X1.0537742517540
24120XY1.0557458420850
25120Y1.5458040017528
26120X1.5459235015028
27120XY1.5474943218535
Table 3. Material properties of Ti6Al4V alloy and constant simulation process parameters.
PropertiesSymbolValueUnit
Liquidus temperature T l i q 1923K
Solidus temperature T s o l 1877K
Evaporation temperature T v 3533K
Latent heat of fusion L f 2.86 × 10 5 J kg−1
Latent heat of evaporation L v 9.83 × 10 6 J kg−1
Laser absorption coefficientA0.7---
Ambient temperatureTo300K
Laser spot radiusro100µm
Hatch spacingH200µm
Convective coefficientH10W m−2 K−1
Table 4. ANOVA result for the studied responses.
TAL
SourceDFSSVFpSSVFp
P21.2 × 1076,239,436552,7970.000171,51185,75596.720.000
v22 × 1079,815,951869,6660.000409,790204,895231.080.000
sp2277,745138,87212,303.70.000156,90878,45488.480.000
P × v4544,599136,15012,062.50.000775219382.190.161
P × sp451571289114.230.00012603150.360.834
v × sp455,19913,8001222.630.00062,13715,53417.520.001
Error89011 7093887
Total263.3 × 107 816,451
WD
SourceDFSSVFpSSVVFp
P277903895.133.420.000855.4427.7144.80.000
v248,89524,447.4209.750.00010,6805339.811807.840.000
sp290214510.338.70.000692.5346.26117.230.000
P × v41301325.22.790.101451.3112.8138.190.000
P × sp41221305.32.620.11593.723.437.930.007
v × sp475101877.416.110.001560.1140.0447.410.000
Error8932.4116.6 23.62.95
Total2676,670 13,356
Table 5. Normalized value of simulation results and grey relation grade.
Exp. No. T ^ l ^ w ^ d ^ GRG
10.6217340.7590360.9122811.0000000.737137
20.6161170.8192770.8322150.9411760.681326
30.5543350.3036140.5844160.7878790.475345
40.8786320.8795180.8611110.7272730.696903
50.8766790.9096390.7126440.7142860.662073
60.8439560.8433730.7560980.7476640.645013
70.9992670.9638550.6391750.6779660.715869
81.0000001.0000000.6391750.6611570.734794
90.9758240.9156630.5794390.6896550.673935
100.3680100.5783130.6569340.9333330.551352
110.3633700.6987950.7826090.8571430.566747
120.2818070.2771080.426540.5774650.382324
130.6905980.7590360.8611110.7619050.621665
140.6874240.8493980.7126440.7692310.605546
150.6490840.6409640.9666670.8333330.665777
160.8466420.8795180.7126440.6956520.636754
170.8437120.8795180.6391750.6896550.620508
180.8153850.8168670.6966290.7142860.607436
190.1094020.367470.7826090.7878790.478752
200.1015870.5180720.6428570.6721310.437012
210.0000000.2409640.4205610.3388430.333333
220.5003660.6927711.0000000.8163270.673912
230.4964590.7289160.8322150.8000000.584471
240.4483520.5373490.9310340.8888890.620564
250.6910870.7590360.8322150.7142860.599856
260.6881560.8192770.7126440.7142860.582937
270.6498170.7204820.8920860.7619050.618475
Table 6. The ANOVA table for T ^ , l ^ , w ^ , and d ^ .
T ^ l ^
SourceDFSSVFP%cSSVFP%c
P20.759660.379832552,796.60.00037.820.357140.17857196.740.00021.01
v21.195110.597557869,665.90.00059.50.853370.426683231.160.00050.20
sp20.016910.00845412,303.710.0000.840.326680.16334188.490.00019.22
P × v40.033150.00828812,062.480.0001.650.016130.0040322.180.1610.95
P × sp40.000310.000078114.230.0000.020.002620.0006560.360.8340.15
v × sp40.003360.000841222.630.0000.170.129380.03234617.520.0017.61
Error80.000010.000001 0.014770.001846
Total262.00852 1.70009
w ^ d ^
SourceDFSSVFP%cSSVFP%c
P20.085220.0426092.220.1714.850.130720.0653648.160.0006.51
v20.347160.1735789.060.00919.761.566340.783172577.030.00077.99
sp20.231520.1157586.040.02513.180.11860.05929943.690.0005.91
P × v40.311090.0777724.060.04417.710.081520.02038115.020.0014.06
P × sp40.010050.0025130.130.9670.570.005220.0013060.960.4780.26
v × sp40.618220.1545558.070.00735.200.095140.02378617.530.0014.74
Error80.153260.019158 0.010860.001357
Total261.75651 2.00841
Table 7. Optimum factor level with significant factors and interactions.
Term T ^ l ^ w ^ d ^
P80 W80 W100 W80 W
v1.5 m/s1.5 m/s1.5 m/s1.5 m/s
SpYXXYY
Significant factors and interactionsP, v, sp
P × v, P × sp, v × sp
P, v, sp
v × sp
v, sp
P × v, v × sp
P, v, sp
v × sp
Table 8. The ANOVA table for GRG.
SourceDFSSVFp%c
P20.1232680.06163451.080.0006.51
v20.2924620.146231121.20.00077.99
sp20.0073420.0036713.040.1045.91
P × v40.0153290.0038323.180.0774.06
P × sp40.0026880.0006720.560.7000.26
v × sp40.0096450.0024112.000.1884.74
Error80.0096530.001207
Total260.460386
Publisher’s Note: MDPI stays neutral with regard to jurisdictional claims in published maps and institutional affiliations.