Article

Nonlinear Large-Scale Perturbations of Steady Thermal Convective Dynamo Regimes in a Plane Layer of Electrically Conducting Fluid Rotating about the Vertical Axis

by
Simon Ranjith Jeyabalan
1,
Roman Chertovskih
2,*,
Sílvio Gama
1 and
Vladislav Zheligovsky
3
1
Mathematics Center of the Porto University (CMUP), Mathematics Department, Faculty of Sciences, University of Porto, R. Campo Alegre s/n, 4169-007 Porto, Portugal
2
Faculty of Engineering, University of Porto, Rua Roberto Frias, s/n, 4200-465 Porto, Portugal
3
Institute of Earthquake Prediction Theory and Mathematical Geophysics, Russian Academy of Sciences, 84/32 Profsoyuznaya St., 117997 Moscow, Russia
*
Author to whom correspondence should be addressed.
Mathematics 2022, 10(16), 2957; https://doi.org/10.3390/math10162957
Submission received: 5 June 2022 / Revised: 11 July 2022 / Accepted: 11 July 2022 / Published: 16 August 2022
(This article belongs to the Special Issue Numerical Analysis and Scientific Computing II)

Abstract

:
We present results of numerical investigation of regimes of steady thermal convective dynamo in a plane layer of electrically conducting fluid rotating about the vertical axis and subjected to large-scale perturbations.

1. Introduction

It is known for centuries, that the Earth possesses a magnetic field, which has predominantly the geometry of a dipole, almost coaxial (at a small angle of 10 ) with the axis of rotation of the Earth. Its origin and nature were for a long time (and to a large extent remain) an intriguing question of science. The first seemingly obvious hypothesis that the planet is a permanent magnet [1] was rejected on the basis of a critical quantitative examination, as well as many other hypotheses [2]. By contrast, only in the XIX century, physicists began to suspect that the Sun is also a giant magnet (see [2]). Since the beginning of the XX century, after J. Larmor [3,4] realised that the distribution of electric currents in a moving electrically conducting melt or plasma can be the source of the geomagnetic and solar field, the investigation of the terrestrial and solar magnetism was proceeding in parallel. At present, the hydromagnetic dynamo theory [5,6] is widely accepted by the scientific community as the explanation of the magnetic field of the Earth, the Sun [7], stars [8], galaxies [9] and other astrophysical bodies [10,11].
The dynamical character of the Earth’s magnetic field was confirmed by the discovery of geomagnetic field reversals [12] in the paleomagnetic data. The stripe magnetic anomalies are records of the reversing geomagnetic field registered in the cooling rocks while the sea floor is gradually spreading away from ocean ridges; their detection contributed to the wide acceptance of the plate tectonics among geophysicists (see [13]). Although modelling of the Earth’s dynamo is a very resource-consuming numerical problem because of the extreme parameter values involved, the occurrence of the reversals was successfully modelled by P. Roberts and G. Glatzmaier [14,15,16,17,18,19,20].
The magnetic α -effect, a pivotal notion of the hydromagnetic dynamo theory, is based on the idea of E. Parker [21,22] that the mean electromotive force due to interacting small-scale fluctuations of the flow (“cyclonic events”) and magnetic field may have a component parallel to the mean magnetic field, which can amplify the mean magnetic field. In his pioneering works [23,24,25,26,27,28], S.I. Braginsky gave the first derivation of the α -effect from the first principles by asymptotic methods for a nearly axisymmetric flow and magnetic field and used it for the study of the geomagnetic field. Parker’s idea is in the heart of the theory of mean-field electrodynamics [29,30] (the history of its development is presented in [31]), from which the term α -effect originates. Analogous phenomena were also encountered in the theory of hydrodynamic [32] (the anisotropic kinetic α -effect) and magnetohydrodynamic (MHD) [33] (the combined MHD α -effect) stability (see also [34]). When the α -effect tensor vanishes (e.g., if a parity-invariant MHD regime is perturbed), the phenomena of magnetic eddy diffusivity, eddy viscosity or combined MHD eddy diffusivity emerge, respectively.
The notion of the magnetic α -effect is firmly linked with the concepts of scale separation and averaging over small spatial scales. The impact of these effects can be analysed by rigorous asymptotic methods when scale separation is significant; the ratio ε between the characteristic small and large spatial scales is then a small parameter of the stability problem. Two approaches can be followed. On the one hand, we can study perturbations that depend on two spatial variables, the fast and the slow one, expand such perturbations in power series in ε , and derive a hierarchy of equations for the terms in the expansions. The mean parts of the terms satisfy partial differential equations in the slow variables arising as the solvability conditions for partial differential equations in the fast variables for the fluctuating parts. The equations for the averaged terms involve tensors of the respective α -effect or eddy diffusivity; they can be solved in any region in the space of slow variables. This approach was applied to the kinematic dynamo in [35,36,37,38], the hydrodynamic stability and evolutionary problems in [32,39,40,41] and to the MHD stability problem in [33].
On the other, when tackling a large-scale linear stability problem of periodically-replicated small-scale regimes, we can focus on the mean fields that feature spatial periodicity in the slow variables. Then, by linearity, the solution (a large-scale magnetic or stability mode, when the eigenvalue problem for a stability operator is considered) takes the form of a Bloch field e i q · x f ( x ) , where the wave vector q is small, | q | = ε . The amplitude-modulating exponential e i q · x can be cancelled out, yielding a parabolic (when the evolutionary equation is considered) or elliptic (in the case of the eigenvalue problem) equation in fast variables only, where ε enters as a non-singular parameter. The remaining “carrier” factor f ( x ) (unlike in the AM radio signal transmission, it is not harmonic) can now be expanded in the asymptotic power series in ε , yielding a solution that is equivalent to the one constructed for these boundary conditions by the general method. The small- ε asymptotics of the kinematic magnetic modes of the Bloch type was explored in [37,42,43]. In [44,45], the size of the wave vector q of the modulating harmonics e i q · x was not restricted to small values; the goal of this work was to investigate which wave vectors q maximise the efficiency of the dynamo, i.e., for which q the dominant magnetic modes enjoy maximum growth rates. The authors concluded that, at least for the range of magnetic molecular diffusivities that they considered, the most favourable for generation are wave vectors realising moderate scale separation ( | q | 1 / 2 ).
Rotation is known to be beneficial for hydrodynamic [46] and convective [47,48] nonlinear dynamos (but see [49]). Regimes of nonlinear magnetic dynamo powered by convection of electrically conducting fluid in a plane layer rotating about the vertical axis with square periodicity cells were investigated numerically in [49,50,51] for the Taylor number varying from 0 to 2000, numerically non-demanding values of other parameters being fixed. The regimes are separated by typically short sequences of bifurcations (mainly of a simple nature) from the onset of convective motion, have a rather simple spatial structure (the fluid motion is in the form of distorted rolls) and do not require exceptional numerical resources for simulation. In [49], five branches of hydrodynamically stable amagnetic regimes were found: two-dimensional rolls of three types, travelling waves and three-dimensional “wavy” rolls, all of which, except for one family of rolls, could act as kinematic magnetic dynamos, giving rise to nonlinear MHD steady states (13 branches) and time-periodic regimes (8 branches). Bifurcations in which these branches emerge and disappear were identified, as well as the emerging more complex regimes (two-frequency quasiperiodic and chaotic regimes, and a finite Feigenbaum period-doubling sequence of bifurcations of a torus superseded by a chaotic regime and by a torus with 1/3 of the cascade frequency). The symmetries of the regimes were listed ibid.
These regimes are stable to short-scale perturbations, i.e., perturbations of the same periodicity in horizontal directions as the one of the regimes themselves. Large-scale weakly nonlinear perturbations of hydromagnetic convective regimes in a rotating layer of fluid were considered in [52]. The perturbations were assumed to depend on the slow horizontal and fast spatial variables. The asymptotic formalism, which in previous studies had revealed the α -effect and eddy diffusivity in linear stability problems, was used to derive amplitude equations governing the perturbations. Free convective dynamos were examined (i.e., no external forcing was supposed to affect their action). In this case, the kernel of the linearisation involves two zero-mean neutral modes existing due to the spatial invariance of the regimes under perturbation; this makes the analysis considerably more involved. The results were applied in [53] for investigating the stability of steady states from the branch S 8 R 1 found in [49] to weakly nonlinear large-scale perturbations. The system of the amplitude equations was investigated numerically and the conclusion was drawn that a large-scale perturbation either converges to a small-scale one (i.e., of the periodicity of the unperturbed steady state) neutral stability mode of a constant amplitude, or it blows up at a finite slow time.
Thus, the stability of the regimes found in [49] to perturbations involving moderate-scale separation has not yet been investigated in the nonlinear setup. When considering a perturbation, initially proportional to e i q · x f ( x ) , it is impossible to just cancel out the amplitude-modulating harmonics in the equations governing the perturbed regime due to their nonlinearity. Consequently, the problem can only be tackled by direct numerical simulations. The computations must be carried out with an adequate spatial resolution; this implies that, in practice, we can consider only the perturbations and emerging regimes, whose space periods are just several times larger than those of the regime subjected to the perturbations.
When a convective fluid flow and magnetic field can have larger spatial periods—here, in horizontal directions—we may expect the resulting characteristic length scales of the fields to increase, giving rise to higher effective kinematic and magnetic Reynolds numbers, which is favourable for magnetic field generation. Our goal is to check whether these expectations are realised. We also address the question, whether the dynamo regimes under consideration are stable to moderately scale-separated perturbations. If they are unstable, is the evolution of the perturbations involving the moderate scale separation in any respect compatible with the scenarios predicted in [53] for the evolution of weakly nonlinear perturbations featuring high scale separation, or do the moderately scale-separated perturbations develop following their own paths in agreement with [44,45]?
A family of integral quantities D q was studied numerically in [54] for four solutions to the Navier–Stokes equation, that had been computed for studying turbulence. It was found that, for all of them, D q increases in q for the considered values q 18 —a result, that is not yet understood analytically. In Section 3.6, we investigate numerically these quantities and introduce similar ones, D q , s . In all our runs, D q and D q , 2 computed for the flow also decrease monotonically for all the considered values q 10 ; however, the monotonicity is broken when these quantities are computed for the magnetic field. Equally, the behaviour of D q , s in s is generally non-monotonic for both the flow and magnetic field.
The mathematical statement of the problem at hand and the pseudospectral algorithms applied for solving it are recalled in Section 2. We present the numerical results in Section 3. Concluding remarks can be found in Section 4.

2. Convective Magnetic Dynamo: Equations and Numerical Methods

2.1. Statement of the Problem

Our dynamo satisfies the Navier–Stokes equation involving the Archimedes (buoyancy), Coriolis and Lorentz forces, the magnetic induction and heat transfer equations. In the nondimensional form, in the reference frame rotating with the layer of fluid, they are as follows:
v t = v × ( × v ) + P 2 v + P R θ e 3 + P τ v × e 3 p b × ( × b ) ,
b t = × ( v × b ) + P P m 1 2 b ,
θ t = ( v · ) θ + v 3 + 2 θ .
Here, v denotes the flow velocity in the fluid layer 0 x 3 1 , b denotes the magnetic field, p denotes the modified pressure,
θ = T T 0 ( T 1 T 0 ) x 3
is the difference between the temperature T of the fluid and the linear temperature profile for the fluid at equilibrium (here T 0 and T 1 are constant temperatures at which the boundaries at x 3 = 0 and x 3 = 1 , respectively, are held), e n , n = 1 , 2 , 3 are unit vectors in the direction of the Cartesian coordinate system axes, and e 3 is vertical. The superscripts in v i , b i denote the components of the vector fields in the basis of { e n } . The fluid is incompressible, and the magnetic field is solenoidal:
· v = 0 , · b = 0 .
We employ the standard nondimensional parameters describing thermal convection in the presence of a magnetic field: the Rayleigh number, R (characterising the magnitude of thermal buoyancy forces); the Prandtl number, P (the ratio of the fluid viscosity to thermal diffusivity); the magnetic Prandtl number, P m (the ratio of viscosity to magnetic diffusivity); the Taylor number, Ta (the nondimensionalised angular velocity of the fluid rotation is τ / 2 = Ta / 2 ).
As in [49], we consider stress-free perfectly electrically conducting boundaries. The following conditions are satisfied on the horizontal boundaries:
v 1 x 3 x 3 = 0 , 1 = v 2 x 3 x 3 = 0 , 1 = v 3 | | x 3 = 0 , 1 = 0 ,
b 1 x 3 x 3 = 0 , 1 = b 2 x 3 x 3 = 0 , 1 = b 3 | | x 3 = 0 , 1 = 0 ,
θ | | x 3 = 0 , 1 = 0 .
The state that is subjected to perturbations has periods L in the horizontal directions x 1 and x 2 . We consider perturbations that have periods M 1 L and M 2 L in x 1 and x 2 , respectively:
v ( x , t ) = v ( x 1 + m 1 M 1 L , x 2 + m 2 M 2 L , x 3 , t ) ,
b ( x , t ) = b ( x 1 + m 1 M 1 L , x 2 + m 2 M 2 L , x 3 , t ) ,
θ ( x , t ) = θ ( x 1 + m 1 M 1 L , x 2 + m 2 M 2 L , x 3 , t )
for all integer m 1 and m 2 and all x in the layer of fluid. In what follows, we will call such fields ( M 1 , M 2 ) -periodic and denote the ( M 1 , M 2 ) -periodicity box by C . It is easy to show that under the boundary conditions (2), the horizontal components of the magnetic field and flow, averaged over the volume of the periodicity cell, are time-independent. We consider the case where the magnetic field is not imposed, and study the convective dynamo problem in the reference frame, in which the mean fluid flow through the layer vanishes:
b 1 = b 2 = 0 ; v 1 = v 2 = 0 .
Here,
f = ( M 1 M 2 L 2 ) 1 C f ( x ) d x
denotes the spatial mean over the ( M 1 , M 2 ) -periodicity box C .
We have performed computations for all pairs of integers ( M 1 , M 2 ) in the range 1 M 1 , M 2 4 , resulting in the scale ratios that are confined to the interval 0.25 ε 1 . Although the geometries of the ( M 1 , M 2 ) -periodicity and ( M 2 , M 1 ) -periodicity boxes are identical, we have performed simulations in the periodicity boxes arising for both pairs of integers, because the regime that we perturb lacks the symmetry of rotation by π / 2 exchanging the horizontal directions x 1 and x 2 . The flow in the 1x1-periodic steady state is comprised of distorted rolls along one Cartesian direction (see Figure 1), and the associated magnetic structures are also anisotropic. Thus, small perturbations give rise to significantly different initial conditions and may reveal different attractors.
The influence of the Rayleigh and Prandtl numbers on magnetic field generation by convection was examined in [55,56], and it was found that the critical P m generally decreases on increasing R over the critical value, but for R over a certain threshold, the behaviour of the critical P m is non-monotonic (see also [57]). We have employed the same values as in [49,55]:
P = 1 , P m = 8 , R = 2300 , L = 8
and studied perturbations of the steady-state dynamo from the branch S 8 R 1 [49] for Ta = 675. Here, L is the horizontal size (relative to the layer width) of the periodicity cell of the unperturbed convective dynamo regime; its value (5) is equal to the horizontal period of the first unstable hydrodynamic mode, when on increasing the Rayleigh number convective flow sets in in a non-rotating layer. Since the Rayleigh number shown in (5) is close to the critical value for the onset of convection, convective attractors have a simple roll structure. The magnetic Prandtl number (5) is close to its critical value for the onset of kinematic magnetic field generation by the convective flows, and therefore flows in the convective MHD attractors are not significantly altered by the Lorentz force.

2.2. Numerical Techniques

Three large-scale perturbation evolutions (which we label with the indices 1–3) have been simulated in each ( M 1 , M 2 ) -periodicity box. In runs labelled 1, the energy of the initial perturbation is in the range 10 5 0.2 ; only the coefficients of harmonics associated with the wave vectors ( 2 π / ( M 1 L ) , 0 , 0 ) , ( 0 , 2 π / ( M 2 L ) , 0 ) and ( 0 , 0 , π ) of the flow and magnetic field have been randomly perturbed (together with their complex-conjugate counterparts). Runs 2 and 3 have been carried out to seek additional attractors of the dynamical system under consideration. For them, initial conditions have been synthesised as Fourier series with random coefficients, whose amplitude decays exponentially on increasing the length of the wave vector, and the gradient part is removed (to satisfy (1.4)). They can be regarded as large initial perturbations, in which kinetic and magnetic energies exceed the energies of the respective fields constituting the unperturbed MHD steady state, or have similar magnitudes. (We define the energy of a vector field f as
E f = 1 2 | f | 2 ,
i.e., we actually refer to the spatially averaged energy density; while we believe this does not cause confusion, this is convenient in that the regimes in the ( M 1 , M 2 ) -periodicity box C , constructed by replicating an (1,1)-periodic regime, have the same energy for whichever M 1 and M 2 .) In runs 2, the kinetic energy is several times larger than the magnetic energy, and in runs 3, the former is several times smaller than the latter. In what follows, run M in the ( M 1 , M 2 ) -periodicity box is labelled M 1 x M 2 . M (for instance, run 1 in the (3,2)-periodicity box is referred to as 3x2.1).
The equations are solved numerically by the standard pseudospectral methods [58,59,60]. The fields are expanded into truncated Fourier series satisfying the boundary conditions (2):
v ( x , t ) = n 1 = N 1 / 2 N 1 / 2 n 2 = N 2 / 2 N 2 / 2 n 3 = 0 N 3 v ^ n 1 ( t ) cos ( π n 3 x 3 ) v ^ n 2 ( t ) cos ( π n 3 x 3 ) v ^ n 3 ( t ) sin ( π n 3 x 3 ) e 2 π i L ( n 1 x 1 + n 2 x 2 ) , b ( x , t ) = n 1 = N 1 / 2 N 1 / 2 n 2 = N 2 / 2 N 2 / 2 n 3 = 0 N 3 b ^ n 1 ( t ) cos ( π n 3 x 3 ) b ^ n 2 ( t ) cos ( π n 3 x 3 ) b ^ n 3 ( t ) sin ( π n 3 x 3 ) e 2 π i L ( n 1 x 1 + n 2 x 2 ) , θ ( x , t ) = n 1 = N 1 / 2 N 1 / 2 n 2 = N 2 / 2 N 2 / 2 n 3 = 0 N 3 θ ^ n ( t ) sin ( π n 3 x 3 ) e 2 π i L ( n 1 x 1 + n 2 x 2 ) .
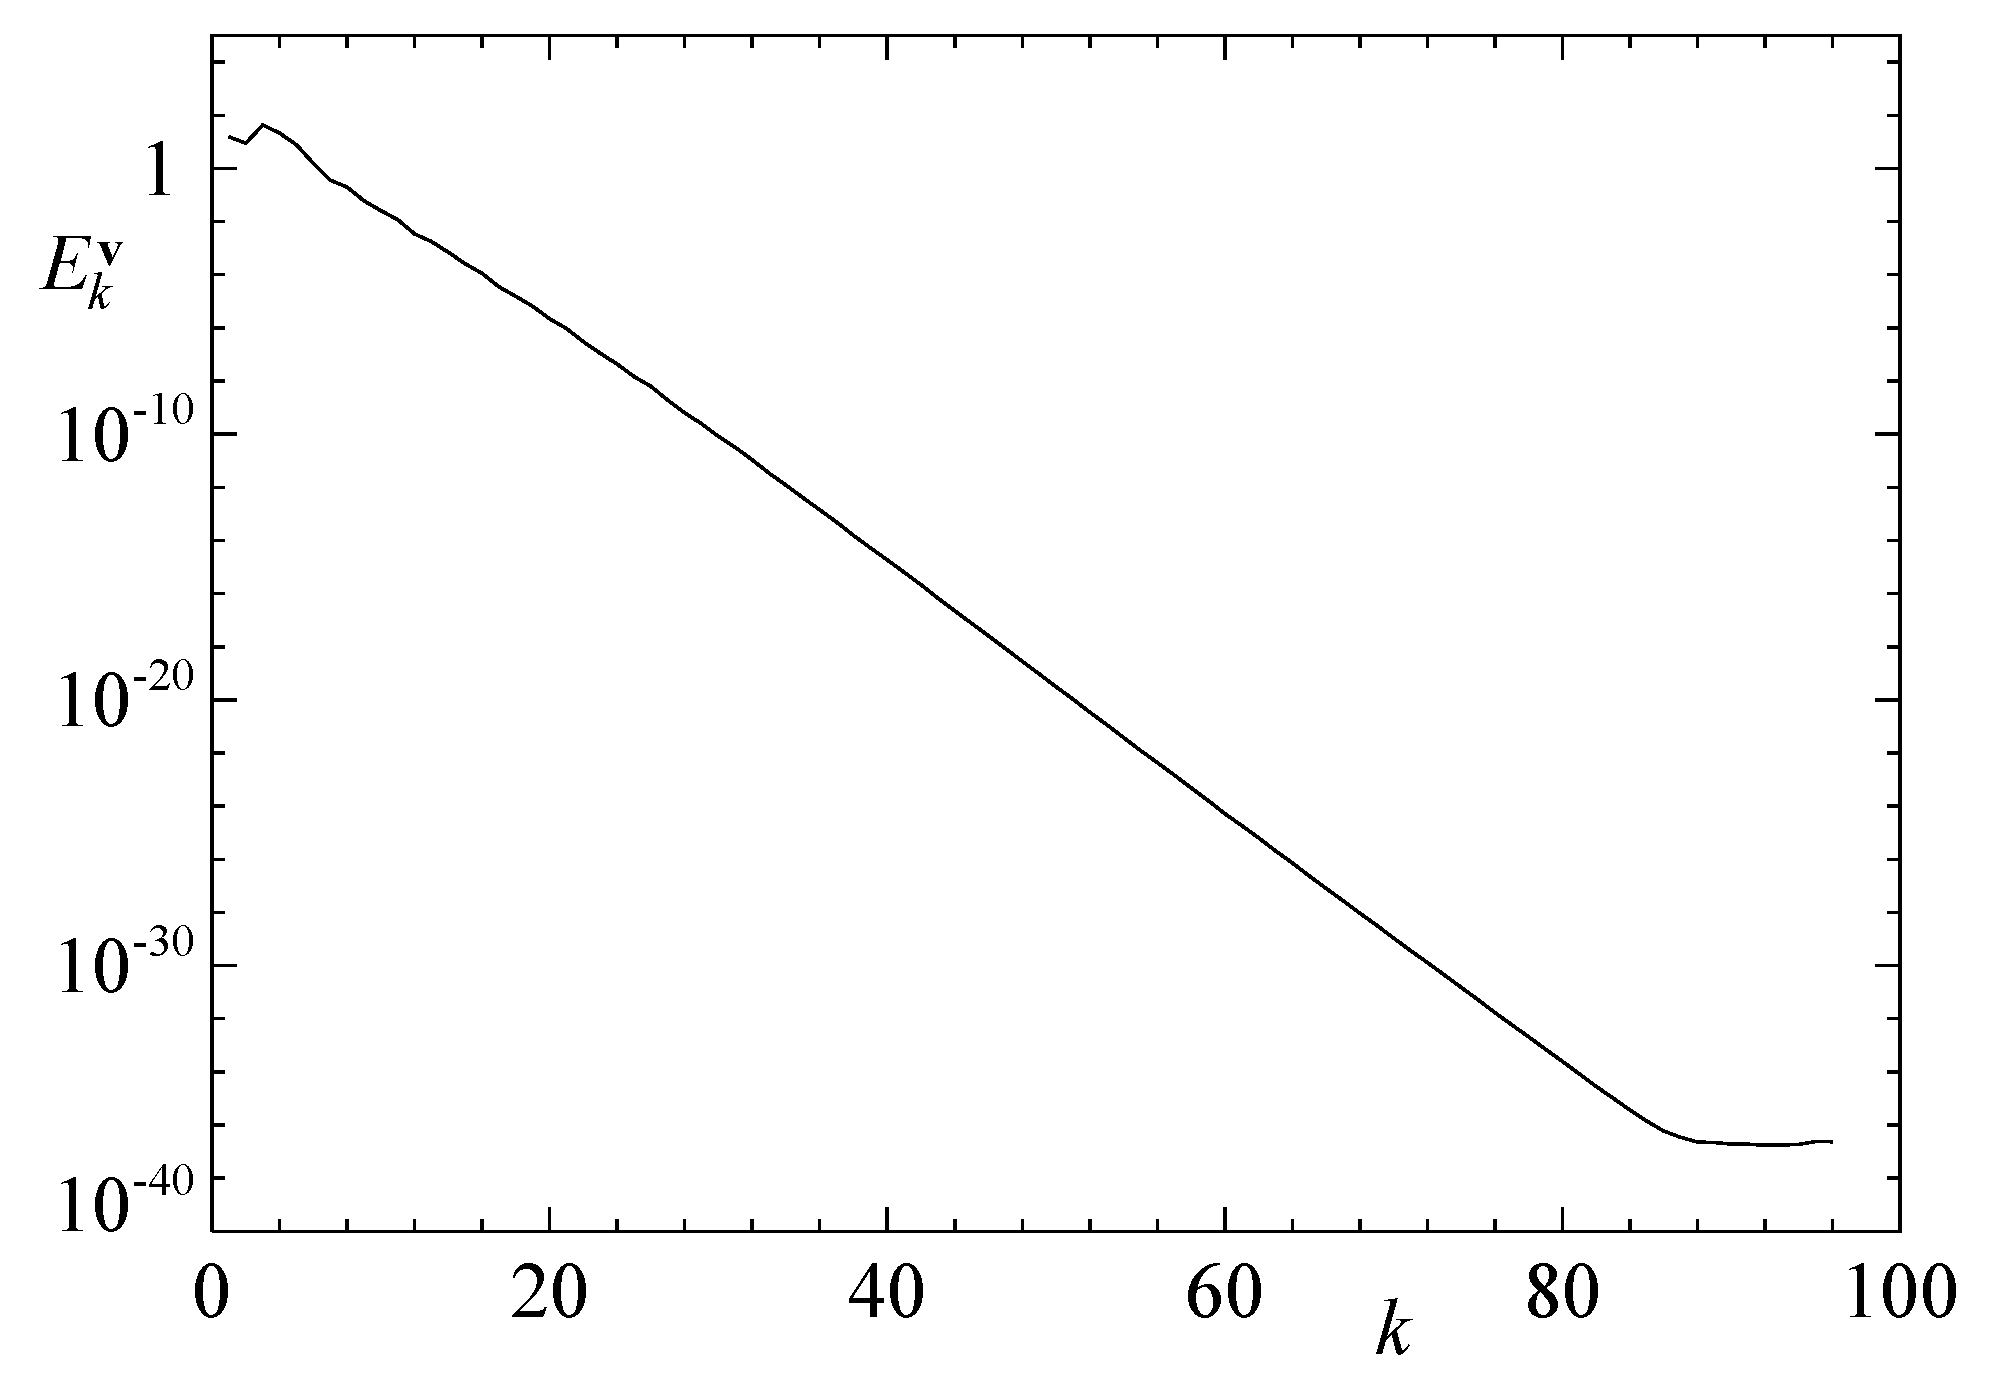
For all ( M 1 , M 2 ) -periodicity boxes, we have performed runs with the so-called “standard” resolution of N 1 = 128 M 1 , N 2 = 128 M 2 , and N 3 = 96 harmonics. The mean horizontal components of the flow and magnetic field, v ^ n k and b ^ n k for n = 0 and k = 1 , 2 , are assumed to be zero for all t 0 (see (4)). As usual, in order to verify that the resolution is sufficient, we analyse the energy spectrum of the unknown fields, i.e., the distribution of energy E k contained in harmonics associated with the wave vectors in successive spherical shells C k = { n | k 1 < | n | k } of width one. In all the runs, the energy spectrum decay for the flow, magnetic field and temperature is at any time at least 7, 4 and 12 orders of magnitude, respectively. (More precisely, we report the minimum energy spectrum decay estimates
log 10 min t max 1 k min ( N 1 / 2 , N 2 / 2 , N 3 ) E k ( t ) / min 1 k min ( N 1 / 2 , N 2 / 2 , N 3 ) E k ( t ) ;
the minimum and maximum in the ratio are over fully populated shells only.) Sometimes we observe plateaux at the right end of the energy spectrum plots, E k vs. k, emerging due to round-off errors, as seen, e.g., in Figure 2; the “outer” shells constituting the plateaux were excluded when estimating the quantity (6).
The decays found in computations for different periodicity boxes are shown in Table 1. We interpret these numbers as evidence that the employed resolution is sufficient, and hence regard the standard-resolution runs as our principal runs. However, a higher resolution may be desirable for comparison and to be on the safe side. The decays are low, because for the standard resolution, the number of fully populated shells is mostly constrained by the resolution in the vertical direction. To overcome this, we have repeated the runs, where the energy spectrum decay is below 7, using the constant “alternative” resolution of 256 × 256 × 257 harmonics, wave numbers in the vertical direction being in the range [ 0 , 256 ] , and have checked our conclusions against these runs. However, in all the runs, the attractors have proven to be chaotic (except for they are a travelling wave in the 3x1/1x3-periodicity cells, as Table 2 shows) and therefore, all such comparisons can be carried out at a qualitative level only. Energy spectra decays for the two resolutions are shown in Table 1; the minimum decays for the three fields in the new runs are at least 10, 6 and 15 decades, respectively.
Time stepping has been performed by the third-order Runge–Kutta method ETD3RK [61] with exponential time differencing, which had proven useful for computing regimes of thermal convection [62] and convective dynamo [57]. The time steps 0.0005, 0.00075 and 0.001 have been employed; the smaller steps have been typically used when the initial magnetic energy exceeded the kinetic one and for the largest periods M 1 L and M 2 L .

2.3. Symmetries

An important tool for investigating invariant structures in the phase space of a dynamical system is an analysis of their symmetries. Here, we list the symmetries of the convective dynamo rotating about a vertical axis in the notation of [55].
For the ( M 1 , M 2 ) -periodicity box C , the symmetry group is Z 4 ( T 1 × T 2 ) × Z 2 × Z 2 if the horizontal base of C is square (i.e., when M 1 = M 2 , given that for M 1 = M 2 = 1 the periodicity box in the horizontal variables is square), otherwise reducing to Z 2 ( T 1 × T 2 ) × Z 2 × Z 2 . Here, the subgroup Z 4 is comprised of rotations by π / 2 about a vertical axis:
s 1 : ( x 1 , x 2 , x 3 ) ( x 2 , x 1 , x 3 ) , s 2 : ( x 1 , x 2 , x 3 ) ( x 1 , x 2 , x 3 ) , s 3 : ( x 1 , x 2 , x 3 ) ( x 2 , x 1 , x 3 )
and the identity s 0 = e . If the horizontal face of C is not square, only the rotations by π are possible, i.e., the rotations s 1 and s 3 are not involved. The subgroups T 1 and T 2 consist of translations in the x 1 and x 2 directions, respectively:
γ α 1 1 : ( x 1 , x 2 , x 3 ) ( x 1 + α 1 , x 2 , x 3 ) , γ α 2 2 : ( x 1 , x 2 , x 3 ) ( x 1 , x 2 + α 2 , x 3 )
where 0 α i < M i L ( γ M 1 L 1 = γ M 2 L 2 = e ). One of the subgroups Z 2 is generated by the reflection about the horizontal midplane:
r : ( x 1 , x 2 , x 3 ) ( x 1 , x 2 , 1 x 3 ) ,
and the other one by the symmetry reversing magnetic field
q : ( v , θ , b ) ( v , θ , b ) .
(Note that rotations s i and the reflection r about the horizontal midplane affect not only the spatial coordinates, but also the components of the vector fields.)
The presence of the symmetries reported in Table 2 has been detected numerically. A field f is supposed to possess a symmetry σ provided that the norm of the discrepancy f σ f in the Lebesgue space L 2 ( C ) is below the threshold 10 6 .
None of the attractors or metastable states, obtained numerically, possesses more than a single pair of symmetries for the flow and magnetic field. The symmetries in the pair are either identical, or the symmetry of the magnetic field additionally comprises the field reversal q.

3. Results of Simulation

General characteristics of the regimes obtained in our computations are shown in Table 2. While in the runs for triple-period fluid cells, the terminal regimes are non-generating stable hydrodynamic travelling waves, in all other runs the attractors are chaotic. In the course of temporal evolution, some attractors acquire in finite time intervals a behaviour that is visibly close to a regular one, subsequently abandoning it. This happens when a trajectory approaches (in the phase space) an invariant object, whose behaviour is regular (in our runs, these objects are steady states or travelling waves), and which is only mildly unstable (i.e., it has a low-dimensional unstable manifold, and growth rates of the non-decaying perturbation modes are small). Following, e.g., [63], we call such invariant objects metastable states. If a trajectory comes close to a metastable state, it is repelled from the state only along the unstable manifold, which takes a relatively long time (since the positive growth rates of the perturbation modes are small). Prior to leaving a neighbourhood of the metastable state, the trajectory mimics the quasi-regular behaviour of the trajectory (or trajectories) constituting the metastable state. Metastable states are often encountered during the initial saturation phase and do not significantly affect the evolution. Alternatively, metastable states can be repeatedly visited by the trajectory and play an important role in shaping the attractor. For instance, this occurs in our double-period simulations: the attractor is influenced by the presence of a hydrodynamically stable steady flow permanently staying in its vicinity in run 2x1.1, and in the other five runs, a hydrodynamically stable flow, which is a travelling wave capable of magnetic field generation, is approached repeatedly, preventing the magnetic field from its ultimate decay.
To describe an attractor or a metastable state, we report in Table 2 the energies obtained in the respective run. This explains, for instance, why the magnetic energy is strictly positive in the attractor entries labelled hydrodynamic. In this case, very small (much below the computer “epsilon”) magnetic energies are meaningful: To advance the magnetic field, b , by a time step, the field only in the beginning of the step is needed. Since the magnetic induction Equation (1.2) is linear in b , all values that are added up for computing the new field have comparable orders of smallness, this resulting in round-off errors that are significantly smaller than the new field.
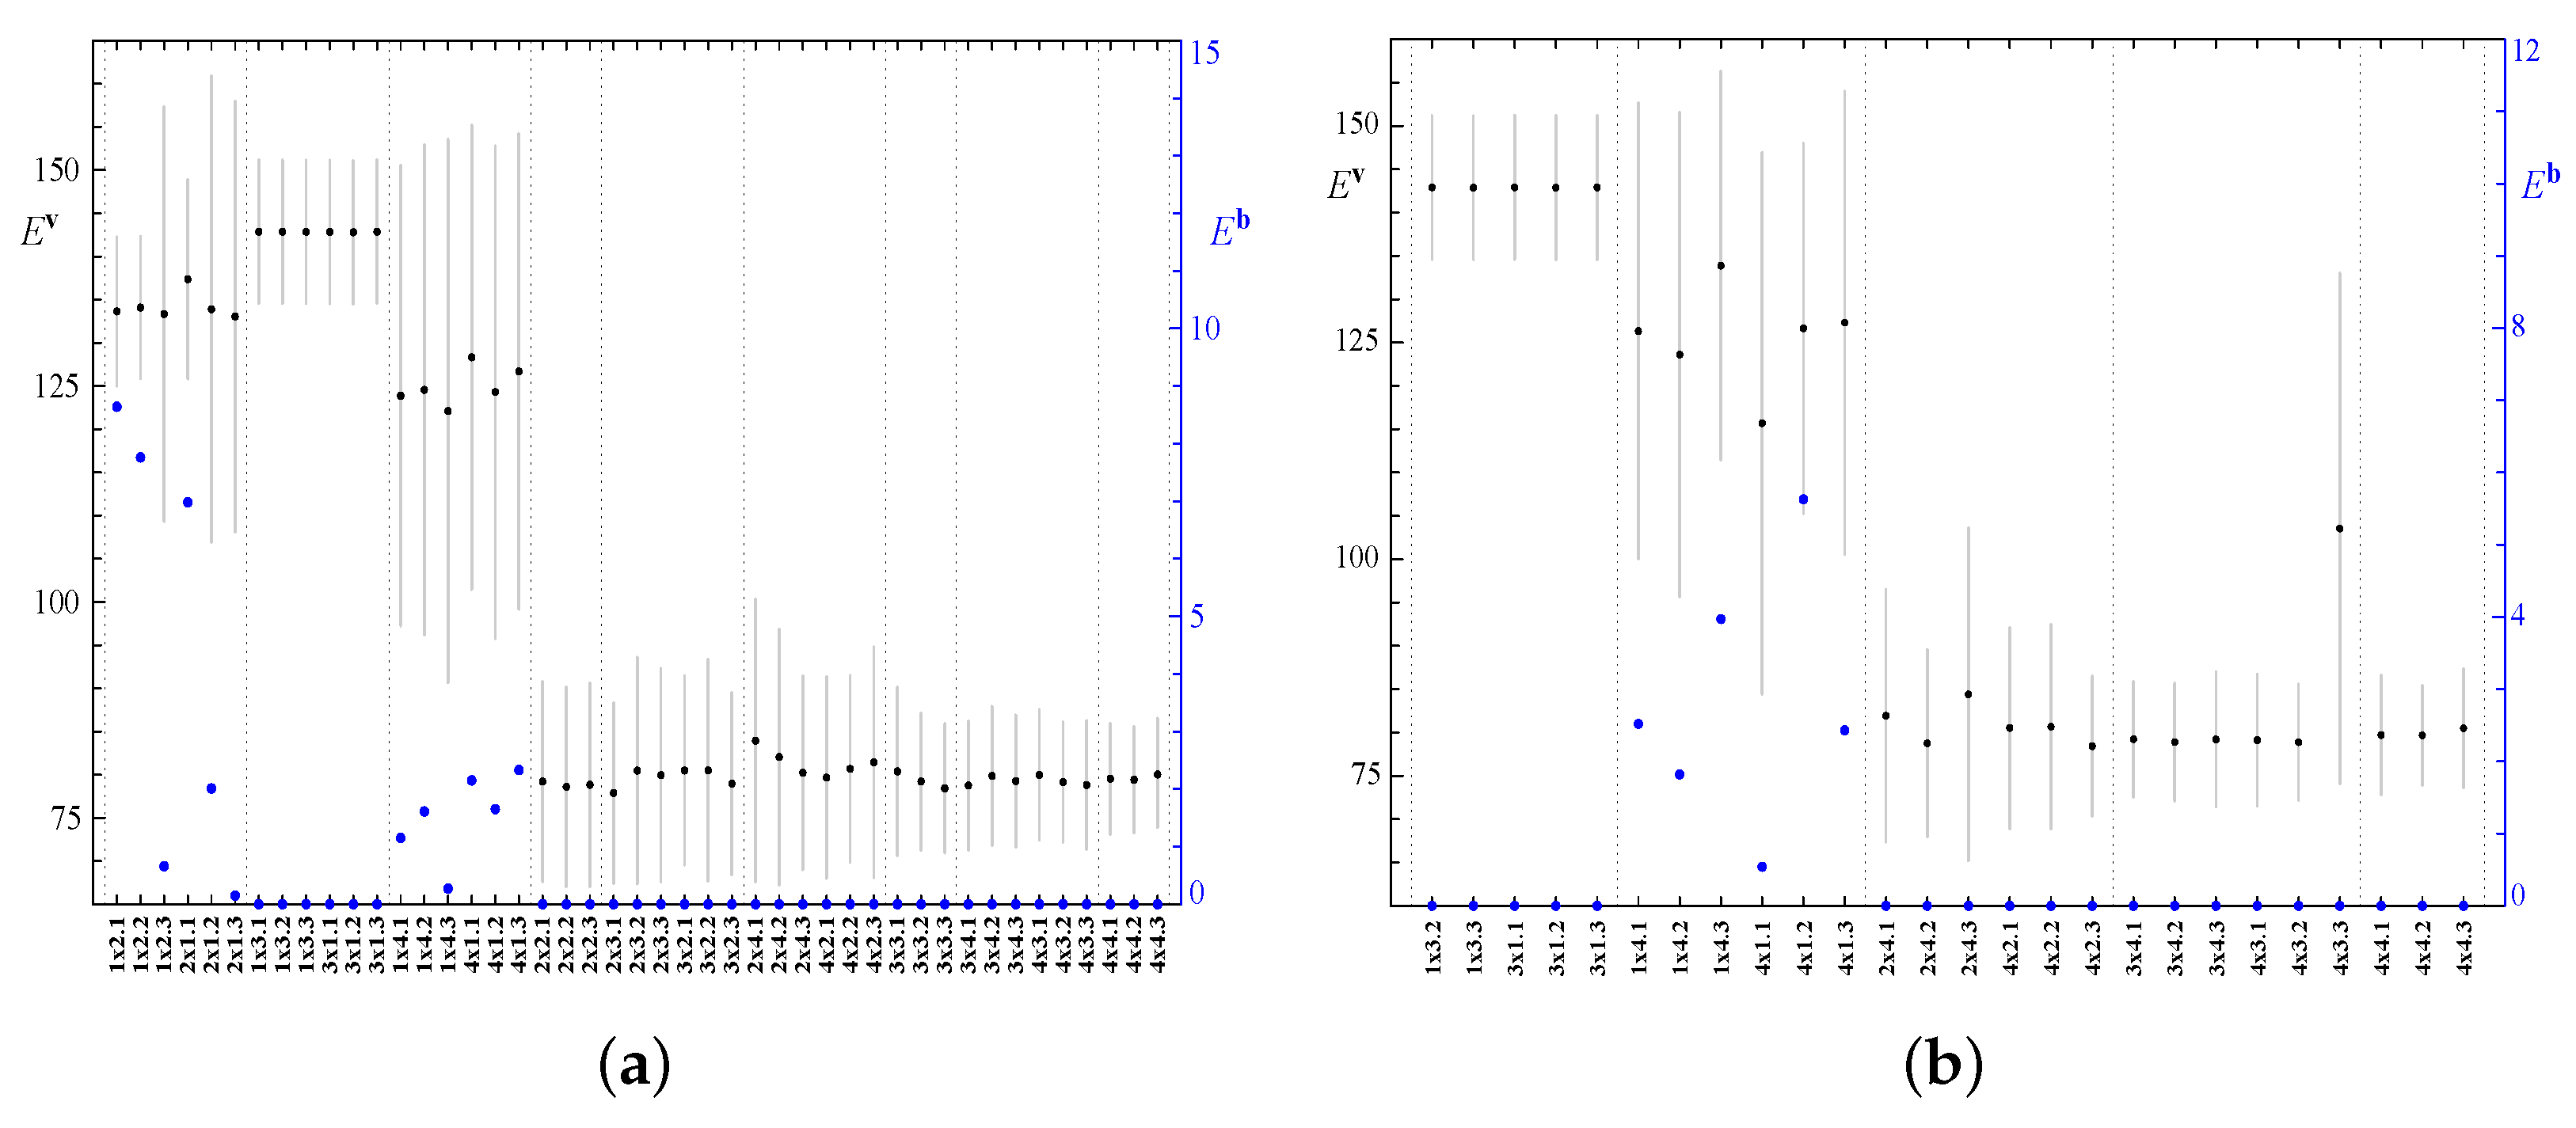
Increasing the horizontal periods allows larger structures to develop in the flow. Thus, higher magnetic Reynolds numbers can be attained, which is beneficial for generating or sustaining magnetic field. Surprisingly, our simulations have shown that convection remains a dynamo only in elongated ( M 1 , M 2 ) -periodicity cells, i.e., for M 1 = 1 or M 2 = 1 . Kinetic and magnetic energy densities averaged over space and time upon saturation are shown in diagrams Figure 3 for the two employed resolutions. They attest that only sufficiently vigorous flows (whose mean kinetic energy density is over 100) generate magnetic field. However, this is only a necessary condition: flows obtained in simulations in the periodicity cells 3x1 and 1x3 satisfy it, but do not act as dynamos.
In the subsequent investigation, for each run, we have computed the estimates of the magnetic Reynolds number Rm = | v | / η (as Table 3 shows), where is the characteristic length scale of the flow, | v | is the characteristic flow velocity and η = P / P m is the molecular magnetic diffusivity. Within the framework of the approach of [64], we have tried four different estimates of the characteristic length scale:
1 = ( t 1 t 0 ) 1 t 0 t 1 C | v | 2 d x C | v | 2 d x d t 1 / 2 = ( t 1 t 0 ) 1 t 0 t 1 n δ n | v n | 2 n δ n ( α 1 2 n 1 2 + α 2 2 n 2 2 + α 3 2 n 3 2 ) | v n | 2 1 d t 1 / 2 ;
2 = t 0 t 1 C | v | 2 d x d t t 0 t 1 C | v | 2 d x d t 1 / 2 = t 0 t 1 n δ n | v n | 2 d t t 0 t 1 n δ n ( α 1 2 n 1 2 + α 2 2 n 2 2 + α 3 2 n 3 2 ) | v n | 2 d t 1 / 2 ;
3 = ( t 1 t 0 ) 1 t 0 t 1 C | v | 2 d x C 2 v x 1 2 , 2 v x 2 2 , 2 v x 3 2 2 d x d t 1 / 4 = ( t 1 t 0 ) 1 t 0 t 1 n δ n | v n | 2 n δ n ( α 1 4 n 1 4 + α 2 4 n 2 4 + α 3 4 n 3 4 ) | v n | 2 1 d t 1 / 4 ;
4 = t 0 t 1 C | v | 2 d x d t t 0 t 1 C 2 v x 1 2 , 2 v x 2 2 , 2 v x 3 2 2 d x d t 1 / 4 = t 0 t 1 n δ n | v n | 2 d t t 0 t 1 n δ n ( α 1 4 n 1 4 + α 2 4 n 2 4 + α 3 4 n 3 4 ) | v n | 2 d t 1 / 4 ,
where δ n = 2 if n 3 = 0 , and δ n = 1 otherwise. We have defined the characteristic flow velocity | v | as the root-mean square velocity averaged over the time interval, for which the magnetic Reynolds number is estimated. Thus, four mean estimates of the magnetic Reynolds number, Rm n = n | v | / η , have been obtained.
Typically, Rm 1 and Rm 2 are smaller than Rm 3 and Rm 4 . The differences | Rm 1 Rm 2 | and | Rm 3 Rm 4 | turn out to be small compared to the difference between Rm 1 and Rm 3 , or between Rm 2 and Rm 4 (see Table 3). This behaviour of the magnetic Reynolds number estimates Rm n mimics the behaviour of the space scales estimates n . The difference | Rm 3 Rm 4 | is much smaller for the non-dynamo regimes (below 0.018) than for the generating regimes (which can be an order of magnitude larger, reaching 0.16).
The characteristic length scales n are small relative the horizontal size of the periodicity boxes and have the tendency to decrease with the area of the horizontal section of the periodicity box. No large discrepancies between the values n for a given run are observed. This behaviour of the length scales is counterintuitive and opposite to the one that we have expected. Solutions in all the non-elongated M 1 x M 2 periodicity boxes (for M 1 > 1 and M 2 > 1 ) possess chaotic amagnetic attractors. The small size of the flow structures, their variability and the resulting spatial intermittency give rise to the lack of the concerted action of the flow structures spread out over the periodicity box, that is needed for magnetic field generation.
The magnetic Reynolds number estimates Rm n separate sharply the regimes in elongated periodicity boxes (including all generating regimes) from those in larger-size boxes (where the generation fails) at the thresholds Rm 1 = Rm 2 = 25 , Rm 3 = Rm 4 = 27 (see Table 3). While these values are higher than the critical Reynolds numbers Rm c for the onset of magnetic field generation by Beltrami flows (Rm c = 9 for the 1:1:1 ABC flow [65] and Rm c = 16 for a Beltrami flow in a sphere [66]), they are much lower than the critical numbers for many other kinematic dynamos presented in the literature (e.g., cf. Rm c = 515.63 for the Christopherson flow [67]). The main contribution to the obtained values of magnetic Reynolds numbers comes from the characteristic flow velocity, which significantly decreases with the area of the horizontal section of the periodicity box. In larger periodicity boxes, convective motions tend to become less vigorous, affecting their ability to generate magnetic fields.
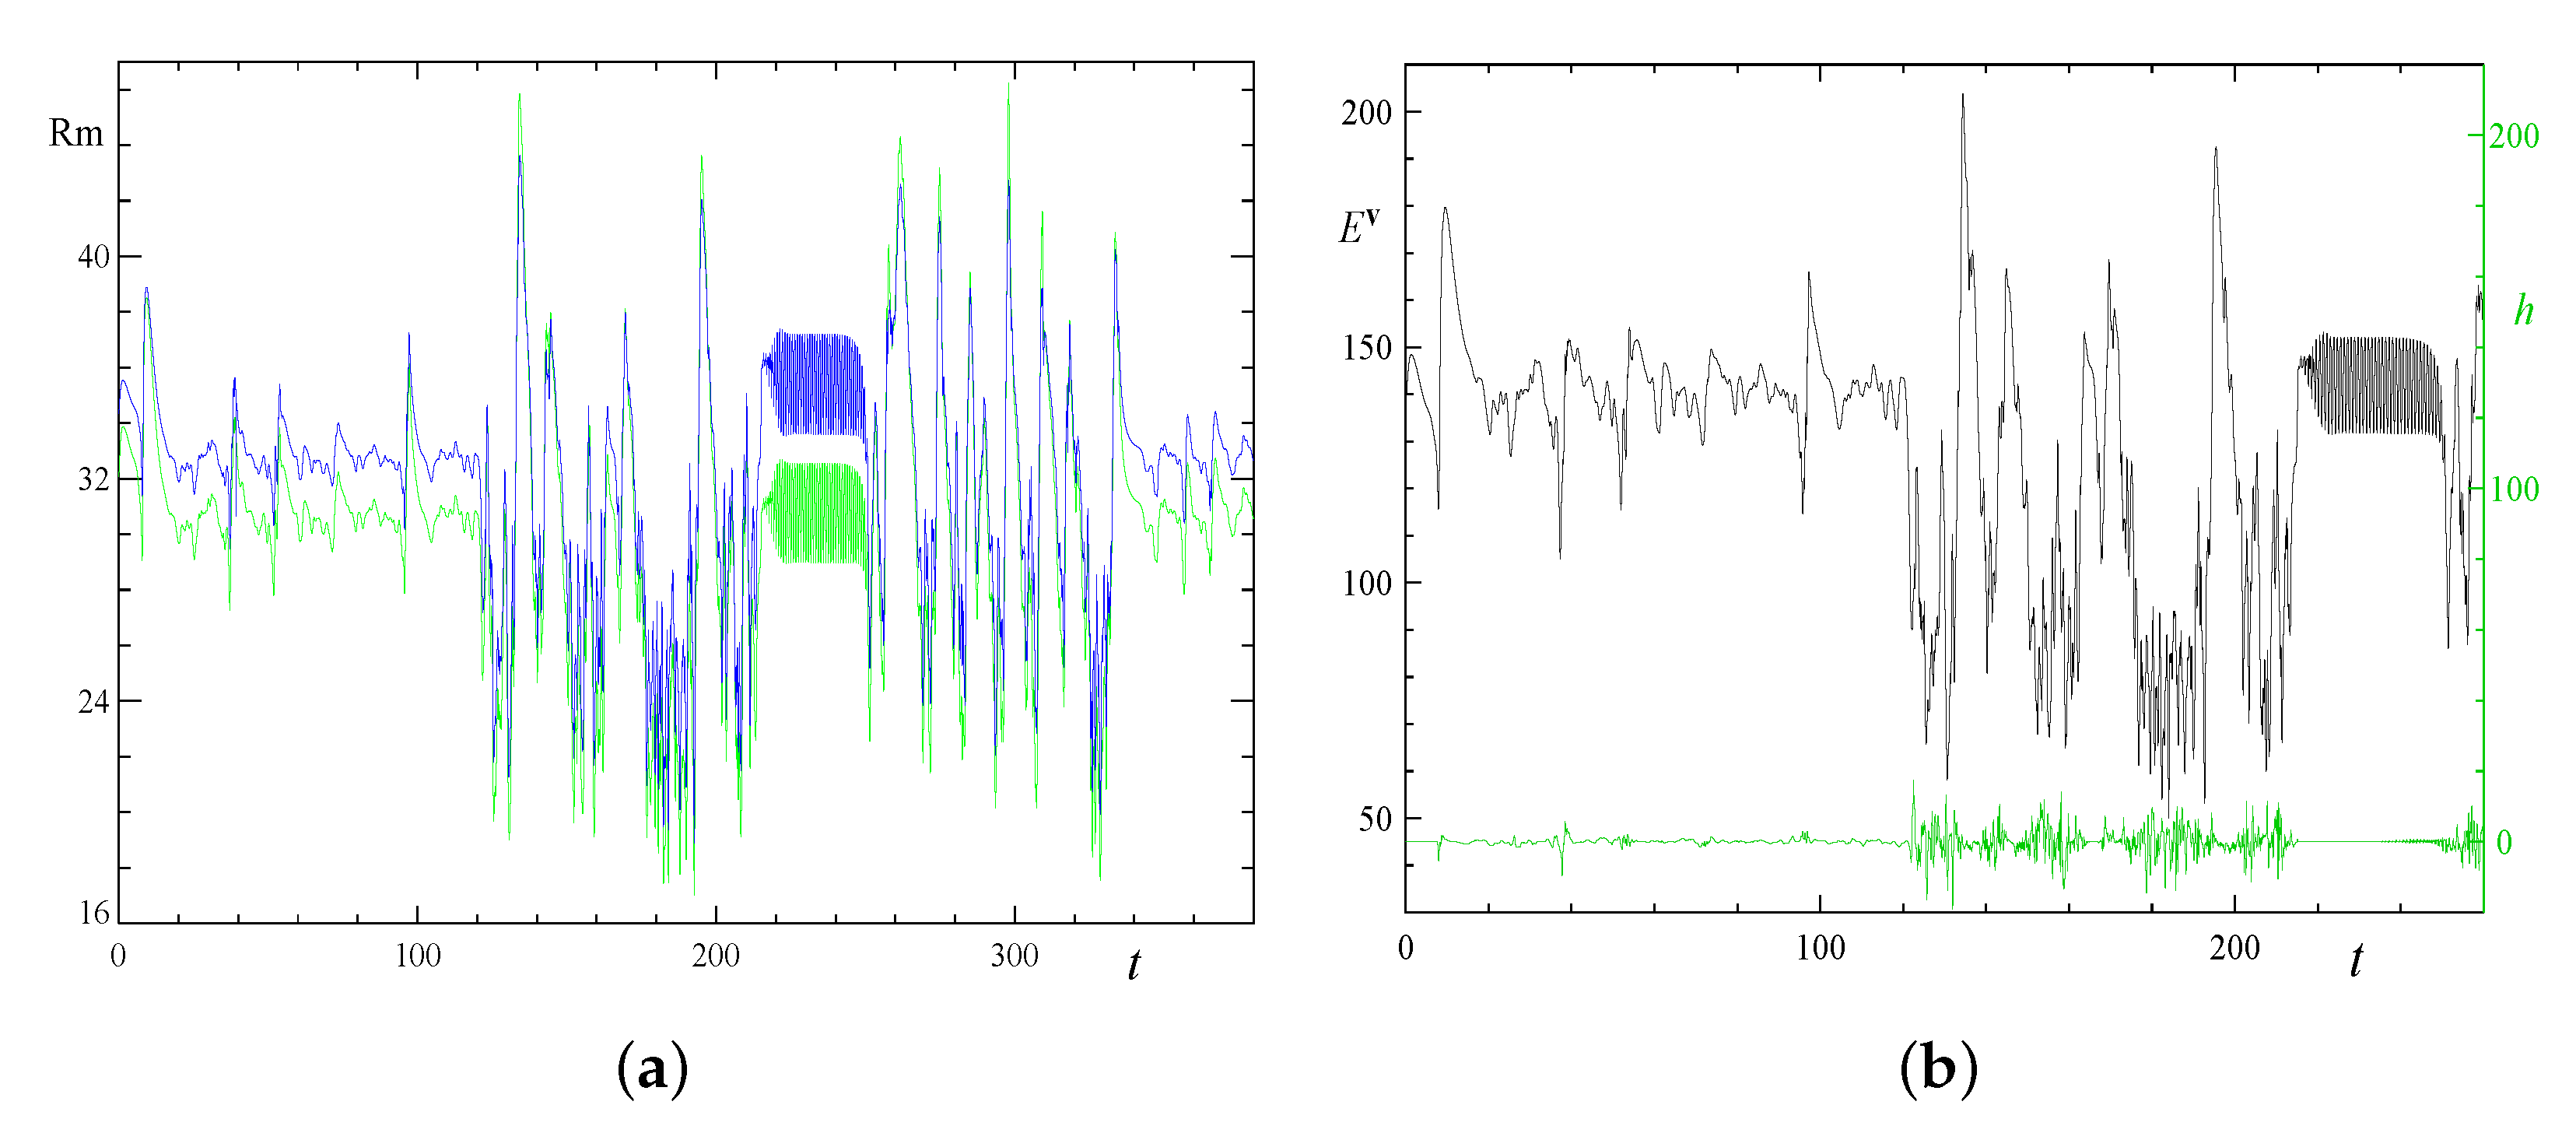
For t 1 t 0 , the length scale estimates 1 and 2 have equal limits, which we denote 1 ( t 0 ) ; similarly, 3 and 4 have equal limits, which we denote 3 ( t 0 ) . Employing the root-mean square velocity (averaging being over the periodicity cell) as the momentary characteristic velocity | v ( t ) | , we define the time-dependent estimates of the magnetic Reynolds number, Rm n ( t ) = n ( t ) | v ( t ) | / η . Figure 4 illustrates the temporal variation of the estimates 1 , 3 , Rm 1 and Rm 3 in run 1x2.2. While the behaviour of j and Rm j is quite similar, Rm j displays a much higher variability than j , and the behaviour of the two quantities differs significantly in detail. For instance, while 3 experiences an overall increase towards the end of the evolution shown in Figure 4, 1 , Rm 1 and Rm 3 are on average growing.
In the sections that follow, we will consider in more detail the generating regimes of thermal convection in the presence (at least initially) of magnetic field.

3.1. Regimes in the Elongated Boxes with the Periodicities 1x2/2x1

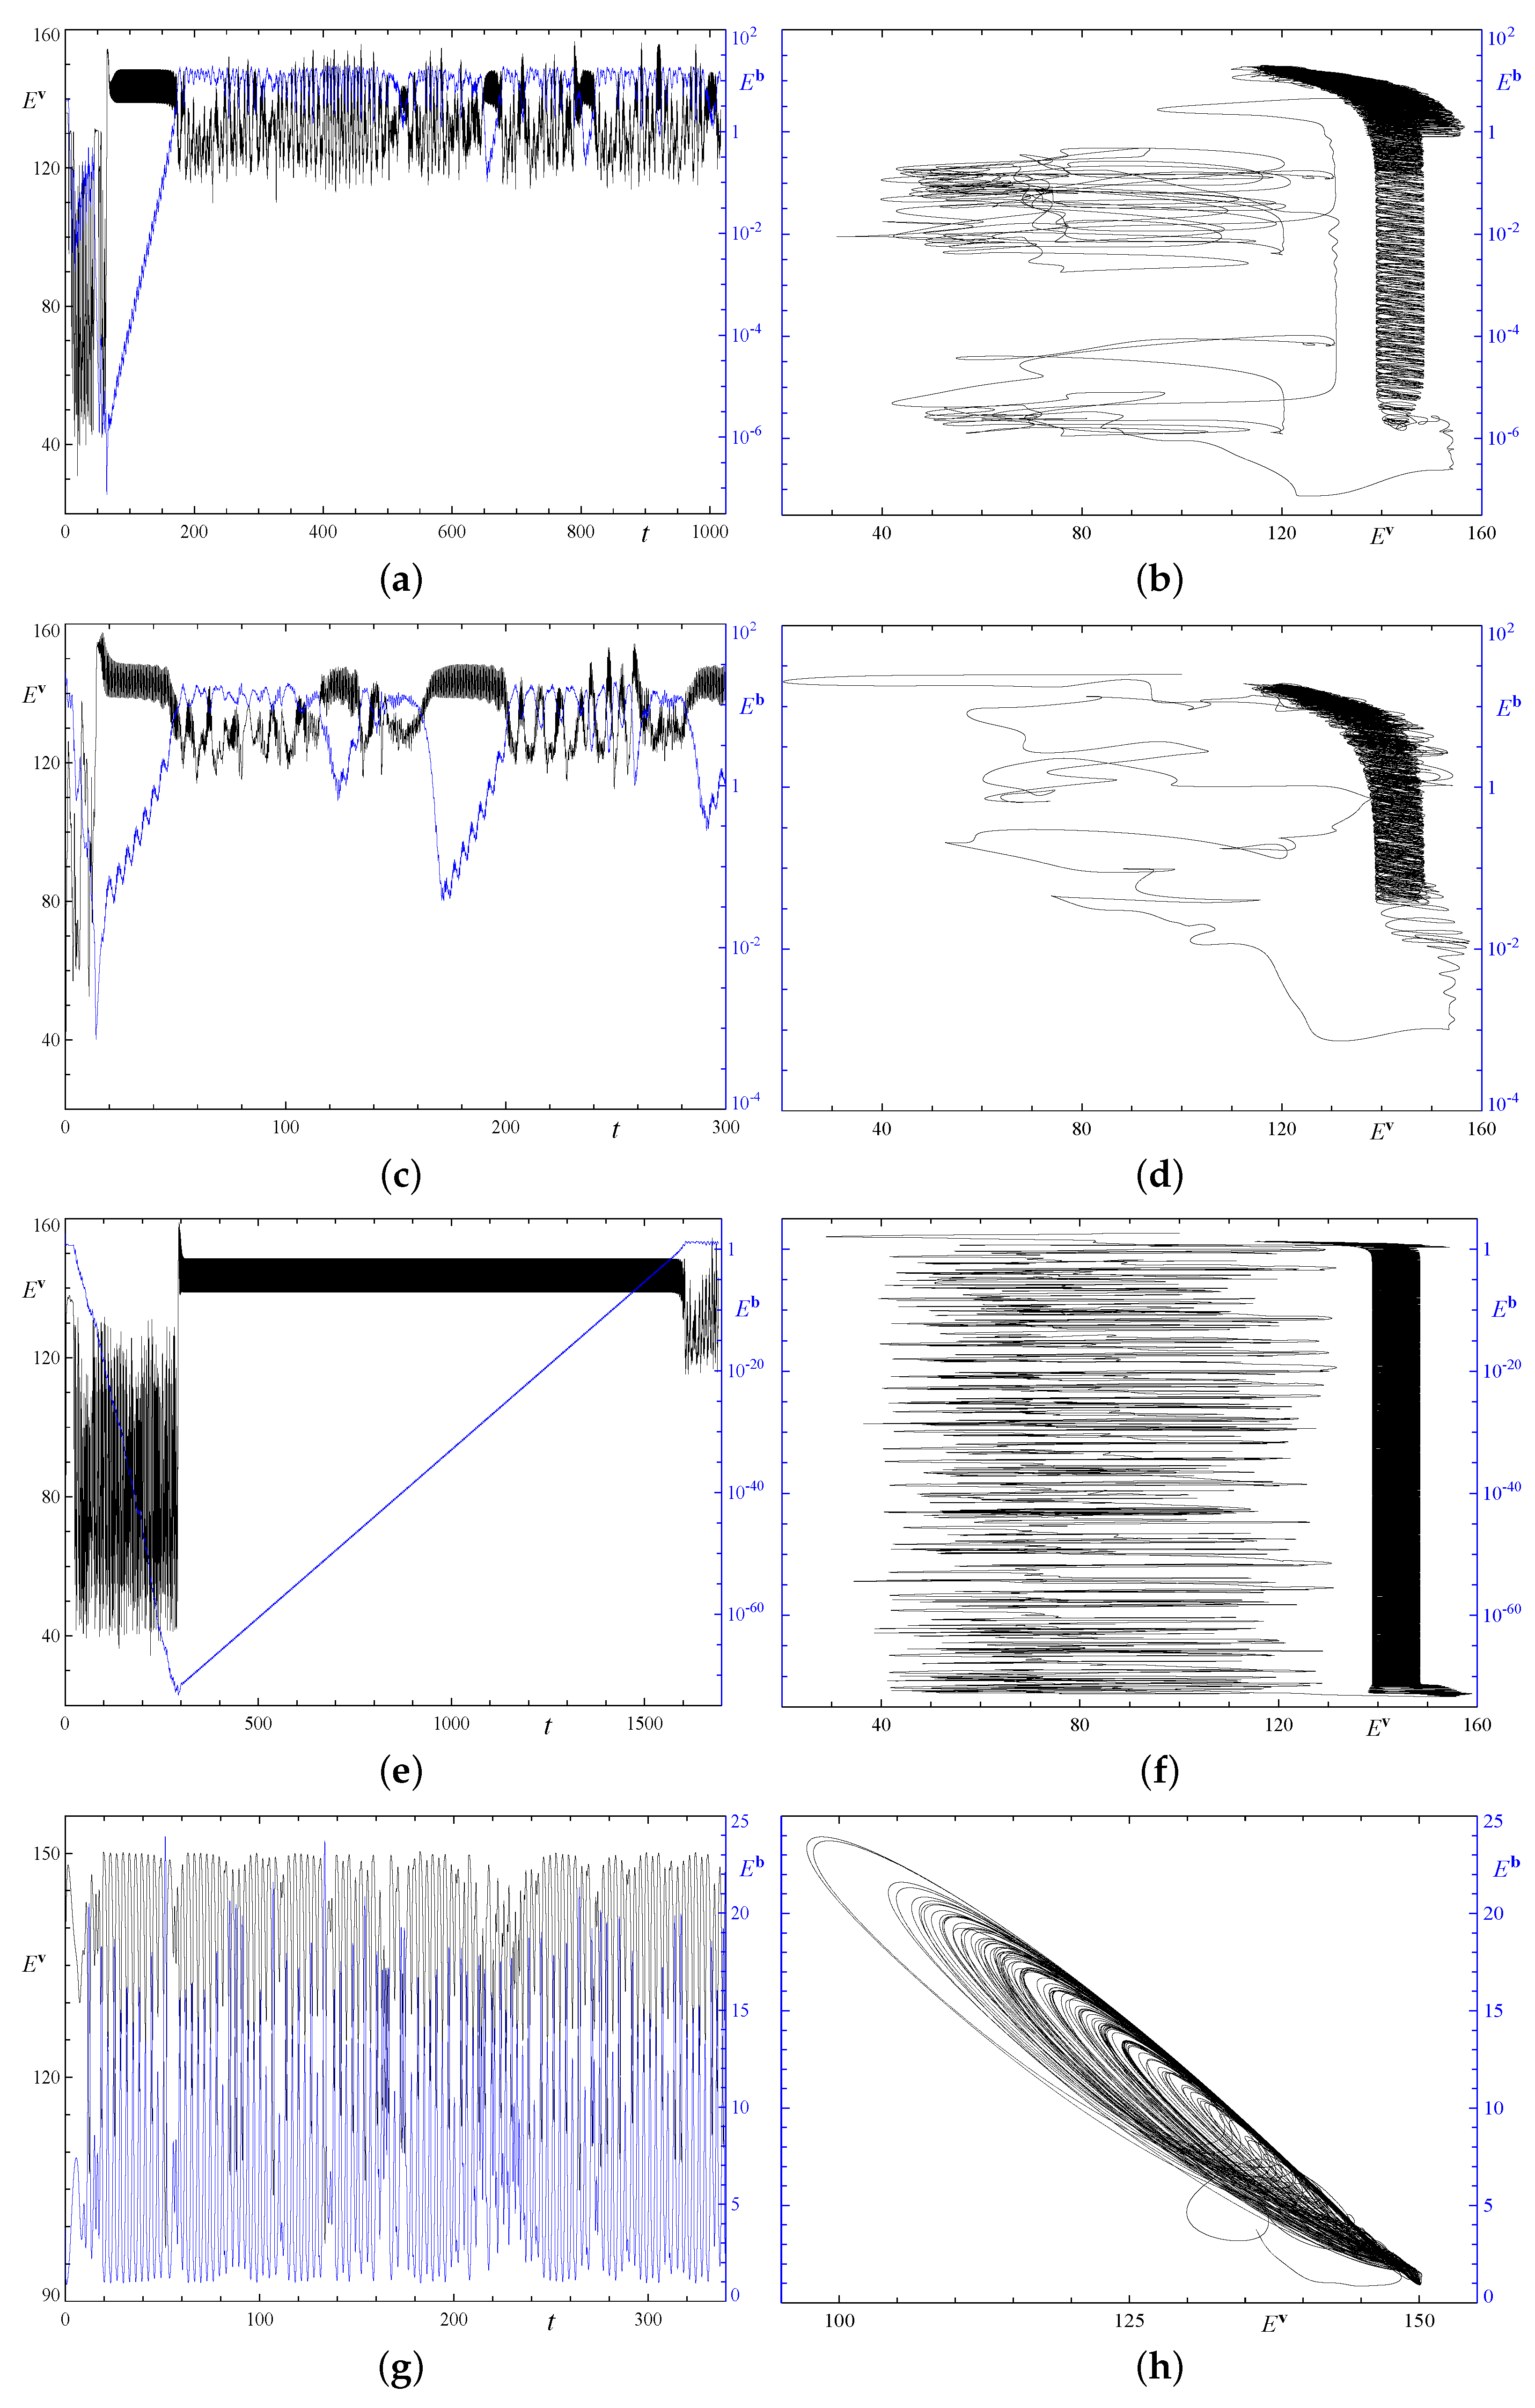
The data in Table 3 for the six runs in the 2x1- and 1x2-periodicity fluid volumes (which we call “double-period”) are only indicative. For instance, the plot Figure 5i, showing the temporal behaviour of the kinetic and magnetic energy in run 2x1.2, implies that the regime encountered in these periodicity cells is a succession of three distinct phases: the magnetic field decay phase ( 50 < t < 250 and 2000 < t 2200 in Figure 5i), the generation phase ( 300 < t < 1500 ) and the saturation phase ( 1550 < t < 1950 ), separated by short transition phases. Each phase is characterised by well-defined distinct values of the mean kinetic energy, length scales and the respective estimates of the magnetic Reynolds number. These are presented in Table 4, where the phases are labelled D (the magnetic field decay phase), G (the generation phase), S (the saturation phase) and T (the initial transitory regime). Phase G occurs when a trajectory in the phase space finds itself close to a travelling wave transporting a time-periodic flow capable of kinematic magnetic field generation (see the discussion below); by contrast, we have failed to identify an analogous non-dynamo underlying the hydrodynamic object of a simple temporal structure in phase D. These phases can be identified in the evolutions of the convective dynamo in all our double-period runs, except 2x1.1, and the lengths of the phases in all five successions change randomly; thus, estimating the mean values for an entire trajectory in the attractor reliably requires integrating it up to times of at least order 10 5 , which we cannot afford for obvious reasons.
Nonlinear convective dynamo regimes approaching for certain finite times flows of a simple temporal structure (such as steady states, periodic or quasiperiodic flows), that can generate magnetic field kinematically, are known in the literature. Most of them were detected numerically (see, for instance, [49,57,62]). Notably, an advance towards a periodic regime by the geodynamo was also observed in the paleomagnetic data in durations of the Earth’s geomagnetic epochs [68].
According to Table 4, the values of n and Rm n during phases G in the five runs for double-period cells are consistent: for each n, Rm n varies between runs in these phases by less than 0.1. The Rm 1 and Rm 2 values during phases D differ by less than 0.3, and the Rm 3 and Rm 4 values by less than 0.2. Evidently, we cannot expect a full coincidence of the values even for phases G, because (1) the time intervals used for computing Rm n during phases G in the vicinity of quasiperiodic metastable states have not been synchronised between the runs taking the quasiperiodicity into account; (2) during phase G, the flow closely approaches but does not coincide with the travelling wave which is the hydrodynamic component of the amagnetic metastable state; in particular, (3) the magnetic field affects the flow, especially in the beginning of phases D and towards the end of phases G. The Rm n values obtained for phases S are, as can be expected, less consistent.
The six runs for the double-period fluid volume turn out to reveal two different attractors, this explaining the difference of the Rm n estimates in phases S.
The coincidence of the attractor in the five runs has been verified by comparing some of their quantitative characteristics: For instance, different runs exhibit the same growth and decay rates in phases G and D, respectively, and the same kinetic energy levels in each phase; this remains true for more subtle quantities, such as the characteristic length scales (7) and the magnetic Reynolds number estimates. Figure 5 illustrates the richness of details featured by individual trajectories approaching the attractor. The similarity of the regimes is evident in plots of the kinetic and magnetic energies in the double-period runs 1x2.3, 2x1.2 and 2x1.3 (see Figure 5e,i,k), as well as in projections of trajectories on the plane of kinetic and magnetic energies (Figure 5f,j,l). The relatively thin “cylinders”, i.e., spirals that are densely populated by almost horizontal, slowly rising relatively narrow loops display phases G, and their upper sections, gradually shifting to the left, phases S. The irregularly entangled and relatively wide curves in the left part of the plots Figure 5b,d display the initial phases T, and the wide “cylinders”, i.e., spirals comprised of relatively less densely populated, almost horizontal, slowly descending, relatively wide loops in Figure 5f display phase D occurring after a very short transient phase in run 1x2.3. A short plateaux for 45 < t < 51 (well visible upon magnifying the figure in the electronic version of the paper) is approached exponentially by the trajectory in run 1x2.1; it displays an amagnetic metastable state. The plot Figure 5i for run 2x1.2 demonstrates that the attractor consists of a cyclic repetition of phases D, G and S.
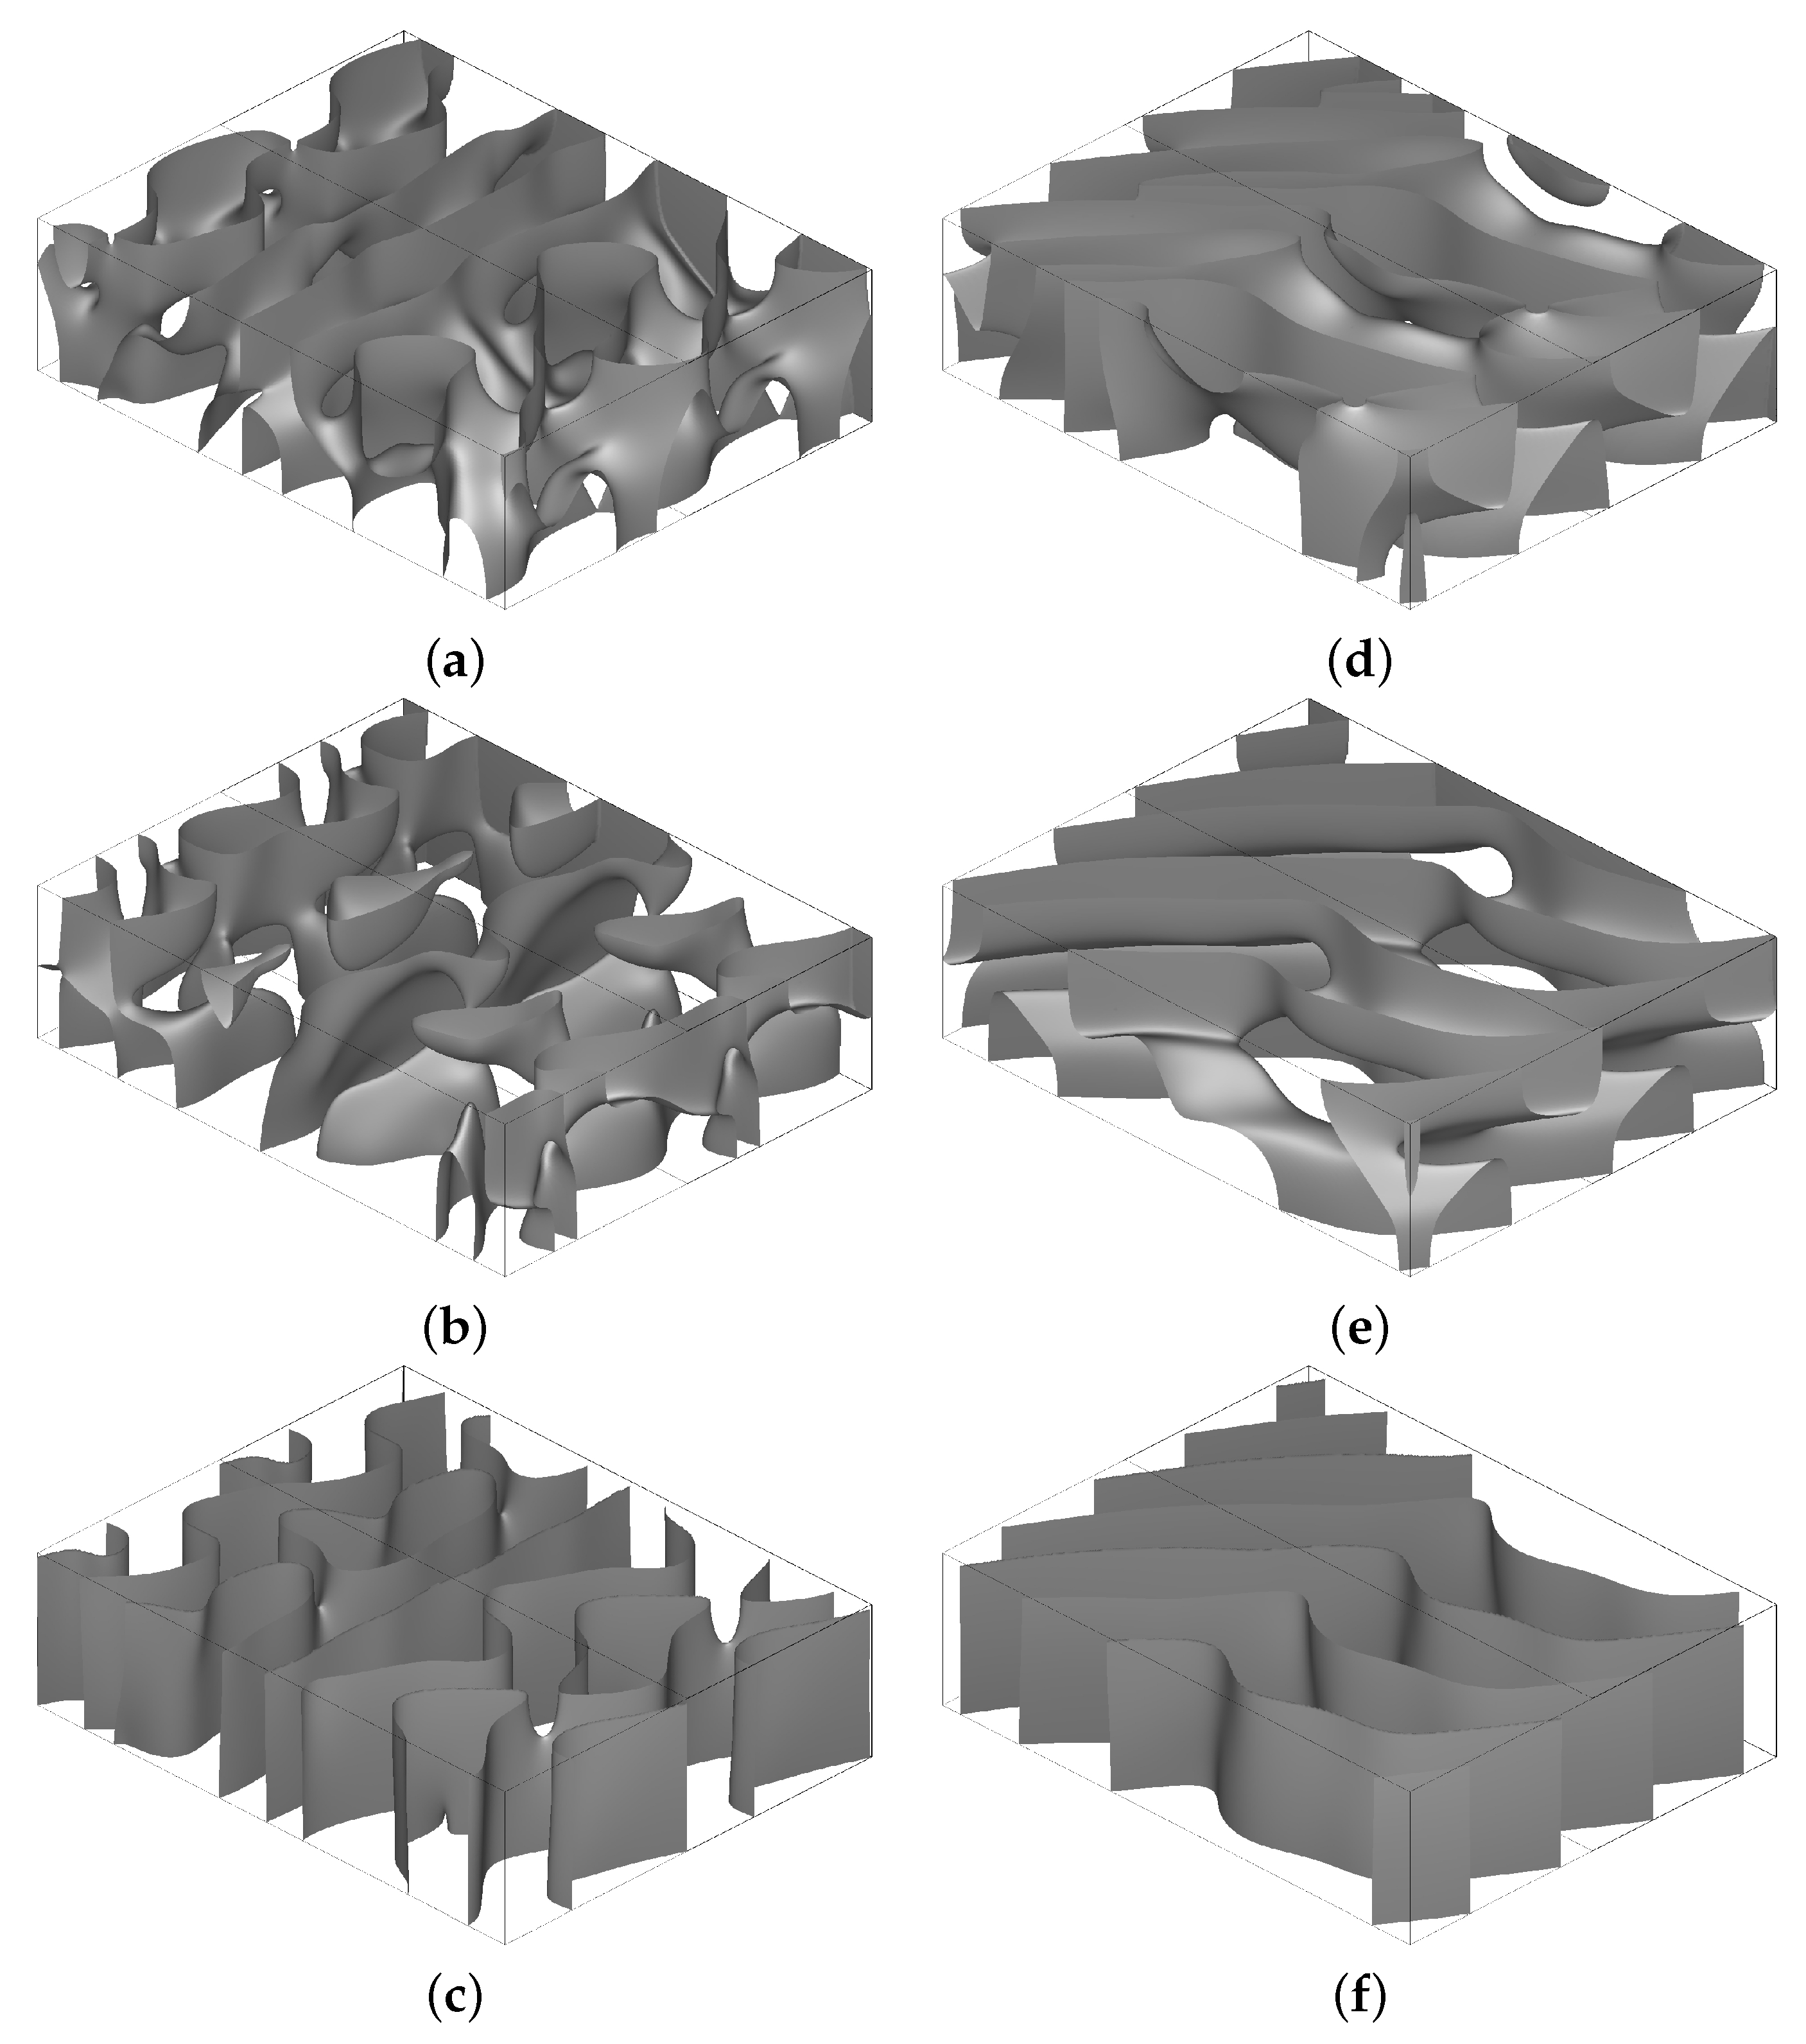
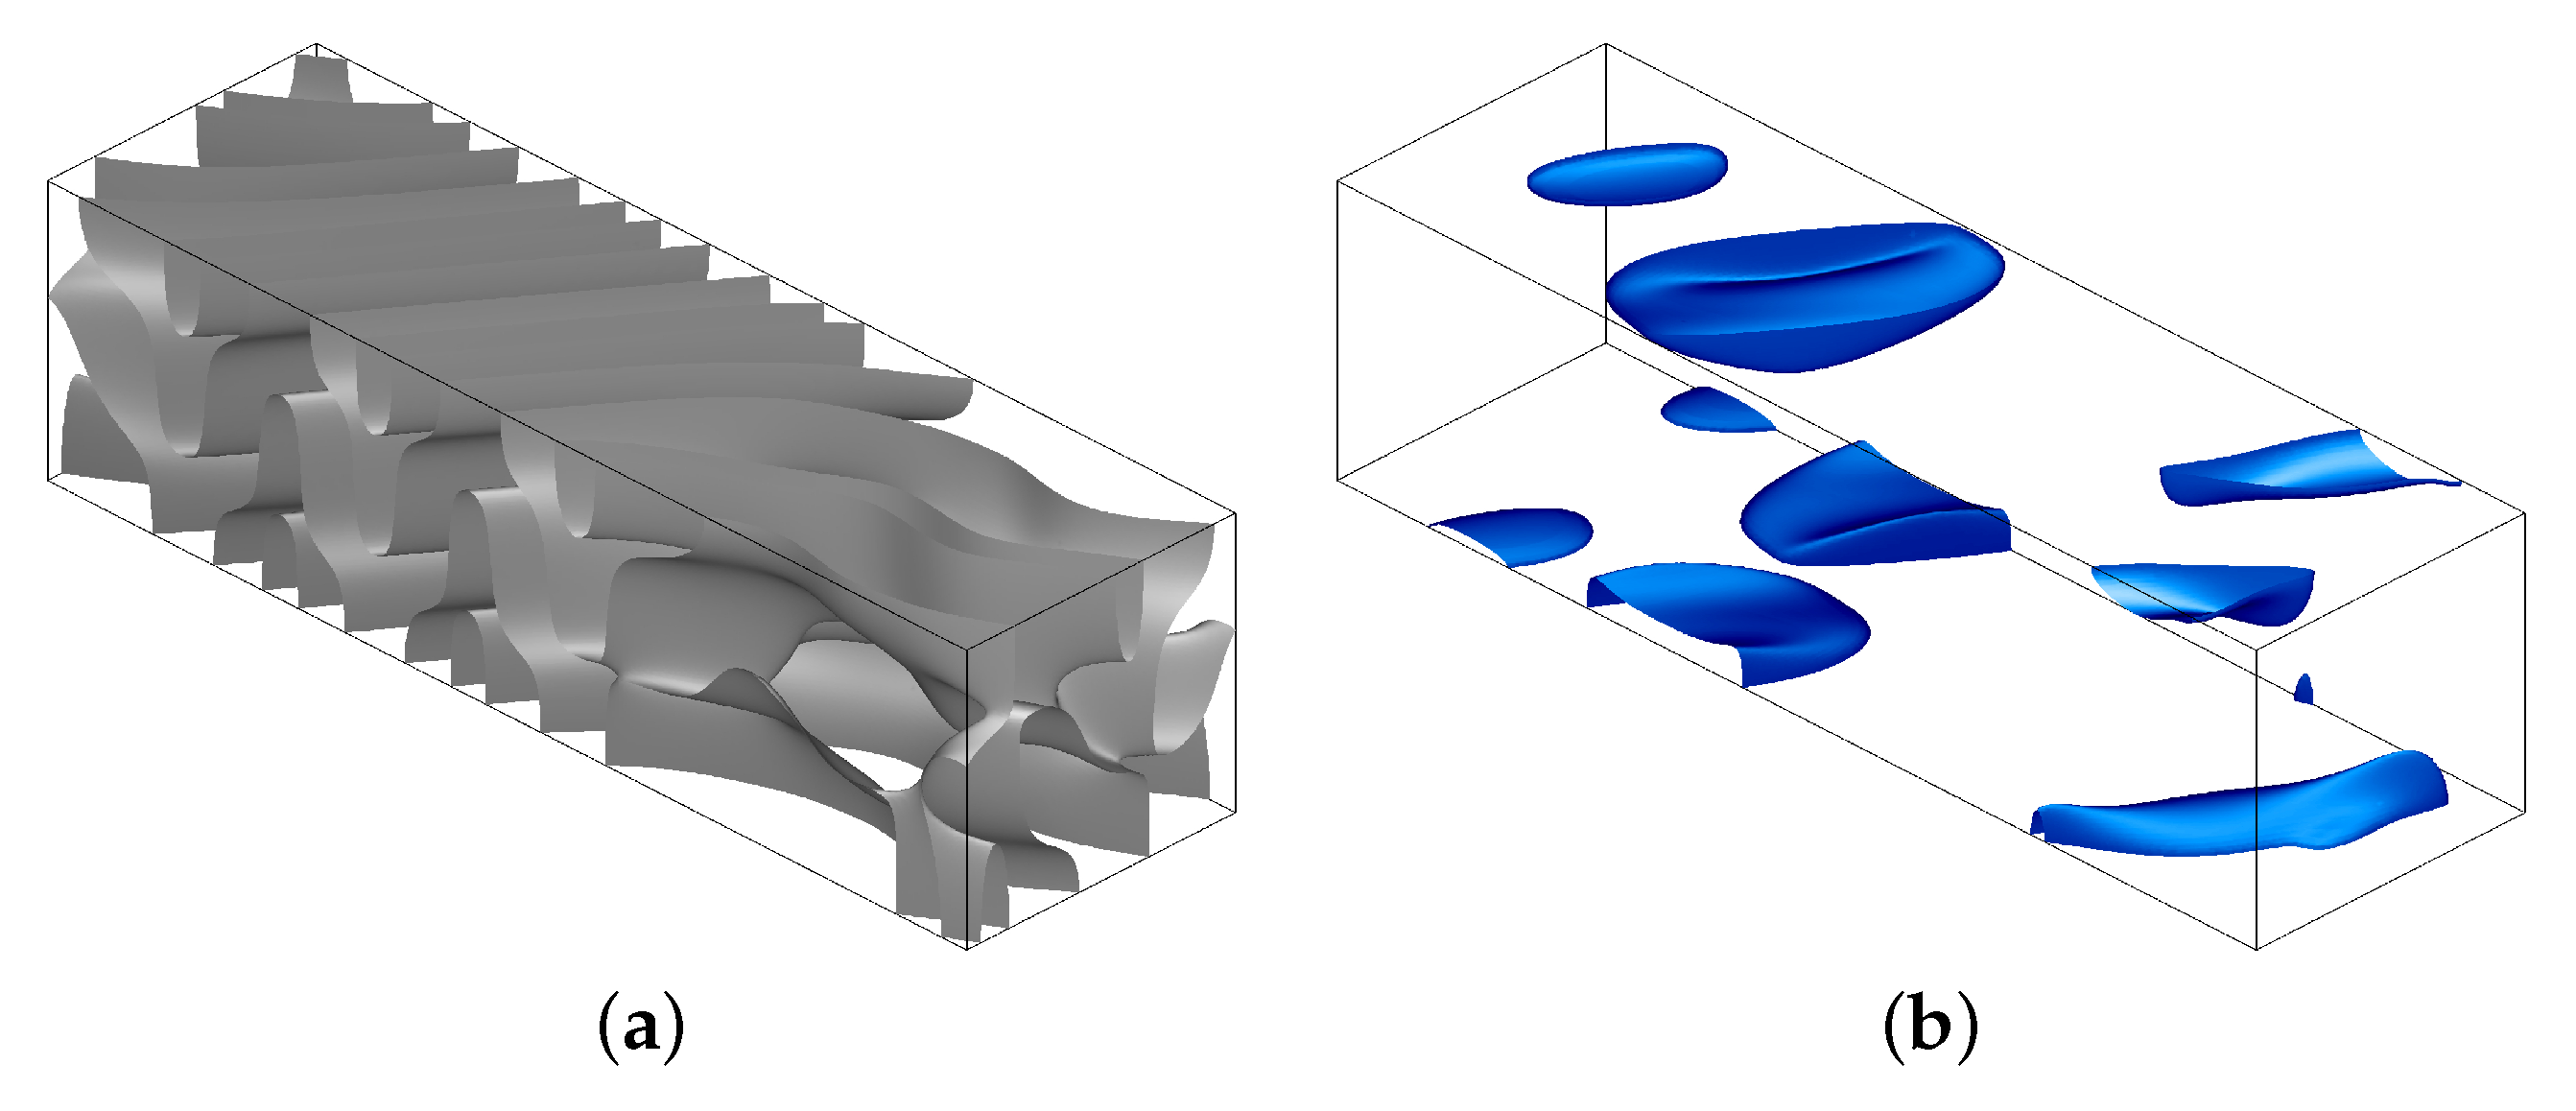
The plots of the isosurfaces of the kinetic (Figure 6a) and magnetic (b) energy densities in run 1x2.3 at a randomly chosen time t = 1650.707 demonstrate that the double-cell periodicity of the physical fields does not degenerate into the single-cell periodicity of the unperturbed convective dynamo.
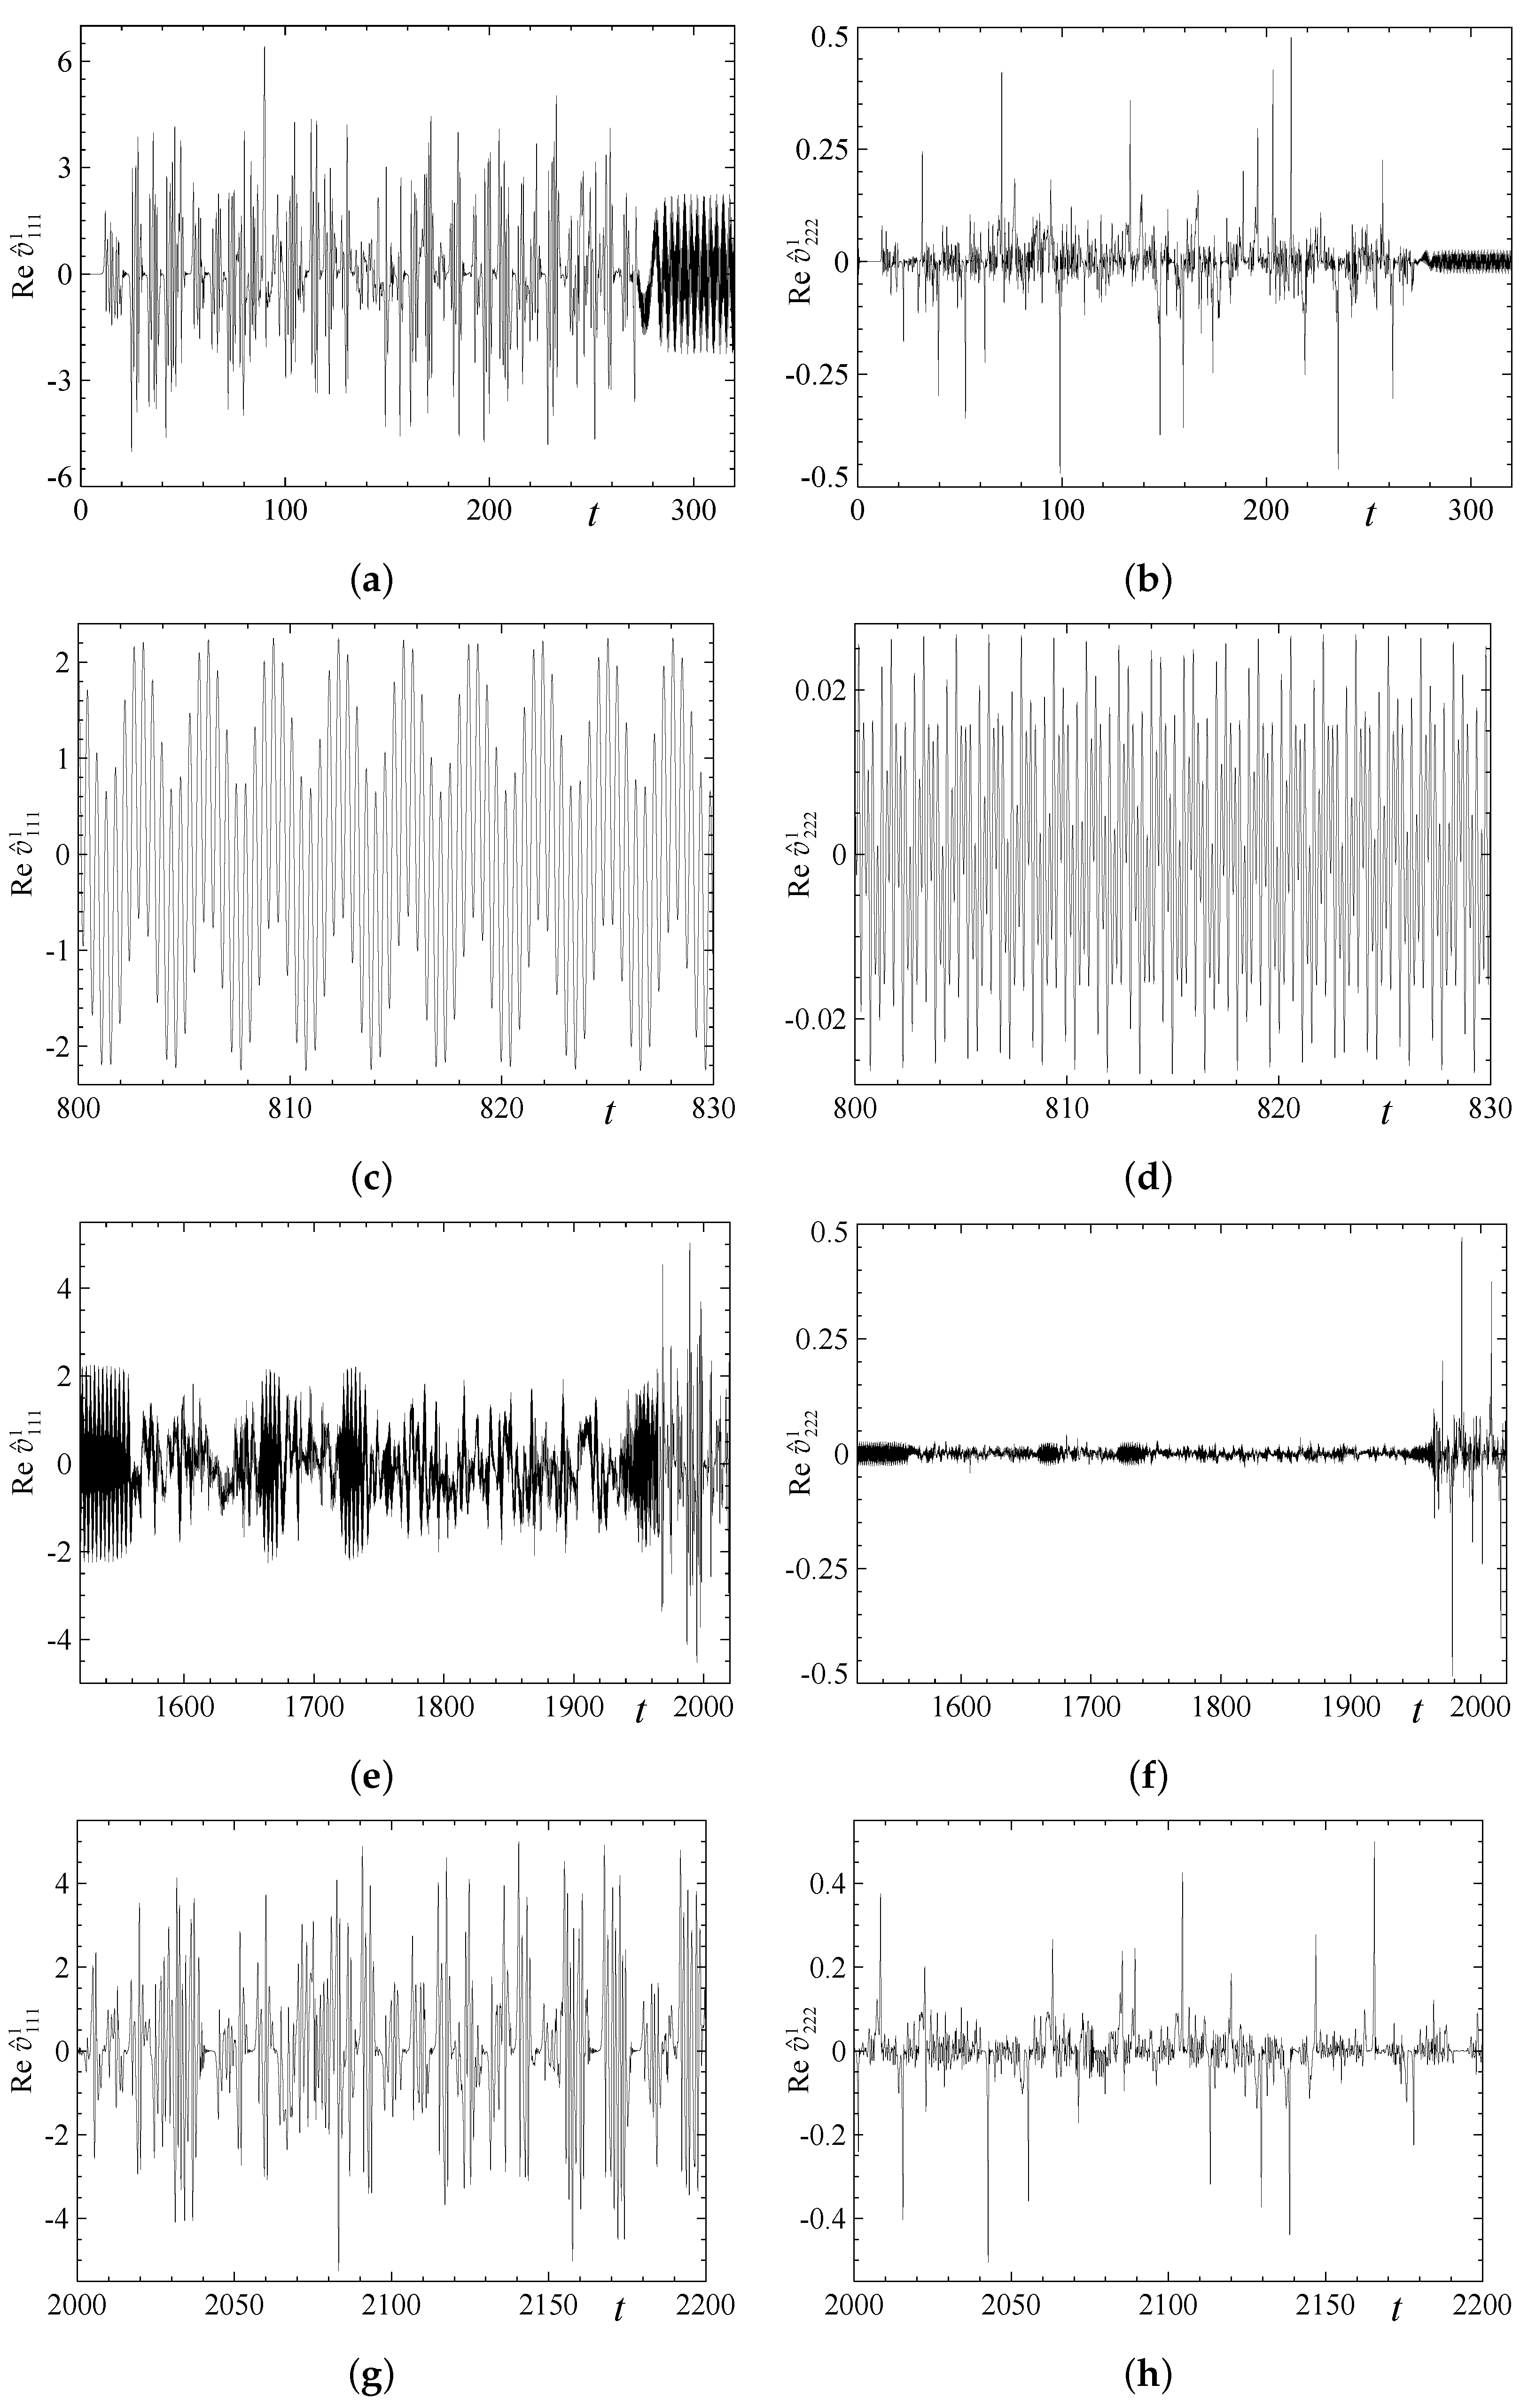
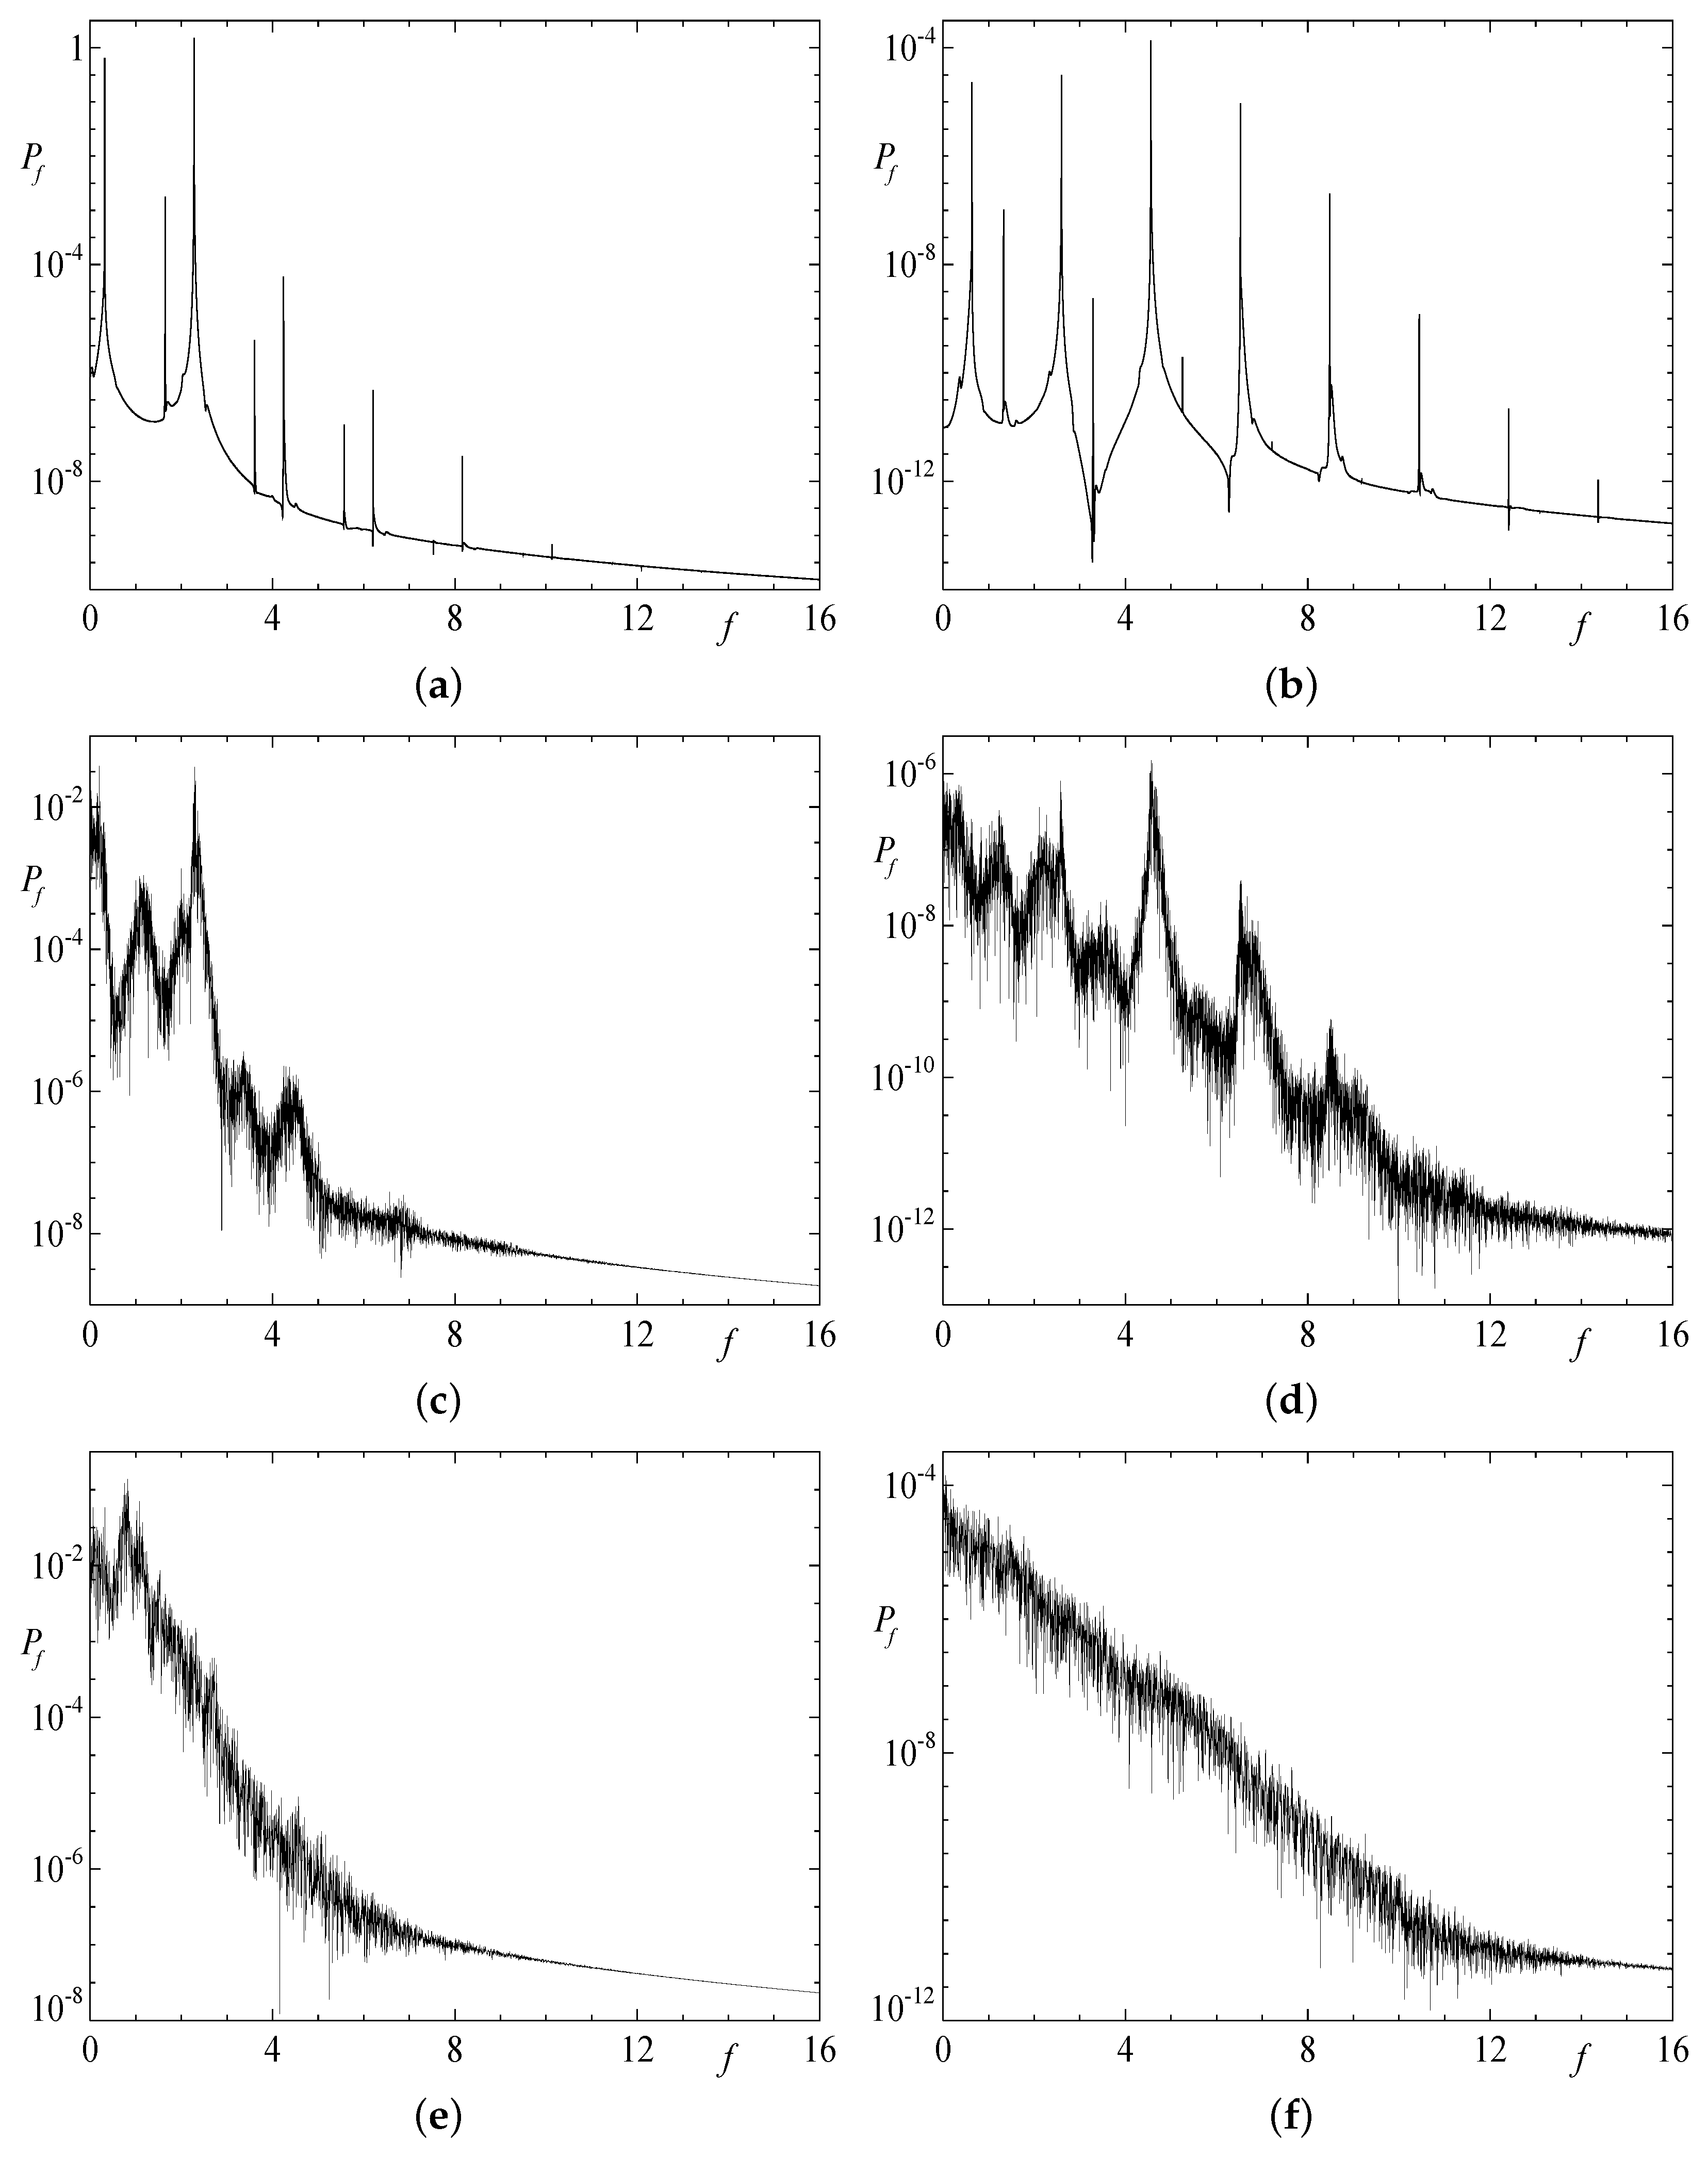
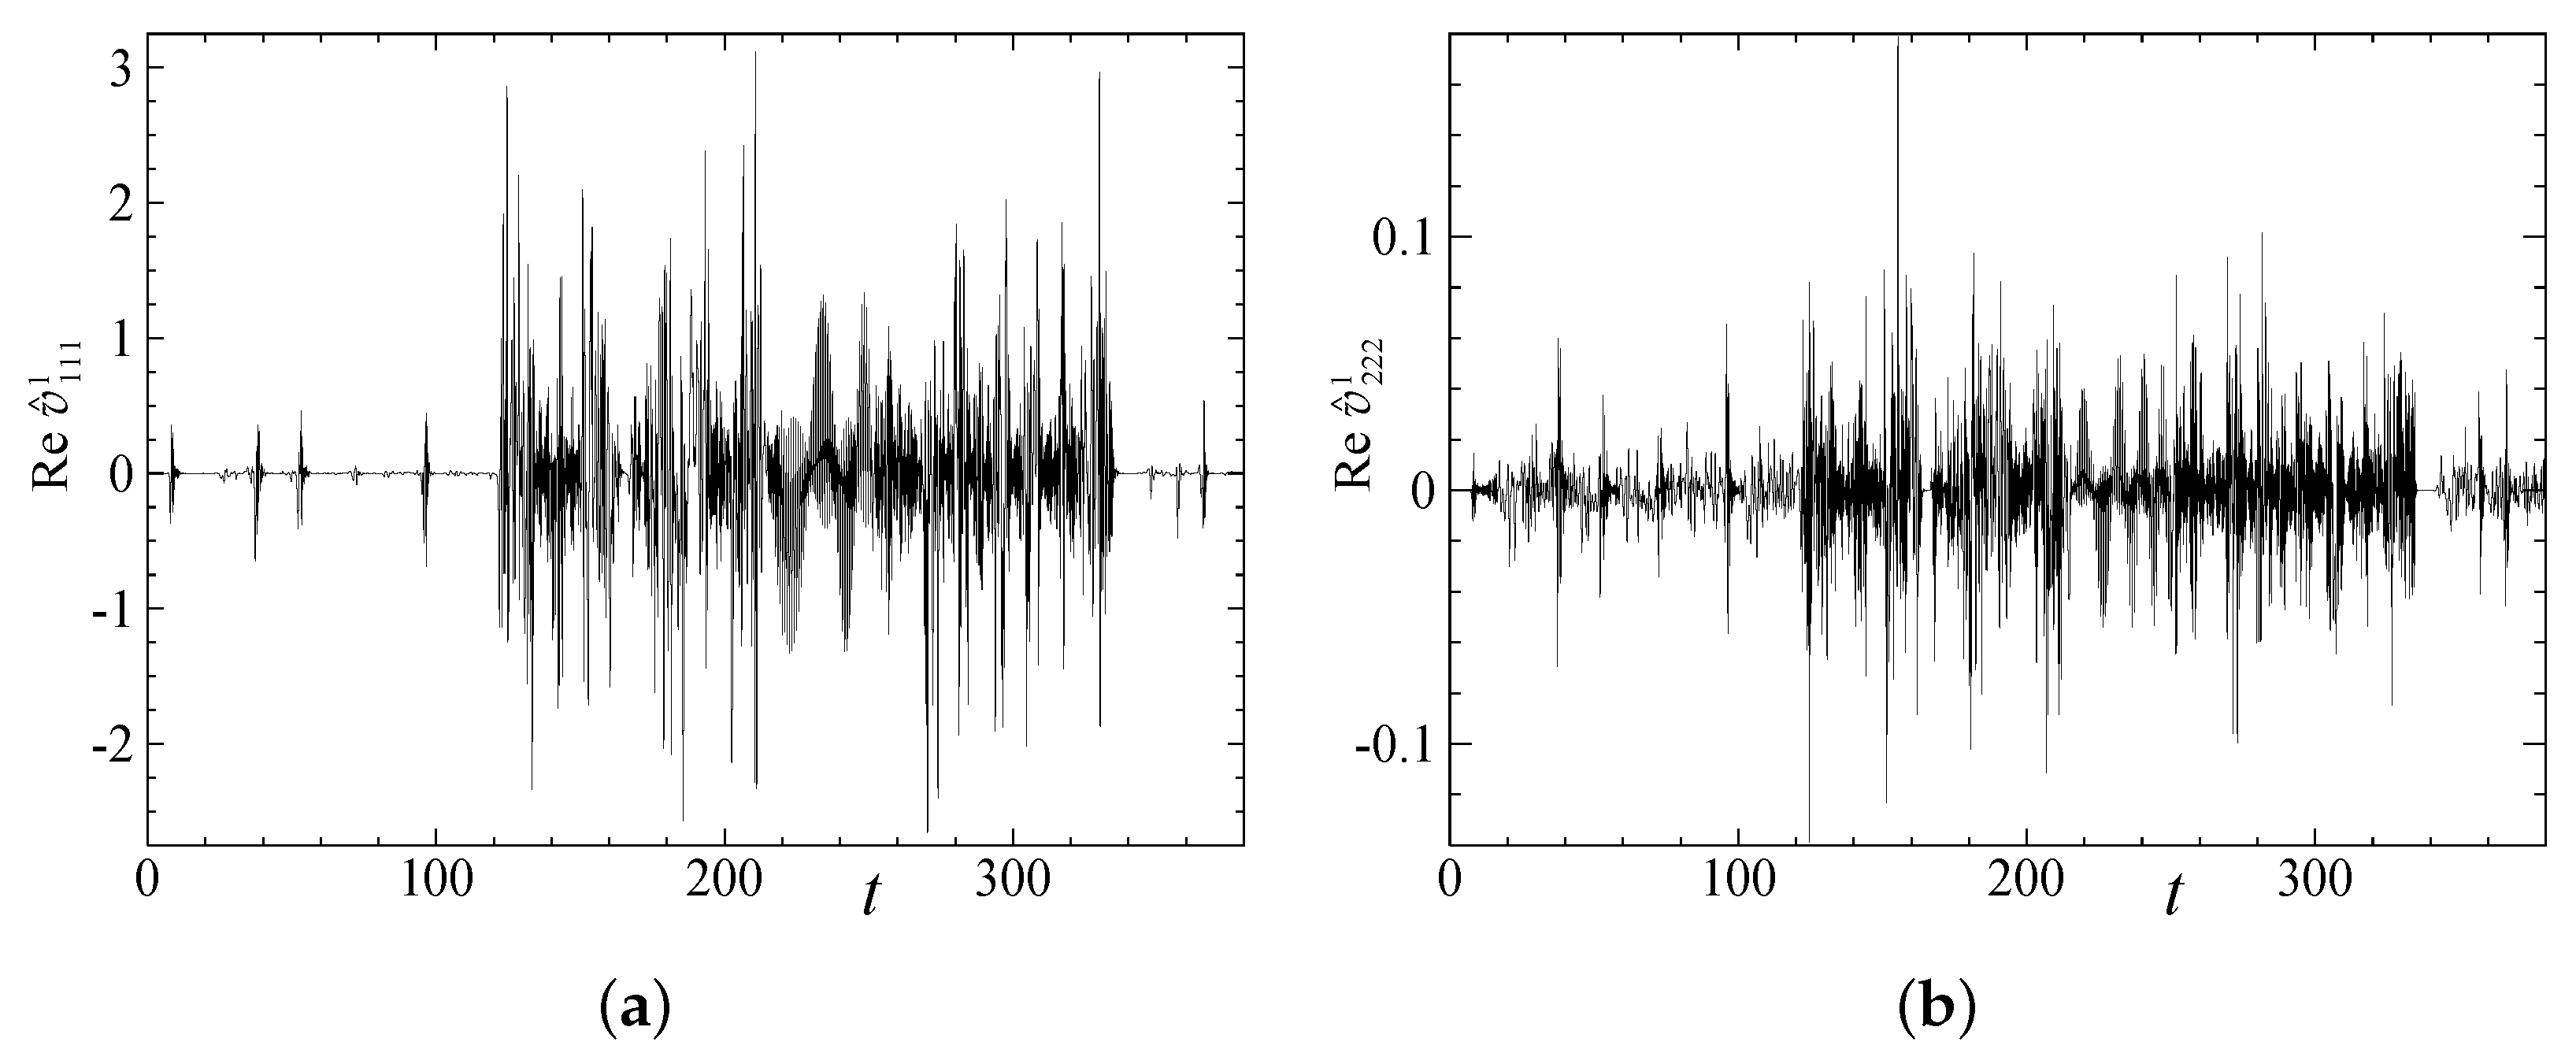
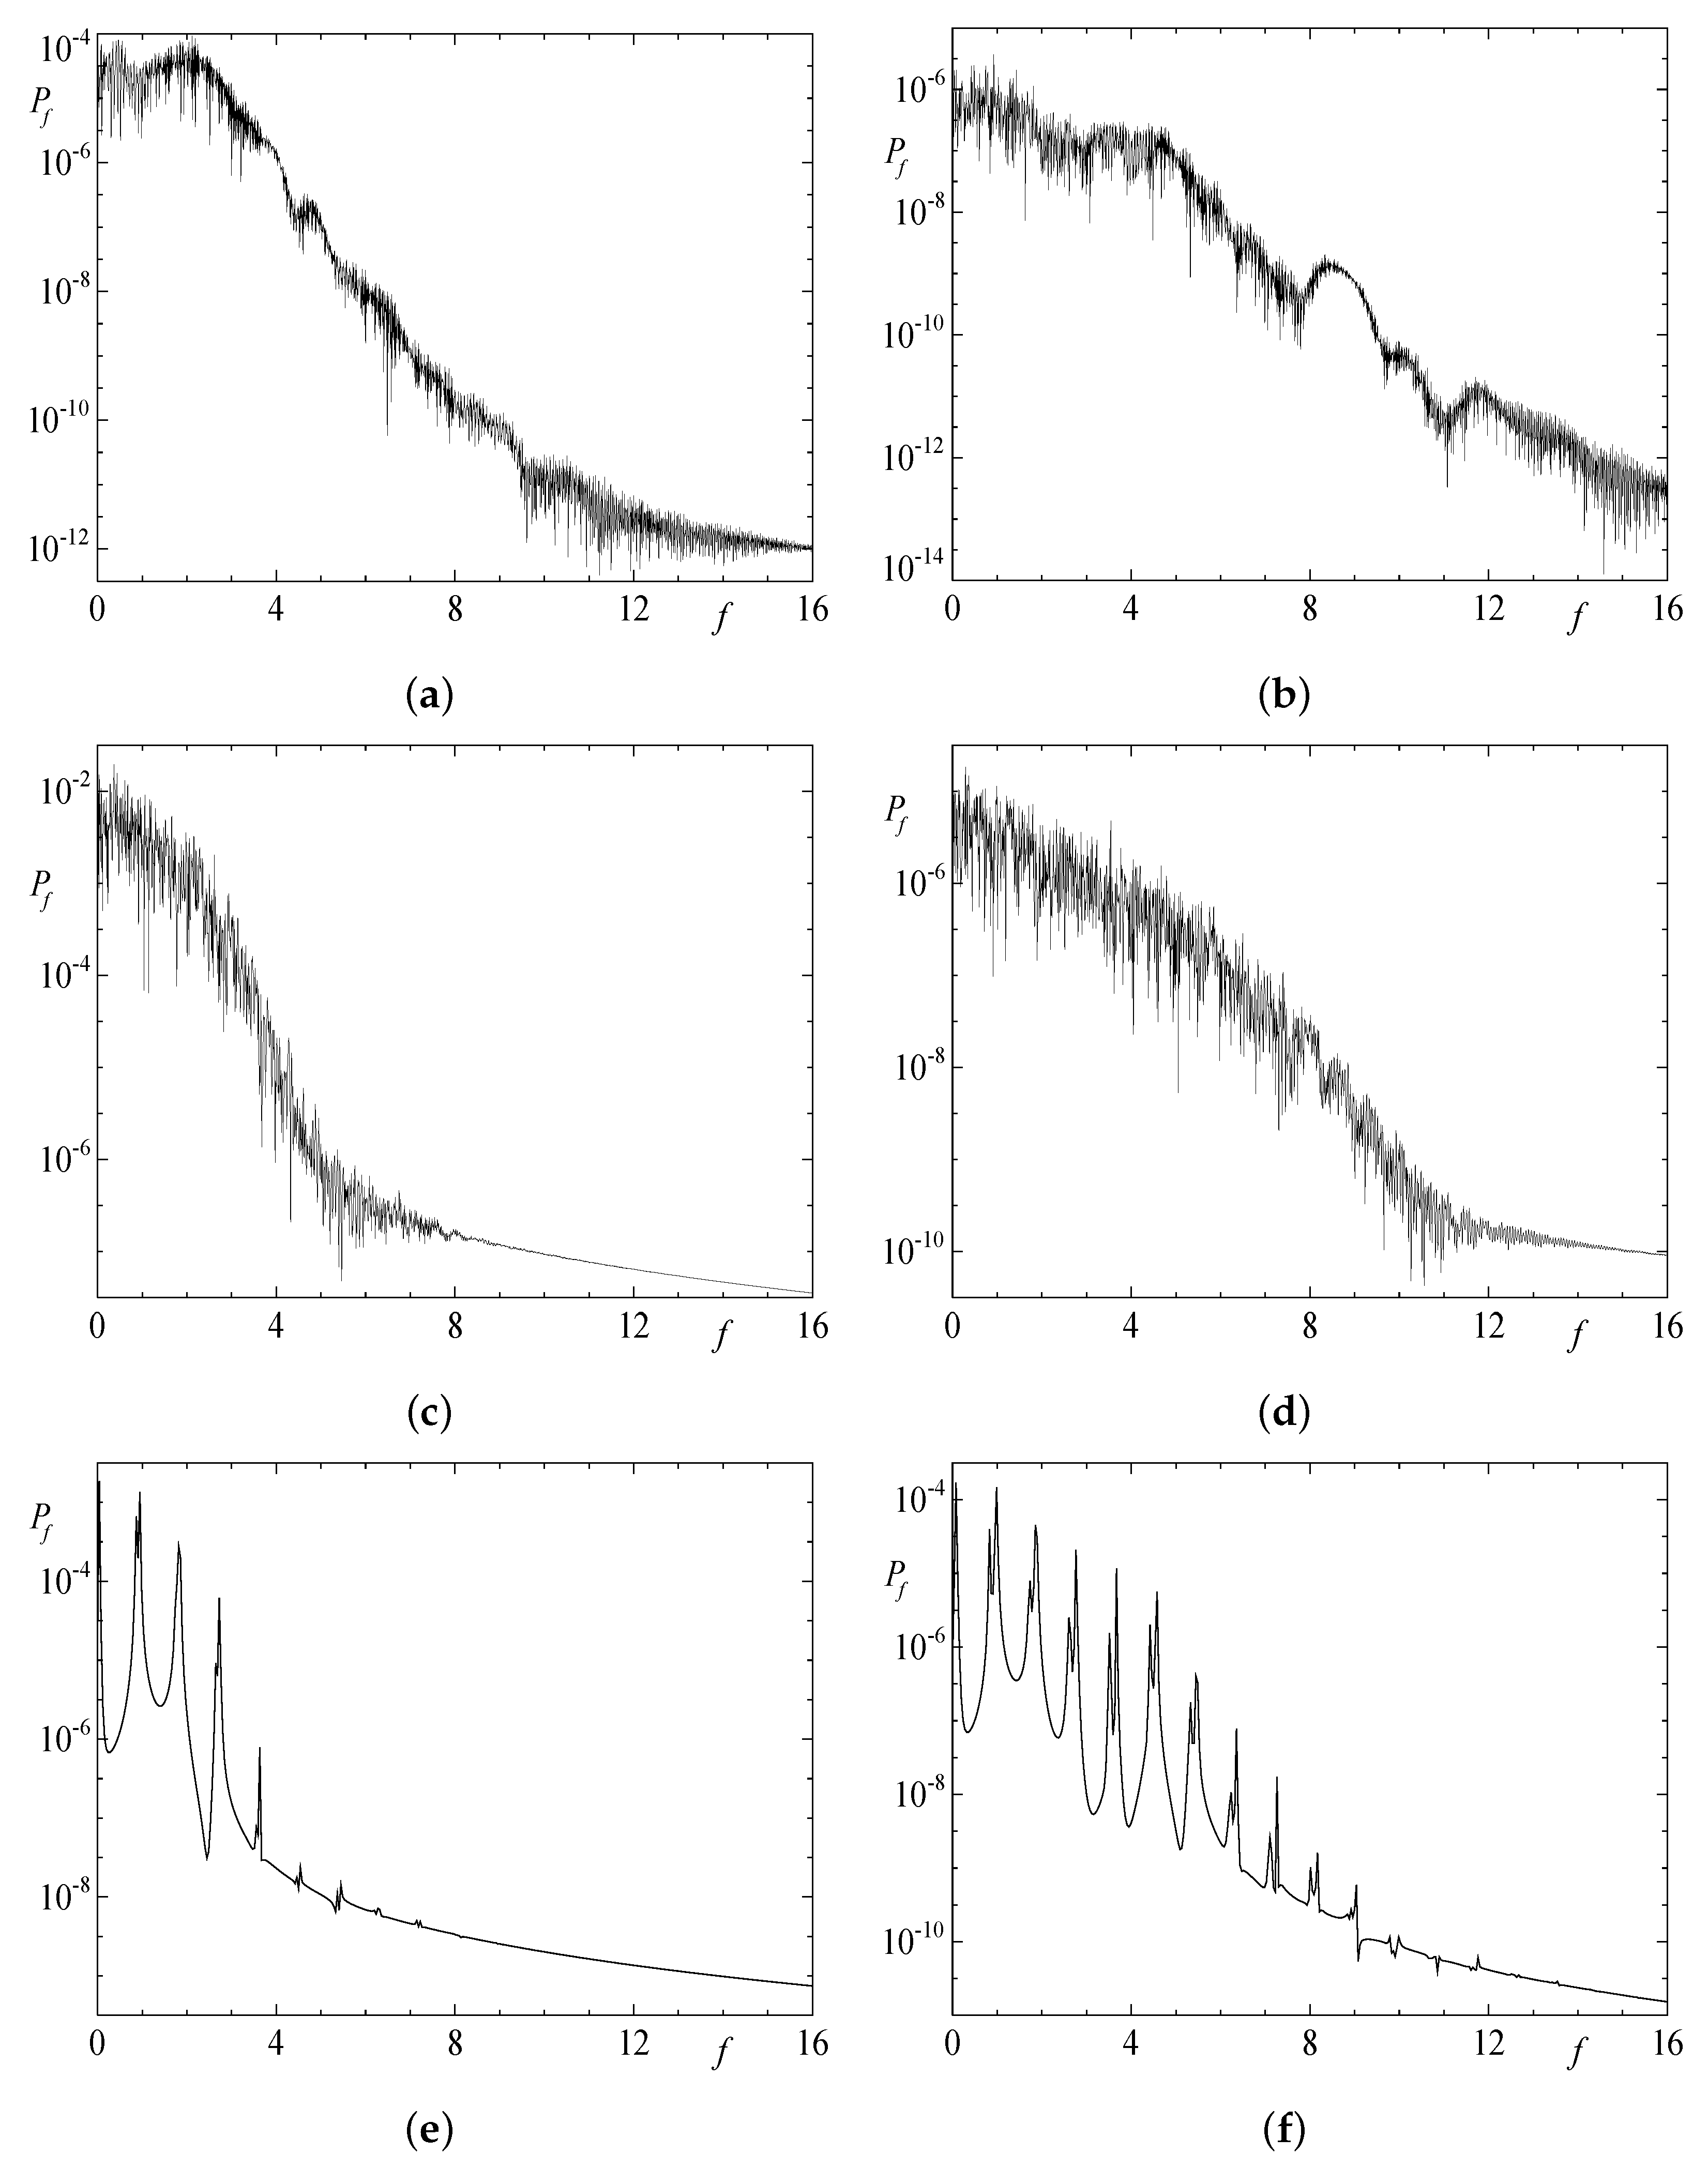
We illustrate the temporal behaviour of the flow in run 2x1.2 by the plots of real parts of the Fourier coefficients v ^ 111 1 and v ^ 222 1 in Figure 7 in the time intervals 0 t 320 (phase T of the initial transient process, see Figure 5i), 800 t 830 (phase G, quasiperiodic metastable state), 1520 t 1620 (phase S, including connections with the previous phase G and subsequent phase D) and 2000 t 2200 (phase D). This behaviour is typical for individual harmonics in the five double-period runs. The temporal power spectra of these coefficients in phases G, S and D are shown in Figure 8. The plots reveal that in phase G the flow possesses two basic frequencies, it is a travelling wave (basic frequency f T W = 0.317 ) transporting a periodic orbit (basic frequency f P O = 1.961 ), and in phases S and D the dynamical system is chaotic. The saturated behaviour in phase S is intricate; for instance, the hydrodynamic quasiperiodic metastable state of phase G is revisited in the time intervals 1660 t 1675 and 1720 t 1740 .
The following evidences corroborate the coincidence of the generating flows in phases G of runs 1x2.3, 2x1.2 and 2x1.3:
  • All of them are quasiperiodic hydrodynamic travelling waves.
  • The energy ranges and mean (over time) energies coincide.
  • The basic frequencies are identical.
  • The ranges of the magnetic Reynolds number estimates Rm 1 and Rm 3 and their mean (over time) values coincide.
  • The ranges of the kinetic helicity and its temporal mean values are the same.
  • The growth rates of the dominant magnetic modes are also equal.
  • The flows have the symmetry r γ L / 2 1 in the 1x2 cell and r γ L / 2 2 in the 2x1 cell.
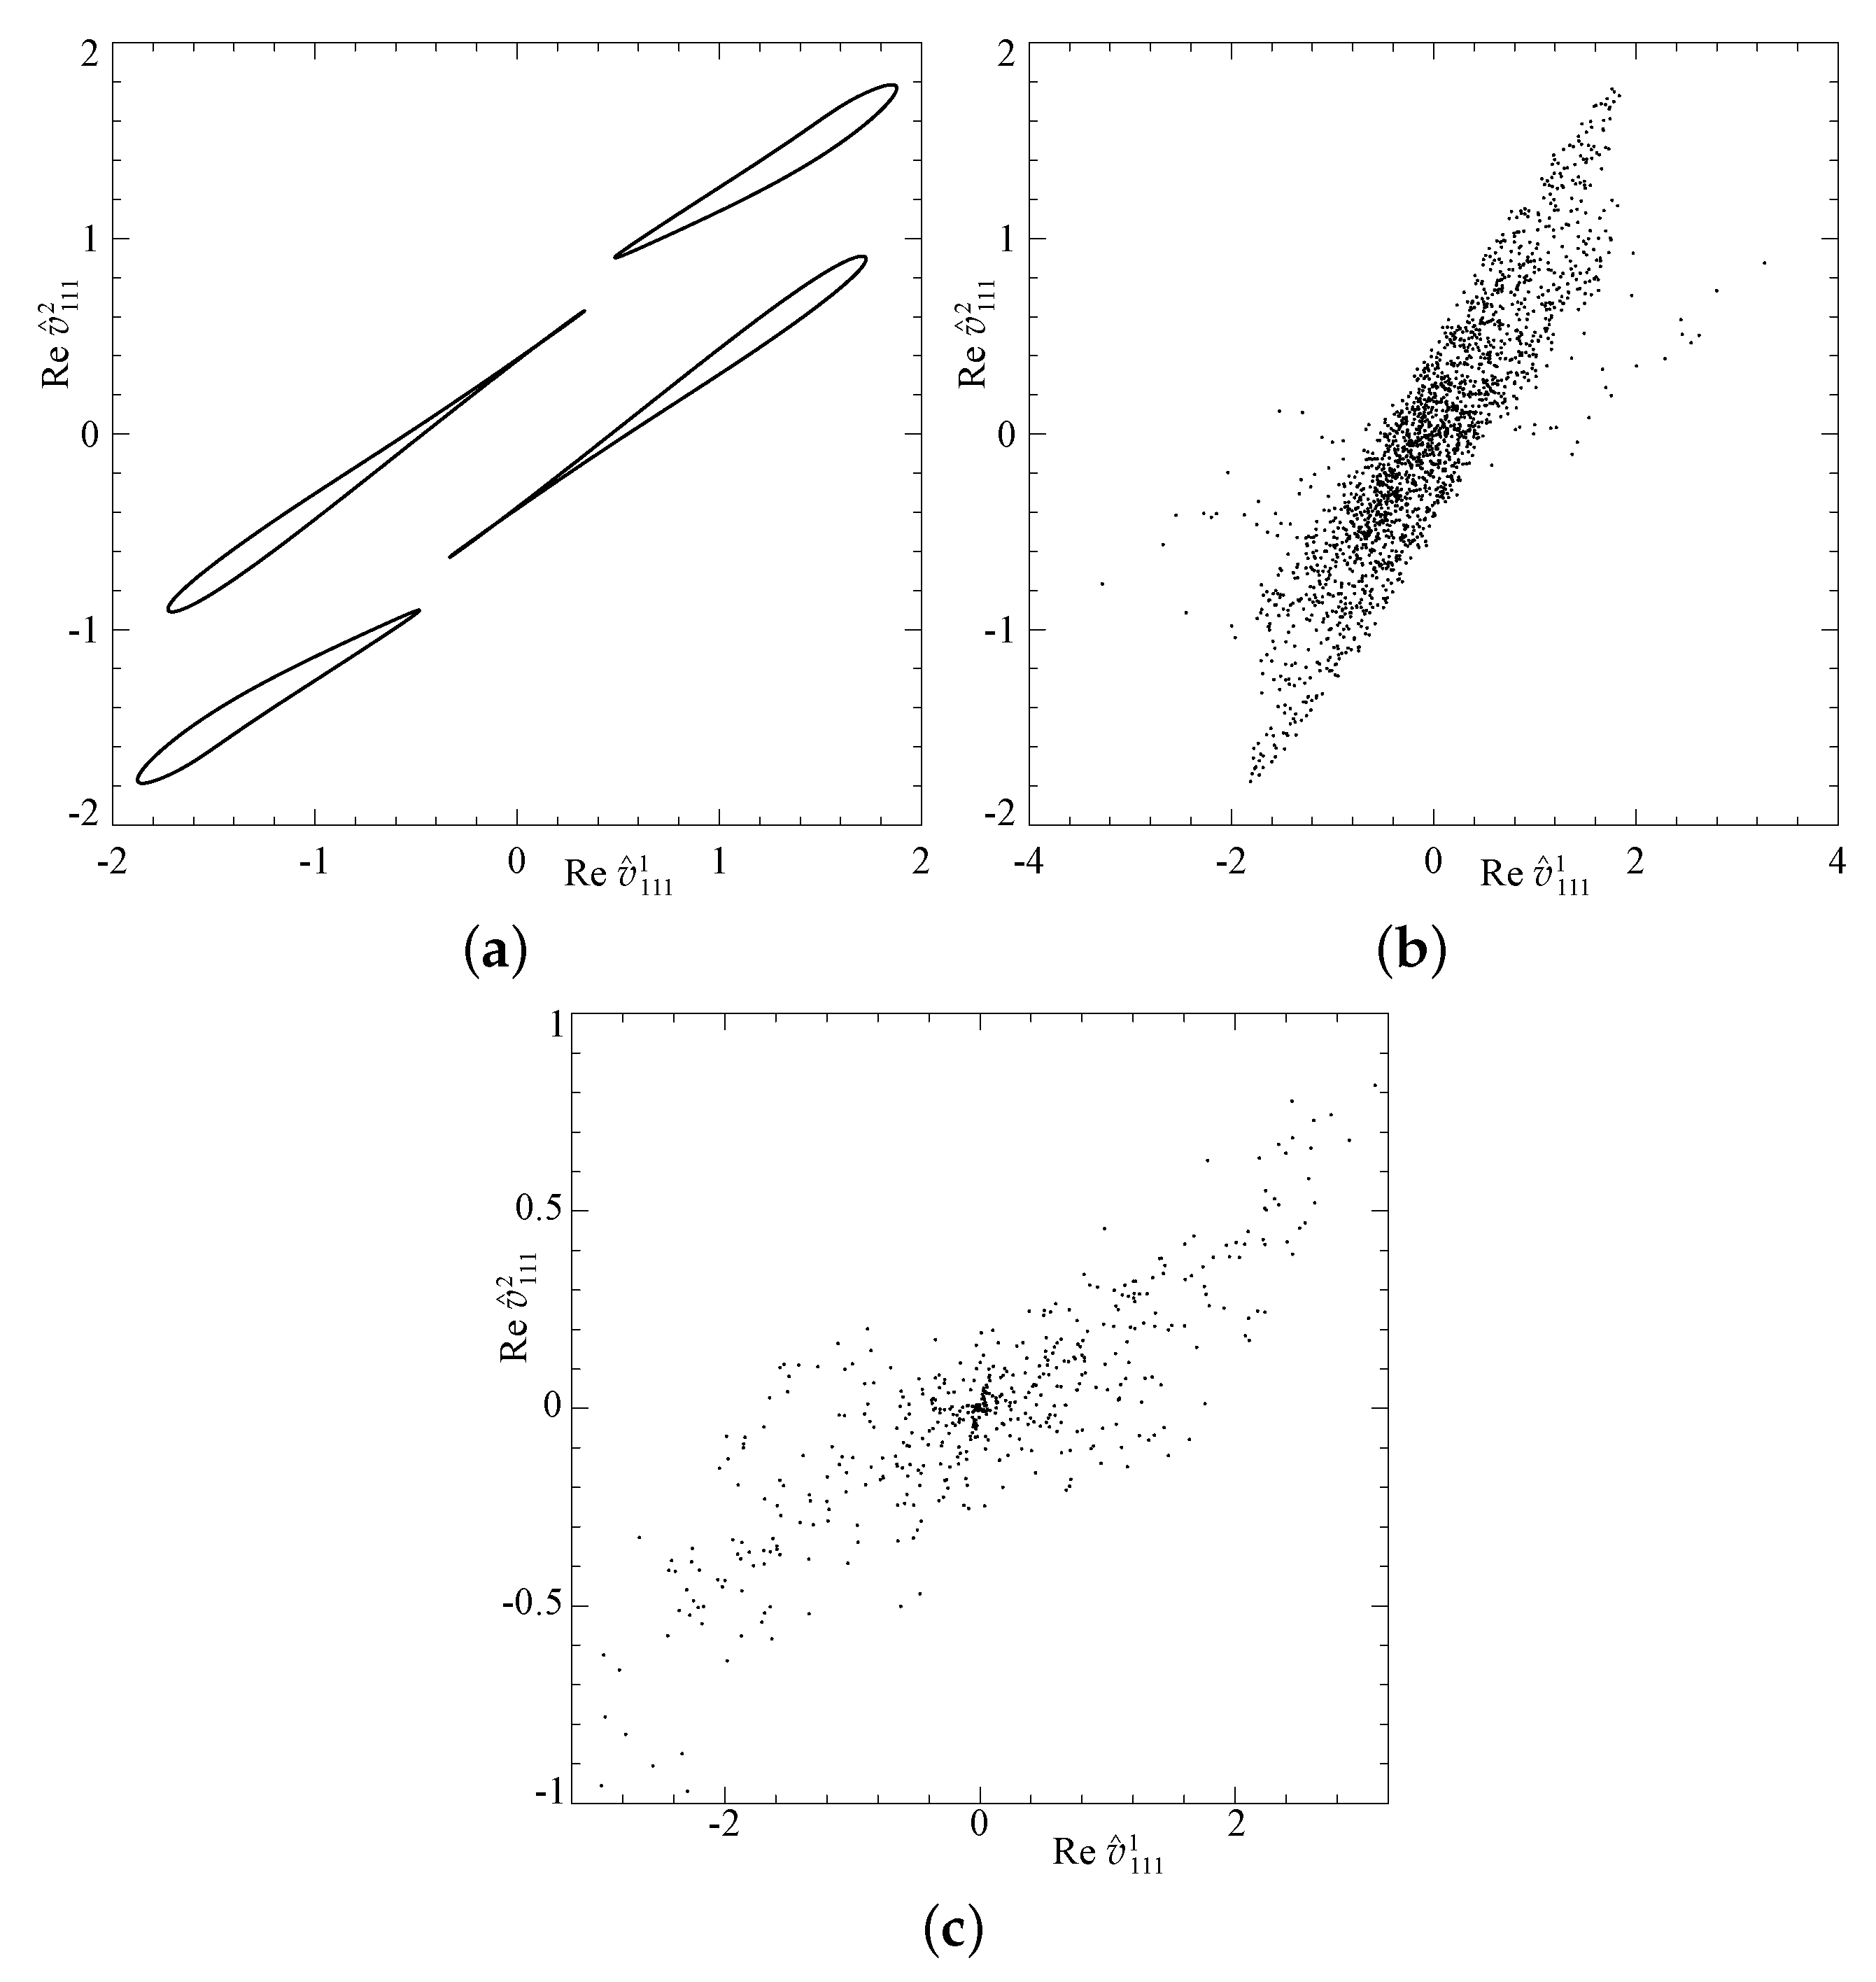
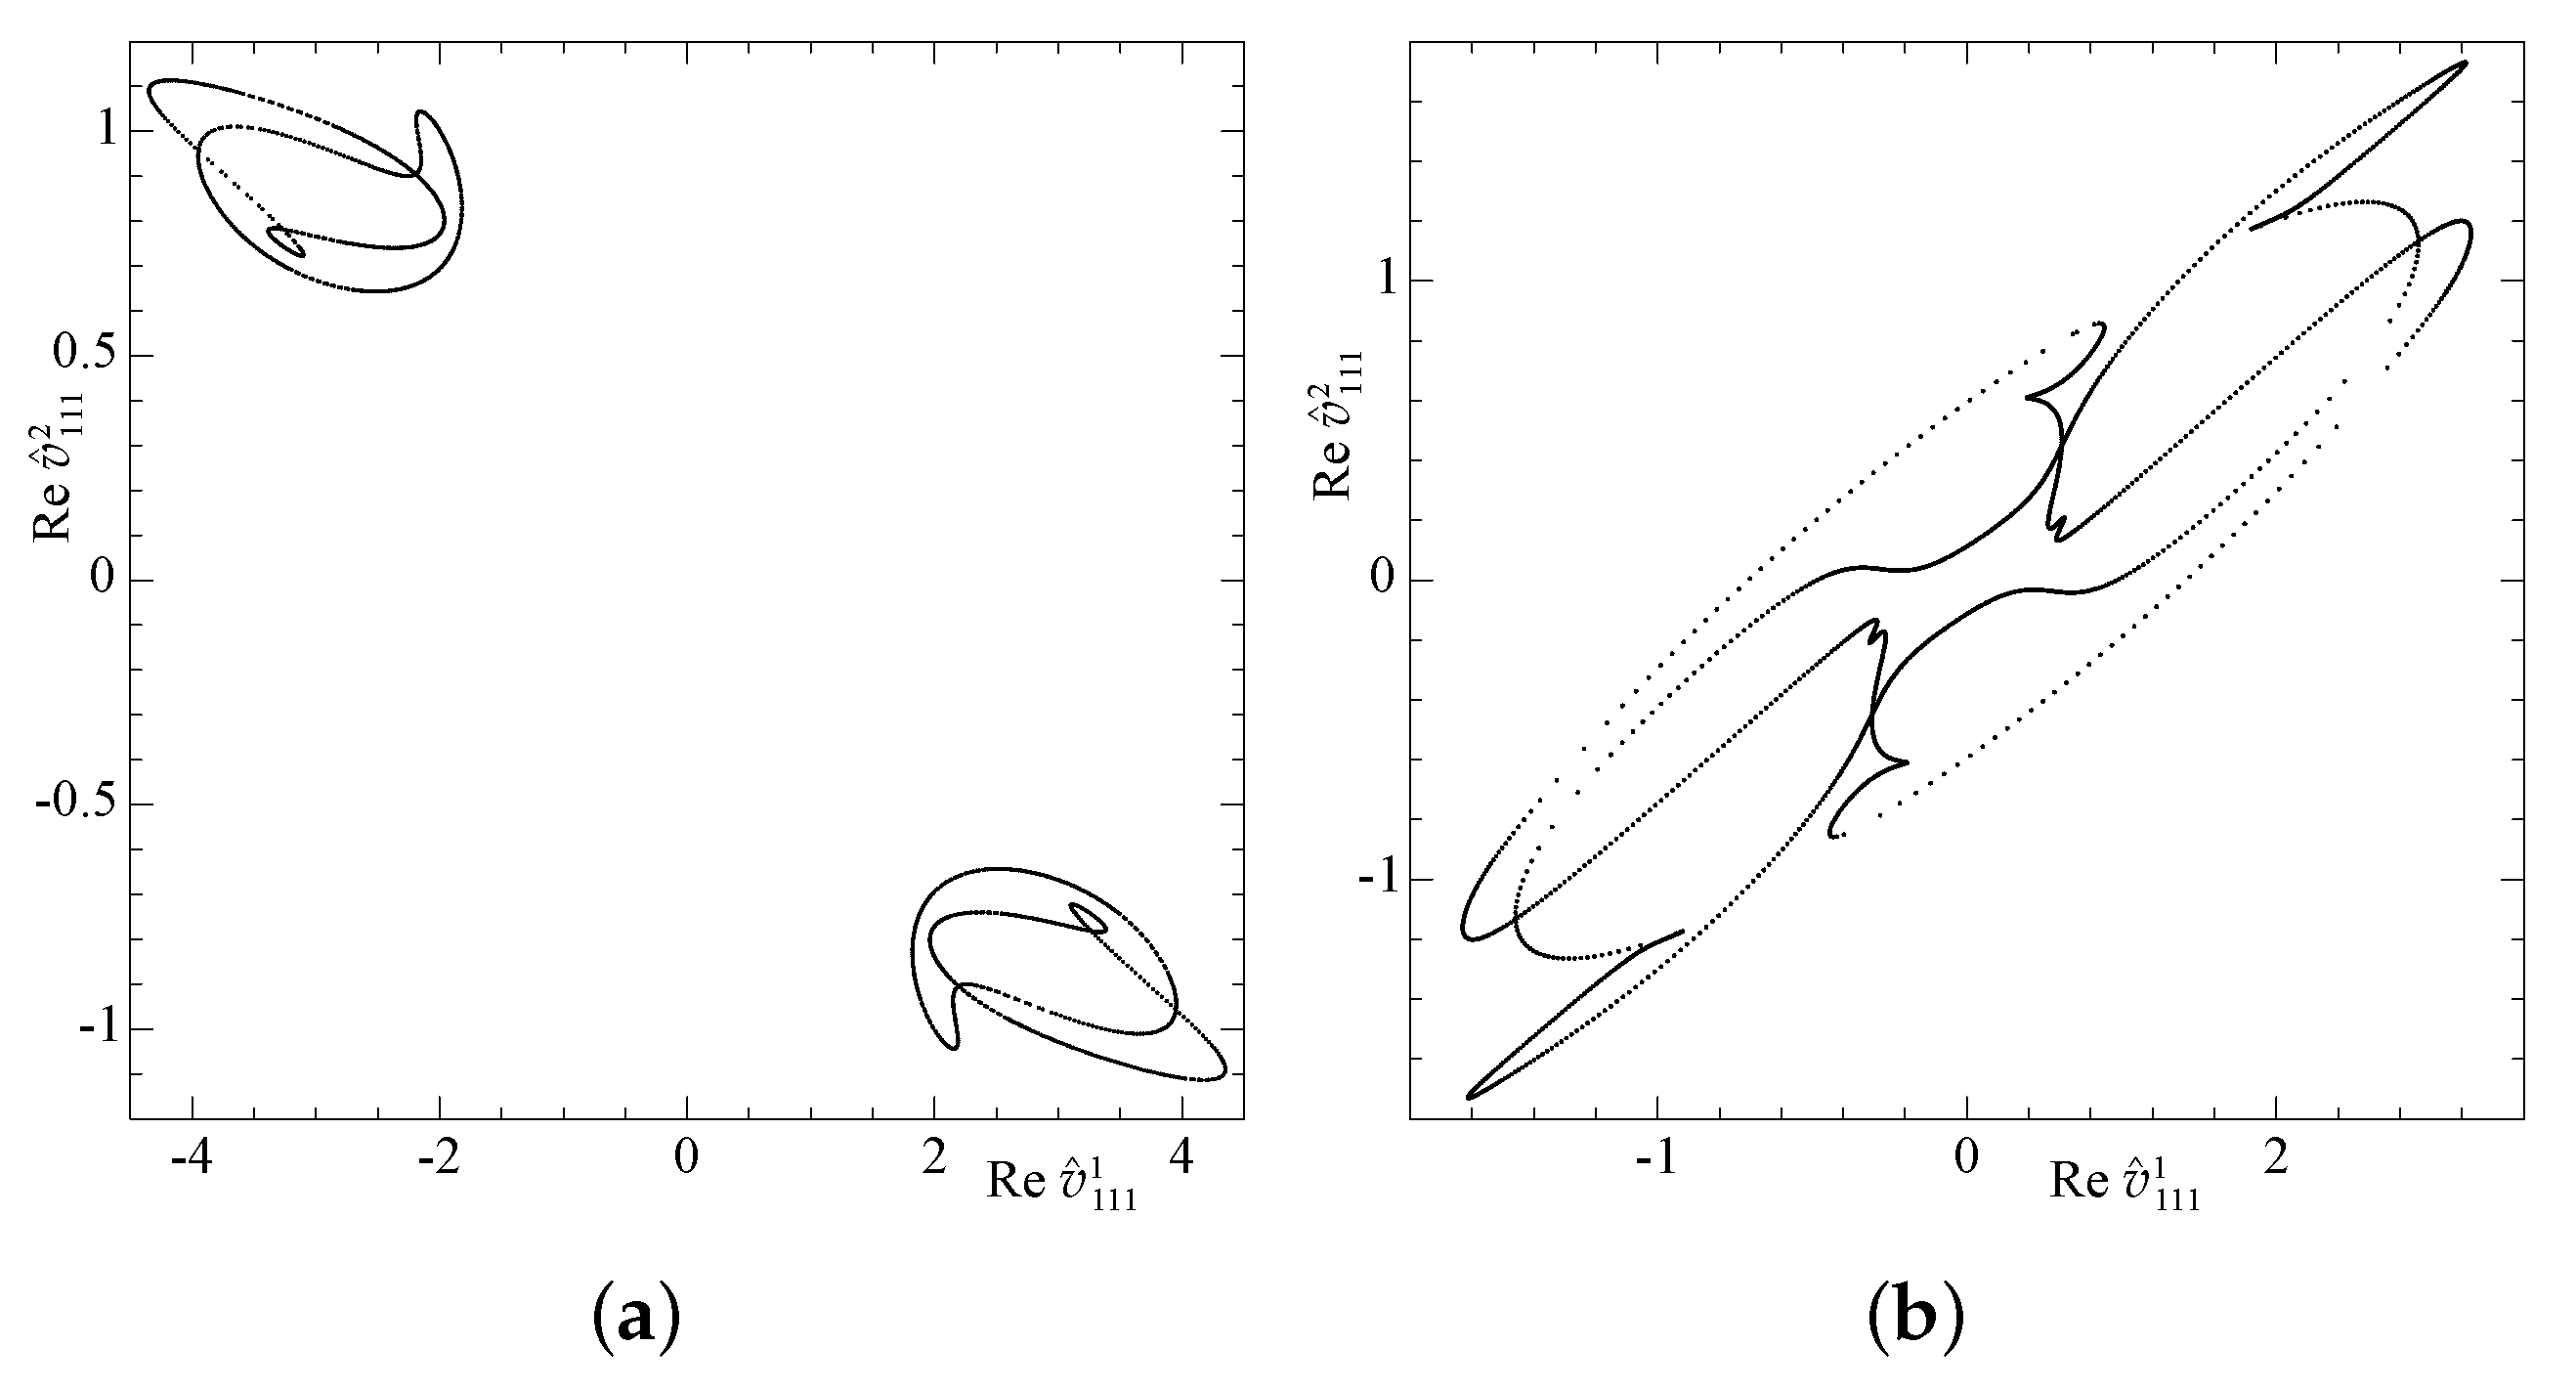
In Figure 9, we present the projection of the Poincaré map of the hyperplane Re v ^ 222 3 = 0 on the plane (Re v ^ 111 1 ,Re v ^ 111 2 ). As stated above, for 300 t 1500 (phase G), the flow is a quasiperiodic attractor, and the points lie on smooth curves (see Figure 9a). By contrast, in the chaotic phases S and D of the saturated and decaying magnetic field, the Poincaré map yields a cloud of randomly distributed points, which is a signature of chaos. The Poincaré maps in Figure 9a are symmetric about the centre of coordinates; for a travelling wave, this property is not linked with a spatial symmetry of the flow, but rather stems from the nature of the conditions, for which the mapping is constructed. In Figure 9b for phase S, the approximate symmetry about the centre of coordinates of the area, where the points constituting the mapping are located, can be attributed to the time intervals, during which the trajectory is close to the generating quasiperiodic flow that is also approached in phase G. The absence of the symmetry in Figure 9c during phase D suggests that this phase is not linked with any underlying quasiperiodic flow.
At first glance, the behaviour of the kinetic and magnetic energies in Figure 5a,c in runs 1x2.1 and 1x2.2 differs from that in runs 1x2.3, 2x1.2 and 2x1.3. However, a zoom into the behaviour of the energies in phase S in run 2x1.2 (see Figure 10) shows a similar behaviour, the trajectory approaching (once in Figure 5a and four times in Figure 5c) the same generating hydrodynamic travelling wave, as in phase G, in runs 1x2.3, 2x1.2, and 2x1.3. Multiple evidences confirm that the same travelling wave is visited in phase S and acts as the kinematic dynamo in phase G: their energies span the same ranges, the magnetic growth rates coincide up to small (order 10 3 ) errors, and many peaks in the temporal power spectra of the coefficients Re v ^ 111 1 and Re v ^ 222 1 during phase S are very close to the frequencies of the quasiperiodic flow of phase G (see Figure 8). The difference in the behaviour of the kinetic and magnetic field energies in phases G and S is just in a much smaller duration of the chaotic evolutions resulting in the magnetic energy decay by several orders of magnitude only, and in a much shorter stay in the vicinity of the generating travelling wave. Thus, the same succession of the “mini-phases” G, S and D occurs within the phase S, their alternation being much faster. Several large-amplitude “excursions” seen in Figure 5c, that are relatively short episodes of the magnetic field decay and its subsequent growth, give rise to irregular large-radius loops around and under the right thin cylinder in Figure 5d. We conclude that, in all the five double-period runs, we observe the same attractor.
Figure 11 shows the temporal behaviour of the mean kinetic helicity
h ( t ) = ( × v ) · v
in three runs for the double-period fluid volume. The mean helicity during phase G is zero. This is clearly seen in Figure 11b for run 2x1.2; in run 1x2.2, the phase G time intervals are short, initial departures from the underlying metastable state are high, and when the energy evolution already indicates the advent of this phase, it still takes some time for the helicity to decay to significantly small values (see Figure 11a). Notably, vanishing of the mean helicity does not prevent kinematic magnetic field generation in this phase. This agrees with the findings of [69], where many examples of generating pointwise zero-helicity three-dimensional steady flows were constructed, and it was concluded that neither kinetic helicity nor helicity spectrum control the dynamo properties of a flow regardless of whether scale separation is present or not. In phase S, we observe bursts of the mean helicity, whose amplitude is at first small, but gradually increases towards the end of this phase. The amplitude is maximum in phase D, when the flow fails to generate magnetic field.
The attractor that we have encountered in run 2x1.1 is distinct: the projections of the trajectory in the phase space onto the plane of the kinetic and magnetic energies shown in Figure 5h (visually resembling a wing of the Lorenz butterfly attractor) clearly differs from the spiral-like structures observed in the similar projection of the attractor in other five double-period runs. The mean helicity in this run features intervals of almost periodic behaviour that are separated by significantly shorter intervals of irregular behaviour (see Figure 11c), during which kinetic energy experiences oscillations of twice higher temporal frequency. The intervals of almost periodic behaviour have opposite signs of the maximum in absolute value helicity (for instance, cf. its behaviour in the intervals 18 < t < 50 and 60 < t < 105 ). The almost regular helicity behaviour can be expected to set in when the trajectory in the phase space approaches a time-periodic metastable state. We find that the 2x1.1 flow is close to the flow possessing the following symmetries:
  • Independence of x 2 (the energy of the discrepancy averaged over the periodicity cell, equal to the mean energy of the harmonics associated with wave vectors with a non-zero second component, is below 0.25 in the saturated regime for t > 18 ; it shows the tendency to increase towards the ends of the intervals of almost regular helicity behaviour).
  • s 2 (for t > 18 , the mean energy of the discrepancy v ( x ) s 2 v ( x ) is below 24.0).
  • r γ L / 2 1 (for t > 18 , the mean energy of the discrepancy v ( x ) r γ L / 2 1 v ( x ) is below 14.4).
  • The flow is approximately 1x1-periodic (for t > 18 , the spatially averaged mean energy of the discrepancy, equal to the mean energy of the harmonics associated with wave vectors, whose first component is odd, is below 6.1).
This suggests that the underlying metastable state has the four symmetries and, in particular, it is 1x1-periodic.
Three 1x1-periodic regimes of hydromagnetic convection for the parameter values considered here were identified in [49]: R 1 (steady amagnetic rolls, parallel to one of the sides of the square periodicity cell and stable to 1x1-periodic hydrodynamic perturbations), S 7 R 1 and S 8 R 1 (MHD steady states, stable to 1x1-periodic MHD perturbations; S 8 R 1 is the state subjected to perturbations in the present study). Only R 1 matches the flow in the regime 2x1.1 in kinetic energy, and only R 1 has the four symmetries that hold approximately for 2x1.1. We conclude that R 1 is the metastable state approached by 2x1.1. The following evidence corroborates this:
  • We have performed a hydrodynamic run (the magnetic field being set to zero at each step) in a 2x1-periodic fluid box for an initial condition that is the 2x1.1 flow at t = 180 (close to the local minimum of the magnetic energy), where the x 2 -dependence is suppressed by setting to zero all harmonics associated with wave vectors, whose second component is non-zero. This run has converged fast (in roughly 15 time units) to the double-replicated R 1 , the energy of discrepancy decreasing below 10 18 .
  • The energy of the discrepancies between the 2x1.1 flow at t = 180 and the flows of the MHD steady states R 1 , S 7 R 1 and S 8 R 1 is 0.2, 0.2 and 16.1, respectively.
The rolls R 1 do not depend on x 2 and have the symmetries s 2 (rotation about the vertical axis by π ) and r γ L / 2 1 (the midplane reflection with a shift in x 1 by half the period). The symmetry r γ L / 2 1 s 2 amounts to parity invariance (upon shifting appropriately the origin in x 1 ), implying that the mean helicity of R 1 vanishes. Thus, the flow in the 2x1.1 regime can be regarded as a perturbation of the parity-invariant metastable state R 1 , and its total helicity is predominantly linear in the parity-anti-invariant component of the perturbation. Since the rolls R 1 are stable with respect to hydrodynamic perturbations, their perturbation giving rise to the 2x1.1 flow is the consequence of the action of the Lorentz force, resulting from the growing magnetic field. The Lorentz force has the required parity-anti-invariant component only if the magnetic field has both non-zero parity-invariant and parity-anti-invariant components. The existence of two dominant magnetic modes, whose growth rates are equal, one mode being parity-invariant and another one being parity-anti-invariant, is linked with the independence of R 1 on x 2 : the two eigenmodes take the form e ± i x 2 m ( x 1 , x 3 ) , and their real and imaginary parts feature opposite parity invariance properties. In the course of evolution, the magnetic field grows until its magnitude becomes so large that the Lorentz force starts affecting significantly the flow until the modified flow fails to sustain the magnetic field. The generation ceases, the flow converges back to R 1 , and the cycle of magnetic field generation and subsequent decay repeats, although with alterations, because during one cycle, the initial noise does not weaken sufficiently not to affect the next cycle. When the perturbation accumulates to significant levels, the periodic repetition of the cycles gets broken and a chaotic “interlude” starts that leads to the onset of the next sequence of the cycles. We observe this as the series of repeated perturbed “teeth” in the helicity plot.
Exhaustive arguments explaining the almost regular behaviour of the kinetic helicity in certain time intervals and a similar behaviour with the helicity reversed in other time intervals can be obtained by constructing the appropriate asymptotic solutions for the weakly nonlinear regime 2x1.1. We plan to present them elsewhere. The presence of intervals of the irregular behaviour of the helicity characterised by the frequency doubling of the energy suggests that another metastable state of a twice shorter period exists in the vicinity of the attractor.
The temporal behaviour of the real part of the Fourier coefficient b ^ 111 1 (see Figure 12a) resembles magnetic reversals: while Re b ^ 111 1 is predominantly negative for 18 < t < 50 , it is positive for 60 < t < 105 ; other similar intervals of dominant signs of the coefficient can be identified. The imaginary part (Figure 12b) shows an analogous intermittent behaviour; its intervals of dominant signs loosely correlate with those of the positive part.

3.2. Regimes in the Elongated Cells with the Periodicities 1x3/3x1

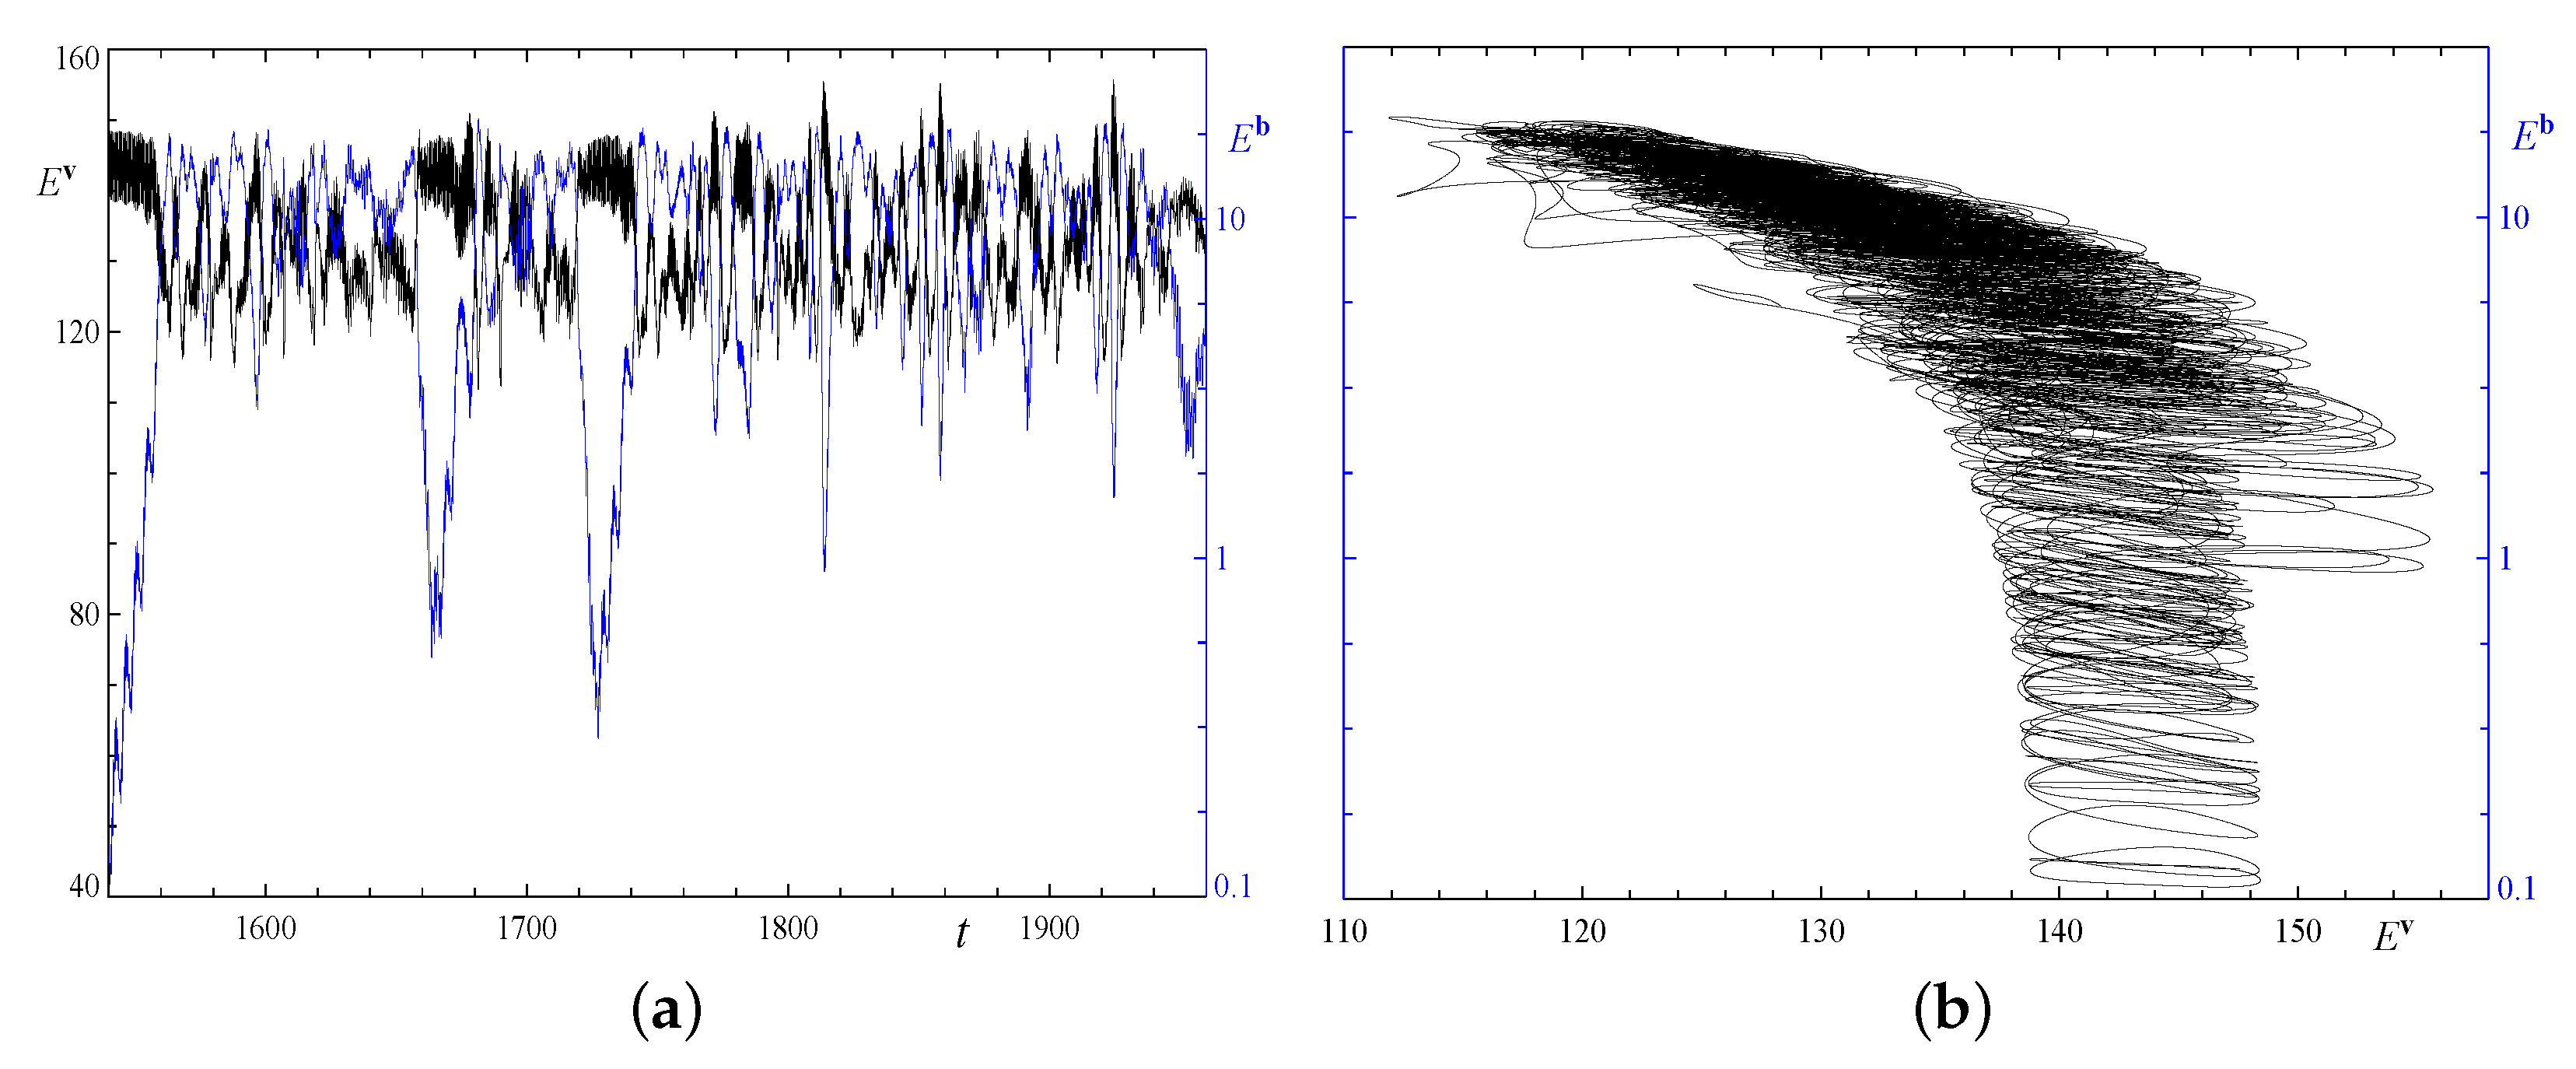
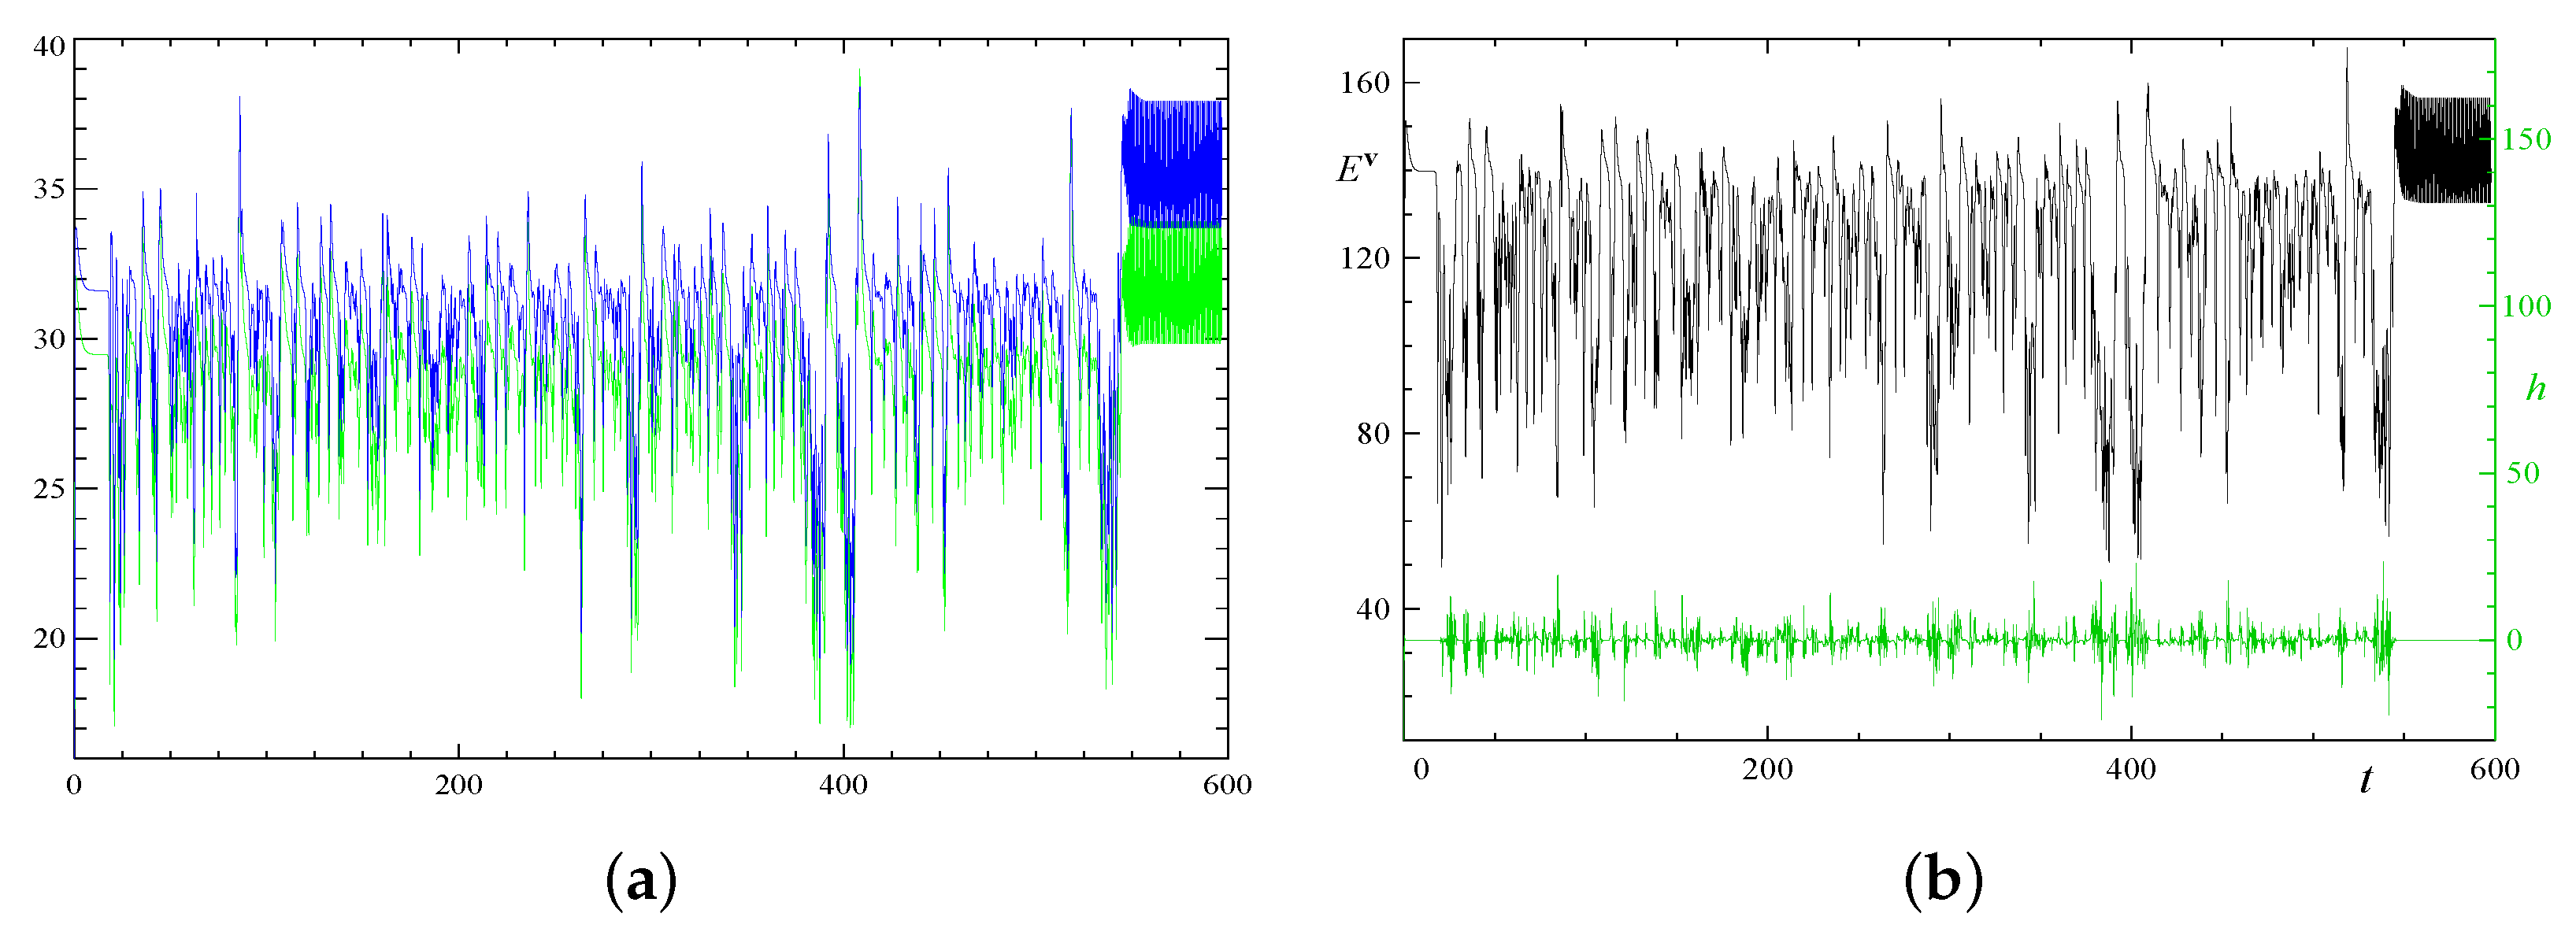
A typical behaviour of the kinetic and magnetic energies in the triple-period fluid volumes (1x3 or 3x1) is shown in Figure 13. After a chaotic transition phase (its duration varies in our runs roughly from 25 to 1250 time units), a regime with an underlying non-generating quasiperiodic flow sets in; this is a travelling wave carrying a periodic orbit. Unlike in the double-period case, in our runs, instability never transforms this flow into a generating one. (More precisely, all standard-resolution runs in this periodicity cell have produced the terminal non-generating travelling wave, as well as all the five alternative-resolution runs that we have performed. One of the alternative resolution runs has been followed up to t = 580 , the terminal regime lasting for over 115 time units.) For instance, we have followed the travelling wave from t = 85 up to t = 1992 in run 1x3.3, but integration for almost 1900 time units in this run has not restored magnetic field generation. We therefore conclude that for convection in the triple-period elongated cells, the attractor is unique and it is hydrodynamic.
In Figure 13, we show the temporal evolutions of the energies in two instances of run 3x1.2 with the standard ( 128 × 384 × 97 harmonics) and alternative ( 256 × 256 × 257 harmonics) space resolutions. Because of the intrinsic instability of the regimes, the evolutions, of course, do not coincide, but they are qualitatively similar, differing only in minor details (a relatively long oscillatory decrease of the kinetic energy in the time interval 52 < t < 80 is the most prominent feature occurring in the run with the alternative resolution only). The behaviour of the projection of the trajectories on the plane of magnetic and kinetic energies in Figure 13b,d is similar to that observed in runs for the double-period fluid volumes. In particular, the spiral-like columnar structures in the right sides of Figure 13b,d emerge in the terminal phase of the run, where the flow is quasiperiodic; unlike in the double-period runs, the magnetic field is now exponentially decaying, and hence in the course of time the loops in the spiral are now descending.
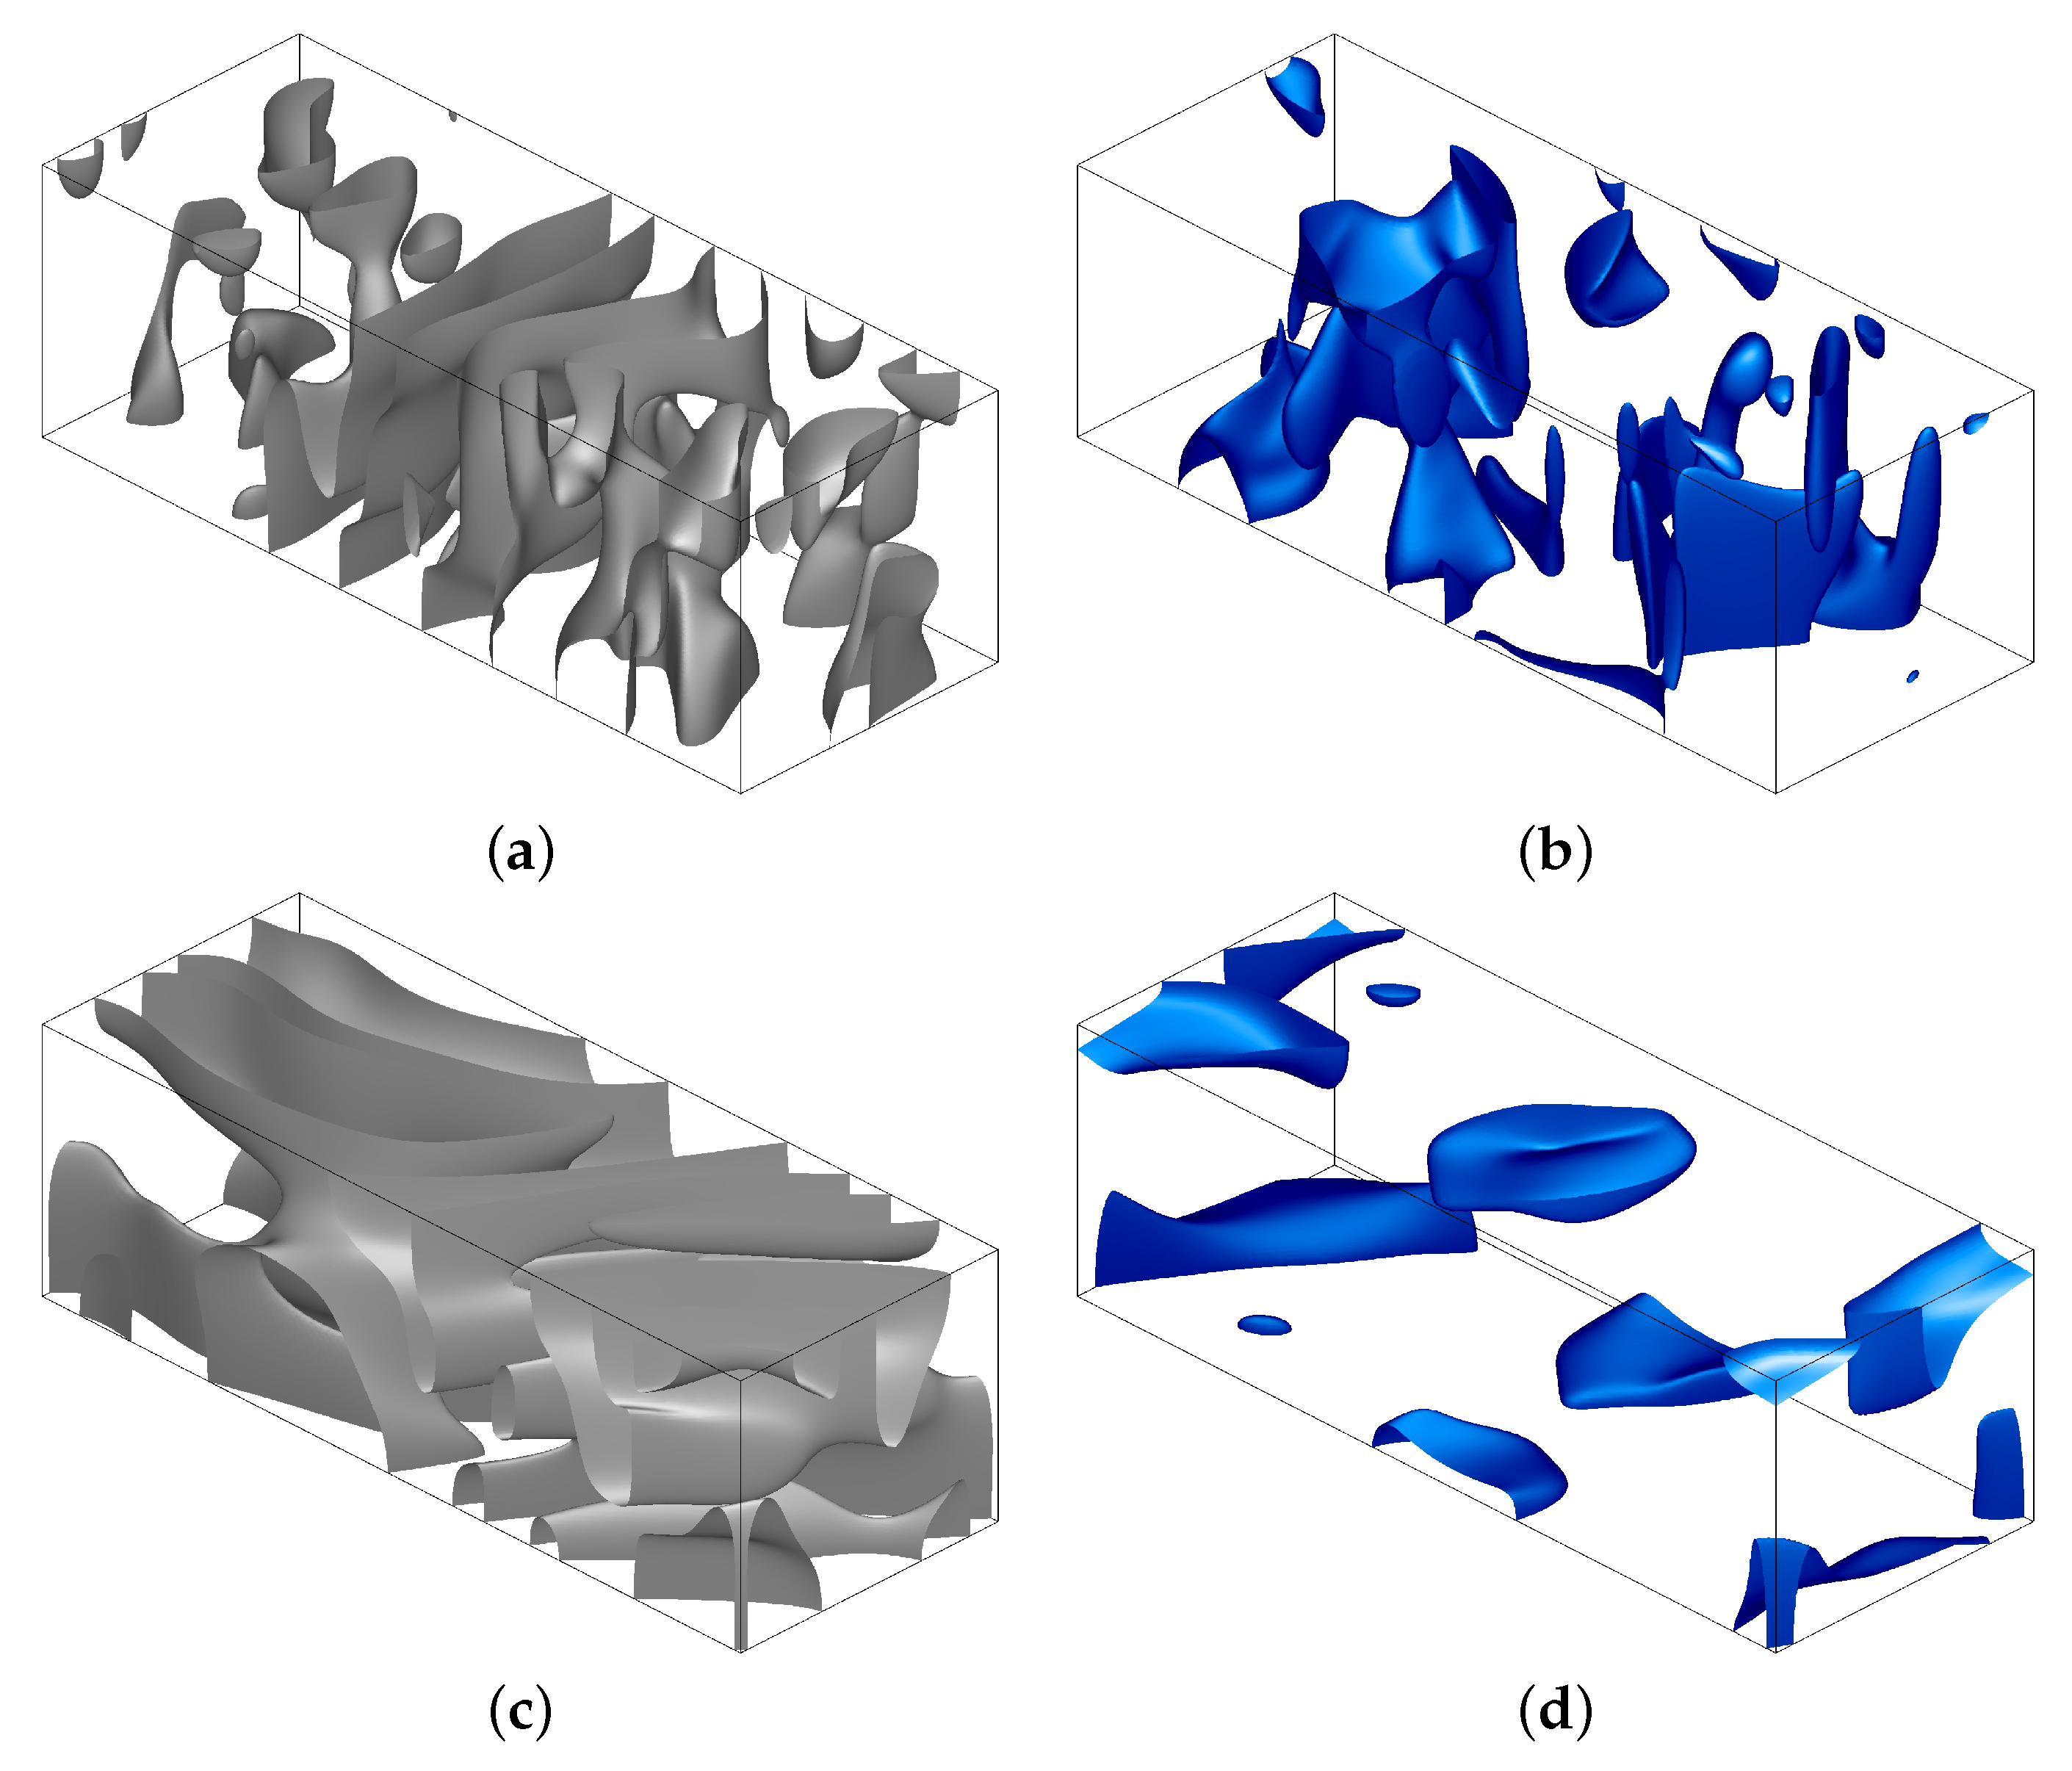
We present in Figure 14 the isosurfaces of the energy densities at two randomly chosen time moments, one within the initial chaotic transitory phase (extending roughly up to t = 550 for run 3x1.2) and within a more ordered terminal phase (roughly beginning at t = 565 ). At t = 566.671 , for which the isosurfaces are shown in panels (c) and (d), the magnetic field decay has just begun, implying that the magnetic field has not yet acquired the structure of the least decaying magnetic mode. Nevertheless, we observe that the distribution of the kinetic and magnetic energies is more ordered than in the initial chaotic transitory phase (panels (a) and (b) for t = 380.671 ). The part of the volume where the magnetic field is relatively strong shrinks significantly. The distribution of energy in the quasiperiodic hydrodynamic attractor is visibly more uniform in space. The isosurfaces attest that in the course of temporal evolution, the fields have not acquired smaller space periods.
The isosurfaces of the individual components of the flow in Figure 15 demonstrate that neither in the initial chaotic transitory phase, nor when it exponentially approaches the travelling wave in the terminal phase, the flow acquires a two-dimensional structure that would preclude magnetic field generation by the Zeldovich antidynamo theorem [70]. The plots of the magnetic Reynolds number estimates for run 3x1.2 in Figure 16a show that, upon the advent of the flow’s quasiperiodicity in the terminal phase, Rm 1 and Rm 3 on average increase. In particular, the mean Rm 3 increases from roughly 30.5 in the initial generating chaotic phase for t < 533 to 35.6 in the terminal phase. The mean (over time) Rm 1 and Rm 3 values in the terminal phases differ insignificantly; they are 32.6 and 35.7, respectively, for the double-period runs, and 31.7 and 35.7 for the triple-period runs. The kinetic energy is on average smaller in the initial chaotic phase than in the terminal phase. The two travelling waves in the double-period and triple-period cells are almost identical in vigour (kinetic energy is oscillating in the ranges 138.9 < E v < 148.5 around the mean value 143.6 in the double-period runs, and 132.6 < E v < 156.5 around the mean 142.9 in the triple-period runs). In the initial transitory chaotic regime, the mean kinetic helicity varies in the range 18.7 < h < 22 . Like in phase G of the generating quasiperiodic flow in the five runs for the double-period fluid cells, in the terminal phase the mean kinetic helicity vanishes. Despite this similarity in the parameter values, the flow in the double-period cell is generating and the flow in the triple-period cell is not. This confirms that the favourable values of any integral parameter (such as the kinetic energy, mean kinetic helicity, or magnetic Reynolds number) of a flow do not guarantee that it can be a dynamo, since the intrinsic small-scale details of a flow’s structure are important for magnetic field generation.
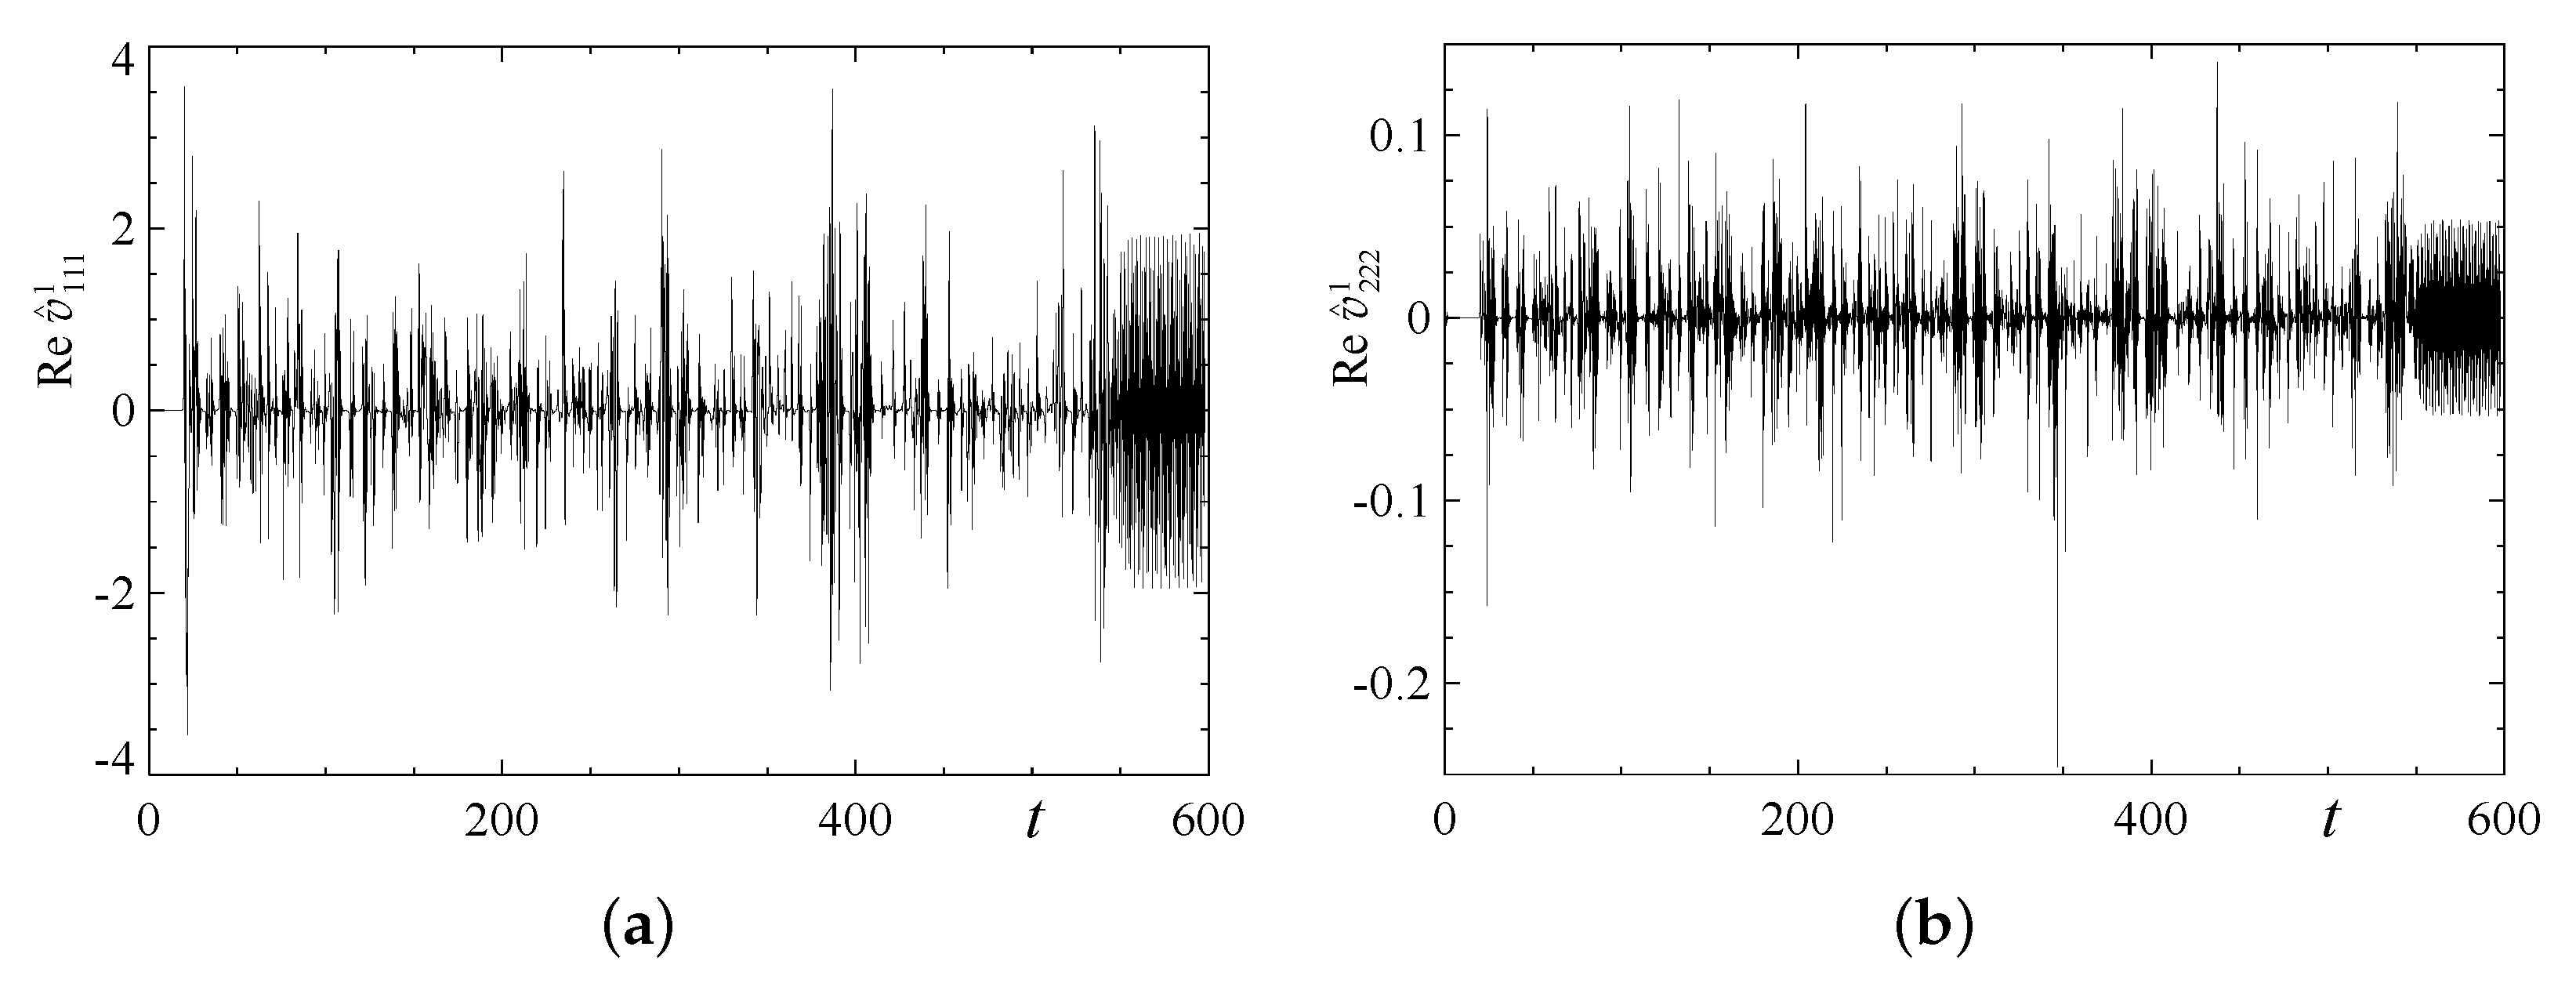
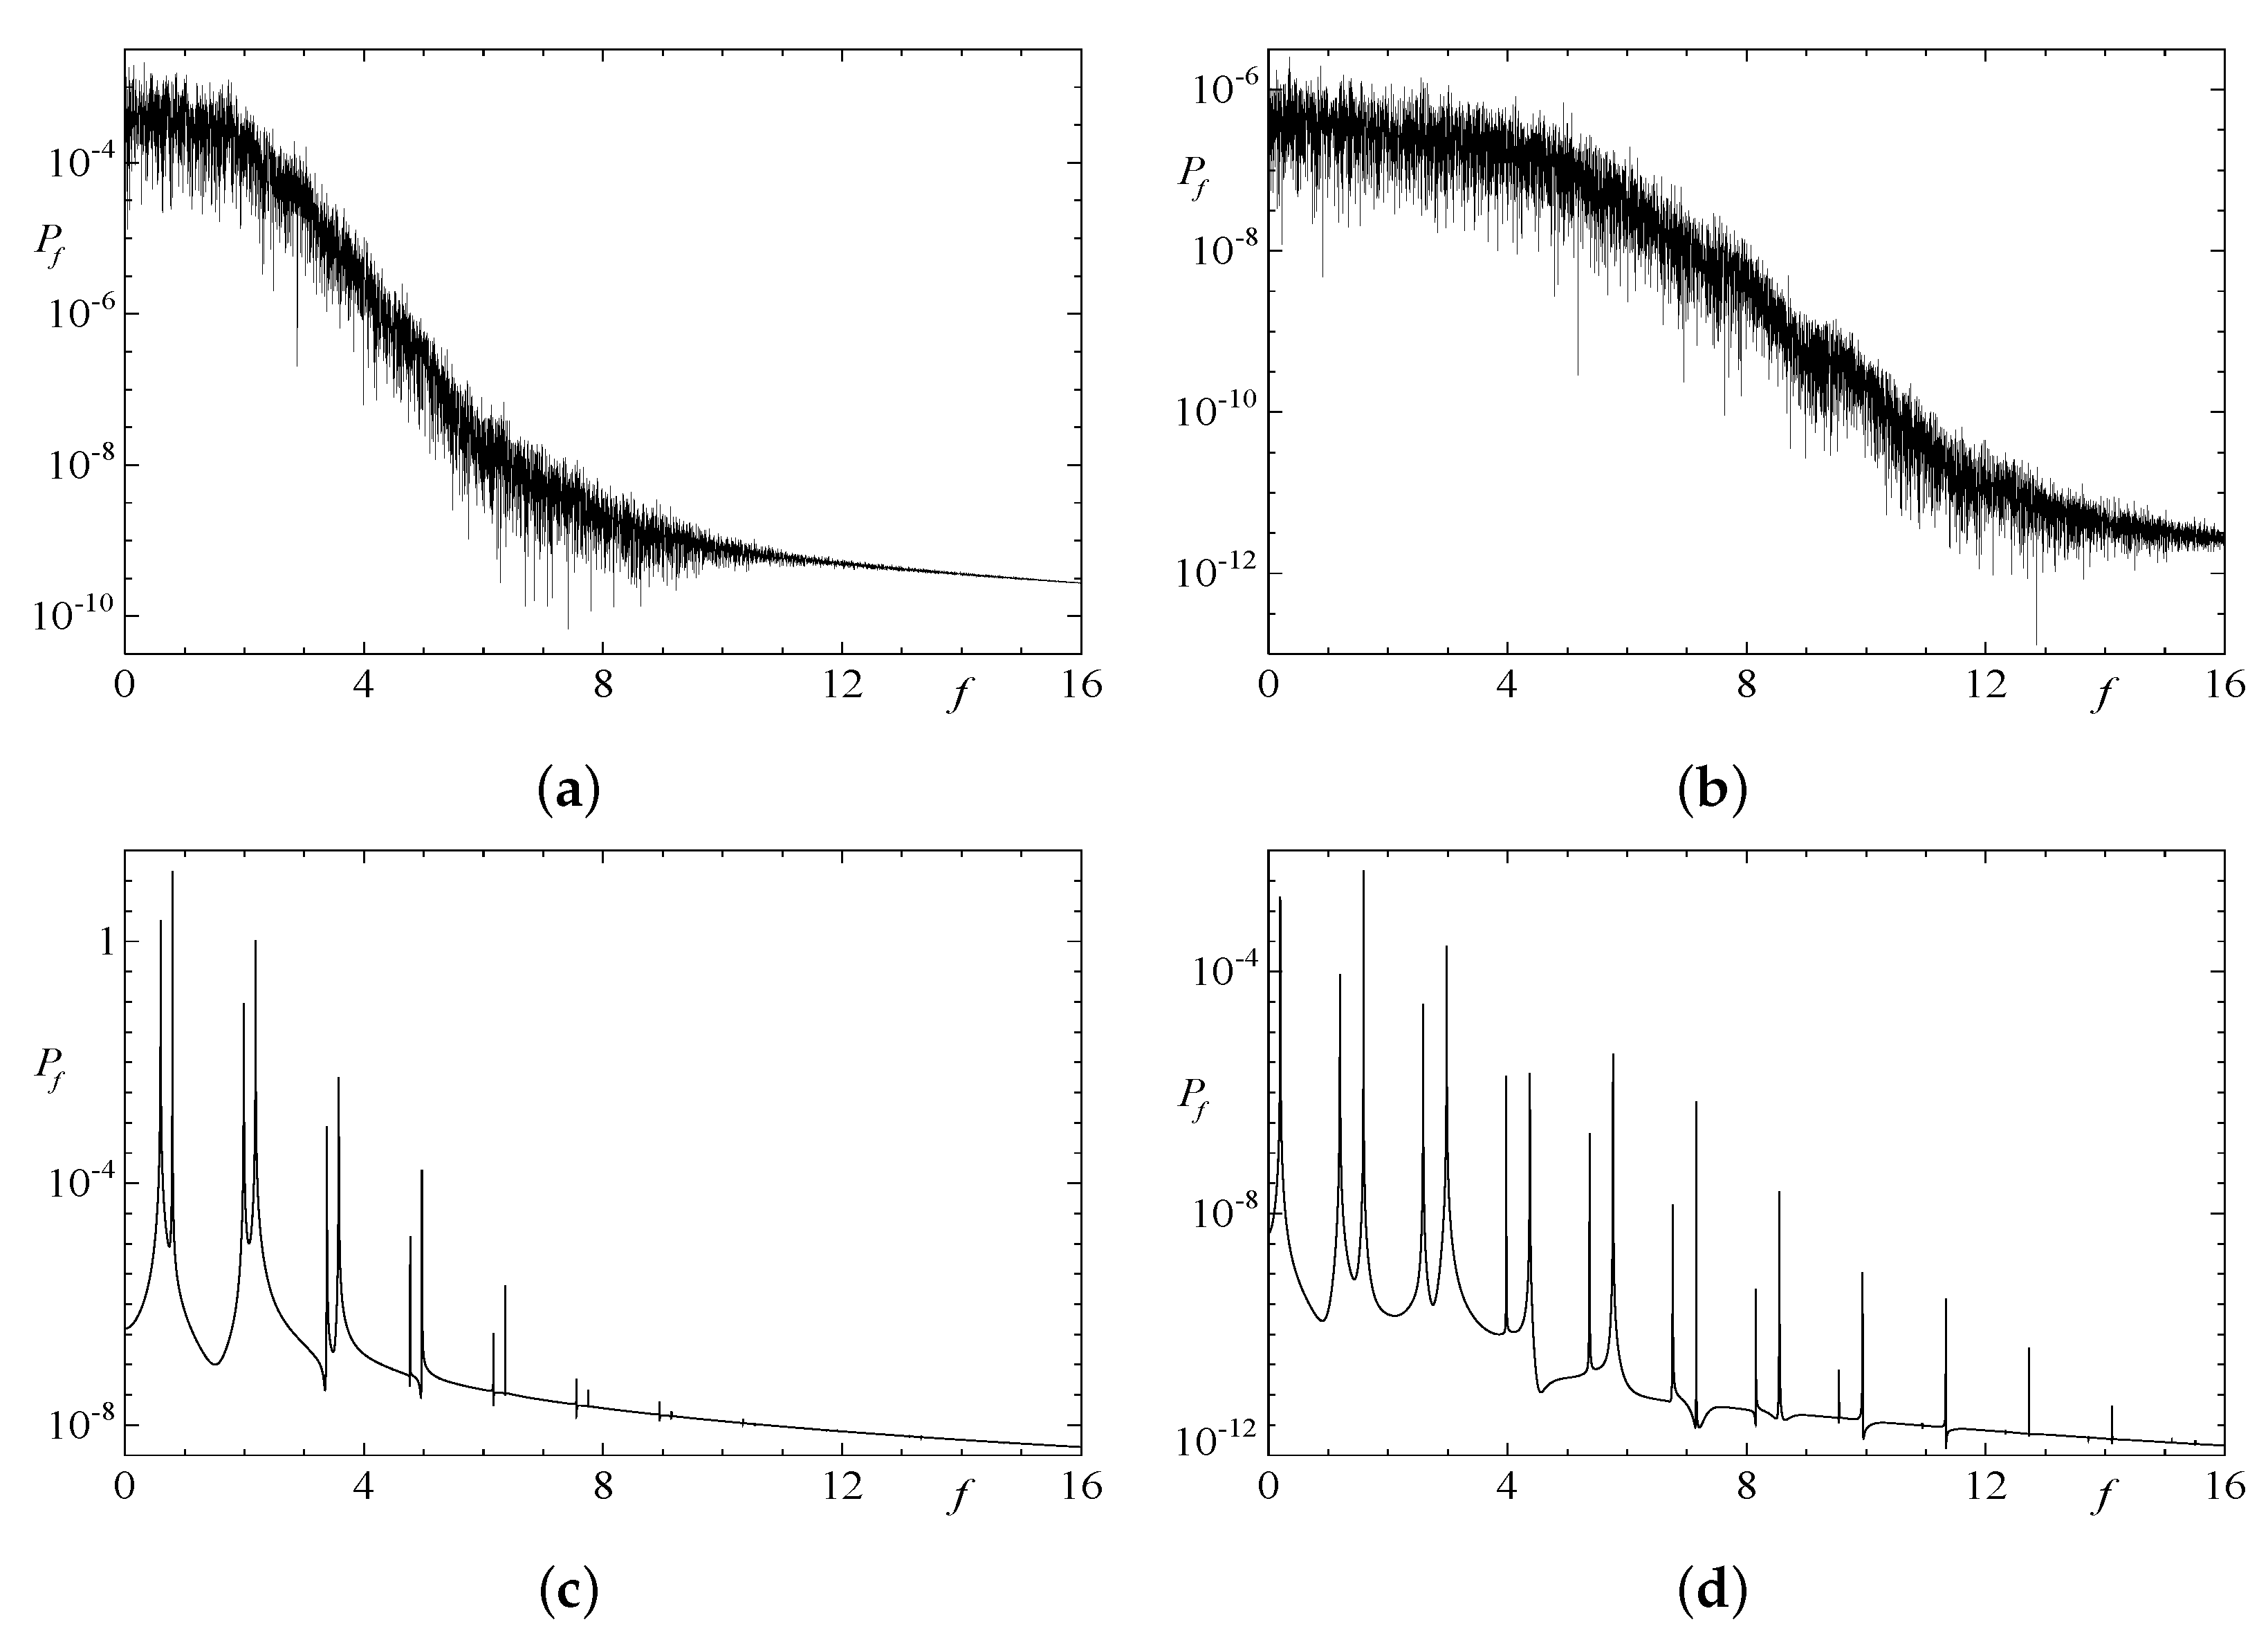
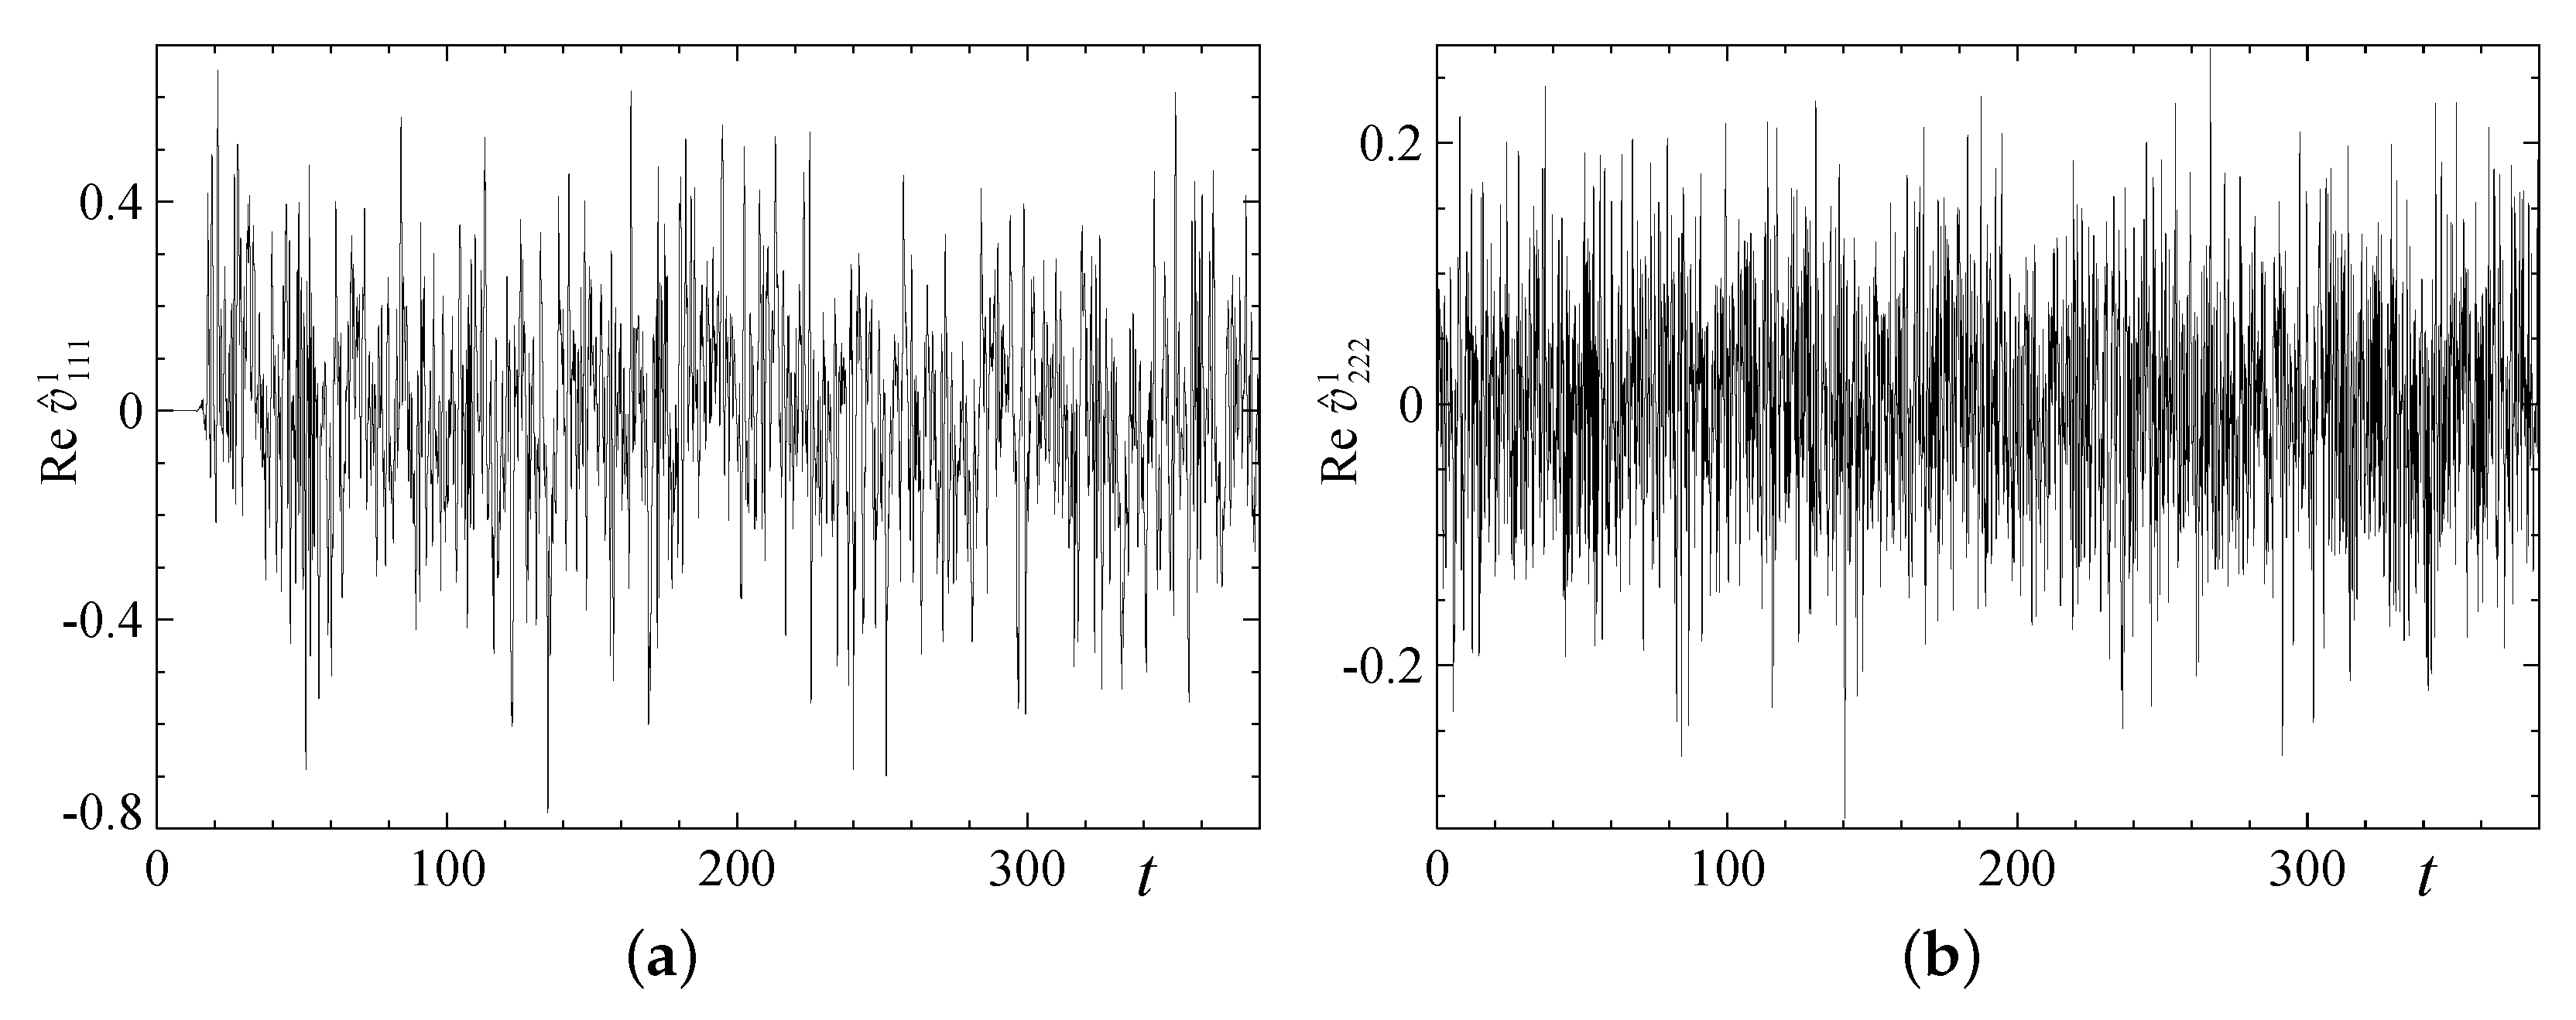
The temporal behaviour of the coefficients Re v ^ 111 1 and Re v ^ 222 1 in run 3x1.2, shown in Figure 17 for 0 t 600 , is typical for individual harmonics in the triple-periodic runs. Plots of the temporal power spectra Figure 18a,b of the two coefficients, computed in the interval 50 t 533 for this run confirm that initially the behaviour is chaotic. In the subsequent terminal regime, the quasiperiodic flow and the exponentially decaying magnetic field have been followed for more than 1900 time units in run 1x3.3. In Figure 18c,d, we present the spectra of the two harmonics that have been constructed using the data obtained in this run over the time interval 75 t 975 . The flow is a travelling wave transporting a periodic orbit, whose basic frequencies are f T W = 0.398 and f P O = 1.391 , respectively. The same quantitative and qualitative tests, used to establish the coincidence of the generating flows in phases G of runs 1x2.3, 2x1.2, and 2x1.3 (see Section 3.1), have been applied to the flows encountered in the terminal phases of the triple-period runs (obviously, the magnetic field decay rates have been measured for triple-period cells instead of the growth rates for double-period cells) and confirmed that these flows are identical. Agreeing frequencies have also been obtained for the flow in the terminal regime in runs for the alternative resolution.
The Poincaré sections constructed for the flows obtained in runs 1x3.1 and 3x1.3 (see Figure 19) also confirm that in the final phase the flows are travelling waves transporting periodic orbits. The shape of the sections is significantly different, because adjusting the relative positions of the periodicity cells is required to obtain identical mappings, and we have not implemented it.

3.3. Regimes in the Elongated Cells with the Periodicities 1x4/4x1

The typical behaviour of convective dynamos in the quadruple-period fluid cells is shown in Figure 20. The evolution of the flows is again chaotic. It is more structured in the standard-resolution run 4x1.1 (see Figure 20c,d) than in 4x1.2 (Figure 20a,b). In run 4x1.1, one can identify the phase (occurring at 15 < t < 120 and t > 340 ) of a relatively vigorous flow generating a relatively large magnetic field, separated by the phase (at 132 < t < 212 ) of a more moderate flow that fails to support the generation of a magnetic field of the same magnitude. In the first phase, the kinetic energy E v experiences relatively low-amplitude chaotic oscillations between 105.0 and 166.0 around the mean value 140.5, and magnetic energy E b oscillates between 0.7 and 14.7 around the mean 5.9. In the separating phase, E v oscillates around the mean 112.0 and the amplitude of oscillations is significantly larger, 49.9 < E v < 203.8 , than during the previous phase, and the magnetic field is much weaker, E b < 0.17 with the mean 0.01. The high density of segments of smooth curves in the right upper part of the trajectory plot on the ( E v , E b ) plane arises during the second phase of the evolution. In its turn, the latter phase gets split into two parts when the trajectory approaches a hydrodynamic metastable state for a short time (at 223 < t < 242 ). The kinetic energy of this flow varies within tighter limits, 131.5 E v 152.3 , but has the largest mean value 142.9. This flow is a generating travelling wave; it gives rise to the familiar spiral-kind feature in the energies plot on the ( E v , E b ) plane. No similar categorisation into phases can be established for runs 4x1.2 (see Figure 20e,f), 1x4.1 and 1x4.3, where the energies undergo unstructured chaotic evolutions; such a behaviour is also typical for the quadruple-period alternative-resolution runs.
Apparently, the aforementioned qualitative differences in the behaviour of runs 4x1.2, 1x4.1 and 1x4.3 are not substantial enough to suggest that the quadruple-period runs reveal two or more different attractors. The unique emerging attractor is chaotic and non-hydrodynamic, magnetic field generation remains sustained, although a word of caution is necessary: since quadruple-period runs are consuming a lot of processor time, for such periodicity cells we have not made runs exceeding 400 time units. The example of triple-period runs shows that transitory regimes may well last twice as long, and therefore further continuation of the runs may reveal that the computed evolutions just show a transient behaviour that may subsequently result in the emergence of different attractors or an ultimate magnetic field decay at the terminal stage.
A similar division of the evolution into distinct phases is observed in the behaviour of individual harmonics (see Figure 21), the magnetic Reynolds number estimates Rm 1 and Rm 3 , and the mean kinetic helicity (Figure 22). The flow Fourier coefficient Re v ^ 111 1 in the first phase is predominantly zero, but it suffers jerky perturbations; each perturbative event dies out in fast exponentially decaying oscillations. In fact, this phase consists of random perturbations of a chaotic metastable state possessing the symmetry r γ 2 L 1 that is violated during the perturbative events. The temporal spectra of the coefficients Re v ^ 111 1 and Re v ^ 222 1 (see Figure 23) in the two phases differ in detail. In the first phase, the spectra can be characterised as curves consisting of multiple arc segments that are concave up and down and subjected to a white-noise-like perturbation of a considerable amplitude. Such an intricate double-scale structure of the spectra is not typical for chaotic regimes in our simulations. The temporal spectra of the oscillatory regime splitting the second phase confirm that the flow is a travelling wave transporting a periodic orbit (as we have established, | v ^ 111 1 | and | v ^ 222 1 | are time-periodic functions); the basic frequencies are f T W = 0.947 and f P O = 1.816 , respectively.
The behaviour of the magnetic Reynolds number estimates in Figure 22 is consistent with the observed efficiency of magnetic field generation: in the first phase, the estimates Rm 1 and Rm 3 are on average higher than in the second phase, during which the generation is weaker, although the momentary peak values are significantly higher in the second phase. The estimates for the intermediate quasiperiodic flow are higher than those encountered in the first phase, and, indeed, this flow is kinematically generating. However, the ranges of Rm 1 and Rm 3 characterising this quasiperiodic flow differ very little from those characterising the terminal quasiperiodic flow in the triple-period elongated fluid cell, which is incapable of generation. We again observe that the magnetic Reynolds number does not control magnetic field generation.
The isosurfaces of the kinetic and magnetic energy densities, shown in Figure 24, demonstrate that the quasiperiodic flow depends on all three spatial variables and does not acquire smaller spatial periods.

3.4. Regimes in the ( M 1 , M 2 ) -Periodicity Cells for M i 2

All runs in the “wide” fluid cells of the periodicity M 1 x M 2 , where both M i 2 , demonstrate a very similar behaviour, which is distinct from the behaviour in the elongated cells. Typical examples of the evolution of the kinetic and magnetic energies is shown in Figure 25. The behaviour of the kinetic energy is unstructured, it consists of the stationary chaotic oscillations of relatively low amplitude (see Figure 25a; in run 4x4.2, the minimum, mean and maximum kinetic energies over time are 61.6, 79.4 and 105.7, respectively), which can be superimposed with random violent large-amplitude bursts of short duration, the energy increasing up to 160 (see Figure 25b; in run 2x4.2, the minimum kinetic energy and its time average are 54.3 and 82, respectively).
The time- and space-averaged kinetic energy in all runs is roughly 80 independently of the size of the wide periodicity cell. It is markedly smaller than the mean kinetic energy of flows in elongated periodicity cells, the difference exceeding the sum of their r.m.s. deviations from the time averages (see diagram Figure 3). We interpret this as follows. According to Table 3, the characteristic length scales determining the size of the hydrodynamic structures are in wide cells below 0.25. For M i 2 , the period in x i is M i L 4 2 which is more than 20 characteristic length scales, suggesting that the flow does not “feel” the presence of the constraints due to the periodicity condition and evolves as if they were absent. This ensures the independence of the main flow parameters of the size of the periodicity cell. The relatively small kinetic energy and characteristic length scales in these regimes imply the smallness of the magnetic Reynolds number estimates.
The chaotic behaviour of the kinetic energy is paralleled by a similar behaviour of individual harmonics; as typical examples, we again present in Figure 26 the plots of the time dependence of the harmonics Re v ^ 111 1 and Re v ^ 222 1 in run 2x4.2. Its chaotic nature is corroborated by the temporal power spectra and Poincaré sections in Figure 27 and Figure 28, respectively. Because of the small size of the hydrodynamic structures and their chaoticity, they cannot self-organise to participate in a concerted action needed for magnetic field generation. On top of this structural deficiency, the flow is relatively slow, implying that none of the flows in the wide cells is generating: in all runs for such fluid volumes, the magnetic field exponentially decays, experiencing just occasional insignificant increases (see Figure 25).

3.5. Videos of the Kinetic and Magnetic Energy Evolution

The reader may find, in the Supplementary Material for this paper, visualisations of the flow and magnetic field evolutions in runs 2x1.1, 2x2.1, 2x3.1, 4x2.1 and 4x4.1. The videos show the isosurfaces of the kinetic and magnetic energy densities (of the simulated solution, or, for run 4x4.1, of the perturbations). The name indicates the size of the periodicity box, where the regime shown in the video resides. In the panel in the upper right corner of each frame, we present the plots of the spatially averaged kinetic (black line, left vertical axis) and magnetic (blue line, right vertical axis) energies as functions of time. A vertical line marks the time of the current frame, and the time is also displayed in the left part of the screen. All the videos—except for the video for the 4x4.1 run—show the isosurfaces, where the kinetic and magnetic energy densities are equal to 144 and 9, respectively, in two adjacent periodicity boxes to provide a clearer illustration of the evolving structures. The time step between frames is δ t = 0.05 .
It was established in [53] that when the scale separation is high, the amplitudes of a two-scale weakly nonlinear perturbation of the MHD regime S 8 R 1 , which depend on the slow spatial variables only, resemble a solitary wave moving along a straight line, gradually accelerating and increasing in magnitude until in a finite time it blows up. Even if a perturbation adheres to the multiscale form studied in [53], it is difficult to extract the amplitudes from it. Consequently, in an M 1 x M 2 -periodicity box, we have considered first the truncated Fourier series for the perturbed flow, where harmonics associated with horizontal wave numbers n i are retained only for | n i | < M i —none of these harmonics belong to the replicated 1x1-periodic state that we perturb and, therefore, are involved in the amplitudes. However, unlike the amplitudes derived in [53], such (severely!) “truncated amplitudes” have never demonstrated the characteristic motion in the horizontal direction or an unlimited (or at least significant) growth in size.
We have therefore switched to analysing videos for assessing whether these features are present in the behaviour of the simulated perturbations. The amplitudes of the two-scale weakly nonlinear perturbation investigated in [53] evolve in the slow time T = ε 2 t , where ε is the ratio of the small-to-large spatial scales. In our direct numerical simulations, the smallest scale ratio ε = 0.25 characterises runs for the largest (of all the considered ones) 4x M / M x4-periodicity box. This has suggested choosing the time step δ t = 0.01 between frames.
A typical behaviour of the flow and magnetic field perturbations is shown in the video of perturbations in run 4x4.1 for the 4x4-periodicity box. Each frame presents the isosurfaces of energy densities of the hydrodynamic and magnetic perturbations at the levels of 35% of the spatial maxima at the respective time moment. Initially, transients are dying out and the perturbation is evolving very fast, but after t = 0.15 the evolution slows down considerably, for t > 0.5 becoming very slow. It again accelerates after t = 5.5 , when the energies of the perturbations approach the maxima (see plots in the panel in the upper right corner), but it never becomes as fast as near t = 0 . While for t < 5.5 the flow perturbation tends to respect the periodicity of the unperturbed steady state, subsequently it becomes completely chaotic in space (blobs of the magnetic perturbation energy become spatially disordered earlier). No traces of the behaviour, typical for the perturbation studied in [53], are visible. Thus, we conclude that even for this periodicity, characterised by the smallest in our runs scale ratio ε = 0.25 , the perturbation is not in the asymptotic regime examined in [53].
Another typical scenario of the perturbation behaviour is observed in run 2x2.1 for the 2x2-periodicity box. Up to t = 3.3 the evolution of the fields is very slow, but it is accelerating. The displacement along the x 1 axis of the structures in the middle part of the periodicity boxes (over a wide strip parallel to this axis) sets in and bends the isosurfaces of the energy densities; no such motion is visible close to the vertical sides of the periodicity boxes parallel to this axis. By t = 5.5 the isosurfaces of the kinetic energy density take the shape of rolls aligned with the diagonal of the horizontal base of the parallelepiped of periodicity. The rolls are non-generating, and the magnetic field decays. At t = 6.7 they start bending and at t = 7.0 a large eddy emerges. Its axis is vertical and the diameter is equal to the period of the unperturbed MHD state. The eddy efficiently “wipes out” both the flow and magnetic field from a half of the periodicity cell volume and disintegrates, and the space-averaged kinetic and magnetic energy significantly decreases. By t = 7.8 , the perturbation becomes unstructured and chaotic. A similar succession of events is observed, for instance, in run 4x2.1; in run 3x2.1 the appearance of the “killer-eddy” is less manifested. This scenario in no way resembles what we might expect on the basis of the results of [53].
The video of the evolution of the perturbed R 1 rolls (see [49]) in the 2x1.1 run is instructive. We observe that the magnetic field evolves much faster than the flow. Like in the 4x4.1 run, the evolution slows down significantly after most transients gradually die out by t = 2.5 . Although the plots of the energies show that by this time the perturbation is still significant, the shape of the rolls at this level is close to that of the steady state R 1 subjected to perturbation. However, at t = 7.35 , near the local minimum of the kinetic energy, 130.0, the rolls become significantly distorted, they bend and are not any more parallel to the horizontal x 2 axis. The next time, a visibly fast evolution of the shape of the isosurfaces of the kinetic energy density is observed at 11.5 < t < 16 , still during the initial transient regime. After t = 20 , during the time interval of more or less ordered cycles of the magnetic field generation and decay, the magnetic energy exhibits a behaviour that resembles a time-periodic one, while the kinetic energy density structure almost freezes, and only close to the local maxima of the magnetic energy, the cross-section of the rolls slightly changes in form and the rolls slightly bend. This confirms our scenario describing the attractor revealed in run 2x1.1 (see Section 3.1). No qualitative difference in the shape of the isosurfaces of the kinetic energy densities is visible in the sequences of cycles for 20 < t < 50 and 60 < t < 100 .

3.6. Analysis of Integral Parameters of the Regimes

We denote by | · | p a norm in the Lebesgue space L p ( C ) ,
| f | q = 1 vol C C | f | q d x 1 / q = | f | q 1 / q , q 1 ,
where vol C means the volume of the periodicity cell C , and by · s the norm in the Sobolev–Hilbert space H s ( C ) ,
f s = n | n | 2 s | f ^ n | 2 1 / 2 , where f = n 0 f ^ n e i n · x .
While the norm (8) may be regarded as non-standard because of the presence of the factor 1 / vol C , it is equivalent to the norm defined as usual.
It was proven in [71] that for space-periodic magnetohydrodynamic flows and space-analytic initial conditions
t 0 T v q , s + b q , s α q , s d t <
for any
q 2 , s 3 / q 1 / 2 , T > 0
(see also [72,73] for the purely hydrodynamic case). Here, it is denoted α q , s = q / ( q ( s + 1 ) 3 ) and f q , s = | ( 2 ) s / 2 f | q . The present problem differs from that considered ibid. in two respects: there is no periodicity in the vertical direction and an additional equation (the heat transfer equation) is present. However, the boundary conditions (2) used here are similar to those considered ibid. allowing to expand the solutions in the sine and cosine series in the vertical direction, and the nonlinearity in the heat transfer equation is analogous to the quadratic one in the Navier–Stokes and magnetic induction equations. Thus, the conjecture that the integrals (9) are also finite at any T is plausible, since these similarities enable us to use the techniques of [71] to prove it.
For the parameter values (10), the family of quantities
D q v = ϖ A 1 / q C | × v | q d x 1 / q α q , 1 , ϖ = A / ν
was studied numerically in [54] (the rescaling factor ϖ was introduced in [74,75,76]) for solutions v to the Navier–Stokes equation. Here, A = M 1 M 2 L 2 is the area of the horizontal cross-section of the flow periodicity box; in the undimensionalised case, when the layer has a unit width as it is assumed here, the volume of C is also equal to A . We analyse these quantities for the flow, as well as similar ones for the magnetic field (for b and η replacing v and ν , respectively, in (11)).
Two possible scenarios (called regimes in [54]) for the flow evolution were envisaged in [54]: D q v decrease monotonically for all considered q at all times (scenario I), or this monotonicity is at certain times broken for some q (scenario II). By Hölder’s inequality, | f | q 1 / q monotonically increases on increasing q 1 (unless f is constant in C ) and tends to the essential maximum of | f | for q , but the powers α q , s decrease in q, making scenario I possible [54]. It was shown numerically that all the four flow evolutions considered ibid. realise it for all the considered values q 18 . The occurrence of the two scenarios can be also explored for the quantities
D q , s f = ϖ | ( 2 ) s / 2 f | q 1 / q α q , s
for q and s satisfying (10), where it is assumed that f = v , b or the 6-dimensional field ( v , b ) .
The behaviour observed ibid. can be interpreted as follows. Differentiating the integral (8) in q reveals the inequality
q 2 | f | q 1 1 / q d d q | f | q 1 / q = q | f | q ln | f | | f | q ln | f | q 0
which holds true identically for any vector field f in L ( C ) , and the inequality is strict when f is not constant. Now,
d d q D q , s v = D q , s v α q , s q 2 q | f | q ln | f | | f | q ln | f | q 3 α q , s ln ( ϖ | f | q )
for f = ( 2 ) s / 2 v (or for f = × v when the family D q v is considered). In view of (13), the first two terms constitute a positive quantity. Therefore, whether D q , s v grows for any q depends on the sign and magnitude of the last term. It is instructive to consider a model f such that | f | is constant on a set of Lebesgue measure μ , and f = 0 everywhere else in C . In this case, for s satisfying (10), d D q , s v / d q > 0 provided
| f | < ( A / μ ) ( s + 1 ) / 3 / ϖ .
This suggests that the onset of scenario II is possible for sufficiently small μ / A , i.e., for sufficiently space-intermittent flows, where intensive eddies are highly localised. Notably, the condition (14) does not explicitly involve the norm index q.
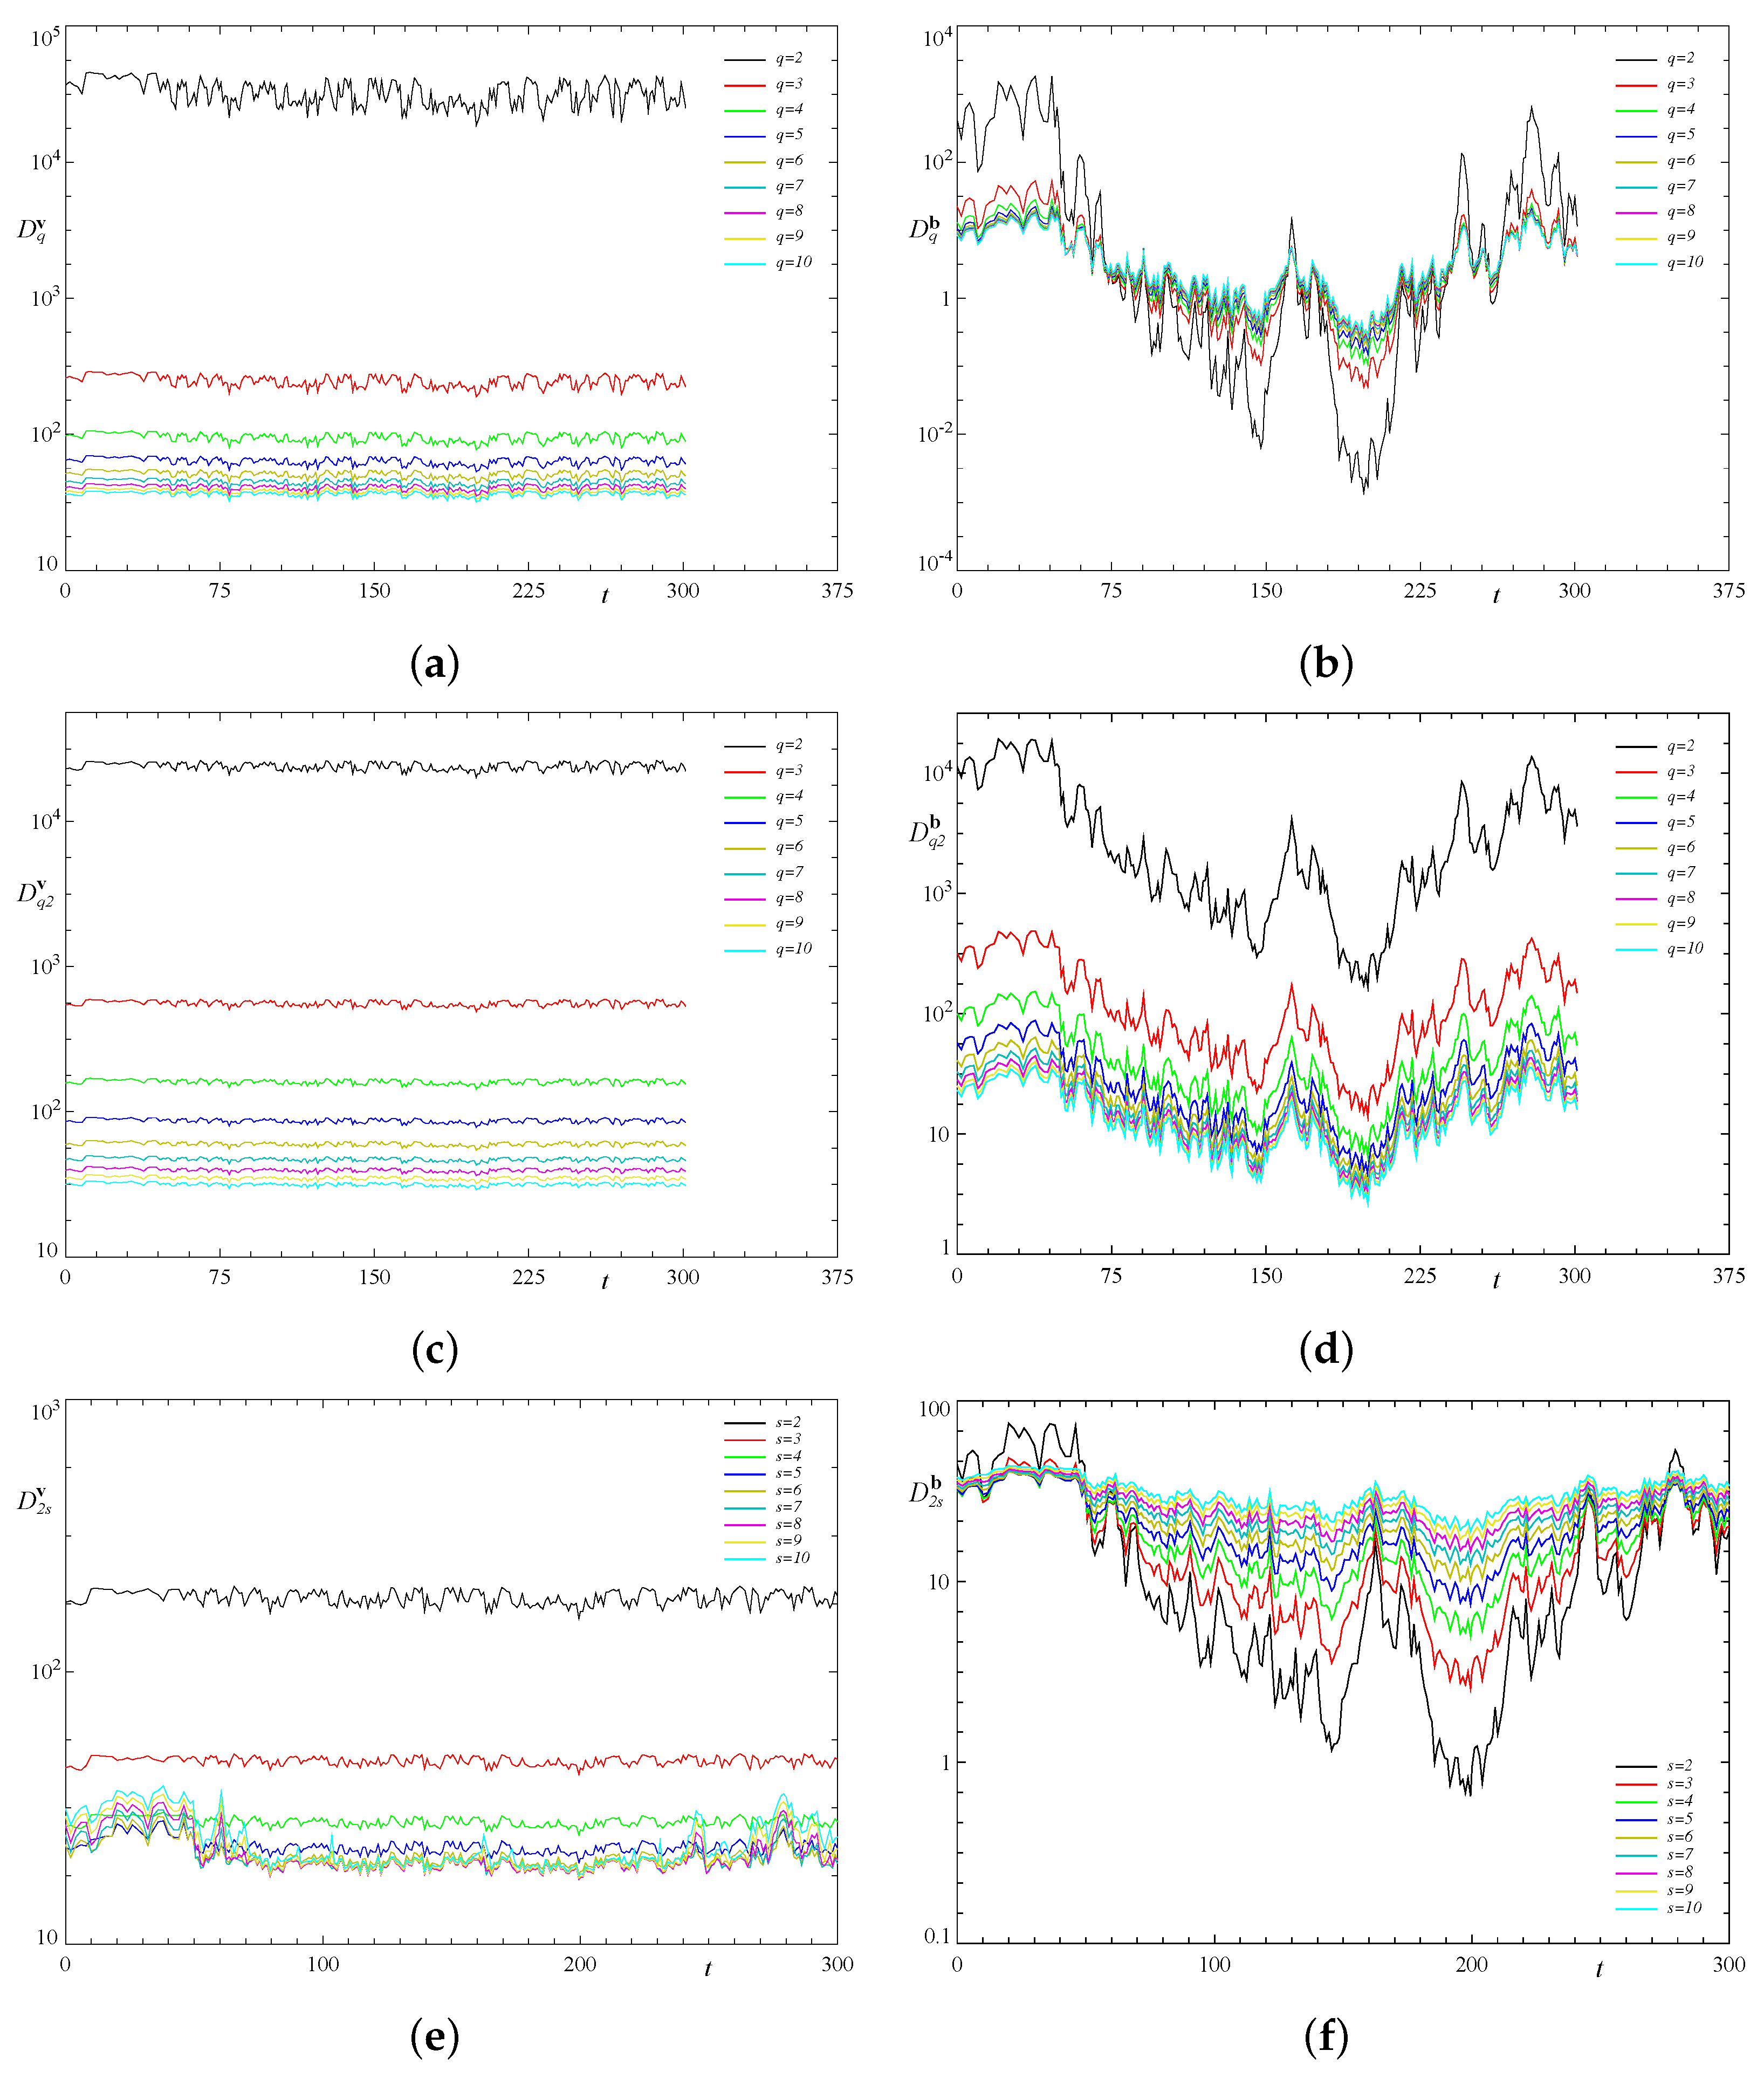
We have computed some quantities D q and D q , s for the flow and magnetic field obtained in computations for both considered resolutions. In our simulations, the flow also follows scenario I (see, e.g., Figure 29 presenting the temporal behaviour of D q and D q , s in run 4x1.1; we observe a similar behaviour in other runs). We have checked that the monotonic decrease in D q v in q 10 holds for all runs and all resolutions (we note that, for all families of the considered quantities, the monotonicity is not broken initially). The robustness of this property is remarkable, in particular, for the following reason: while solutions to the Navier–Stokes equations alone were considered in [54], we have been solving the complete system (1) of equations of thermal convective dynamo. The fast accumulation of D q v for q 4 (see Figure 29a) was interpreted in [54], as indicating the presence of a significant depletion, i.e., cancellation in the vector products constituting the nonlinear terms in (Section 2.1), and their decrease upon the removal of the gradient parts in the Navier–Stokes equation. The similarity of the graphs of D q v for q 4 as functions of time can be attributed to the fast convergence of | × v | q 1 / q and α q , s on increasing q to the essential maximum of | × v | and 1 / ( s + 1 ) , respectively. The fast convergence of | × v | q 1 / q and | × b | q 1 / q primarily characterises the distributions of values of | × v | and | × b | . The fast-converging powers α q , s in the definition of D q may have been chosen arbitrarily, just because these powers are the maximum ones, for which (9) can be proven [71,72] (indicating that we can estimate the depletion only very roughly).
We observe that the values of D q , 2 v monotonically decrease in q in all runs as well (see Figure 29b). For larger values of q and/or for other s, or when computed for the magnetic field, the monotonicity of D q or D q , s can partially break down or become completely inverted (at least in the considered parameter range 2 q 10 ). For instance, in run 4x1.1, D q b decreases in q, as well as D q v , for t 45 , but monotonically increases in q almost in the entire time interval 80 t 160 (see Figure 29b). Similarly, the quantities D q , s may decrease in s for small values of the parameter, but they begin to increase for larger s (e.g., for 60 t 270 , D q , s b monotonically increases in s for all s 10 , for which computations have been carried out, as Figure 29f shows). In some runs, D q , s b for q = 2 monotonically increases in s for all considered s in the range 1 s 10 in some time intervals; by contrast, a monotonic increase in D 2 , s v in s becomes broken at all times in all runs.

4. Concluding Remarks

We have explored numerically the magnetic dynamo action of thermal space-periodic convection in a horizontal plane layer of electrically conducting fluid rotating about the vertical axis, focusing on the nonlinear perturbations of the MHD steady state identified in [49]. We have investigated the temporal evolution of small perturbations, whose periods in horizontal directions are up to four times larger than the spatial period of the MHD state that we perturb. No evidence has been found that a multiscale weakly nonlinear perturbation of the kind considered in [53] develops. This may have two reasons. On the one hand, the scale ratio ε = 1 / 4 is probably insufficiently small for the regimes to set in that were found in [53] by asymptotic methods for infinitesimally small ε . On the other, intermediate-scale perturbations are likely to dominate, which is typical for all kinds of linear stability problems in the MHD realm: purely hydrodynamic perturbations of flows, magnetic modes arising in the context of the kinematic dynamo problem (i.e., magnetic perturbations of flows of electrically conducting fluids), and full MHD perturbations of MHD regimes [44,45].
Looking at the problem from a broader perspective, we have also considered initial conditions that are large perturbations of the replicated MHD steady state found in [49]. All the attractors revealed in our computations are chaotic, except for the attractor in the so-called elongated (where the spatial period in one horizontal direction is several times larger than the period of the state subjected to perturbation, and in the complementary horizontal Cartesian direction it is equal to the period of the unperturbed steady state) triple-period fluid cells, where it is a travelling wave. Regardless of whether the initial perturbation is small or large, only in the elongated periodicity cells, where the long spatial period is twice or four times larger than the period of the unperturbed state, the attractors remain MHD (i.e., the magnetic field does not decay in the terminal regime). We have identified two distinct MHD attractors in the double-period cells and just a single one in quadruple-period cells; in the fluid cells of the 2:1 and 4:1 aspect ratio, we have not found any hydrodynamic attractor with the magnetic field ultimately decaying.
For a number of runs, we have computed the estimates of the characteristic length scales of the flow structures, defined in terms of ratios (7) of Sobolev norms of the flow velocity (see [64]). Using these estimates and the r.m.s. velocity values, we have computed magnetic Reynolds number estimates. The estimated values turn out to be relatively small (typically below 35.6). Neither the obtained Rm values, nor the mean helicity distinguish between the generating attractors in the elongated cells and the non-generating ones in the triple-period elongated or wide cells. (Let us note that, when considered in the fluid cells of different periodicities, the dynamical systems described by the same system of Equations (1) are distinct, and thus the emergence of chaos in double- and quadruple-period elongated cells does not imply that the attractor for triple-period cells should also demonstrate chaotic behaviour.) Attractors in the periodicity cells, where both periods in the horizontal direction are larger than that of the MHD state subjected to perturbation, are characterised by smaller estimates of Rm. This owes to the shortening of the characteristic length scales significantly below the period of the unperturbed state in such cells, and to the convection becoming less vigorous, which results in the cessation of magnetic field generation. The length scale estimates and the kinetic energy remain more or less the same for all of these non-elongated fluid cells. This can be interpreted as follows: the flow does not “feel” the influence of the “boundaries” of periodicity cells.

Supplementary Materials

The following supporting information can be downloaded at: https://www.mdpi.com/article/10.3390/math10162957/s1, Video S1: 2x1.1; Video S2: 2x2.1; Video S3: 2x3.1; Video S4: 4x2.1; Video S5: 4x4.1. The videos show isosurfaces of the kinetic and magnetic energy densities of the simulated solution or, for the run 4x4.1, of the perturbations. The video name indicates the size of the periodicity box shown in the video.

Author Contributions

S.R.J. developed the parallel code, performed numerical simulations, produced the videos and designed the figures; R.C. wrote the sequential code for 1x1 simulations, auxiliary codes for the post-processing and analysis of the results, and designed the concept of the parallel code; S.G. produced the codes for the analysis of chaotic regimes and supervised the findings of the work; V.Z. conceived the project, carried out the analysis of Section 3.6 and wrote the paper. All authors were involved in the discussion of the results and planning the implementation of the project, and provided critical feedback about the manuscript. All authors have read and agreed to the published version of the manuscript.

Funding

V.Z. and R.C. were financed by grant No. 22-17-00114 of the Russian Science Foundation, https://rscf.ru/project/22-17-00114. S.R. (FCT scholarship PD/BD/142889/2018) and S.G. were partially supported by CMUP, which is financed by national funds through FCT under the project ref. UIDB/00144/2020; by project MAGIC POCI-01-0145-FEDER-032485, funded by FEDER via COMPETE 2020–POCI and by FCT/MCTES via PIDDAC; by project SNAP NORTE-01-0145-FEDER-000085, co-financed by ERDF/NORTE2020 under Portugal 2020 Partnership Agreement; by AL ARISE, Ref. LA/P/0112/2020, SYSTEC–Base, Ref. UIDB/00147/2020, and Programmatic, Ref. UIDP/00147/2020. A part of computations were carried out on (i) the OBLIVION Supercomputer (Évora University) under FCT computational project 2021.09815.CPCA; and (ii) Navigator LCA (Coimbra University) under project CPCA/A00/7317/2020.

Conflicts of Interest

The authors declare no conflict of interest. The funders had no role in the design of the study; in the collection, analyses, or interpretation of data; in the writing of the manuscript, or in the decision to publish the results.

References

  1. Gilbert, W. De Magnete; Gilbert Club Revised English Translation, 1900; Chiswick Press: London, UK, 1600. [Google Scholar]
  2. Schuster, A. A critical examination of the possible causes of terrestrial magnetism. Proc. Phys. Soc. Lond. 1911, 24, 121–137. [Google Scholar] [CrossRef]
  3. Larmor, J. How could a rotating body such as the Sun become a magnet? In A Source Book in Astronomy and Astrophysics; Harvard University Press: Cambridge, MA, USA, 1900–1975; pp. 106–107. [Google Scholar]
  4. Larmor, J. Possible rotational origin of magnetic fields of Sun and Earth. Electr. Rev. 1919, 85, 412. [Google Scholar]
  5. Moffatt, H.K. Magnetic Field Generation in Electrically Conducting Fluids; CUP: Cambridge, UK, 1978. [Google Scholar]
  6. Moffatt, H.K.; Dormy, E. Self-Exciting Fluid Dynamos; CUP: Cambridge, UK, 2019. [Google Scholar]
  7. Priest, E.R. Solar Magnetohydrodynamics; D. Reidel: Dordrecht, The Netherlands, 1984. [Google Scholar]
  8. Mestel, L. Stellar Magnetism; Oxford University Press: Oxford, UK, 2003. [Google Scholar]
  9. Ruzmaikin, A.A.; Shukurov, A.M.; Sokoloff, D.D. Magnetic Fields of Galaxies; Kluwer: Dordrecht, The Netherlands, 1988. [Google Scholar]
  10. Soward, A.M.; Jones, C.A.; Hughes, D.W.; Weiss, N.O. (Eds.) Fluid Dynamics and Dynamos in Astrophysics and Geophysics; CRC Press: London, UK, 2005. [Google Scholar]
  11. Vainshtein, S.I.; Zeldovich, Y.; Ruzmaikin, A.A. The Turbulent Dynamo in Astrophysics; Nauka: Moscow, Russia, 1980. (In Russian) [Google Scholar]
  12. Jacobs, J.A. Reversals of the Earth’s Magnetic Field, 2nd ed.; CUP: Cambridge, UK, 1994. [Google Scholar]
  13. Ueda, S. The New View of the Earth: Moving Continents and Moving Oceans; WH Freeman: San Francisco, CA, USA, 1978. [Google Scholar]
  14. Glatzmaier, G.A.; Roberts, P.H. A three-dimensional convective dynamo solution with rotating and finitely conducting inner core and mantle. Phys. Earth Planet. Inter. 1995, 91, 63–75. [Google Scholar] [CrossRef]
  15. Glatzmaier, G.A.; Roberts, P.H. A three-dimensional self-consistent computer simulation of a geomagnetic field reversal. Nature 1995, 377, 203–209. [Google Scholar] [CrossRef]
  16. Glatzmaier, G.A.; Roberts, P.H. An anelastic evolutionary geodynamo simulation driven by compositional and thermal convection. Phys. D Nonlinear Phenom. 1996, 97, 81–94. [Google Scholar] [CrossRef]
  17. Glatzmaier, G.A.; Roberts, P.H. Rotation and magnetism of Earth’s inner core. Science 1996, 274, 1887–1891. [Google Scholar] [CrossRef]
  18. Glatzmaier, G.A.; Roberts, P.H. Simulating the geodynamo. Contemp. Phys. 1997, 38, 269–288. [Google Scholar] [CrossRef]
  19. Glatzmaier, G.A.; Coe, R.S.; Hongre, L.; Roberts, P.H. The role of the Earth’s mantle in controlling the frequency of geomagnetic reversals. Nature 1999, 401, 885–890. [Google Scholar] [CrossRef]
  20. Roberts, P.H.; Glatzmaier, G.A. The geodynamo, past, present and future. Geophys. Astrophys. Fluid Dyn. 2001, 94, 47–84. [Google Scholar] [CrossRef]
  21. Parker, E.N. Hydrodynamic dynamo models. Astrophys. J. 1955, 122, 293–314. [Google Scholar] [CrossRef]
  22. Parker, E.N. Cosmical Magnetic Fields: Their Origin and Their Activity; Clarendon Press: Oxford, UK, 1979. [Google Scholar]
  23. Braginsky, S.I. Self excitation of a magnetic field during the motion of a highly conducting fluid. J. Exper. Theor. Phys. 1964, 20, 726–735. [Google Scholar]
  24. Braginsky, S.I. Theory of the hydromagnetic dynamo. J. Exper. Theor. Phys. 1964, 47, 2178–2193. [Google Scholar]
  25. Braginsky, S.I. Kinematic models of the Earth’s hydromagnetic dynamo. Geomagn. Aeron. 1964, 4, 732–747. [Google Scholar]
  26. Braginsky, S.I. Magnetohydrodynamics of the Earth’s core. Geomagn. Aeron. 1964, 4, 898–916. [Google Scholar]
  27. Braginsky, S.I. Nearly axially symmetric model of the hydromagnetic dynamo of the Earth, I. Geomagn. Aeron. 1975, 15, 149–156. [Google Scholar]
  28. Braginsky, S.I. Nearly axially symmetric model of the hydromagnetic dynamo of the Earth, II. Geomagn. Aeron. 1978, 18, 340–351. [Google Scholar]
  29. Krause, F.; Rädler, K.-H. Mean-Field Magnetohydrodynamics and Dynamo Theory; Academic-Verlag: Berlin, Germany, 1980. [Google Scholar]
  30. Steenbeck, M.; Krause, F.; Rädler, K.-H. A calculation of the mean electromotive force in an electrically conducting fluid in turbulent motion, under the influence of Coriolis forces. Z. Naturforsch A 1966, 21, 369–376. [Google Scholar] [CrossRef]
  31. Rädler, K.-H. Mean-field dynamo theory: Early ideas and today’s problems. In Magnetohydrodynamics. Historical Evolution and Trends; Molokov, S., Moreau, R., Moffatt, K., Eds.; Springer: Dordrecht, The Netherlands, 2007; pp. 55–72. [Google Scholar]
  32. Dubrulle, B.; Frisch, U. Eddy viscosity of parity-invariant flow. Phys. Rev. A 1991, 43, 5355–5364. [Google Scholar] [CrossRef]
  33. Zheligovsky, V.A. On the linear stability of steady space-periodic magnetohydrodynamic systems to large-scale perturbations. Phys. Solid Earth 2003, 39, 409–418. [Google Scholar]
  34. Zheligovsky, V.A. Large-scale perturbations of magnetohydrodynamic regimes: Linear and weakly nonlinear stability theory. In Lecture Notes in Physics; Springer: Berlin/Heidelberg, Germany, 2011; Volume 829. [Google Scholar]
  35. Lanotte, A.; Noullez, A.; Vergassola, M.; Wirth, A. Large-scale dynamo by negative magnetic eddy diffusivities. Geophys. Astrophys. Fluid Dyn. 1999, 91, 131–146. [Google Scholar] [CrossRef]
  36. Vishik, M.M. Periodic dynamo. In Mathematical Methods in Seismology and Geodynamics; Keilis-Borok, V.I., Levshin, A.L., Eds.; Nauka: Moscow, Russia, 1986; pp. 186–215. (In Russian) [Google Scholar]
  37. Vishik, M.M. Periodic dynamo. II. In Numerical Modelling and Analysis of Geophysical Processes; Keilis-Borok, V.I., Levshin, A.L., Eds.; Nauka: Moscow, Russia, 1987; pp. 12–22. [Google Scholar]
  38. Zheligovsky, V.A.; Podvigina, O.M.; Frisch, U. Dynamo effect in parity-invariant flow with large and moderate separation of scales. Geophys. Astrophys. Fluid Dyn. 2001, 95, 227–268. [Google Scholar] [CrossRef]
  39. Gama, S.; Chaves, M. Time evolution of the eddy viscosity in two-dimensional Navier–Stokes flow. Phys. Rev. Lett. 2000, 61, 2118–2120. [Google Scholar]
  40. Gama, S.; Vergassola, M.; Frisch, U. Negative eddy viscosity in isotropically forced two-dimensional flow: Linear and nonlinear dynamics. J. Fluid Mech. 1994, 260, 95–126. [Google Scholar] [CrossRef]
  41. Wirth, A.; Gama, S.; Frisch, U. Eddy viscosity of three-dimensional flow. J. Fluid Mech. 1995, 288, 249–264. [Google Scholar] [CrossRef]
  42. Roberts, G.O. Spatially periodic dynamos. Phil. Trans. Roy. Soc. Lond. A 1970, 266, 535–558. [Google Scholar]
  43. Roberts, G.O. Dynamo action of fluid motions with two-dimensional periodicity. Phil. Trans. Roy. Soc. Lond. A 1972, 271, 411–454. [Google Scholar]
  44. Chertovskih, R.A.; Zheligovsky, V.A. Linear perturbations of the Bloch type of space-periodic magnetohydrodynamic steady states. 2022. manuscript in preparation. [Google Scholar]
  45. Zheligovsky, V.A.; Chertovskih, R.A. On kinematic generation of magnetic modes of the Bloch type. Phys. Solid Earth 2020, 56, 104–117. [Google Scholar] [CrossRef]
  46. Meneguzzi, M.; Pouquet, A. Turbulent dynamos driven by convection. J. Fluid Mech. 1989, 205, 297–318. [Google Scholar] [CrossRef]
  47. Demircan, A.; Seehafer, N. Dynamo in asymmetric square convection. Geophys. Astrophys. Fluid Dyn. 2002, 96, 461–479. [Google Scholar] [CrossRef]
  48. Matthews, P.C. Dynamo action in simple convective flows. Proc. R. Soc. Lond. A 1999, 455, 1829–1840. [Google Scholar] [CrossRef]
  49. Chertovskih, R.; Gama, S.M.A.; Podvigina, O.; Zheligovsky, V. Dependence of magnetic field generation by thermal convection on the rotation rate: A case study. Phys. D 2010, 239, 1188–1209. [Google Scholar] [CrossRef]
  50. Gertsenshtein, S.Y.; Zheligovsky, V.A.; Podvigina, O.M.; Chertovskih, R.A. On magnetic field generation by three-dimensional convective flows of conducting fluid in a rotating horizontal layer. Dokl. Akad. Nauk. 2007, 417, 613–615. [Google Scholar] [CrossRef]
  51. Gertsenshtein, S.Y.; Chertovskikh, R.A. Generation of a magnetic field by convective flows in a rotating horizontal layer. Fluid Dyn. 2008, 43, 248–256. [Google Scholar] [CrossRef]
  52. Zheligovsky, V.A. Amplitude equations for weakly nonlinear two-scale perturbations of free hydromagnetic convective regimes in a rotating layer. Geophys. Astrophys. Fluid Dyn. 2009, 103, 397–420. [Google Scholar] [CrossRef]
  53. Chertovskih, R.; Zheligovsky, V. Large-scale weakly nonlinear perturbations of convective magnetic dynamos in a rotating layer. Physica D 2015, 313, 99–116. [Google Scholar] [CrossRef]
  54. Donzis, D.A.; Gibbon, J.D.; Gupta, A.; Kerr, R.M.; Pandit, R.; Vincenzi, D. Vorticity moments in four numerical simulations of the 3D Navier—Stokes equations. J. Fluid Mech. 2013, 732, 316–331. [Google Scholar] [CrossRef]
  55. Podvigina, O.M. Magnetic field generation by convective flows in a plane layer. Eur. Phys. J. B 2006, 50, 639–652. [Google Scholar] [CrossRef]
  56. Podvigina, O.M. Magnetic field generation by convective flows in a plane layer: The dependence on the Prandtl number. Geophys. Astrophys. Fluid Dyn. 2008, 102, 409–433. [Google Scholar] [CrossRef]
  57. Chertovskih, R.; Rempel, E.L.; Chimanski, E.V. Magnetic field generation by intermittent convection. Phys. Lett. A 2017, 381, 3300–3306. [Google Scholar] [CrossRef]
  58. Boyd, J.P. Chebyshev and Fourier Spectral Methods; Dover: Mineola, NY, 2001. [Google Scholar]
  59. Canuto, C.; Hussaini, M.Y.; Quarteroni, A.; Zang, T.A. Spectral Methods in Fluid Dynamics; Springer: New York, NY, USA, 1988. [Google Scholar]
  60. Peyret, R. Spectral Methods for Incompressible Viscous Flow; Springer: Berlin/Heidelberg, Germany, 2002. [Google Scholar]
  61. Cox, S.M.; Matthews, P.C. Exponential time differencing for stiff systems. J. Comput. Phys. 2002, 176, 430–455. [Google Scholar] [CrossRef]
  62. Chertovskih, R.; Chimanski, E.V.; Rempel, E.L. Route to hyperchaos in Rayleigh–Bénard convection. Europhysics Lett. 2015, 112, 14001. [Google Scholar] [CrossRef]
  63. Hutt, A.; Graben, P. Sequences by metastable attractors: Interweaving dynamical systems and experimental data. Front. Appl. Math. Stat. 2017, 3, 11. [Google Scholar] [CrossRef]
  64. Doering, C.R.; Gibbon, J.D. Applied Analysis of the Navier–Stokes Equations; Cambridge University Press: Cambridge, UK, 1995. [Google Scholar]
  65. Arnold, V.I.; Korkina, E.I. The growth of a magnetic field in a three-dimensional incompressible flow. Vestnik Moscow State Univ. Ser. Math. 1983, 3, 43–46. (In Russian) [Google Scholar]
  66. Zheligovsky, V.A. A kinematic magnetic dynamo sustained by a Beltrami flow in a sphere. Geophys. Astrophys. Fluid Dyn. 1993, 73, 217–254. [Google Scholar] [CrossRef]
  67. Zheligovsky, V.A.; Galloway, D.J. Dynamo action in Christopherson hexagonal flow. Geophys. Astrophys. Fluid Dyn. 1998, 88, 277–293. [Google Scholar] [CrossRef]
  68. Kosobokov, V.G. On a regularity in the sequence of the Earth’s magnetic field reversals. Earth Sci. Sect. 1996, 345, 128–132. [Google Scholar]
  69. Rasskazov, A.; Chertovskih, R.; Zheligovsky, V. Magnetic field generation by pointwise zero-helicity three-dimensional steady flow of incompressible electrically conducting fluid. Phys. Rev. E 2018, 97, 043201. [Google Scholar] [CrossRef]
  70. Zeldovich, Y.B. The magnetic field in the two-dimensional motion of a conducting turbulent fluid. J. Exper. Theor. Phys. 1957, 4, 460–462. [Google Scholar]
  71. Zheligovsky, V. Space analyticity and bounds for derivatives of solutions to the evolutionary equations of diffusive magnetohydrodynamics. Mathematics 2021, 9, 1789. [Google Scholar] [CrossRef]
  72. Foias, C.; Guillopé, C.; Temam, R. New a priori estimates for Navier–Stokes equations in dimension 3. Comm. Partial. Diff. Equations 1981, 6, 329–359. [Google Scholar] [CrossRef]
  73. Gibbon, J.D. Weak and strong solutions of the 3D Navier–Stokes equations and their relation to a chessboard of convergent inverse length scales. J. Nonlin. Sci. 2019, 29, 215–228. [Google Scholar] [CrossRef]
  74. Gibbon, J.D. Regularity and singularity in solutions of the three-dimensional Navier–Stokes equations. Proc. R. Soc. A 2010, 466, 2587–2604. [Google Scholar] [CrossRef]
  75. Gibbon, J.D. A hierarchy of length scales for weak solutions of the three-dimensional Navier–Stokes equations. Comm. Math. Sci. 2011, 10, 131–136. [Google Scholar] [CrossRef]
  76. Gibbon, J.D. Conditional regularity of solutions of the three-dimensional Navier–Stokes equations and implications for intermittency. J. Math. Phys. 2012, 53, 115608. [Google Scholar] [CrossRef]
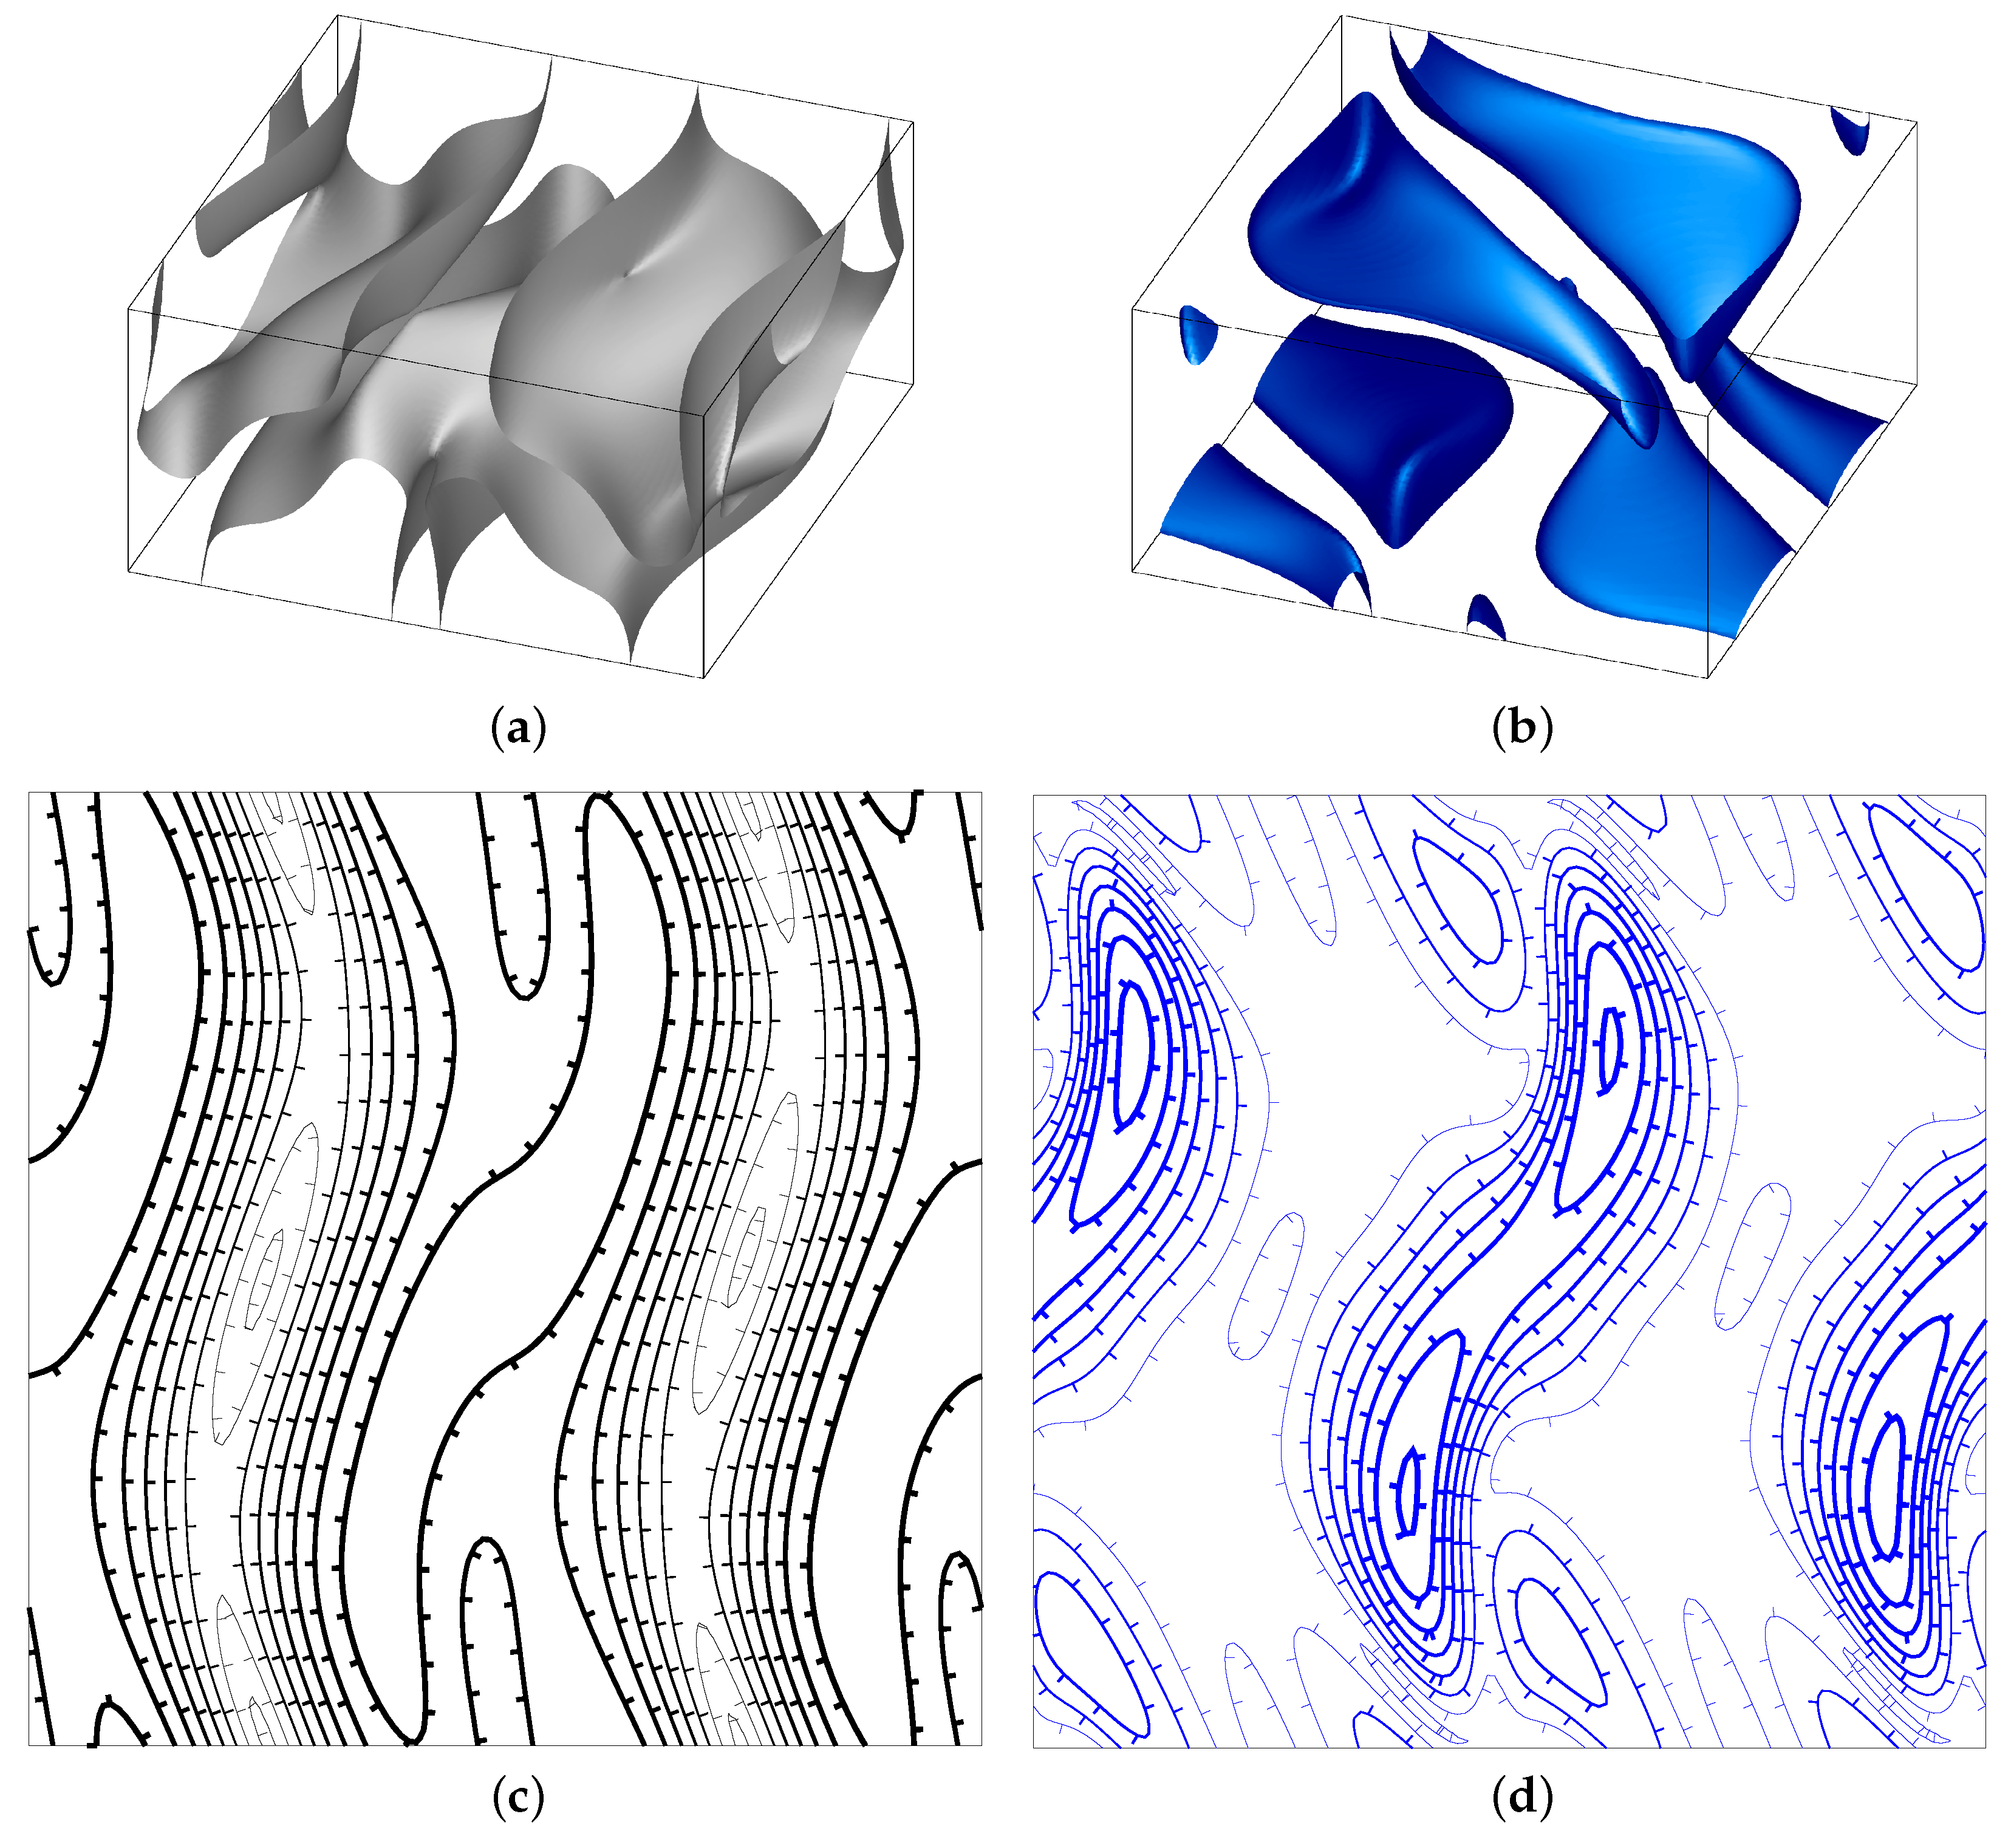
Figure 1. Isosurfaces of the kinetic (a) and magnetic (b) energy densities at the levels of 1/2 of the respective maxima of the unperturbed short-scale convective dynamo steady state. One periodicity box is shown. Isolines of the kinetic (c) and magnetic (d) energy densities on the midplane x 3 = 0 , step 1.5 and 0.3, respectively. In (c) and (d), the line width increases with the common along-the-line value of the energy density.
Mathematics 10 02957 g001
Figure 2. Energy spectrum of the flow at t = 220 in run 2 for M 1 = M 2 = 2 ; the kinetic energy distribution E k v over shells C k is shown for fully populated shells only.
Mathematics 10 02957 g002
Figure 3. Space- and time-averaged kinetic (smaller black dots, left axis) and magnetic (larger blue dots, right axis) energies for the attractors obtained in the runs with the standard ( 128 M 1 × 128 M 2 × 97 harmonics), (a), and alternative ( 256 × 256 × 257 harmonics), (b), resolution. Gray vertical lines: r.m.s. deviations of the space-averaged kinetic energy from their time averages. Thin vertical dotted lines separate the runs into groups of regimes residing in identical periodicity cells.
Mathematics 10 02957 g003
Figure 4. Temporal behaviour of the time-dependent estimates of the length scales (7), 1 (green line) and 3 (blue line), (a), and of the magnetic Reynolds number, Rm 1 (green line) and Rm 3 (blue line), in run 1x2.2 (b).
Mathematics 10 02957 g004
Figure 5. Temporal behaviour of the kinetic (left vertical axis, black line) and magnetic (right vertical axis, blue line) energies in the double-period runs 1x2.1 (a), 1x2.2 (c), 1x2.3 (e), 2x1.1 (g), 2x1.2 (i), and 2x1.3 (k). Evolution of the magnetic energy versus kinetic energy in runs 1x2.1 (b), 1x2.2 (d), 1x2.3 (f), 2x1.1 (h), 2x1.2 (j), and 2x1.3 (l).
Mathematics 10 02957 g005aMathematics 10 02957 g005b
Figure 6. Isosurfaces of the kinetic (a) and magnetic (b) energy densities at the level of 1/2 of their respective maxima in run 1x2.3 at time t = 1650.707 . One double-period fluid box is shown.
Mathematics 10 02957 g006
Figure 7. Temporal behaviour of the Fourier coefficients Re v ^ 111 1 (left column) and Re v ^ 222 1 (right column) in run 2x1.2 in four time intervals: 0 t 320 (phase T of the initial transient processes, chaotic behaviour and approach to the quasiperiodic metastable state), (a), (b); 800 t 830 (phase G in the vicinity of the quasiperiodic hydrodynamic metastable state), (c), (d); 1520 t 2020 (departure from phase G, phase S of the saturated chaotic regime and approach to the chaotic phase D), (e), (f); and 2000 t 2200 (phase D of magnetic field decay), (g), (h).
Mathematics 10 02957 g007
Figure 8. Temporal power spectra of the Fourier coefficients Re v ^ 111 1 (left column) and Re v ^ 222 1 (right column) in run 2x1.2 in the time intervals 285 t 1555 (phase G), (a), (b); 1580 t 1940 (phase S), (c), (d); and 2000 t 2200 (phase D), (e), (f).
Mathematics 10 02957 g008
Figure 9. Projection of the Poincaré map of the hyperplane Re v ^ 222 3 = 0 on the plane (Re v ^ 111 1 ,Re v ^ 111 2 ) in the time intervals 300 t 1500 (phase G), (a); 1600 t 2015 (phase S and its small neighbourhood), (b); and 2000 t 2200 (phase D), (c), in run 2x1.2.
Mathematics 10 02957 g009
Figure 10. Temporal behaviour of the kinetic (left vertical axis, black line) and magnetic (right vertical axis, blue line) energies in the double-period run 2x1.2 for 1540 t 1960 , phase S (a). Evolution of the magnetic energy versus kinetic energy in this run in the same time interval (b).
Mathematics 10 02957 g010
Figure 11. Temporal behaviour of the mean kinetic helicity (green line, right vertical axis) together with the kinetic energy (black line, left vertical axis) for reference in runs 1x2.2 (a), 2x1.2 (b) and 2x1.1 (c).
Mathematics 10 02957 g011
Figure 12. Temporal behaviour of the Fourier coefficients Re b ^ 111 1 (a) and Im b ^ 111 1 (b) in run 2x1.1.
Mathematics 10 02957 g012
Figure 13. Temporal behaviour of the kinetic (left vertical axis, black line) and magnetic (right vertical axis, blue line) energies in triple-period runs (left column), and the projection of the trajectories on the plane of magnetic and kinetic energies (right column). Runs 3x1.1, (a), (b), and 3x1.2, (c), (d), with the standard space resolution ( 128 × 384 × 97 harmonics); and run 3x1.2, (e), (f), with the alternative resolution ( 256 × 256 × 257 harmonics).
Mathematics 10 02957 g013
Figure 14. Isosurfaces of the kinetic, (a), (c) and magnetic (b), (d) energy densities in run 3x1.2 (the standard resolution) at times t = 380.671 (a), (b) and t = 566.671 (c), (d), at the levels of 15% (d), 30% (b) and 50% (a), (c) of the respective maxima of the densities. One triple-period fluid box is shown.
Mathematics 10 02957 g014
Figure 15. Isosurfaces of the flow components: v 1 = 0 (a), (d); v 2 = 0 (b), (e); v 3 = 0 (c), (f) in run 3x1.2 (the standard resolution) at times t = 380.671 (a)–(c) and t = 566.671 (d)–(f). Two adjacent triple-period fluid boxes are shown. However, by the boundary conditions (2.1), v 3 = 0 on the horizontal boundaries, they are not shown as isosurfaces in (c), (f), because that would block the view of the isosurfaces inside the fluid volume.
Mathematics 10 02957 g015
Figure 16. Temporal behaviour of the magnetic Reynolds number estimates Rm 1 (green line) and Rm 3 (blue line), (a), and of the kinetic helicity (green line, right vertical axis) together with the kinetic energy (black line, left vertical axis) for reference, (b), in run 3x1.2.
Mathematics 10 02957 g016
Figure 17. Temporal behaviour of the Fourier coefficients Re v ^ 111 1 (a) and Re v ^ 222 1 (b) for 0 t 600 in run 3x1.2.
Mathematics 10 02957 g017
Figure 18. Temporal power spectra of the Fourier coefficients Re v ^ 111 1 (left column) and Re v ^ 222 1 (right column) in the interval 50 t 533 in run 3x1.2 (a), (b) and in the interval 75 t 975 in run 1x3.3 (c), (d).
Mathematics 10 02957 g018
Figure 19. Projection of the Poincaré map of the hyperplane Re v ^ 222 3 = 0 on the plane (Re v ^ 111 1 , Re v ^ 111 2 ) for the amagnetic attractors in runs 1x3.1 (constructed over the time interval 100 t 487 ) (a) and 3x1.3 (over 300 t 550 ) (b).
Mathematics 10 02957 g019
Figure 20. Temporal behaviour of the mean kinetic (left vertical axis, black line) and magnetic (right vertical axis, blue line) energies (left column), and projection of the trajectories on the plane of magnetic and kinetic energies (right column) in the quadruple-period runs 4x1.2 for the standard resolution, (a), (b); 4x1.1 for the standard resolution, (c), (d); and 4x1.1 for the alternative resolution (e), (f).
Mathematics 10 02957 g020
Figure 21. Temporal behaviour of the Fourier coefficients Re v ^ 111 1 (a) and Re v ^ 222 1 (b) in run 4x1.1.
Mathematics 10 02957 g021
Figure 22. Temporal behaviour of the magnetic Reynolds number estimates, Rm 1 (green line) and Rm 3 (blue line), (a); and of the kinetic helicity (green line, right vertical axis) together with the kinetic energy (black line, left vertical axis) for reference, (b), in run 4x1.1.
Mathematics 10 02957 g022
Figure 23. Temporal power spectra of the Fourier coefficients Re v ^ 111 1 (left column) and Re v ^ 222 1 (right column) in the standard-resolution run 4x1.1 in the time intervals 15 t 120 , (a), (b); 132 t 212 , (c), (d); and 223 t 242 , (e), (f).
Mathematics 10 02957 g023
Figure 24. Isosurfaces of the kinetic (a) and magnetic (b) energy densities at the levels of 50% and 35% of their respective maxima in run 4x1.1 at time t = 222.626 . One quadruple-period fluid box is shown.
Mathematics 10 02957 g024
Figure 25. Temporal behaviour of the kinetic (left vertical axis, black line) and magnetic (right vertical axis, blue line) energies in the double-period runs 4x4.2 (a) and 2x4.2 (b).
Mathematics 10 02957 g025
Figure 26. Temporal behaviour of the Fourier coefficients Re v ^ 111 1 (a) and Re v ^ 222 1 (b) in run 2x4.2.
Mathematics 10 02957 g026
Figure 27. Temporal power spectra of the Fourier coefficients Re v ^ 111 1 (a) and Re v ^ 222 1 (b) in the time interval 40 t 381.21 in run 2x4.2.
Mathematics 10 02957 g027
Figure 28. Projection of the Poincaré map of the hyperplane Re v ^ 222 3 = 0 on the plane (Re v ^ 111 1 , Re v ^ 111 2 ) constructed over the time interval 40 t 381.21 for run 2x4.2.
Mathematics 10 02957 g028
Figure 29. Time evolution of the quantities D q v (a), D q , s v (c), (e), D q b (b) and D q , s b (d), (f) for s = 2 and q varying in the range 2 q 10 (c), (d), and for q = 2 and s in the range 1 s 10 (e), (f) in run 4x1.1.
Mathematics 10 02957 g029
Table 1. Minimum energy spectrum decay (orders of magnitude) in the simulated regimes of spatial periods M 1 L and M 2 L in x 1 and x 2 , respectively. In each cell of the table, three lines show the decays in the runs for the three different initial conditions that are labelled by the suffices 1, 2 and 3 in the names of the runs (see the beginning of the present section). In each line, commas separate three groups of numbers showing the energy spectra decays of the flow, v , magnetic field, b , and the difference, θ , between the temperature and the linear temperature profile for the fluid at equilibrium in the respective run. A single number in a group, or the first number in a group of two numbers refers to the value in the run with the standard resolution of 128 M 1 × 128 M 2 × 97 harmonics. The second number (after the slash) in a group of two numbers refers to the decay in the alternative resolution run involving 256 × 256 × 257 harmonics, when such runs have been performed.
M 1 , M 2 1234
1 15.8,9.6,21.821.4,8.0,24.67.8/11.7,4.3/7.2,12.7/17.6
15.2,12.2,21.79.9/13.4,6.3/10.5,15.9/18.87.2/11.6,4.3/6.3,12.0/16.8
17.1,9.6,23.411.1/13.6,6.0/13.0,16.0/19.69.5/11.0,4.2/6.8,13.6/16.2
216.2,11.4,21.836.0,14.1,38.025.3,9.0,27.318.8/12.2,6.5/7.7,20.8/17.1
15.0,8.5,20.537.8,15.0,38.124.6,7.9,26.318.3/11.2,6.5/7.6,20.0/15.7
25.0,9.0,27.236.9,14.6,38.024.9,8.5,26.518.6/10.9,5.9/7.2,20.2/15.7
39.8/14.9,5.7/12.1,14.7/20.925.1,8.2,26.624.7,8.8,27.118.4/11.8,6.4/7.2,20.9/17.17
9.4/14.1,5.6/11.4,14.7/20.125.0,8.7,26.919.7,8.4,25.318.2/10.2,6.1/7.6,20.3/15.6
10.0/13.9,5.8/11.0,15.1/19.225.2,8.8,27.218.9,8.3,24.618.1/10.4,6.1/7.3,20.6/15.2
47.4/11.6,4.0/6.9,13.1/16.718.4/12.6,5.9/7.3,20.7/17.518.0/23.8,6.3/7.5,20.4/26.214.1/24.4,6.1/7.9,19.5/26.5
7.3/10.8,4.2/7.3,13.2/16.318.8/11.4,6.0/7.5,20.5/16.618.6/11.0,6.0/6.9,20.3/14.618.1/10.8,5.6/6.8,20.5/15.5
7.2/11.3,4.1/7.2,12.9/15.718.5/10.6,6.3/7.5,20.6/16.118.6/10.8,6.2/7.6,20.9/15.710.7/10.2,5.7/7.2,16.1/15.4
Table 2. Attractors (A, column 2) and metastable states (MS) in simulations in the ( M 1 , M 2 ) -periodicity boxes. Columns 3–6: kinetic, magnetic, heat (top to bottom lines in each cell of the table) initial, minimum, average and maximum energies, respectively, in the saturated regimes (A) or when the trajectory approaches the metastable states (MS). Column 7: time intervals when the trajectory is close to the attractor (the right end is then the time at which the run was terminated) or the metastable state. Column 8 (regime type): C—chaotic; HD—hydrodynamic; MHD—magnetohydrodynamic; Q—quasiperiodic; R1—steady rolls parallel to the x 2 axis; S—steady; S2—steady rolls parallel to the x 2 axis; and TW—travelling wave. Column 9: the symmetry pair for the flow and magnetic field.
RunA/MS E in E min E av E max TimeTypeSymmetries
1x2.1A135.92109.88133.34156.64[75:1016.90]MHD
44.22 × 10 6 8.6420.11
0.04760.03920.04520.05
MS 138.66143.55148.48[85:152],HD r γ L / 2 1 ,
1.54 × 10 5 0.0120.13[655:663],Q r γ L / 2 1
0.04410.04510.0464[805:812]TW
MS 130.80130.87130.93[48:50.5]HD
2.09 × 10 5 1.63 × 10 4 5.57 × 10 4 S
0.04460.04460.0460
1x2.2A100112.36134.09154.22[20:300.08]MHD
250.03507.7619.27
0.010.04130.04510.0493
MS 138.04143.32148.73[24:38],HD r γ L / 2 1 ,
0.06020.210.55[120:128],Q r γ L / 2 1
0.04410.04510.0477[170:190]TW
1x2.3A10034.38133.34158.94[40:1691.82]MHD
4004.42 × 10 74 0.6619.65
0.010.01150.04260.0506
MS 138.84143.56148.48[325:1560]HD r γ L / 2 1 ,
4.60 × 10 71 5.44 × 10 5 1.23 Q r γ L / 2 1
0.04410.04510.0464 TW
MS 34.3882.10143.21[40:293]HD
5.97 × 10 74 4.06 × 10 7 8.07 × 10 5 C
0.01150.02910.0478
2x1.1A135.9297.18137.37150.22[40:341.81]MHD γ L / 2 2 ,
3.760.916.9823.93 C q γ L / 2 2
0.04760.03810.04750.0501
MS 150.14150.19150.22[62.8:63.25]HD
0.961.191.45[182.4:182.7]S2
0.04980.04990.0500[298.8:299.1]R1
2x1.2A10034.03133.89159.26[40:2218.50]MHD
251.61 × 10 73 2.0119.70
0.010.01090.04320.0505
MS 138.85143.56148.48[300:1500],HD r γ L / 2 2 ,
3.99 × 10 70 5.83 × 10 6 1.32[1661:1678],Q r γ L / 2 2
0.04410.04510.464[1723:1740]TW
MS 34.0383.34133.71[40:270],HD
3.14 × 10 73 5.28 × 10 15 1.12 × 10 12 [2000:2218]C
0.01090.02940.0445
2x1.3A133.85133.05158.90[40:3505.05]MHD
4001.71 × 10 158 0.1518.76
0.010.01100.04240.0505
MS 138.85143.56148.48[670:3400]HD r γ L / 2 2 ,
1.66 × 10 154 3.04 × 10 6 1.18 Q r γ L / 2 2
0.04410.04510.0464 TW
MS 33.8582.71153.46[40:633.2]HD
1.83 × 10 158 7.26 × 10 12 5.66 × 10 9 C
0.01100.02920.0504
1x3.1A135.92132.64142.87156.49[25:483.79]HD r γ L / 2 1 ,
41.34 × 10 26 6.34 × 10 5 5.03 × 10 3 Q r γ L / 2 1
0.04760.04350.04530.0476 TW
1x3.2A100132.58142.87156.50[100:558.16]HD r γ L / 2 1 ,
257.25 × 10 26 5.26 × 10 4 0.0512 Q r γ L / 2 1
0.010.04350.04530.0477 TW
1x3.3A1132.64142.87156.46[85:1992.79]HD r γ L / 2 1 ,
4003.78 × 10 103 1.86 × 10 8 6.68 × 10 6 Q r γ L / 2 1
0.010.04350.04530.0476 TW
3x1.1A135.92132.59142.85156.49[1275:1348.48]HD r γ L / 2 2 ,
3.763.06 × 10 6 2.71 × 10 3 0.0432 Q r γ L / 2 2
0.04760.04350.04530.0477 TW
3x1.2A100132.64142.80156.46[560:597.69]HD r γ L / 2 2 ,
255.42 × 10 6 2.25 × 10 4 1.76 × 10 3 Q r γ L / 2 2
0.010.04350.04530.0476 TW
MS 139.71139.73139.85[8:16]HD γ L / 2 2 ,
3.60 × 10 5 1.38 × 10 4 5.35 × 10 4 S2 γ L / 2 2
0.04680.04680.0468
3x1.3A100132.51142.87156.63[160:561.06]HD r γ L / 2 2 ,
4002.54 × 10 22 1.79 × 10 3 0.0991 Q r γ L / 2 2
0.010.04350.04530.0477 TW
MS 139.71139.72139.74[10:15.5]HD
5.84 × 10 5 2.84 × 10 4 1.27 × 10 3 S2
0.04680.04680.0468
1x4.1A135.9256.81123.87183.43[50:202.18]MHD
41.92 × 10 5 1.1514.76 C
0.04760.01800.03590.0487
MS 131.67142.41151.88[115:121],HD
1.92 × 10 4 8.71 × 10 4 3.95 × 10 3 [9:15.5]Q
0.04390.04600.0478
1x4.2A10053.62128.35215.63[50:200.89]MHD
253.88 × 10 4 3.2117.27 C
0.010.01830.03890.05
1x4.3A143.52122.10200.92[50:211.14]MHD
4003.01 × 10 7 0.272.92 C
0.010.01360.03300.0485
4x1.1A135.9249.93128.33203.82[15:381.79]MHD
41.77 × 10 6 2.1516.71 C
0.04760.01680.03910.0487
MS 131.45142.83152.27[223:242]HD
1.92 × 10 4 4.22 × 10 4 8.51 × 10 4 Q
0.04440.04620.0476 TW
4x1.2A10051.86124.30205.75[50:310.23]MHD
253.60 × 10 6 1.6516.04 C
0.010.01720.03580.0499
MS 146.06147.19147.87[246:247.75]HD
7.85 × 10 3 0.07990.30 S2
0.04840.04860.0487
4x1.3A10051.20126.69187.53[25:286.47]MHD
9009.13 × 10 6 2.3315.10 C
0.010.01790.03880.0487
MS 130.19143.60151.34[46:51.5]HD
8.92 × 10 4 1.78 × 10 3 3.03 × 10 3 Q
0.04410.04660.0483
MS 122.37123.00123.76[12.5:15]HD γ L / 2 2 ,
0.470.891.50 S2 γ L / 2 2
0.04190.04190.0419
2x2.1A135.9247.2979.2131.63[40:1001.34]HD
49.49 × 10 244 2.01 × 10 11 6.90 × 10 9 C
0.04760.01600.02670.0393
2x2.2A10048.3478.59118.35[40:331.19]HD
251.77 × 10 75 3.59 × 10 12 4.69 × 10 10 C
0.010.01660.02650.0373
2x2.3A146.4078.83135.50[40:409.44]HD
12254.30 × 10 96 1.18 × 10 11 1.98 × 10 9 C
0.010.01710.02650.0399
2x3.1A135.9255.5577.88135.61[40:204.50]HD
41.06 × 10 35 3.82 × 10 8 1.60 × 10 6 C
0.04760.01760.02580.0358
2x3.2A10053.3780.47159.21[40:540.45]HD
258.70 × 10 109 1.47 × 10 11 7.92 × 10 9 C
0.010.01770.02630.0413
2x3.3A147.4079.94149.96[40:417.59]HD
4008.98 × 10 76 1.51 × 10 11 2.21 × 10 9 C
0.010.01610.02630.04
3x2.1A135.9255.4780.48136.12[40:318.22]HD
41.56 × 10 48 4.52 × 10 9 1.16 × 10 6 C
0.04760.01740.02640.0395
3x2.2A10053.7880.50149.84[40:364.87]HD
251.79 × 10 66 1.12 × 10 9 2.41 × 10 7 C
0.010.01880.02630.0394
3x2.3A10054.7778.96146.56[40:363.77]HD
4001.61 × 10 65 1.10 × 10 7 2.59 × 10 5 C
0.010.01830.02610.0382
2x4.1A135.9256.3583.93165.97[40:244.38]HD
41.25 × 10 27 1.77 × 10 6 2.77 × 10 4 C
0.04760.01710.02630.0382
2x4.2A10054.3382.05159.80[40:381.79]HD
251.94 × 10 60 9.28 × 10 7 1.62 × 10 4 C
0.010.01960.02620.0375
2x4.3A10057.5480.22152.08[40:326.87]HD
4006.23 × 10 49 1.55 × 10 7 1.46 × 10 5 C
0.010.01880.02590.0348
4x2.1A135.9256.5479.66153.39[40:290.67]HD
46.00 × 10 36 1.60 × 10 5 8.01 × 10 4 C
0.04760.01940.02610.0355
4x2.2A22555.3180.67146.53[40:366.17]HD
251.49 × 10 51 7.81 × 10 6 1.50 × 10 3 C
0.010.01940.02600.0349
4x2.3A152.7181.42164.80[40:391.69]HD
1001.88 × 10 58 6.09 × 10 7 7.67 × 10 5 C
0.010.01610.02600.0379
3x3.1A135.9259.3480.38133.18[40:201.10]HD
44.48 × 10 27 6.42 × 10 7 5.76 × 10 5 C
0.04760.01950.02620.0354
3x3.2A10055.0479.20108.71[40:321.50]HD
259.71 × 10 49 4.57 × 10 6 4.75 × 10 4 C
0.010.01860.02590.0327
3x3.3A10056.1278.41106.72[40:312.34]HD
4003.92 × 10 40 2.25 × 10 5 2.38 × 10 3 C
0.010.01820.02590.0334
3x4.1A135.9260.1878.74120.72[40:200.17]HD
46.08 × 10 30 3.19 × 10 6 3.62 × 10 4 C
0.04760.01970.02560.0319
3x4.2A22563.7579.86121.48[40:295.39]HD
1001.11 × 10 40 1.20 × 10 6 8.99 × 10 5 C
0.010.02030.02590.0323
3x4.3A162.1879.26117.60[40:285.44]HD
9005.22 × 10 38 7.20 × 10 6 5.29 × 10 4 C
0.010.02060.02580.0327
4x3.1A135.9260.7579.99112.65[40:200.01]HD
46.26 × 10 25 1.07 × 10 5 5.83 × 10 4 C
0.04760.01900.02590.0338
4x3.2A22559.8179.15110.28[40:337.28]HD
1002.34 × 10 44 7.68 × 10 6 5.46 × 10 4 C
0.010.02020.02580.0321
4x3.3A10053.7878.80109.92[40:296.86]HD
4001.44 × 10 33 6.20 × 10 7 5.71 × 10 5 C
0.010.01830.02570.0324
4x4.1A135.9265.5579.53106.56[40:200.51]HD
45.33 × 10 23 1.03 × 10 6 7.88 × 10 5 C
0.04760.02120.02570.0313
4x4.2A22561.6579.41105.68[40:528.55]HD
1008.18 × 10 54 3.14 × 10 6 5.88 × 10 4 C
0.010.02010.02580.0333
4x4.3A10062.5180.20113.30[40:342.84]HD
4001.16 × 10 38 2.58 × 10 5 2.61 × 10 3 C
0.010.02100.02590.0319
Table 3. Magnetic Reynolds number estimates in the runs for M i 4 (in the order of increasing Rm 4 ). Column G: “M” indicates that magnetic field generation is sustained in the perturbed regime; Interval: the time interval, over which the magnetic Reynolds number estimates are computed; n : estimates (7) of the internal spatial scale of the perturbed regime; Rm n : the magnetic Reynolds number estimate based on n ; | v | : the characteristic flow velocity in the time interval under consideration.
RunGInterval 1 Rm 1 2 Rm 2 3 Rm 3 4 Rm 4 | v |
4x4.2 51–528.550.22322.4130.22322.4160.20620.7220.20620.72012.58
4x2.1 232.40–290.650.21921.7690.21921.7700.24123.9880.24123.98312.43
3x3.3 220.46–312.340.22021.8430.22021.8420.24124.0110.24124.00412.43
2x2.3 310.15–409.440.21921.8790.22021.8850.24224.1150.24224.10312.46
2x3.1 100–204.500.21921.9200.21921.9230.24124.1130.24124.10812.50
4x3.3 223.17–296.860.22122.0500.22122.0470.24224.1760.24224.16712.48
2x3.2 505.52–540.450.22022.0920.22022.1010.24224.2800.24224.27812.53
3x2.3 251.39–363.770.22122.1830.22122.1900.24324.3650.24224.35812.55
3x4.1 42.18–200.170.22222.2730.22222.2770.24324.3770.24324.36912.55
3x4.3 219.42–295.390.22122.2810.22122.2830.24324.4000.24224.39312.57
4x3.2 290.74–337.380.22222.3370.22222.3320.24324.4140.24324.40612.56
4x4.3 201–3360.22322.3850.22322.3850.24324.4390.24324.43612.56
4x3.1 42–200.020.22322.3960.22322.3970.24324.4810.24324.48012.57
3x4.2 246.87–285.440.22322.4540.22322.4460.24324.4970.24324.48612.57
3x3.2 278.28–3210.22422.4670.22322.4590.24424.5330.24424.51812.56
2x3.3 309.16–417.590.22122.3820.22122.4150.24324.5540.24324.56012.65
3x3.1 42.91–201.100.22222.4680.22222.4730.24324.5740.24324.56812.62
2x2.2 200–331.190.22122.3330.22122.3560.24524.6980.24424.68012.62
4x4.1 100–200.510.22322.6190.22422.6230.24424.6890.24424.68512.65
2x2.1 719.70–800.700.22122.4840.22122.5020.24324.7880.24324.77912.73
2x4.2 317.09–3810.22322.7410.22422.7840.24324.7950.24324.81012.73
2x4.3 223.93–3260.22422.8060.22422.8160.24424.8500.24424.84612.72
3x2.1 231.77–3180.22322.7230.22322.7280.24424.8630.24424.85712.72
4x2.3 268.69–366.170.22422.8550.22422.8600.24424.9020.24424.89512.73
2x4.1 102–207.690.22522.9590.22622.9730.24524.9540.24524.96112.73
3x2.2 304.32–3640.22322.9780.22423.0220.24425.0930.24425.10412.86
4x2.2 334.41–391.690.22523.1060.22623.1350.24525.1060.24525.11312.81
3x1.1 100–249.390.22727.3790.22727.2790.24729.7610.24629.60815.04
2x1.2M1946.90–1980.900.22726.6380.22826.8150.25429.8680.25529.94914.68
3x1.2 285.85–377.670.22728.4230.22628.3420.24530.6750.24430.53715.65
1x4.3M130–211.140.24229.7260.24329.7860.25431.2350.25431.16315.34
4x1.3M108.81–241.990.23329.7970.23329.7270.24831.7010.24731.58915.96
4x1.2M200–310.230.23830.2580.23830.1700.25332.1070.25231.98615.85
4x1.1M168–3300.23829.8140.23829.7700.25632.0600.25632.01515.65
1x4.1M140–1920.24230.9690.24130.8940.25232.3000.25132.16516.00
1x4.2M120–2000.23731.1400.23631.0980.25934.0470.25733.88816.45
1x2.1M185–2450.23830.3390.23830.3330.26734.0180.26734.00315.92
1x2.3M1606–16910.23830.5340.23830.5260.26734.2060.26734.18116.01
2x1.3M3460–3505.050.23930.7940.23830.7870.26634.4070.26634.38316.13
1x2.2M50–3000.23931.1930.23931.1880.26634.7150.26634.68416.32
2x1.1M152–277.810.24833.0000.24832.9870.26134.7770.26134.73916.64
1x3.3 50–354.350.23431.5660.23431.5680.26335.4990.26335.48316.87
1x3.1 25–487.120.23431.6680.23431.6590.26335.5890.26335.56616.90
1x3.2 83–558.160.23431.6690.23431.6600.26335.5900.26335.56716.90
3x1.3 330.20–365.600.23431.6760.23431.6670.26335.5970.26335.57416.90
Table 4. Magnetic Reynolds number estimates in various phases of the runs in the double-period periodicity cells. Interval: the time interval, for which the magnetic Reynolds number estimates are computed; n : estimates (7) of the internal spatial scale of the perturbed regime; Rm n : the magnetic Reynolds number estimate based on n ; | v | : the characteristic flow velocity in the time interval under consideration.
RunPhaseInterval 1 Rm 1 2 Rm 2 3 Rm 3 4 Rm 4 | v |
1x2.1T10–650.21522.6900.21422.6150.24926.3250.24926.26513.20
G75–1700.24032.5660.24032.5530.26335.6530.26335.63816.93
S185–2500.23830.4250.23830.4180.26734.0990.26734.08315.96
1x2.2T0–13.80.22024.2050.22024.1720.24526.9280.24426.76513.72
G20–400.24032.5570.24032.5430.26335.6650.26335.64816.93
S50–1150.23830.4390.23830.4320.26734.1650.26734.15115.98
1x2.3D10–2930.21422.3670.21422.3500.24625.6990.24625.62713.03
G300–15970.24032.5840.24032.5710.26335.6670.26335.65316.94
S1606–1691.820.23830.5340.23830.5260.26734.2060.26734.18116.01
2x1.1T0–80.24432.1500.24432.1510.26034.3630.26034.36216.50
S12–277.810.24833.0100.24832.9930.26134.7890.26134.73716.65
2x1.2D40–2700.21622.5330.21422.3740.24625.7430.24525.58513.06
G285–15550.24132.6580.24032.6210.26335.7270.26335.69916.95
S1570–19620.23931.2540.23931.1700.26634.8140.26634.74316.33
2x1.3D40–633.20.21522.2650.21422.1610.24625.5590.24525.44812.97
G646–34450.24032.6110.24032.5790.26335.6860.26335.66216.95
S3460–3505.050.23930.7940.23830.7870.26634.4070.26634.38316.13
Publisher’s Note: MDPI stays neutral with regard to jurisdictional claims in published maps and institutional affiliations.