Abstract
Online transactions, medical services, financial transactions, and banking all have their share of fraudulent activity. The annual revenue generated by fraud exceeds $1 trillion. Even while fraud is dangerous for organizations, it may be uncovered with the help of intelligent solutions such as rules engines and machine learning. In this research, we introduce a unique hybrid technique for identifying financial payment fraud by combining nature-inspired-based Hyperparameter tuning with several supervised classifier models, as implemented in a modified version of the XGBoost Algorithm. At the outset, we split out a sample of the full financial payment dataset to use as a test set. We use 70% of the data for training and 30% for testing. Records that are known to be illegitimate or fraudulent are predicted, while those that raise suspicion are further investigated using a number of machine learning algorithms. The models are trained and validated using the 10-fold cross-validation technique. Several tests using a dataset of actual financial transactions are used to demonstrate the effectiveness of the proposed approach.
Keywords:
financial payment fraud; fraud detection; machine learning; XGBoost; nature-inspired optimization; hyper-parameter tuning; accuracy MSC:
0001
1. Introduction
In today’s era, most payments are done digitally. The most common form of transaction has become online payments. As per a survey by Experian, more than 90% of users around the world deploy online payments for purchasing goods and services. With the rapid hike in online payments, transaction frauds have also increased.
When any unauthorized person makes any unauthorized transaction by stealing a person’s personal information it is called Payment fraud. The owner of the card gets notified of the unauthorized transaction being, and then raises a dispute [1,2,3,4,5]. The dispute is required to be settled and other concerns arise like numerous penalties such as chargeback fees and investigation fees, resulting in an overall loss of time and resources. Another scenario under payment fraud occurs when the client himself can falsely initiate a chargeback, denying ever having received the product. The worst case may occur if this transaction involved bank accounts. The owner account might have to be seized when problematic payment fraud occurs in business [6].
1.1. Types of Payment Frauds
Some of the most common ways payment fraud occurs are mentioned below. While it is not possible to eliminate these attacks, they can mitigate their risk of impacting the business by taking the right steps.
- (1)
- Identity Theft: this type of fraud occurs when fraudsters steal personal and banking information and use the owner’s identity to make false purchases and transactions. No new identity is created.
- (2)
- Friendly Fraud: Another prevalent type of payment fraud occurs after the delivery of service, the customer initiates a false chargeback and denies receiving it. In addition to becoming aware of the service, the amount is refunded back to the customer.
- (3)
- Clean Fraud: It is the hardest to detect fraud. Fraudsters very carefully analyze business fraud-detection systems and make use of stolen valid payment information.
Payment fraud can distress both the organization and their clients. By combative protection of the ecommerce stores against fraud, the organizations can upgrade their own reputation [7,8,9,10].
1.2. Background
VynZ forecasts that the market for fraud prevention and detection goods will grow to $85.3 billion by 2025. Some businesses have turned to machine learning for fraud detection as a means of combating the problem. Machine Learning is a subfield of AI, in which algorithms are taught to improve and understand new information automatically. These models may then be applied to new data to generate predictions or act. For fraud detection, machine learning analyzes past transactions and future behaviors of the consumer [11]. It can do these kinds of investigations far more quickly and effectively than any person could. Therefore, it is able to detect abnormal behavior with relative ease. This opens up fresh options for gaining instantaneous consumer consent prior to finalizing any transaction. Because human error in recording or analyzing data is removed from the equation, machine learning also reduces the possibility of mistakes and delivers the benefit of higher accuracy. The ability of machine learning models to analyze large datasets allows for improved prediction. An improved model can be made possible with more data. In addition, machine learning is a cheap method of detection for businesses. Data analysis takes place in milliseconds, so team members are not overburdened with manual reviews and checks with each new data acquisition [12].
It is clear from the preceding that ML may be applied to several types of financial fraud. Machine learning has been shown to be remarkably useful in detecting financial fraud in the banking and finance sector. As a result, machine learning algorithms are now well-suited to the large amounts of transactional and customer data collected by banks and other financial organizations. Thanks to the improved accuracy provided by machine learning algorithms, financial institutions see a marked reduction in both false positives (transactions incorrectly labeled as denied and fraudulent) and false negatives (where authentic instances of fraud are mislaid). For this reason, ML has spread rapidly throughout the banking and capital markets [13,14,15].
Moreover, the following are the advantages that machine learning offers financial services companies in the area of fraud detection:
- Rapid data collection: As data volumes continue to grow at a rapid pace, it is becoming increasingly vital to implement efficient, time-saving measures such as machine learning to identify fraudulent activity. As a result of their efficient design, machine learning algorithms are capable of quickly assessing massive datasets. The capacity to gather and analyze data in real-time allows them to quickly identify fraudulent activity [16].
- Easy scaling: With more data available, ML models and algorithms have improved in effectiveness. In order for the ML model to better identify similarities and differences between various actions, more data is required for machine learning to progress. Once both legitimate and fraudulent transactions have been identified, the system may begin filtering them out [17].
- Improved efficiency: Machines have several advantages over humans, including the ability to perform menial chores and spot patterns in vast data sets, both of which are difficult for people to do. The ability to detect fraud in a shorter length of time is greatly enhanced by this. It is possible for algorithms to examine hundreds of thousands of transactions per second with high accuracy. This makes the process more efficient by cutting down on the time and money needed to review transactions.
- Decrease in the number of security breach cases: Financial institutions can combat fraud and provide the greatest degree of protection for their consumers with the help of machine learning technologies. To do this, it compares each fresh transaction (including personal information, data, IP address, location, etc.) to the prior ones. Banking institutions are, therefore, protected against payment and credit card fraud [18].
1.3. Motivation
While the proper implementation of machine learning has the potential to save customers and organizations considerable time and money, there are still certain difficulties to overcome during the implementation phase. The input data is the most important part of a successful machine learning model. The data, both current and historical, must be easily accessible. It may be challenging to find a workable data format for modeling if information about transactions, customers, and purchases is scattered among several data sources. Business-level choices also raise serious concerns. In order for some machine learning algorithms to generate predictions about new data, it is necessary to label previous examples as fraudulent or non-fraudulent. Labeling transactions as fraudulent requires either the set of business rules or real client feedback. When the machine learning model is trained and ready for deployment, decisions must be made concerning the predictions to be executed in real-world circumstances. Having conversations with experts and company heads to map out a clear course for operations is the best way to overcome such obstacles [19].
Machine learning is a useful tool for identifying irregularities in regular business activities. In comparison to older companies’ use of a human review and rule-based processes, they are far superior. While it has many positive aspects, it also has certain drawbacks.
- Inspectability Issues: Data filtering, processing, and interpretation of risk scores all need methods to function optimally. Despite rule-based methods serving as a yardstick, certain machine learning-based systems may suffer from a lack of observability.
- Cold Start: Insufficient information might lead to inaccurate or irrelevant fraud evaluations by the robots. There needs to be enough information to establish credible ties. Large corporations do not have this problem, but smaller ones need enough data points to establish causality. In this way, it is beneficial to apply a simple set of rules initially and then give the machine learning models time to “warm up” with more information.
- Blind to Data Connections: Models of machine learning focus on doing things, or behavior and action. At first, when the dataset is relatively tiny, they are blind to patterns in the information. To combat it, graph networks are deployed. Using graph databases, we can prevent fraudulent activity from questionable and fake accounts even before they have had a chance to do any damage.
In view of the above security problems, the authors raised the following question: “Can we design a new secure mechanism to predict such financial payment frauds that helps the organization to maintain the customer trust and longtime relationship”? [20].
The innovative points of this study are as follows. (1) A modified XGBoost is proposed to predict payment fraud correctly. (2) The nature-inspired optimization is used to tune the hyperparameters of XGBoost models for a better prediction of these payment frauds. (3) The results of the case study show that the proposed algorithm outperforms other machine learning algorithms and the proposed model has good applicability in terms of Recall, precision, and F-Score. The proposed algorithm proposed in this paper provides a new idea for handling financial payment transactions in the future, and also verifies the feasibility of the ensemble learning method for this financial sector.
2. Related Work
This section presents a review of recent literature on fraud prediction in financial payment services. Several methods are reported in the literature to address this issue. This work has been carried out for the sake of the accuracy achieved by the existing methods of fraud prediction.
Using data on 200 businesses listed on the Taiwan Stock Exchange Corporation (TSEC), Chen et al. [21] evaluated the predictive power of classic statistical approaches with that of more “unconventional” methods such decision tree classification, neural networks, and evolutionary computing. The authors used PCA to identify relevant variables from empirical tests including a total of 42 ratios (33 financial, eight non-financial, and one integrated macroeconomic index). The paper demonstrated that traditional statistical methods are better able to handle large datasets.
Under big data, Chen et al. [22] established Alibaba’s Fraud Risk Management. Through the use of real-time big data processing and sophisticated risk models, Alibaba developed a method to monitor and mitigate fraud. Direct fraud signs were extracted from a massive trove of user behavior and network data, processed in real-time with machine learning, and used to reliably forecast fraudulent users and transactions. The author also developed a big data-based fraud protection solution called AntBuckler to provide fraud risk prevention capability to external clients. AntBuckler’s goal is to provide online retailers and financial institutions with the intelligence and adaptability they need to recognize and stop all forms of fraudulent conduct. Using the RAIN score engine, AntBuckler was able to estimate the risk levels of users or transactions for fraud prevention by merging enormous amounts of data from Alibaba and consumers. Risk ratings, most common causes, and links to instances of fraud were all shown in an intuitive visual user interface.
When it comes to identifying mobile communication fraud, deep learning approaches were utilized by Chouiekh et al. [23] with great success. For this study, the authors used customer detail records (CDR) from a genuine mobile communication provider to generate a fraud dataset, from which the authors extracted learning characteristics and categorized CDR occurrences as fraudulent or not. To test how well our suggested model works, the authors conducted a variety of tests. When compared to three other common machine learning methods (Support vector machines, Random Forest, and Gradient Boosting Classifier), the deep convolution neural networks (DCNN) method was superior in both accuracy (82%) and time spent in training. With this strategy in place, the authors can cut down on the expenses caused by unpaid service consumption.
By combining Genetic Algorithm (GA)-based Fuzzy C-Means (FCM) clustering with a number of supervised classifier models, Subudhi et al. [24] introduced a unique hybrid technique to identify fraud in vehicle insurance claims. To begin, the authors take a subset of the full insurance dataset and use it as a test bed. Once some useful clusters have been generated, the remaining train set is under-sampled using the clustering method. Once the test instances were clustered, they were separated into legitimate, malicious, and suspect categories. They were used for the remaining questionable instances after the original authentic and fraudulent data had been eliminated. The models were trained and validated using the 10-fold cross-validation technique. Several tests were carried out using a real-world automotive insurance dataset to demonstrate the effectiveness of the suggested approach.
Graph-based approaches and neural network models have recently emerged as effective tools for combating financial cybercrime, as mentioned by Nicholls et al. [25]. Previously, rule-based systems and shallow anomaly detection methods have been utilized for this purpose. Despite their widespread use, there was still an absence of a comprehensive knowledge of the financial cybercrime ecosystem, pertinent methodologies, and their limitations as well as newly developing open challenges in this field. The purpose of this survey was to fill this knowledge vacuum by examining four dimensions of the cybercrime ecosystem in the banking sector.
To address this issue, Thejas et al. [26] presented the CFXGB model (Cascaded Forest and XGBoost). Classified as supervised machine learning, the suggested methodology included two separate learning models for feature transformation and classification. Using different click fraud datasets of varying sizes, they demonstrated their improved performance compared to other similar models.
Using machine learning approaches, Domashova et al. [27] demonstrated how successful they were in identifying fraudulent financial transactions. There was a look at the market for various technologies. The antifraud systems were analyzed using the suggested analysis process, which was based on the selection of the best machine learning model. The statistical platform SAS Viya on the cloud was used to implement the proposed fraud detection approach.
As a means of synthesizing the research on the use of GBAD techniques in fraud detection published between 2007 and 2018, Pourhabibi et al. [28] created a framework. The created solution did not rely on any external services and instead made use of a novel collection of features used for the first time to this challenge, some of which were taken from the web technologies employed on each page.
An all-encompassing approach was presented by Rocha-Salazar et al. [29] to aid in the detection of suspicious transactions associated with money laundering (ML) and terrorist financing (FT) in financial systems through enhanced self-comparisons and group comparisons by consumers. When compared to the rule-based system, the suggested model improved accuracy while simultaneously decreasing the number of false positives.
To improve fraud-detection systems, Chen et al. [30] suggested a unique hierarchical multi-task learning technique. To make fraud identification easier, the authors first devised a hierarchical fraud category system to categorize the various forms of client deception. Second, because of the complex interconnections between the applicants’ data, the representation learning problem may be solved by a heterogeneous network equipped. The first layer is used to anticipate broad classes of fraud while the second layer is used to predict individual subtasks. To prove the efficacy of the suggested method, the authors finally ran comprehensive tests using a real-world dataset.
Codes were used in a categorization framework developed by Pinto et al. [31] to help organize the primary methods and body of knowledge in this area and to help spot areas where further study is warranted. The statistical results also revealed a few research gaps, the most important of which are a standardized database, experiments with data of varying dimensionality, and performance indicators for detection algorithms. Therefore, the suggested paradigm proved useful for making sense of the current scientific literature, and it highlights key holes in the research agenda concerning financial system anomalies.
To prevent the NHIS’s finances from collapsing, Muheidat et al. [32] developed and deployed a Blockchain-based solution. In the research, the system’s behavior was verified. The quality of the information provided to users was shown to have a substantial impact on their level of satisfaction. However, it was found that the quality of the system had a nearly considerable effect on how well the suggested system worked and how satisfied its users were with it.
For detecting phishing websites in practice, Sánchez-Paniagua et al. [33] provided a system that makes use of URL, HTML, and web technology characteristics. The authors created the Phishing Index Login Websites Dataset (PILWD), an offline phishing dataset consisting of 134,000 validated samples, so that academics could use it to test and evaluate different methods using real-world data. Since around 75% of all phishing samples obtained to ask for credential entry, they decided to scan real login sites to make them seem like phishing ones. When tested on the PILWD dataset, experimental findings indicated that a LightGBM classifier employing all 54 characteristics selected could accurately detect phishing websites with 97.95% precision.
To better understand the attackers’ methods and the extent of the damage they may do, Li et al. [34] mapped out the history of cyberattacks with a COVID-19 theme that were launched throughout the world. It also included a collection of well-researched countermeasures that may be used to stop assaults before they ever start. The authors of this publication also presented a data mining and fuzzy logic-based intelligence system to identify phishing and fraudulent URL campaigns with a COVID-19 theme. The effectiveness of the system had been measured against several known phishing and malicious URLs, and the results indicated that the suggested approach was an effective means of addressing the issue.
To combat healthcare fraud, particularly in the claims processing sector, machine learning methods and Blockchain technology were recommended by Amponsah et al. [35]. The original claims dataset is then categorized using a decision tree classification technique. The gleaned information is put into an Ethereum Blockchain smart contract. The trial findings suggest that the best tool obtains a sensitivity of 98.09% and an accuracy of 97.96% when it comes to categorization. This indicated that the suggested solution improved the accuracy to 97.96% with which Blockchain smart contracts can identify fraud.
The Automated Clearing Settlement System is Canada’s retail batch clearing payments system, and Sabetti et al. [36] used an autoencoder (AE) built from a deep neural network to spot irregularities in ACS transactions (ACSS). They intended to evaluate an AE’s capacity for identifying complicated changes in the liquidity out-flows amongst participants, which might give an early warning indicator for particularly significant outflows for a participant. The trained AE fared well in both circumstances, with larger-than-average reconstruction mistakes. Their research brought to light the value of a certain category of unsupervised machine learning techniques for enhancing a system operator’s risk management arsenal.
Using real-world data from a major Brazilian insurance business, Severino et al. [37] compared several machine learning models for fraud prediction in property insurance claims. Comparing the average prediction performance while accounting for false positives and false negatives, the author evaluated the models recursively. Compared to other classifiers, such as the standard logistic regression, the findings indicated that ensemble-based approaches and deep neural networks produced the greatest results. The results of the research may be used by risk analysts and other professionals to better understand the advantages and disadvantages of various models and to create more reliable decision rules for determining the value of insurance policies in the future.
Table 1 highlights various works carried out in this problem domain.

Table 1.
Related Work summary.
In conclusion, machine learning has great potential as a means of identifying and avoiding fraudulent activities. It may aid companies in offering a safer environment for their clients, and clients in remaining open to the financial sector’s technological advancements as a result. Implementing fraud detection with machine learning may be easy and efficient with well-designed data models and consistent business rules.
3. Material and Methods
3.1. Dataset
This work detects fraudulent transactions from the Banksim dataset. This synthetically generated dataset consists of payments from various customers made in different time periods and with different amounts. The summary of the columns is in Table 2 as shown below.
Table 2.
(a) Dataset Attribute Details–Numeric Columns. (b) Dataset Attribute Details—Boolean Columns. (c) Dataset Attribute Details—Categorical Columns.
In Table 2a, there are two numeric columns, i.e., step and amount. The step column defines rounds taken for collecting the data from banking customers. It has taken total 179 steps for collecting the data in this prescribed dataset. The amount column defines the amount deduced in fraud payment.
In Table 2b, there is a single Boolean column, i.e., fraud. The fraud column defines the status of the financial transaction whether it is normal or fraudulent.
In Table 2c, there are 7 Categorical columns in the dataset. The customer column consists of the customer id for the financial transaction. The age column represents the age of the customers. The gender column represents the gender of the customers among four categories. The zipcodeOri column represents the zip code of the customers’ location in this prescribed dataset. The zipMerchant column defines the zip code of the merchants’ location. The category column classifies the type of the transaction, i.e., health, food, transportation, tech, home and home services, etc.
3.1.1. Data Preprocessing
In data preprocessing, messy raw data is transformed into clean, readable language. In computing, preprocessing is the procedure of altering data before it is fed into an algorithm. It is merely transforming raw data into an understandable format. It is strongly recommended to understand the Data Description so that the author can explore the definitions and contents of all the variables before working on the ML Algorithm. It is confirmed that the quality of input decides the quality of the output. Therefore, to avoid misleading results, data has to screen before giving as input to the ML algorithm. In the real world, the data contains noise, missing values, and inconsistent data due to the large size and also, data is gathered from data sets which are present in multiple forms and origin from multiple sources. The output from the preprocessing is the final data set. The methods for data preprocessing are organized into different categories [38]. This phase consists of two main activities, i.e., handling missing values and outlier detection. These activities are discussed in Sections “Handling Missing Values” and “Detecting Outliers”. There are no missing values observed in Section “Handling Missing Values” and the Z-score Normalization method is being applied in the outlier detection in Section “Detecting Outliers”.
Handling Missing Values
To “clean” the data, data cleaning procedures are used to address issues including missing numbers, noisy data, detecting and eliminating outliers, and resolving discrepancies. Users are less likely to have faith in data mining outcomes if they think the data is tainted. In addition, sloppy inputs might confuse the mining process, leading to incorrect results. Although most mining techniques include mechanisms for handling missing or noisy data, these safeguards are flimsy. However, they may shift their focus to ensure that the data does not become overfit to the modeled function. In the prescribed dataset, there are no missing values [39,40].
Detecting Outliers
Outliers may be identified as values that deviate from the norm for an attribute by more than two standard deviations. Numerosity reduction methods find more compact representations of data to replace the original, uncompressed set. Both parametric and nonparametric methods may be used [40]. Since the data is estimated using a model in parametric approaches, only the model parameters, rather than the actual data, need to be kept (exceptions may be saved, too). Histograms, cluster analysis, sampling, and data cube aggregation are all nonparametric techniques for storing simplified representations of the data. The Z-score Normalization method has been applied for this purpose [41].
3.2. Methods
XGBoost
XGBoost is an Extreme Gradient Boosting algorithm used for optimizing the training of Gradient boosted trees algorithm. It is highly flexible, efficient, and portable and supervised in nature. It can be used for regression and classification on large data sets. It has the benefit of the inbuilt capability of handling missing values [42]. It uses advanced regularization (L1 and L2) which improves model generalization problems. It has proved better results on four parameters such as accuracy, sensitivity, specificity, and precision.
In layman’s language, to apply the XGBoost Algorithm 1, the following steps are taken.
| Algorithm 1. XGBoost Algorithm | ||
| Step 1 | Initialize: Make an initial prediction and calculate residuals where residuals = Observed values–predicted values. | |
| Step 2 | Construct XBoost tree Build an XGBoost tree with similarity score of leaf | |
| leafs = (sum_of_residual)2/(number of residuals+ regularization parameter) | (1) | |
| Step 3 | Prune the tree. | |
| Step 4 | Calculate the output value as given below: | |
| Output value = (sum_of_residual)/(number_of_residuals + regularization parameter) | (2) | |
| Step 5 | Make new predictions. | |
| Step 6 | Calculate residuals using new predictions. | |
| Step 7 | Repeat steps 2–6. | |
Based on the value of Gain, the tree is split which is based on the similarity scores. Regularization parameter reduces the prediction sensitivity to individual observations and prevents overfitting of data.
3.3. Proposed Nature-Inspired-Based Hyperparameter Optimization in XGBoost
The performance of machine learning models is very sensitive to the hyperparameters that are used to regulate the learning process. The criteria, maximum depth, and a number of estimators are all hyperparameters in the XGBoostmodel. These settings have a direct bearing on the ease with which a model may be trained. The goal of hyperparameter optimization is to discover the optimal set of hyperparameter values that will yield optimal performance on the data within a practical time frame. This step is crucial to a machine learning algorithm’s ability to make accurate predictions. Therefore, optimizing hyperparameters is the most challenging aspect of constructing ML models [43,44,45,46,47,48,49,50]. Typically, the hyperparameters of these machine learning algorithms are preset [51].
As part of any optimization process, the search space must be specified. This may be seen geometrically as an n-dimensional volume, with each hyperparameter standing in for a distinct dimension and the scale of that dimension being the range of possible values that the hyperparameter can take on (real, integer, or categorical) [52]. The hyperparameters and model configurations are represented as points in a search volume called the search space. For each possible combination of hyperparameters, the search space may be represented as a vector with a single value. The optimization process seeks a vector that yields the optimal post-learning performance of the model, in terms of some metric like accuracy or error. It is possible to apply many different optimization algorithms, but random search and grid search are two of the simplest and most widely employed ones. It is a complete, random search. Sample points at random from a search space defined as a bounded domain of hyperparameter values. The process of searching a grid creates a grid of hyperparameter values to use as a search space, and then checks each cell [53]. Grid search is useful for quickly double-checking combinations with a track record of success. Although random searches generally take longer to complete, they are useful for discovering and obtaining hyperparameter combinations that one would not expect intuitively. Bayesian Optimization and Evolutionary Optimization are two examples of these more sophisticated methodologies that are employed sometimes [53].
Harmony search (HS) used in Algorithm 2 is a population-based metaheuristic algorithm inspired by the musical process for searching of a perfect state of harmony proposed by Geem et al., in 2001. The Harmony search algorithm involves subsequent steps (HSA):
- Step 1.
- Parameter Initialization: (a) Initialize harmony memory size (HMS), Harmony Memory Considering Rate (HMCR), Pitch Adjusting Rate (PAR), Stopping criteria
- Step 2.
- Initialize Harmony Memory (HM)
- Step 3.
- Improvise New Harmony.
- Step 4.
- Check if New Harmony is better than the worst harmony in HM.
- Step 5.
- Repeat steps 2–3 until termination criteria is reached.
The following steps of performing the hyperparameter optimization as given below.
| Algorithm 2. Modified XGBoost Algorithm | |
| Step 1 | Separating Dataset into Target and Independent Features: First it will now separate the target feature from the other features in the dataset. Our focus is on the target feature. |
| Step 2 | Optimized Space of Parameters: In this work, the authors select various parameters of XGBoost’s num class, alpha, base_score, booster and eta hyperparameters. |
| Step 3 | Figuring out What to Minimize (Objective Function): Hyperparamter tuning is the name of the function whose value the authors wish to reduce. |
| Step 4 | Harmony Search (HS) Optimization is being applied to optimize the hyperparameters of the classification algorithm. |
| Step 5 | Execute Algorithm 1 with new optimized hyperparameters values |
To prevent overfitting, the authors employ cross-validation, and the resulting function returns a loss value and an indication of whether the loss was achieved in algorithm 2.
The various steps to be performed are:
- Select a high pace of learning. In most cases, a learning rate of 0.1 is appropriate, while rates between 0.05 and 0.3 should be effective as well. Figure out how many trees need be used to achieve this level of learning. A great feature of XGBoost is the “cv” function, which uses cross-validation to determine the optimal tree size for each boosting iteration [51].
- Customize the number of trees to be used and the learning rate by adjusting the tree-specific parameters (max depth, min child weight, gamma, subsample, colsamplebytree).
- Adjusting XGBoost’s regularization settings (lambda, alpha) can cut down on model complexity and improve performance.
- Slow down the learning pace and pick the best settings.
4. Result and Discussion
4.1. Experiment Settings
The dataset taken for this research work has been split out to 70–30% ratio. The 70% of the dataset entries are being considered for training purposes and the remaining entries are used for testing purposes. The defined parameters represent the high-level parameters. The parameters such as Accuracy, Time, and Interpretability settings map to the following internal configuration of this work. In this study, the authors employ k-Fold Cross-Validation, a technique that divides a dataset into k (the number of folds) equal halves for training and testing, with the exception of the first (k−1) fold. For optimized results, the authors finalized the value of k as 10. Ten-fold cross-validation has been performed the fitting procedure a total of ten times, with each fit being performed on a training set consisting of 90% of the total training set selected at random, with the remaining 10% used as a holdout set for validation. In this approach, the authors cycle through k repetitions, each time setting aside a different percentage of the data for use in experiments. An advantage of using this method is that the authors make use of all data points and hence it is a low bias. The following Shapley summary plot is created from a random sample of 10,000 rows (the autodoc_pd_max_rows configuration controls random sampling for this plot) in Figure 1 which depicts the feature importance in form of a Shapley summary as given below.
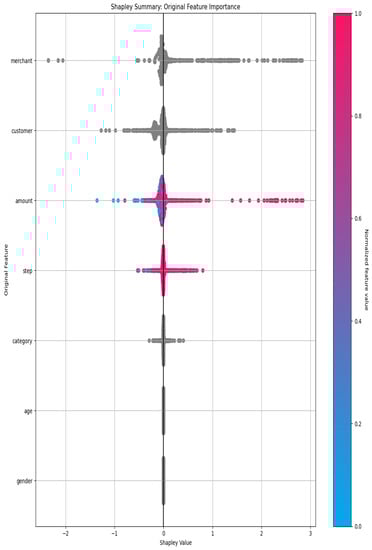
Figure 1.
Feature Importance.
4.2. Performance Evalutaion
The performance of the proposed model has been evaluated in terms of various Scorers shown in Table 3. The desired value of the score is better than is demonstrated in the second column of Table 3 as shown below.
Table 3.
Performance of Proposed Model.
4.3. Validation Confusion Matrix
Counts of test records properly predicted and wrongly predicted are used to evaluate a classification model’s performance. Confusion matrices reveal not only how well a predictive model performs, but also which classes are being properly and mistakenly forecasted, as well as the nature of the errors that have been produced. For instance, the confusion matrix Table 4 shows us how the four-categorization metrics (TP, FP, FN, TN) are computed and how our projected value compares to the actual value. Table 4 showed the confusion matrix of our proposed model as shown below:
Table 4.
Confusion Matrix.
In our model the values of these files are given below:
- TP = 586,597;
- FP = 846;
- FN = 1090;
- TN = 6110.
4.4. Receiver Operating Characteristic Curve
A receiver operating characteristic (ROC) curve is a graph that displays the accuracy of a classification model over different cutoff points. The following variables are plotted on this curve:
- True Positive Rate: Since recall is synonymous with True Positive Rate (TPR), its definition is as follows:TPR = TP/(TP + FN)
- False Positive Rate: An explanation of the term “false positive rate” (FPR) is as follows:FPR = FP/(FP + TN)
The ROC curve compares the false positive rate (FPR) to the true positive rate (TPR) for a range of cutoff values. Increasing both False Positives and True Positives occur when the categorization threshold is lowered such that more objects are classified as positive. Figure 2 showed the ROC curve of the proposed model having 0.9988.
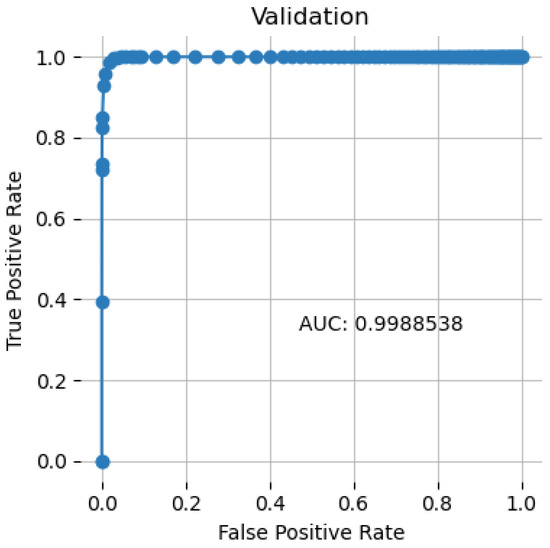
Figure 2.
ROC Curve.
4.5. Precision Recall Curve
Figure 3 illustrates the threshold-dependent tradeoff between accuracy and recall.
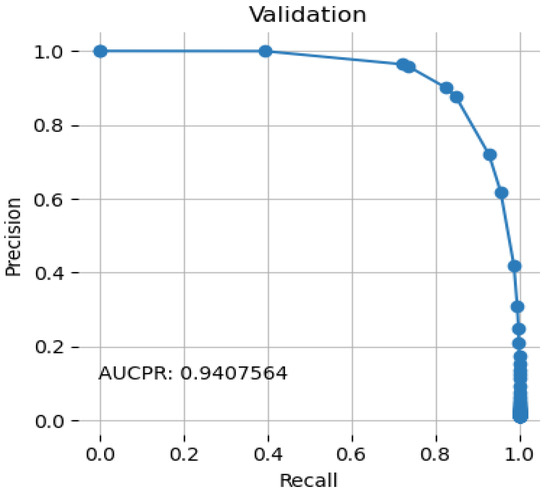
Figure 3.
Precision Recall Curve.
When the area under the curve is large, both recall and accuracy are good; when the latter is good, the rate of false positives is low, and when the former is good, the rate of false negatives is low. The proposed system achieved an AUCPR value of 0.9407.
4.6. Cumulative Lift
The Cumulative Lift Chart displays the lift factor, or the number of times better using a model compared to not using a model. The Cumulative Lift Chart (with cumulative lift factors) is depicted in the following Figure 4.
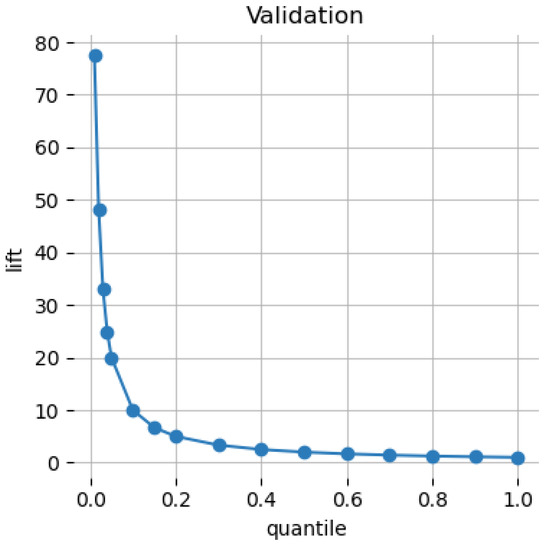
Figure 4.
Cumulative Lift.
4.7. Performance Comparison with Other Machine Learning Algorithms
Table 5 depicts the comparison of the accuracy achieved by different machine learning algorithms and the proposed model as given below. One way to judge a classification model’s performance is by its accuracy. Accuracy may be thought of as the percentage of times that our model correctly predicted an outcome. The accuracy is defined as follows:
TPR = (TP + TN)/(TP + TF + FP + FN)
Table 5.
Performance Comparison.
Table 5 shows the performance comparison between different machine learning models and the proposed model in terms of accuracy.
The proposed model has achieved the maximum AUC among these models. In comparison to the findings of previous studies on this domain shown in Table 1, the proposed model has gained the maximum level of the accuracy in prediction of financial fraud in banks. In the work cited by Chen et al. [21], the various machine learning models, i.e., PCA, C5.0, CART, SVM, and PSO on 200 transactions occurred in Taiwan Stock Exchange Corporation. Meanwhile, Rocha-Salazar et al. [29] tried the Clustering process with transaction abnormality indicator on 3527 financial transactions with a 94.6% accuracy level. XGBoostmodel integrated in [48] on advertising dataset but it gained 87.37% accuracy level. In [39], the authors applied the graph-based anomaly detection (GBAD) method to the financial cybercrime dataset but did not achieved a sufficient accuracy level (90%).
Common banking fraud detection methods include rule-based systems with a human inspection. Prior too recently, these systems functioned rather well. Traditional approaches used to detect fraud, but their accuracy has decreased as criminals have become more sophisticated. Rules-based systems cannot keep up with the rapid pace of change seen in fraud trends. This results in various problems, including false positives (the barring of legitimate consumers) and the failure to detect fraud due to the overwhelming amount of data. Using the proposed machine learning model in fraud management systems is a promising way to address these issues.
5. Conclusions
The advent of digital-only and online banking and the payments systems in recent years has led to an exponential growth in the number of transactions, making it imperative that banks implement stronger fraud detection models and effective fraud management systems. Meanwhile, fraudsters have gotten more sophisticated as well, coming up with new scams to pull out to conceal any potentially odd actions they may be taking online. Despite widespread awareness of the harm that financial payment fraud causes, online financial transactions persist. The study done in the paper presented a nature-inspired optimized-based hyperparameter. The tuning allows for the creating and testing of a Modified XGBoost model that leverages machine learning and domain data to determine the fraudulent character of such fraud. Experiments with machine learning suggest that the suggested system successfully categorized the claimed data with an accuracy of around 99.64 percent. The error rate for classifying future fraud is expected to be around 0.36 percent. Adopting the suggested approach will have an associated cost, but the long-term advantages justify this expense when weighed against the annual sums lost to fraud throughout the world. When the current centralized system is replaced with the proposed decentralized system, fraud prevention measures will be greatly strengthened and payment processing will be safer, more efficient, and have higher data integrity. Although the proposed method has accuracy, it will be difficult to implement because every bank and financial institution has its own unique constraints and often uses its own internal resources rather than a centralized strategy. Even if the information is not centralized, a trained model will nevertheless likely pick up hackable patterns. While these restrictions remain in place, there is still more to be done to win over financial institutions and banks to this technology.
Author Contributions
S.D.: Design, data collection and review of the final draft. B.S.: Introduction, Conclusion, and background. M.R.: Methods, writing the original draft, formal analysis. C.S.: Review of the first draft. C.T. Reviewing and editing. All authors have read and agreed to the published version of the manuscript.
Funding
This research received no external funding.
Informed Consent Statement
Not applicable.
Data Availability Statement
The supporting data may be provided by corresponding author on request.
Conflicts of Interest
The authors declare no conflict of interest.
References
- Takahashi, M.; Azuma, H.; Tsuda, K. A Study on Effect Evaluation of Payment Method Change in the Mail-order Industry. Procedia Comput. Sci. 2014, 35, 871–878. [Google Scholar] [CrossRef]
- Al-Hasan, A.A.; El-Alfy, E.-S.M. Dendritic Cell Algorithm for Mobile Phone Spam Filtering. Procedia Comput. Sci. 2015, 52, 244–251. [Google Scholar] [CrossRef]
- Sanusi, Z.M.; Rameli, M.N.F.; Isa, Y.M. Fraud Schemes in the Banking Institutions: Prevention Measures to Avoid Severe Financial Loss. Procedia Econ. Financ. 2015, 28, 107–113. [Google Scholar] [CrossRef]
- Takahashi, M.; Azuma, H.; Tsuda, K. A Study on Deliberate Presumptions of Customer Payments with Reminder in the Absence of Face-to-face Contact Transactions. Procedia Comput. Sci. 2015, 60, 968–975. [Google Scholar] [CrossRef][Green Version]
- Takahashi, M.; Azuma, H.; Tsuda, K. A Study on the Efficient Estimation of the Payment Intention in the Mail Order Industry. Procedia Comput. Sci. 2016, 96, 1122–1128. [Google Scholar] [CrossRef]
- Takahashi, M.; Azuma, H.; Tsuda, K. A Study on Validity Detection for Shipping Decision in the Mail-order Industry. Procedia Comput. Sci. 2017, 112, 1318–1325. [Google Scholar] [CrossRef]
- Leite, R.A.; Gschwandtner, T.; Miksch, S.; Gstrein, E.; Kuntner, J. Visual analytics for event detection: Focusing on fraud. Vis. Inform. 2018, 2, 198–212. [Google Scholar] [CrossRef]
- Barbieri, A.L.; Fadare, O.; Fan, L.; Singh, H.; Parkash, V. Challenges in communication from referring clinicians to pathologists in the electronic health record era. J. Pathol. Inform. 2018, 9, 6. [Google Scholar] [CrossRef]
- Takahashi, M.; Azuma, H.; Tsuda, K. A Study on Delivery Evaluation under Asymmetric Information in the Mail-order Industry. Procedia Comput. Sci. 2018, 126, 1298–1305. [Google Scholar] [CrossRef]
- Ozili, P.K. Impact of digital finance on financial inclusion and stability. Borsa Istanb. Rev. 2018, 18, 329–340. [Google Scholar] [CrossRef]
- Reddy, K. Pot the ball? Sovereign wealth funds’ outward FDI in times of global financial market turbulence: A yield institutions-based view. Cent. Bank Rev. 2019, 19, 129–139. [Google Scholar] [CrossRef]
- Dada, E.G.; Bassi, J.S.; Chiroma, H.; Abdulhamid, S.M.; Adetunmbi, A.O.; Ajibuwa, O.E. Machine learning for email spam filtering: Review, approaches and open research problems. Heliyon 2019, 5, e01802. [Google Scholar] [CrossRef]
- Setiawan, N.; Suharjito; Diana, A. Comparison of Prediction Methods for Credit Default on Peer to Peer Lending using Machine Learning. Procedia Comput. Sci. 2019, 157, 38–45. [Google Scholar] [CrossRef]
- Hitam, N.A.; Ismail, A.R.; Saeed, F. An Optimized Support Vector Machine (SVM) based on Particle Swarm Optimization (PSO) for Cryptocurrency Forecasting. Procedia Comput. Sci. 2019, 163, 427–433. [Google Scholar] [CrossRef]
- Hammouchi, H.; Cherqi, O.; Mezzour, G.; Ghogho, M.; El Koutbi, M. Digging Deeper into Data Breaches: An Exploratory Data Analysis of Hacking Breaches over Time. Procedia Comput. Sci. 2019, 151, 1004–1009. [Google Scholar] [CrossRef]
- Stavinova, E.; Bochenina, K. ScienceDirect Forecasting of foreign trips by transactional data: Comparative study Forecasting of a foreign trips by transactional data: A comparative study. Procedia Comput. Sci. 2019, 156, 225–234. [Google Scholar] [CrossRef]
- De Souza, M.J.S.; Almudhaf, F.W.; Henrique, B.M.; Negredo, A.B.S.; Ramos, D.G.F.; Sobreiro, V.A.; Kimura, H. Can artificial intelligence enhance the Bitcoin bonanza. J. Financ. Data Sci. 2019, 5, 83–98. [Google Scholar] [CrossRef]
- Rtayli, N.; Enneya, N. Selection Features and Support Vector Machine for Credit Card Risk Identification. Procedia Manuf. 2020, 46, 941–948. [Google Scholar] [CrossRef]
- Pikulík, T.; Štarchoň, P. Public registers with personal data under scrutiny of DPA regulators. Procedia Computer Sci. 2020, 170, 1170–1179. [Google Scholar] [CrossRef]
- León, C.; Barucca, P.; Acero, O.; Gage, G.; Ortega, F. Pattern recognition of financial institutions’ payment behavior. Lat. Am. J. Cent. Bank. 2020, 1, 100011. [Google Scholar] [CrossRef]
- Chen, M.-Y. Bankruptcy prediction in firms with statistical and intelligent techniques and a comparison of evolutionary computation approaches. Comput. Math. Appl. 2011, 62, 4514–4524. [Google Scholar] [CrossRef]
- Chen, J.; Tao, Y.; Wang, H.; Chen, T. Big data based fraud risk management at Alibaba. J. Financ. Data Sci. 2015, 1, 1–10. [Google Scholar] [CrossRef]
- Chouiekh, A.; Ibn EL Haj, E.H. ConvNets for Fraud Detection analysis. Procedia Comput. Sci. 2018, 127, 133–138. [Google Scholar] [CrossRef]
- Subudhi, S.; Panigrahi, S. Use of optimized Fuzzy C-Means clustering and supervised classifiers for automobile insurance fraud detection. J. King Saud Univ. Comput. Inf. Sci. 2020, 32, 568–575. [Google Scholar] [CrossRef]
- Nicholls, J.; Kuppa, A.; Le-Khac, N.-A. Financial Cybercrime: A Comprehensive Survey of Deep Learning Approaches to Tackle the Evolving Financial Crime Landscape. IEEE Access 2021, 9, 163965–163986. [Google Scholar] [CrossRef]
- Thejas, G.S.; Dheeshjith, S.; Iyengar, S.S.; Sunitha, N.R.; Badrinath, P. A hybrid and effective learning approach for Click Fraud detection. Mach. Learn. Appl. 2021, 3, 100016. [Google Scholar] [CrossRef]
- Domashova, J.; Kripak, E. Identification of non-typical international transactions on bank cards of individuals using machine learning methods. Procedia Comput. Sci. 2021, 190, 178–183. [Google Scholar] [CrossRef]
- Pourhabibi, T.; Ong, K.-L.; Kam, B.H.; Boo, Y.L. Fraud detection: A systematic literature review of graph-based anomaly detection approaches. Decis. Support Syst. 2020, 133, 113303. [Google Scholar] [CrossRef]
- Rocha-Salazar, J.-D.; Segovia-Vargas, M.-J.; Camacho-Miñano, M.-D. Money laundering and terrorism financing detection using neural networks and an abnormality indicator. Expert Syst. Appl. 2021, 169, 114470. [Google Scholar] [CrossRef]
- Chen, L.; Jia, N.; Zhao, H.; Kang, Y.; Deng, J.; Ma, S. Refined analysis and a hierarchical multi-task learning approach for loan fraud detection. J. Manag. Sci. Eng. 2022, 7, 589–607. [Google Scholar] [CrossRef]
- Pinto, S.O.; Sobreiro, V.A. Literature review: Anomaly detection approaches on digital business financial systems. Digit. Bus. 2022, 2, 100038. [Google Scholar] [CrossRef]
- Muheidat, F.; Patel, D.; Tammisetty, S.; Tawalbeh, L.A.; Tawalbeh, M. Emerging Concepts Using Blockchain and Big Data. Procedia Comput. Sci. 2021, 198, 15–22. [Google Scholar] [CrossRef]
- Sánchez-Paniagua, M.; Fidalgo, E.; Alegre, E.; Alaiz-Rodríguez, R. Phishing websites detection using a novel multipurpose dataset and web technologies features. Expert Syst. Appl. 2022, 207, 118010. [Google Scholar] [CrossRef]
- Li, Y.; Saxunova, D. A perspective on categorizing Personal and Sensitive Data and the analysis of practical protection regulations. Procedia Comput. Sci. 2020, 170, 1110–1115. [Google Scholar] [CrossRef]
- Amponsah, A.A.; Adekoya, A.F.; Weyori, B.A. Improving the Financial Security of National Health Insurance using Cloud-Based Blockchain Technology Application. Int. J. Inf. Manag. Data Insights 2022, 2, 100081. [Google Scholar] [CrossRef]
- Sabetti, L.; Heijmans, R. Shallow or deep? Training an autoencoder to detect anomalous flows in a retail payment system. Lat. Am. J. Cent. Bank. 2021, 2, 100031. [Google Scholar] [CrossRef]
- Severino, M.K.; Peng, Y. Machine learning algorithms for fraud prediction in property insurance: Empirical evidence using real-world microdata. Mach. Learn. Appl. 2021, 5, 100074. [Google Scholar] [CrossRef]
- Olowookere, T.; Adewale, O.S. A framework for detecting credit card fraud with cost-sensitive meta-learning ensemble approach. Sci. Afr. 2020, 8, e00464. [Google Scholar] [CrossRef]
- Misra, S.; Thakur, S.; Ghosh, M.; Saha, S.K. An Autoencoder Based Model for Detecting Fraudulent Credit Card Transaction. Procedia Comput. Sci. 2020, 167, 254–262. [Google Scholar] [CrossRef]
- Lee, J.; Shin, H.; Cho, S. A medical treatment based scoring model to detect abusive institutions. J. Biomed. Inform. 2020, 107, 103423. [Google Scholar] [CrossRef]
- Rahman, M.; Ismail, I.; Bahri, S. Analysing consumer adoption of cashless payment in Malaysia. Digit. Bus. 2020, 1, 100004. [Google Scholar] [CrossRef]
- Li, J.; Chen, W.-H.; Xu, Q.; Shah, N.; Kohler, J.C.; Mackey, T.K. Detection of self-reported experiences with corruption on twitter using unsupervised machine learning. Soc. Sci. Hum. Open 2020, 2, 100060. [Google Scholar] [CrossRef]
- Rubio, J.; Barucca, P.; Gage, G.; Arroyo, J.; Morales-Resendiz, R. Classifying payment patterns with artificial neural networks: An autoencoder approach. Lat. Am. J. Cent. Bank. 2020, 1, 100013. [Google Scholar] [CrossRef]
- Bagga, S.; Goyal, A.; Gupta, N.; Goyal, A. Credit Card Fraud Detection using Pipeling and Ensemble Learning. Procedia Comput. Sci. 2020, 173, 104–112. [Google Scholar] [CrossRef]
- Wyrobek, J. Application of machine learning models and artificial intelligence to analyze annual financial statements to identify companies with unfair corporate culture. Procedia Comput. Sci. 2020, 176, 3037–3046. [Google Scholar] [CrossRef]
- Świecka, B.; Terefenko, P.; Paprotny, D. Transaction factors’ influence on the choice of payment by Polish consumers. J. Retail. Consum. Serv. 2021, 58, 102264. [Google Scholar] [CrossRef]
- Seth, B.; Dalal, S.; Jaglan, V.; Le, D.N.; Mohan, S.; Srivastava, G. Integrating encryption techniques for secure data storage in the cloud. Transact. Emerg. Telecommun. Technol. 2020, 33, e4108. [Google Scholar] [CrossRef]
- Domashova, J.; Zabelina, O. Detection of fraudulent transactions using SAS Viya machine learning algorithms. Procedia Comput. Sci. 2021, 190, 204–209. [Google Scholar] [CrossRef]
- Rb, A.; Kr, S.K. Credit card fraud detection using artificial neural network. Glob. Transit. Proc. 2021, 2, 35–41. [Google Scholar] [CrossRef]
- Dalal, S.; Onyema, E.M.; Romero, C.A.T.; Ndufeiya-Kumasi, L.C.; Maryann, D.C.; Nnedimkpa, A.J.; Bhatia, T.K. Machine learning-based forecasting of potability of drinking water through adaptive boosting model. Open Chem. 2022, 20, 816–828. [Google Scholar] [CrossRef]
- Candrian, C.; Scherer, A. Rise of the machines: Delegating decisions to autonomous AI. Comput. Hum. Behav. 2022, 134, 107308. [Google Scholar] [CrossRef]
- Li, T.; Kou, G.; Peng, Y. Improving malicious URLs detection via feature engineering: Linear and nonlinear space transformation methods. Inf. Syst. 2020, 91, 101494. [Google Scholar] [CrossRef]
- Johnson, O.V.; Jinadu, O.T.; Aladesote, O.I. On experimenting large dataset for visualization using distributed learning and tree plotting techniques. Sci. Afr. 2020, 8, e00466. [Google Scholar] [CrossRef]


Publisher’s Note: MDPI stays neutral with regard to jurisdictional claims in published maps and institutional affiliations. |
© 2022 by the authors. Licensee MDPI, Basel, Switzerland. This article is an open access article distributed under the terms and conditions of the Creative Commons Attribution (CC BY) license (https://creativecommons.org/licenses/by/4.0/).