Abstract
Developing transportation systems (TSs) under the structure of a wireless sensor network (WSN) along with great preponderance can be an Achilles’ heel from the standpoint of cyber-attacks, which is worthy of attention. Hence, a crucial security concern facing WSNs embedded in electrical vehicles (EVs) is malware attacks. With this in mind, this paper addressed a cyber-detection method based on the offense–defense game model to ward off malware attacks on smart EVs developed by a wireless sensor for receiving data in order to control the traffic flow within TSs. This method is inspired by the integrated Nash equilibrium result in the game and can detect the probability of launching malware into the WSN-based EV technology. For effective realization, modeling the malware attacks in conformity with EVs was discussed. This type of attack can inflict untraceable detriments on TSs by moving EVs out of their optimal paths for which the EVs’ power consumption tends toward ascending thanks to the increasing traffic flow density. In view of this, the present paper proposed an effective traffic-flow density-based dynamic model for EVs within transportation systems. Additionally, on account of the uncertain power consumption of EVs, an uncertainty-based UT function was presented to model its effects on the traffic flow. It was inferred from the results that there is a relationship between the power consumption and traffic flow for the existence of malware attacks. Additionally, the results revealed the importance of repressing malware attacks on TSs.
Keywords:
transportation system (TS); electrical vehicles (EVs); malware attack; offense–defense game; traffic flow; wireless sensor network (WSN); uncertainty MSC:
94-10
1. Introduction
Transportation systems (TSs) are revolutionary technologies derived from new technologies and communications designed to meet the needs of social welfare within cities [1]. Indeed, the growing employment of electrical vehicles (EVs) and metro-based city railways encourages willing researchers and industry holders to provide insightful ideas aiming to enhance energy management in terms of reliability and safety [2]. Here, the key factor that can make a profound impact on the TSs is misuse and unfair treatment in using these revolutionary technologies, such as wireless sensor networks (WSNs) embedded in EVs. These emerging communications, along with their privileges, constitute a guiding light for cyber-attacks, which need to be dealt with [3].
Data broadcasting structures utilize sensor nodes, which are located in varied areas and are connected by dint of the wireless communication named WSN. Their wide applications can be recapitulated in intelligent transportation, monitoring systems, fire prevention, and so forth [4]. Due to being vulnerable, this type of network is a meaningful target to malicious hackers and various kinds of attacks, e.g., flooding attack [5,6], wormhole attack [7], Sybil attack [8,9], selective forwarding [10,11], and malware attacks [12]. The authors in ref. [12] tried to model a malware attack for wireless sensor networks. Among the abovementioned attacks, malware attacks may be more perilous and destructive in comparison with other attacks because a malware contaminated-node will automatically broadcast malware to the other neighboring nodes. This means that the entire system would be infected if even a single node is exposed to a malware attack. Hence, having an underlying understanding of the malware’s behavior and providing the defensive modus operandi against it is a must. WSNs infected by malware are comprised of malicious and authentic nodes. In this way, the authentic nodes in turn receive malware from malicious ones. Meanwhile, the intrusion detection system (IDS) has the ability to identify the malware in the authentic nodes. With this knowledge, the infected nodes do not send malware to other nodes at any time. Since the authentic node to detect attacks takes the high consumed energy, it does not carry out IDS every time in order to preserve energy. So, it results that the malicious and authentic nodes conflict with each other, similar to a game structure. So to speak, it is needed to use the game strategy to examine the defense methods between these nodes in wireless networks. Indeed, when an authentic node is overshadowed by malware attacks, it starts the process of propagating false data and malwares to neighboring nodes. The authors in ref. [13] tried to provide an effective algorithm to select an adaptive node considering the evolutionary game led to the improvement of network efficiency and lifetime. Additionally, ref. [14] explained a defense model based on the differential game strategy regarding the dynamic changes caused by cyber-attacks. As a result, by drawing on game theory policy, it is easy to identify the type of attack and provide defense frameworks for the infected WSNs. The widespread presence of WSNs in the industry has led to the reformation of conventional cities, becoming easier for use by management [15]. Malware attacks, in nature, utilize a type of brutal data dissemination to harm the host system. On the other hand, considering that in a smart city, the energy management of the transportation sector is linked with the entire system, if a malware attack were successful, the energy management of the entire system would be damaged. Likewise, on a small scale, because the wireless sensor network is installed on every vehicle and charging station, receiving or sending false data would lead to a severe anomaly in the urban energy management sector. The ‘smartness’ concept has become more prevalent in cities and, thereby, intelligent, interconnected, and instrumented structures have emerged [16]. A smart city is an interconnected environment that integrates and shares data through different services. Additionally, instrumented structures in smart cities, with the help of sensors and measurements, provide the needed ability to instantaneously collect data related to city life. Investigations indicate that a decision-making system based on an intelligent structure could guarantee finding the optimal decisions through data processing in optimization and modeling analyses and so forth [17]. The presence of advanced technologies within city infrastructure is a convincing reason to develop varied energy segments, including in transportation, smart homes, and the electrical grid. Smart cities have the potential to transfer energy among these segments in order to facilitate real-time energy management. As already mentioned, TS, as a significant energy segment in smart cities, is always undergoing a change in energy management for the sake of the EVs’ performance. The traffic flow arising from moving EVs in non-optimal paths is one of these underlying concerns in the TSs’ energy management. Hence, due to the relationship between the power consumption of EVs and the traffic flow density, it is essential to dynamically consider the EVs’ behavior in energy management. Indeed, the constant daily movement of people using EVs sometimes gives rise to the traffic on a city’s roads, which in turn affects the energy consumption related to battery-based hybrids or EVs [18]. Ref. [19], in response to this problem, proposed a new model of traffic flow with the presence of EVs. The authors in ref. [20] tried to dynamically provide an all-inclusive study of all factors on traffic flow. To be more precise, the weather patterns, stochastic EV behavior, and the time of travel are all factors to consider when making an impression on the traffic density, all of which were investigated in ref. [21]. Additionally, dynamic and static traffic models were compared in ref. [22]. It is worth mentioning that the remarkable estimating error between the real and simulated models defined for TSs does not arise from being aware of the uncertainty in the EVs’ performances. Hence, in response to this concern, many investigations have advocated for varied models and approaches to adderss uncertainty. In recent years, the Monte Carlo method, as the most valid technique, has been recognized to solve energy management probability problems within the power system. Having high accuracy in the real world is a convincing reason for its use as a reference in order to evaluate the other methods [23]. However, the time-consuming nature of estimating the calculation is known as the greatest weakness of this technique [24]. However, recently, lots of efforts to overcome this problem have been made, among which the unscented transformation (UT) method could attract attention due to its properties [25]. The authors in ref. [26] tried to implement the UT method in the uncertain environment of a smart city. This reference used the property of UT in modeling the correlation among the energy segments in the smart city. Individually, the modeling of the uncertain performance of EVs based on vehicle-to-grid technology (V2G) was deterministically carried out, and inspired by the UT concept [27]. Given the dynamic model of energy management in the EVs proposed in the current paper, a UT-based uncertainty model was applied to the static/dynamic energy model of EVs within the transportation system. Indeed, this uncertainty model mapped all uncertain parameters related to the dynamic model, including the EV’s speed and the traffic rate, and also related to the static model including the braking energy of metro stations and the number of EVs in the stations.
The highlights of this paper can be summarized as follows:
- We analyzed the energy consumption of EVs using on a traffic flow-based online dynamic energy model and developed it by WSNs to control the traffic flow within a transportation system.
- We modeled a malware attack and implemented it into the WSN-based EVs with the aim of infecting the wireless sensor nodes and also proposing an effective offense–defense game strategy to deal with that.
- We presented a UT-based uncertainty method to model the high-risk energy consumption of the EVs considering the varied density rates of the traffic flow.
The rest of the paper is structured as follows: Section 2 presents the traffic model considering the energy consumption model of EVs. Section 3 presents the malware attack and the offense–defense strategy for WSNs. Section 4 presents the uncertainty model. Section 5 presents and evaluates the simulation results. Finally, Section 6 provides the conclusions.
2. The Traffic Flow Density-Based Online Dynamic Model of the Transportation System
2.1. Definition of the Traffic Flow Model
On account of the ease of arriving at the destination (for instance, the city center), the drivers of EVs are inclined to move into a few areas (usually the main road) and can cause traffic density on the main roads within the city [28]. However, this is not the sole reason for traffic flow density. The abrupt emergence of physical obstacles on the roads, the flawed performance of some drivers, who fail to respect city rules, and also natural stumbling blocks are well-known as strong contributing factors to the city traffic crisis. For these reasons, it is rather unlikely that the EVs follow the same behavior in the traffic flow. Accordingly, the traffic flow density would be altered, with an emphasis on the position and time. On the basis of the city observations, the definition of the traffic model is based on two key parameters, including macro and micro parameters. From the macro standpoint, the traffic flow is defined as concerning the global indexes. However, the EVs’ performances and their effects on the traffic flow density shed light on the micro parameter. Relying on this knowledge, the macro parameters include (1) flow rate, (2) density, and (3) speed. On the contrary, the time and local intervals and the vehicle’s speed are the micro parameters. The volume parameter expresses how many vehicles are passing across the road based on a specific length at a certain period. Additionally, the moving rate of the vehicle at a distance is defined by the speed parameter. The density parameter is calculated based on the volume of traffic not considering the time, which is the most vital parameter in the traffic model. Table 1 indicates the classification of the parameters of the traffic model based on the macro/micro standpoints.

Table 1.
Definition of the micro and macro parameters.
The traffic flow rate and density are respectively defined by Equations (1) and (2), in which speed (S) and speed changes are involved. As can be seen in Figure 1, the vehicle’s length and distance between two vehicles in a row when moving on a road are significant criteria for computing density into the traffic flow. Keeping this in mind, density in a traffic line is defined by:
wherein D and Ld are density and the distance (m) for vehicles in a row in a line. As already mentioned, the density of traffic flow on the road has a relationship to the distance among EVs involved in the traffic. Hence, the parameter of the distance was used in Equation (3) for calculating the density. Additionally, the flow rate (V) was obtained based on the time interval (Td) among the consecutive vehicles moving on a road, as indicated in Equation (4). Indeed, the time interval (Td) among EVs on the road can affect the EV’s speeds when moving on the road. It is worth noting that the values 5280 and 3600 are constant and were determined for all types of vehicles on average.

Figure 1.
Illustration of the local interval for the vehicles in traffic.
Finality, the average speed in the traffic flow was calculated based on the time and local interval as follows:
2.2. The Proposed Online Dynamic Energy Management for TSs
To realize dynamic energy management within TS, modeling the speed rate of EVs can affect the energy consumption involved in the traffic flow rate. Indeed, the speed rate obtained in the previous section was considered as a criterion to calculate the consumed energy in the EVs moving on the road. In this section, this paper tries to present an online dynamic energy model for advanced transport employed in a smart city. Indeed, the goal was to indicate the effects of traffic flow density on the dynamic energy consumption of EVs, which, in turn, will alter the energy interactions with the charging stations. The congestion of EVs on the road or the traffic flow causes inhibits the movement of vehicles from start to end. This results in EVs being driven at non-optimal velocities, in turn resulting in declined energy efficiency. To be more precise, there is a need to describe the energy consumption model for EVs concerning the speed and technical and environmental conditions that EVs on the roads are exposed to. In this model, the vehicle-specific power (VSP) and the average driving speed were considered the main criteria. Indeed, the energy efficiency and the output power in EVs were computed based on the VSP that each EV is defined on. Additionally, we assumed that all EVs take various speeds on the road at any time (second). By keeping this in mind, the traction energy of EVs being on the move is defined as follows:
This equation expresses three terms of energy, all of which affect the traction energy for an EV, including (1) the force of rolling resistance, (2) air resistance, and (3) gradient resistance. Indeed, this equation indicates that the consumed energy of an EV is overshadowed by the depreciation energy arising from the EV wheel and the atmosphere condition, which results in the EV’s speed reduction. Hence, the first and third terms are related to the wheel energy involved by the gravity force to coefficients agr, and ag, including the road gradient, the rolling resistance, and the gravity acceleration. As for speed, these coefficients describe the depreciation condition between the vehicle’s wheels and the roads, which is a nonlinear function based on cos(.) and sin(.). It is worth noting that the first/third terms of Equation (6) are solvable due to the constant coefficient agr. Air resistance is another criterion that led to the EV’s speed reduction once moving on the road. The second term shows the relationship between the traction energy and speed. Additionally, this relation considers the air conditions with an emphasis on coefficients εa = air density, = air drag, = front surface area of the EV, S = EV speed (m/s), and w = EV weight (kg). On the basis of city traffic knowledge, the number of EVs passing on the road is important from the standpoint of a reference point meant for the traffic flow. This definition is different from the density of the traffic. In density definition, the road length involved by EVs is considered. As a result, the traffic flow model indicates the speed variation due to the time and local intervals. Therefore, it seems the traction energy mentioned by Equation (6) needs to be updated based on the acceleration resistance force (EAcc) arising from the effect of the traffic flow on the traction energy of EVs. Hence, the traction force in (7) and (8) expresses how acceleration in the vehicle’s speed for the sake of traffic causes increased power consumption [29].
where the last term is related to the acceleration resistance with coefficient ARa. It is essential to say that the acceleration term can affect the traction force of EVs if it becomes involved in the traffic flow. Indeed, the effects of traffic flow on the EVs’ speed reduction are modeled by Equation (7) in the last term. Now, it we need to convert the traction force to the power consumption, taking into account the EV’s speed when moving. Hence, finally, the power consumption considering the updated traction force is calculated as follows:
Now, we model the dynamic energy management in TSs, bearing in mind that EVs, to fill up their transient power consumption, can utilize the social facilities of chargers located in parking lots on the roadside. It is essential to say we, in this paper defined, two types of charging stations, including the metro station and the grid station, as indicated in Figure 2. There are significant differences in the characteristics of these two types of charging stations (metro and grid station). 1—The metro charging station increases the uncertainty of the system by injecting unpredictable power. 2—The capacity of the metro station is lower than the grid station. 3—The oscillation of the power grid impresses the grid stations. Needless to say, we can optimally assess the energy management by taking into account the objective function’s satisfaction based on the economic policy. Specifically, having a linking structure in TSs can carry out ways in which EVs have the needed ability to minimize their consumed energy cost. On the other hand, dynamically modeling the energy framework for EVs can help to make optimal decisions in the path selection when moving and controlling the traffic flow within TSs. Hence, the proposed dynamic energy framework is defined here. As aforementioned, the EVs can participate in the buying or selling of energy from/to the metro or grid stations with an emphasis on priority. Based on this, the EVs follow the objective function defined by Equation (9). The objective function is considered based on the energy cost involved by the EVs in the static/dynamic states, which defines whether the EVs are moving or not. Given that the EVs are able to exchange the power to the two grid/metro stations, the energy cost of EVs comprises two terms, , which are indicated in the first/second terms of Equation (9). The last term expresses the degradation cost related to the discharge cycle of the EV’s battery. Each term of this function is separately described in Equations (10)–(12). As can be seen, when the EVs exchange the energy with the grid, it is needed to calculate the energy cost based on the grid price defined by the decision-making center as shown in Equation (10). This description is correct for the metro station (see Equation (11)). The battery degradation for the hybrid or especially electrical vehicles is essential to consider in energy management because it can help with precision (see Equation (12)).
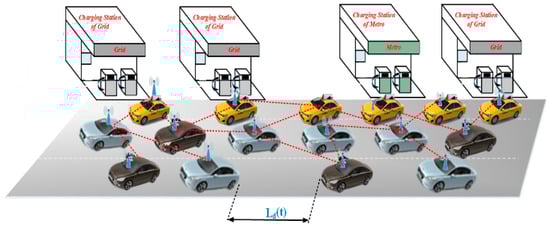
Figure 2.
The illustration of moving vehicles on the road considering the traffic density.
However, other key factors which should be considered when dynamically modeling energy are the technical limitations of EVs n that arise due to their dynamic energy consumption. Hence, dynamically computing the energy rate of the EV’s battery concerning the consumed power () in the traffic flow can be achieved, as shown in Equation (18). As can be seen, the battery energy is dependent on the energy wasted when the EV is in operation for any time t and the energy rate in the past tense t − 1. Once the EV needs to visit the charging/discharging power stations, the energy rate of the battery is assessed based on the relation shown in Equation (19). In addition, EVs must adhere to the technical limitations of charging/discharging, all of which are defined in Equations (13) to (17). It is worth noting that the EVs can connect to the charging stations for two charging/discharging cycles. So, the EVs’ batteries in the stations are defined based on the charging model or the discharging model at each time t. Hence, this difference can be modeled by Equation (13). It is essential to consider the charging/discharging powers in the metro stations with an emphasis on the charging/discharging limitations as shown in Equations (14) and (15). This is correct for the grid stations based on Equation (16). The power consumption arising from the traction force of EVs affects the battery energy, which is modeled by Equation (17).
3. The Malware Attack Analysis in the Transportation System
3.1. Malware Attack Model
In smart cities, developing the transportation segment to become more controllable, flexible, and optimal for the benefit of social welfare has been the focus of research attention in recent years [30]. For instance, equipping the transportation sector, especially with hybrid or electric vehicles with a communicable bed for the awareness-raising, may be the best and most-far sighted solution to the problem of traffic control in smart cities. Based on the literature, the advancement of communication has resulted in one of the most widely-used applications called wireless sensor networks (WSNs) [31]. Indeed, the structure of these networks, which are installed in EVs, is made up of nodes which handle data processing and preparation within the network. However, when launching a malware attack on WSNs, some nodes are infected by malware and are designated as malicious nodes. Malware attacks would be very effective in systems with wireless sensor networks, as each node has an intrusion detection system. The detection system possesses an internal battery whose energy can be its weakness when confronted with a malware attack. Dispatching the consecutive fake data leads to preoccupying the IDS part for detection. So, the manipulation of the whole system will be realized in this way [32]. In this situation, the network is made up of authentic and malicious nodes, and the malware is broadcasted from the malicious nodes to the authentic nodes. However, IDS embedded into the nodes can detect the information that is infected by malware. It is essential that the infected nodes, in addition to malware, send normal data to others to blot out their attacks. The IDS-based defense scheme causes remarkable energy consumption for nodes when receiving new information at any time. Hence, a node will be removed from the system if it has no energy for propagating data in WSN [33]. This type of node is named a dead node. In this way, to thwart the effect of dead nodes on the network’s performance, we carry out the process of adding new nodes to the network with an emphasis on keeping the total number of nodes unchanged. Note that considering the self-mending process for the infected nodes is an ideal assumption. Therefore, assume that these malicious nodes will be repaired by authentic ones when identifying the attack’s behavior arising from the infected nodes within the network. Figure 3 indicates which state each node is transferred to. Wherein, the authentic, malicious, and dead nodes take symptoms A, m, and D, respectively. When running a WSN, the probability of an authentic node being infected is , while the probability of repairing it is µ, and and are defined as the removing probabilities for both authentic and malicious nodes, respectively. In addition, the network would add new nodes to the rate of due to having no energy and wiping out the related nodes. N is defined as the total number of nodes, among which is the number of malicious nodes with the proportion of m and is the number of authentic nodes with the proportion of A. When running an attack, we assume that each malicious node can involve an authentic node infected at any time. Hence, Equations (20)–(23) show how the system is evaluated.
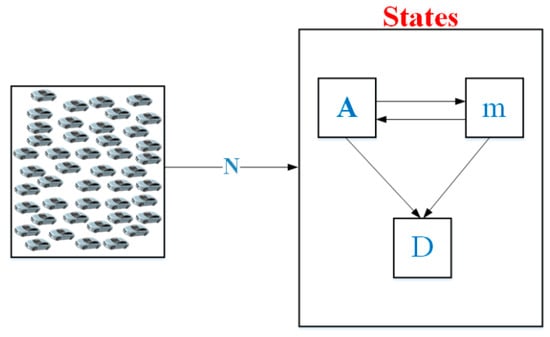
Figure 3.
The states of malicious, authentic, and dead nodes.
Dividing by N:
Simplifying Equation (24), we can obtain mt as follows:
As already mentioned, the aim is to compute the number of malicious nodes for t = ∞. Based on Equation (28), for , it is > + , and mt→∞ = 1 − (/( − )). Indeed, the changes in the number of malicious nodes can be obtained in line with the removing probability of those nodes. Looking over Equation (28), it is deducted that the changes in the number of malicious nodes can be zero if the gap between 𝜅 and µ is removed. This should be carried out during the time of the attack. It is worth noting the maximum number of malicious nodes is the maximum for , while, mt→∞ will be zero if ≤ + .
Therefore, the proportion value for malicious nodes is obtained by the following:
3.2. The Malware Attack-Based Offense–Defense Strategy
As mentioned, nodes in WSNs need to be supplied using batteries. Therefore, when these nodes (authentic nodes) enforce the detection program for new information, they will quickly lose their saving energy. Accordingly, the authentic nodes, concerning the consumed energy cost and the attack probability, should decide whether the detection is carried out or not. With the knowledge of the infected WSNs, the mutually opposed behavior between the authentic and malicious nodes is similar to a game process, in which the best strategy is picked by the offenders and defenders. Providing and designing a defense game algorithm can be analogous to how a malware attack is broadcasted with a network. For instance, the strategies used by defenders and hackers can change the process of the malware’s propagation. Indeed, an authentic node attacked by the malware takes certain defensive measures, resulting in the success rate of generating malicious nodes. It is worth noting that the game strategies proposed in the literature are not able to prevent malware’s propagation within a network. Therefore, modeling a game strategy based on the Nash equilibrium solution to provide malware propagation in WSNs is needed. Hence, this paper tried to apply a game theory-based method to deal with the strategy of offenders. The proposed game-based detection method seemed to have advantages related to modeling the Nash equilibrium solution based on malware propagation compared with other methods. The defined offense–defense game model in WSNs is based on a triple 𝛯 = [N, {Si}, {ui}] wherein N and 𝑆𝑖 were defined as sets of players and strategies in the game process. In this model, if i is an authentic node, the participants can pick out the strategy: 𝑆legitimate = {check, not check}, otherwise, the strategy will be 𝑆malicious = {offense, not offense} if i is a malicious node. Here, the strategy of the non-offense means that the malicious node not only sends no false information, but can also send normal information. The benefit resulting from the game for adoption of a strategy is 𝑢𝑖 for the participants. Additionally, the reward strategies defined for players in the game model are indicated in Table 2.
Table 2.
The attack and detection strategies based on the benefit function.
Based on Table 2, two strategies for analysis were considered: (1) attack and (2) not-attack. On the other hand, the performance of the authentic and malicious nodes against these strategies was examined based on the energy cost involved the nodes. Hence, during the offense–defense conflict, a malicious node forwards the malware or normal information with the consumed energy cost of Cm while it is r + CA for an authentic node once it wants to detect or receive information. Meanwhile, an authentic node will take the benefit of a, if detected quickly when launching a malware attack by a malicious node. Conversely, the penalty of gd is considered for a malicious node due to its identity detection. The malicious node can earn the benefit of ga when its attack is successful. In the situation of a successful attack, the authentic node receives a penalty of b due to indiscrimination. To have a gd meaningful game process, two conditions were defined for the model for satisfying: gd > CA + r and ga > Cm. Additionally, sending nodes to sleep in order to save energy is an underlying concern in WSNs. However, the game model to overcome this problem does not need to consider the additional incentives for two reasons: (1) receiving the normal information is itself an incentive for humans controlling the authentic node and (2) the additional incentives have no impact on the final game (Nash equilibrium solution) even if an additional incentive to authentic nodes is considered. Based on Table 2, an authentic node will carry out its detection process when a malware attack is launched by a malicious node. A malicious node stops launching an attack if node one starts the detection system; otherwise, it can launch its attack. Afterward, the behavior of players in the game model based on the attacking and defensive states is considered concerning the integrated equilibrium approach. Finality, keeping these in mind, all nodes set their strategies based on the Nash equilibrium strategy in order to detect or attack in WSNs. For instance, the malicious nodes with the probability of PA = CA/(gd + ga) launch their attacks while the authentic nodes can detect them with a probability of Pm = ga/(gd + ga). On the other hand, if an authentic node has no detection, it will be infected by the malicious node with a probability of = PA(1 − Pm). Likewise, recovery of the malicious nodes is carried out at the probability of µ = PAPm. Replacing these equations into Equations (24)–(27) results in Equation (30), considering the following parameters:
4. UT-Based Uncertainty Model
Having no unerring estimation for the energy consumption in TSs is an underlying concern that is worthy of attention. Hence, identifying and modeling the uncertain parameters which affect energy management in a non-optimal way is necessary. In the literature, the uncertainty methods have been provided, one of which is the UT model, well known as a useful tool regarding the ability to map the correlation environment [34]. This method takes advantage of coding and low computing time. Indeed, the UT-based uncertainty using a probability distribution function (pdf) approximates a nonlinear function [35]. To this end, in this section, we used the UT-based uncertainty concept to estimate uncertain parameters, such as the consumed power of EVs and their travel time. To briefly recapitulate, this method was executed based on the randomly generated points from a probability area into a discreet one. The estimated parameters saved in vector X are defined based on the nonlinear function with parameters p, mean value z, and covariance matrix Yaa. all steps related to the process of the UT method are as below:
Step 1: Calculate all points with Equations (31)–(33).
where is the covariance matrix and
Step 2: calculate the point weight with Equation (34):
The sum of the weights is equal to 1.
Step 3: by using these points, the model outcome can be obtained by inserting these points into . In this step, we need to define the output considering points based on the objective function. The weighting coefficients for points are applied to the output vector and calculated in the previous step. Then, vector is computed by Equation (35) considering all points. Following that, to obtain the mean value and covariance matrix of the output, the UT method carries out Equation (36) based on the points
5. Emulation and Evaluation
In this section, we consider the simulation of the studied transportation system in the dynamic mode in which EVs can decide to voluntarily choose their paths, with emphasis on the traffic information for any path. This information is distributed by the wireless sensor networks embedded in EVs and upon receiving them, with which path drivers can make an optimal decision to move on. Indeed, this can help the decision-making center of the TSs to control the traffic flow during overloaded times within smart cities. In this simulation, we used a transportation system based on the EV fleets validated by ref. [36]. In this case, we considered six EV fleets, each of which includes 30 hybrid or electrical vehicles moving on the varied paths for special hours [36]. The authors in ref. [36] showed that the number of 180 EVs in the transportation system can cover the varied challenges facing the considered traffic flow within the transportation system. Here, it is assumed that some paths are involved in the traffic flow density for any reason, thanks to which EVs will consume the surplus power in overloaded times. In addition, to make reparations, two types of charging stations including the metro charging parking lots and the grid charging parking lots are proposed for all paths, whereby which EVs that have incurred energy losses as a consequence of traffic can use them. From the viewpoint of security, we simulated and launched a malware attack on a wireless-enabled EV network equipped with the proposed attack–defense game scheme. It is worth mentioning that we used the GAMS software to implement the studied transportation system and the relevant dynamic analysis; the malware attack model along with the proposed defense approach were also implemented on MATLAB software linked with GAMS software on a PC with 32 GB of RAM. For better realization, we provide the simulation consequences in three varied forms in the following.
5.1. The Numerical and Dynamic Simulation of TSs
This section is dedicated to dynamically assessing the EVs’ behaviors in the power consumption caused by traffic flow density based on the proposed traffic model-based online energy management. Spreading out information related to the path traffic density among EVs by WSN can practically remedy the controlling patterns of traffic in the smart city. To do so, we first need to have a close look at dynamically consuming the surplus energy created EVs owing to traffic. Hence, we carried out the studied case for all EV fleets moving on paths considering their traffic density. The consequences related to the dynamic analysis with the help of the proposed online model are illustrated in Figure 4, Figure 5, Figure 6 and Figure 7. Varying the vehicle’s speed on a high scale in traffic can cause significant acceleration in the vehicle’s wheels, leading to excess power consumption (see Formula (7)). Keeping this in mind, the proposed analysis outcome for EV fleet 6 during an hour (0 to 3600 s) from 11 to 12 can be seen in Figure 4. As shown, the EVs consumed various amounts of power at any given time due to environmental conditions, traffic flow, and so forth. Indeed, this shows that the EVs use a mean consumed power of less than 400 w from 0 to 1000 s, owing to the vehicle’s amortization arising from the moving wheels. Assuming that a human accident occurred in the overload time, we carried out the determination of traffic flow on the road during 1100 to 1700 s following this. As can be seen, in this situation, the EVs had to consume power exceeding 400 w and even 900 w due to the speed changes which arose from the braking energy in traffic. It is clear the energy consumption pattern of EVs, on average, did not exceed 300 kW if assuming limited traffic density on the road. However, this consumption pattern would increase in frequency when the traffic flow increases for any reason.
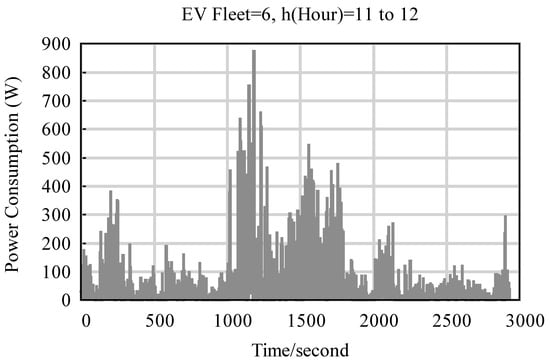
Figure 4.
The EVs’ energy consumptions considering the traffic.
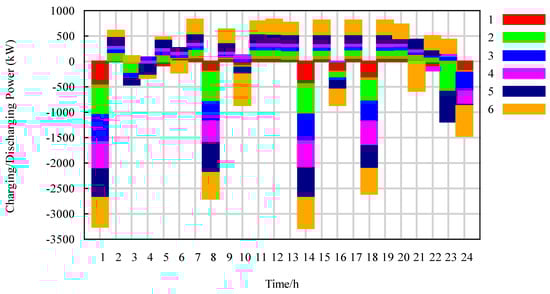
Figure 5.
The EVs’ performances at the charging station at a normal rate.
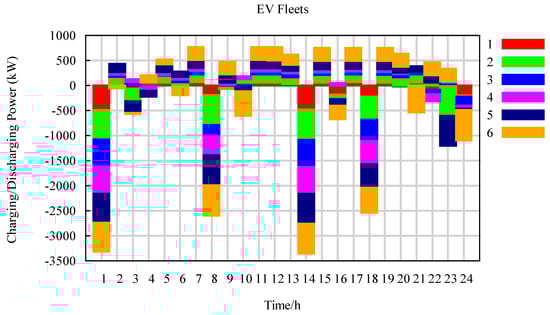
Figure 6.
The EVs’ performances at the charging station at a rate of 40%.
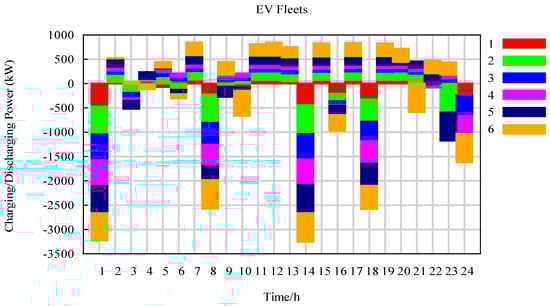
Figure 7.
The EVs’ performances at the charging station at a rate of 10%.
However, the discharging/charging patterns related to EV fleets in the parking lots underwent a change because the EVs consumed energy in excess of that which was expected during the scheduled travel time. To be more precise, based on Equations (22) and (23), balancing the energy balance of the EVs’ batteries would be dependent on the traffic energy consumption, charging, and discharging energies at any time. In other words, it is expected that as energy consumption on movement increases, so would the charging rate of energy for the EVs when stopping at metro or grid stations. Hence, the simulation results related to the fleets’ performances in the charging parking lots considering the traffic flow are indicated in Figure 5. It can be observed that all EV fleets during the traffic flow (see Figure 4 and traffic time 11 to 12) had to to link up the parking lots and increase their charging rates due to being exceeding the consumed power in the traffic flow when moving on the road. However, the absence of traffic and saving the initial energy may be convincing reasons for the high discharging rate of EV fleets at t = 1, 8, 14, and 18. To realize the proposed online model’s effectiveness for dynamic analysis, we provided additional results to describe the effects of the traffic density rate while accounting for the proportion of rates 10% (down) and 40% (up) to the normal rate on the charging/discharging rate for all EV fleets. These results are indicated in Figure 6 and Figure 7. It is clear that varying traffic rates cause the charging/discharging rates to increase or decrease for some EV fleets, while the charging/discharging times experience no change when not altering the traffic time or overload time.
5.2. Analyzing Malware Model and Offense–Defense Strategy
In this section, we concentrate on simulating a malware attack in the studied transportation system equipped with the WSNs in order to facilitate the control of the traffic flow. Indeed, each node was made up of a wireless-enabled EV that connected to others through the main wireless network. In this case, the number of EV fleets was six, each of which included 30 EVs moving on the WSN-based road, and, in turn, the total number of nodes was 180. Here, we assumed that some nodes or EVs were randomly infected by malware and they propagated malware along with the normal data to the authentic nodes or EVs based on the proposed model through the wireless network. In this simulation, based on ref. [14], due to the memory and the energy level of nodes, the initial malware attack can affect the number of nodes visibly infected by malware. We initially considered 5% of the total number of nodes as the malware nodes and, in turn, 95% of nodes were authentic nodes. These nodes, considering their consumed energies, try to broadcast malware with the aim of infecting the authentic nodes connected to them. By doing this, the authentic nodes infected by malware will continue the propagation process if they consume enough energy. However, the authentic nodes, to discern the normal data from the malware, were equipped with IDS to detect the malware after receiving information. Hence, we assumed that the success probability of an attack by the malicious nodes and the probability of detection by the other nodes are obtained based on the proposed game strategy with the authentic and malicious gains 2 and 4. The energy cost for receiving normal data was considered as 1 while it was 0.5 when propagating malware. When the malware attack was launched, the number of malicious nodes or EVs could be different at any time for the sake of changing the roles of nodes in the offense–defense game strategy. In essence, setting the gains related to the game strategy affects the proportion of the infected wireless-based EVs during a given time period. Indeed, the malware’s propagation speed in WSN was controllable thanks to the offense–defense game strategy. To prove the truth of the matter, the simulation results of the proposed strategy in the studied transportation system are indicated in Figure 8 and Figure 9. It can be seen in Figure 8 that the propagation speed of malicious nodes decreased when setting the detection gain as 3. However, by setting the gain as 6, the majority of the nodes were infected by malware very quickly, as shown in Figure 8. In addition, the effect of attack gain on the propagation speed of malicious nodes was evaluated for varied values in Figure 9. It can be seen that if the attack gain takes a value greater than 3, the offense–defense game strategy could provide better effective performance during a given time period when launching a malware attack. Additionally, the expected benefits for the authentic and malicious nodes are dependent on the success probability in playing roles based on the game strategy. Looking over Figure 10, when the attack probability was >0.5, the benefit of the authentic nodes tended toward ascending and, in turn, it adopted the detection strategy. On the contrary, the authentic node selected the non-detection strategy if the attack probability was less than 0.5, considering an ascending trend for the detection probability. Figure 11 indicates how the malicious nodes can adopt the non-attack and attack strategies with an emphasis on their expected benefit based on the proposed offense–defense game strategy. It can be seen that when the attack probability was >0.5, the infected nodes adopted the attack strategy when playing in the game due to the positive benefit. However, the non-attack strategy was imposed on that node for attack probabilities <0.5.
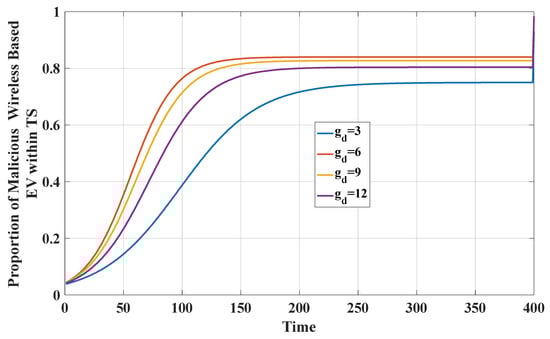
Figure 8.
The fraction of malicious wireless-based EVs based on the varied detection gains.
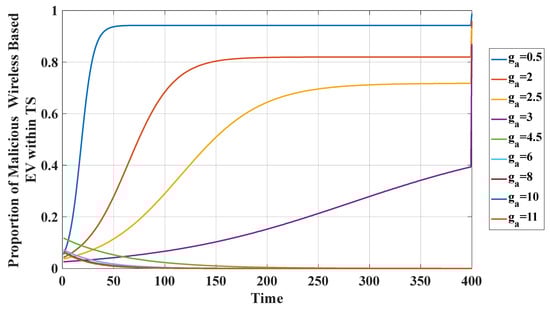
Figure 9.
The fraction of malicious wireless-based EVs based on the varied attack gains.
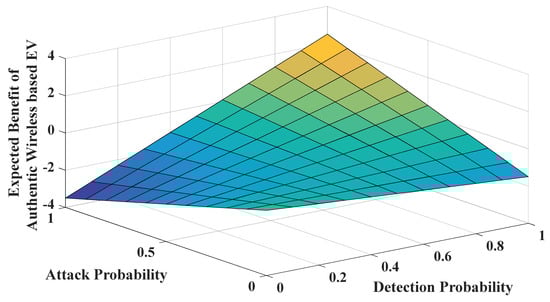
Figure 10.
The phase diagram of the expected benefit of the authentic wireless-based EVs.
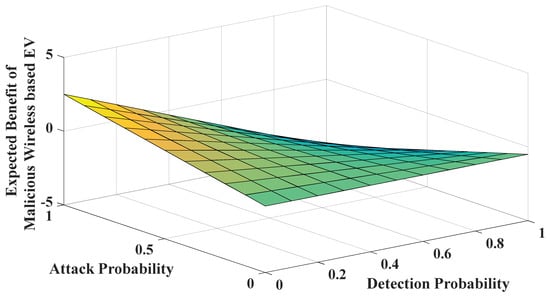
Figure 11.
The phase diagram of the expected benefit of the malicious wireless-based EVs.
5.3. The Simulation of the Uncertainty Model Based on UT
Modeling and evaluating the irrefutable fluctuations in forecasting some parameters have salutary effects on the precise scheduling of energy in the system. Hence, the transportation systems, owing to not being certain of the energy consumption and travel time related to EVs, need an effective uncertainty model to deal with this concern in energy management. Indeed, modeling the uncertain parameters in transportation systems increases the chance of having accurate online data in order to optimally control the traffic flow. In this section, we simulate the studied case by using the UT concept and obtained the simulation outcomes, as shown in Table 3. For better realization, the results are indicated for the varied traffic rates of 10%, 40%, and normal in the forms of determinacy and uncertainty. As can be seen, the total energy cost underwent remarkable changes of 12%, 2.9%, and 11.39% for normal, 10%, and 40% rates, respectively. In a nutshell, having uncertainty awareness for dynamic energy management can help the decision-making center of TS to provide flexible and controllable traffic management.
Table 3.
The total cost under the deterministic and uncertain conditions.
In this investigation, by analyzing the advantages of utilizing a wireless sensor network, we were able to model the dynamic behavior of vehicle movement to implement intelligent energy management. However, deploying this infrastructure poses security risks due to its vulnerability to malware attacks for whole-system energy management at the scale of a smart city. For this reason, to address this weakness, we offered a solution based on the game theory method to neutralize a simulated malware attack.
6. Conclusions
In this article, we simulated a transportation system including 6 fleets along with 30 vehicles on varied paths. These vehicles were assumed to be equipped with sensor nodes with the aim of connecting to the WNS. Then, we initially subjected 5% of the nodes to a malware attack, which was broadcasted throughout WSN within the transportation system. Hence, we carried out the proposed offense–defense strategy in the proposed transportation network to deal with the malware infection. The relevant consequences are attested to the proposed energy strategy’s effectiveness. Looking over the results, it can be realized, by dynamic analysis based on the proposed traffic model, that the EVs facing the traffic flow on the road would suffer an increase of 40% in dynamic energy consumption. Indeed, propagating false data by malware attacks among the wireless sensor-based EVs can help address the high traffic flow density in smart cities. This problem was considered out for the varied density rates of 10% and 40% in the dynamic analysis. Based on the proposed detection model, once the attack probability was >0.5, the benefit of the authentic nodes was increased such that they selected the detection strategy. However, the authentic nodes selected the non-detection strategy for low probabilities of attack based on the proposed strategy. Additionally, evaluating the offense–defense strategy demonstrated that precisely balancing the attack and detection gains can assist the authentic nodes to adopt the detection strategy very quickly considering the energy consumption. Analyzing the uncertainty model indicated remarkable changes of 12%, 2.9%, and 11.39% in the energy cost for the varied traffic rates.
Author Contributions
Conceptualization, F.A., A.A., T.K. and M.A.M.; Data curation, M.A.M.; Formal analysis, M.A.M.; Funding acquisition, F.A., A.A. and T.K.; Investigation, F.A., T.K. and M.A.M.; Methodology, M.A.M.; Resources, A.A.; Software, A.A. and M.A.M.; Supervision, M.A.M.; Validation, F.A. and T.K.; Visualization, M.A.M.; Writing – original draft, F.A., A.A., T.K. and M.A.M.; Writing – review & editing, F.A. and M.A.M. All authors have read and agreed to the published version of the manuscript.
Funding
This research received no external funding.
Institutional Review Board Statement
Not applicable.
Informed Consent Statement
Informed consent was obtained from all subjects involved in the study.
Data Availability Statement
The data supporting reported results are available in the manuscript.
Acknowledgments
The Authors acknowledge the support provided by King Abdullah City for Atomic and Renewable Energy (K.A.CARE) under K.A.CARE-King Abdulaziz University Collaboration Program. The authors are also thankful to Deanship of Scientific Research, King Abdulaziz University for providing financial support vide grant number (RG-49-135-42).
Conflicts of Interest
The authors declare no conflict of interest.
Nomenclature
| Sets/Indices | |
| Ωp/p | Set/index of roads. |
| Ωs/s | Set/index of stations. |
| Ωt/t | Set/index of time. |
| Ωv/v | Set/index of EVs. |
| Constants | |
| The velocity for the special values of x and t. | |
| The change in number of EVs. | |
| The density of the traffic flow. | |
| The EVs’ speed. | |
| The distance parameter. | |
| The time interval. | |
| Min/max charging/discharging powers of EV. | |
| Min/max EV battery energy. | |
| The number of authentic, malicious nodes and the total number of nodes. | |
| The proportions of the authentic and malicious nodes. | |
| Cost/benefit for the detection. | |
| The energy costs for the malicious and authentic nodes. | |
| The benefit for the successful attack, and the penalty for the attack failed. | |
| The degradation cost of EVs battery. | |
| , | Charging and discharging efficiencies, respectively. |
| Variables | |
| The consumed total energy of the EV, the EV’s wheel energy, the involved energy of air resistance, the involved energy of gradient resistance. | |
| The power consumption and the traction force. | |
| EVs, V2G and V2M energy transaction costs and degradation costss | |
| Binary variables related to the charging, and discharging of the EVs. | |
| , , | Charging/discharging powers during V2M and V2G, respectively. |
| The EV battery capacity. | |
| The removing probabilities of 𝛾1 and 𝛾2 for both authentic and malicious nodes. | |
| 𝜅, µ | The infected probability, the repairing probability. |
| The successful probabilities of authentic and malicious nodes. | |
| The generated points. | |
| The mean value. | |
| The covariance matrix. | |
| The output points of the uncertainty model. | |
References
- Wang, B.; Ma, H.; Wang, F.; Dampage, U.; Al-Dhaifallah, M.; Ali, Z.M.; Mohamed, M.A. An IoT-Enabled Stochastic Operation Management Framework for Smart Grids. IEEE Trans. Intell. Transp. Syst. 2022, 1–10. [Google Scholar] [CrossRef]
- Avatefipour, O.; Al-Sumaiti, A.S.; El-Sherbeeny, A.M.; Awwad, E.M.; Elmeligy, M.A.; Mohamed, M.A.; Malik, H. An intelligent secured framework for cyberattack detection in electric vehicles’ CAN bus using machine learning. IEEE Access 2019, 7, 127580–127592. [Google Scholar] [CrossRef]
- Batista, F.K.; del Rey, A.M.; Queiruga-Dios, A. A new individual-based model to simulate malware propagation in wireless sensor networks. Mathematics 2022, 8, 410. [Google Scholar] [CrossRef]
- Al-Mousawi, A.J.; AL-Hassani, H.K. A survey in wireless sensor network for explosives detection. Comput. Electr. Eng. 2019, 72, 682–701. [Google Scholar] [CrossRef]
- Farjamnia, G.; Gasimov, Y.; Kazimov, C. Review of the techniques against the wormhole attacks on wireless sensor networks. Wirel. Pers. Commun. 2019, 105, 1561–1584. [Google Scholar] [CrossRef]
- Jamshidi, M.; Zangeneh, E.; Esnaashari, M.; Darwesh, A.M.; Meybodi, M.R. A novel model of sybil attack in cluster-based wireless sensor networks and propose a distributed algorithm to defend it. Wirel. Pers. Commun. 2019, 105, 145–173. [Google Scholar] [CrossRef]
- Yuan, Y.; Huo, L.; Wang, Z.; Hogrefe, D. Secure APIT localization scheme against sybil attacks in distributed wireless sensor networks. IEEE Access 2018, 6, 27629–27636. [Google Scholar] [CrossRef]
- Dung, T.N.; Choe, J.; Thang, L.D.; Tai, L.D.; Zalyubovskiy, V.V.; Choo, H. Delaysensitive flooding based on expected path quality in low duty-cycled wireless sensor networks. Int. J. Distrib. Sens. Netw. 2016, 12, 15501477166642548. [Google Scholar]
- Zhang, Q.; Zhang, W. Accurate detection of selective forwarding attack in wireless sensor networks. Int. J. Distrib. Sens. Netw. 2019, 15, 15501477188240081. [Google Scholar] [CrossRef]
- Seto, K.C.; Güneralp, B.; Hutyra, L.R. Global forecasts of urban expansion to 2030 and direct impacts on biodiversity and carbon pools Proc. Natl. Acad. Sci. USA 2012, 109, 16083–16088. [Google Scholar] [CrossRef]
- Bridge, G.; Bouzarovski, S.; Bradshaw, M.; Eyre, N. Geographies of energy transition: Space, place and the low-carbon economy. Energy Policy 2013, 53, 331–340. [Google Scholar] [CrossRef]
- Zhou, H.; Shen, S.; Liu, J. Malware propagation model in wireless sensor networks under attack–defense confrontation. Comput. Commun. 2020, 162, 51–58. [Google Scholar] [CrossRef]
- Liu, J.; Yue, G.; Shen, S.; Shang, H.; Li, H. A game-theoretic response strategy for coordinator attack in wireless sensor networks. Sci. World J. 2014, 2014, 950618. [Google Scholar] [CrossRef] [PubMed]
- Shen, S.; Li, H.; Han, R.; Vasilakos, A.V.; Wang, Y.; Cao, Q. Differential game-based strategies for preventing malware propagation in wireless sensor networks. IEEE Trans. Inf. Forensics Secur. 2014, 9, 1962–1973. [Google Scholar] [CrossRef]
- Harrison, C.; Eckman, B.; Hamilton, R.; Hartswick, P.; Kalagnanam, J.; Paraszczak, J.; Williams, P. Foundations for smarter cities. IBM J. Res. Dev. 2010, 54, 1–16. [Google Scholar] [CrossRef]
- Mohamed, M.A. A relaxed consensus plus innovation based effective negotiation approach for energy cooperation between smart grid and microgrid. Energy 2022, 252, 123996. [Google Scholar] [CrossRef]
- Yang, W.; Liu, W.; Chung, C.Y.; Wen, F. Joint planning of EV fast charging stations and power distribution systems with balanced traffic flow assignment. IEEE Trans. Ind. Inform. 2020, 17, 1795–1809. [Google Scholar] [CrossRef]
- Qian, Z.; Yi, Z.; Zhong, W.; Yue, H.; Yaojia, S. Siting and sizing of electric vehicle fast-charging station based on quasi-dynamic traffic flow. IET Renew. Power Gener. 2020, 14, 4204–4214. [Google Scholar] [CrossRef]
- Zhang, C.; Chen, X. Stochastic nonlinear complementarity problem and applications to traffic equilibrium under uncertainty. J. Optim. Theory Appl. 2018, 137, 277–295. [Google Scholar] [CrossRef]
- Lippi, M.; Bertini, M.; Frasconi, P. Short-term traffic flow forecasting: An experimental comparison of time-series analysis and supervised learning. IEEE Trans. Intell. Transp. Syst. 2013, 14, 871–882. [Google Scholar] [CrossRef]
- Roustaei, M.; Niknam, T.; Salari, S.; Chabok, H.; Sheikh, M.; Kavousi-Fard, A.; Aghaei, J. A scenario-based approach for the design of Smart Energy and Water Hub. Energy 2020, 195, 116931. [Google Scholar] [CrossRef]
- Chabok, H.; Aghaei, J.; Sheikh, M.; Roustaei, M.; Zare, M.; Niknam, T.; Lehtonen, M.; Shafi-khah, M.; Catalão, J.P. Transmission-constrained optimal allocation of price-maker wind-storage units in electricity markets. Appl. Energy 2021, 310, 118542. [Google Scholar] [CrossRef]
- Korayem, A.H.; Khajepour, A.; Fidan, B. Vehicle-trailer lateral velocity estimation using constrained unscented transformation. Veh. Syst. Dyn. 2022, 60, 1048–1075. [Google Scholar] [CrossRef]
- Zhang, L.; Cheng, L.; Alsokhiry, F.; Mohamed, M.A. A Novel Stochastic Blockchain-Based Energy Management in Smart Cities Using V2S and V2G. IEEE Trans. Intell. Transp. Syst 2022, 1–8. [Google Scholar] [CrossRef]
- Ding, S.; Cao, Y.; Vosoogh, M.; Sheikh, M.; Almagrabi, A. A directed acyclic graph based architecture for optimal operation and management of reconfigurable distribution systems with PEVs. IEEE Trans. Ind. Appl. 2020, 1. [Google Scholar] [CrossRef]
- Zou, H.; Tao, J.; Elsayed, S.K.; Elattar, E.E.; Almalaq, A.; Mohamed, M.A. Stochastic multi-carrier energy management in the smart islands using reinforcement learning and unscented transform. Int. J. Electr. Power Energy Syst. 2021, 130, 106988. [Google Scholar] [CrossRef]
- Gong, X.; Dong, F.; Mohamed, A.M.; Abdalla, O.M.; Ali, Z.M. A secured energy management architecture for smart hybrid microgrids considering PEM-fuel cell and electric vehicles. IEEE Access 2020, 8, 47807–47823. [Google Scholar] [CrossRef]
- Wang, P.; Wang, D.; Zhu, C.; Yang, Y.; Abdullah, H.M.; Mohamed, M.A. Stochastic management of hybrid AC/DC microgrids considering electric vehicles charging demands. Energy Rep. 2020, 6, 1338–1352. [Google Scholar] [CrossRef]
- Almalaq, A.; Albadran, S.; Mohamed, M.A. Deep machine learning model-based cyber-attacks detection in smart power systems. Mathematics 2022, 10, 2574. [Google Scholar] [CrossRef]
- Chen, J.; Mohamed, M.A.; Dampage, U.; Rezaei, M.; Salmen, S.H.; Obaid, S.A.; Annuk, A. A multi-layer security scheme for mitigating smart grid vulnerability against faults and cyber-attacks. Appl. Sci. 2021, 11, 9972. [Google Scholar] [CrossRef]
- Mohamed, M.A.; Abdullah, H.M.; El-Meligy, M.A.; Sharaf, M.; Soliman, A.T.; Hajjiah, A. A novel fuzzy cloud stochastic framework for energy management of renewable microgrids based on maximum deployment of electric vehicles. Int. J. Electr. Power Energy Syst. 2021, 129, 106845. [Google Scholar] [CrossRef]
- Chaudhary, R.; Jindal, A.; Aujla, G.S.; Aggarwal, S.; Kumar, N.; Choo, K.K.R. BEST: Blockchain-based secure energy trading in SDN-enabled intelligent transportation system. Comput. Secur. 2019, 85, 288–299. [Google Scholar] [CrossRef]
- Al-Saud, M.; Eltamaly, A.M.; Mohamed, M.A.; Kavousi-Fard, A. An intelligent data-driven model to secure intravehicle communications based on machine learning. IEEE Trans. Ind. Electron. 2019, 67, 5112–5119. [Google Scholar] [CrossRef]
- Tan, H.; Yan, W.; Ren, Z.; Wang, Q.; Mohamed, M.A. A robust dispatch model for integrated electricity and heat networks considering price-based integrated demand response. Energy 2022, 239, 121875. [Google Scholar] [CrossRef]
- Norouzi, M.; Aghaei, J.; Pirouzi, S.; Niknam, T.; Fotuhi-Firuzabad, M.; Shafie-khah, M. Hybrid stochastic/robust flexible and reliable scheduling of secure networked microgrids with electric springs and electric vehicles. Appl. Energy 2021, 300, 117395. [Google Scholar] [CrossRef]
- Lan, T.; Jermsittiparsert, K.; Alrashood, S.T.; Rezaei, M.; Al-Ghussain, L.; Mohamed, M.A. An advanced machine learning based energy management of renewable microgrids considering hybrid electric vehicles’ charging demand. Energies 2021, 14, 569. [Google Scholar] [CrossRef]


Publisher’s Note: MDPI stays neutral with regard to jurisdictional claims in published maps and institutional affiliations. |
© 2022 by the authors. Licensee MDPI, Basel, Switzerland. This article is an open access article distributed under the terms and conditions of the Creative Commons Attribution (CC BY) license (https://creativecommons.org/licenses/by/4.0/).