Abstract
The results of modeling the conversion factor from rainfall-deposited unit activity of gamma-emitting radon and thoron daughter decay products to their created gamma-radiation dose rate as a function of height above the Earth’s surface using the Geant4 toolkit are presented in this paper. Thin layers of water, soil, and air, with the height of 0.1–10 mm, are considered as the source in order to examine whether the composition of the radiation source environment affects the simulation result. Cases with different absorber-atmosphere densities are simulated. The contribution of each radionuclide Bi, Bi, Pb, Pb and Tl to the total gamma background was determined. The dependence of dose rate growth during the precipitation period on the detector position in relation to the area covered by precipitation was investigated numerically. The obtained conversion factors are universal values, because do not depend on soil type (material) on which radionuclides are deposited by precipitation. These coefficients can be used for solving both direct tasks of radiation background recovery during precipitation and inverse tasks of determining the intensity and amount of precipitation by the known gamma background, as well as tasks to decipher the gamma background by the shape of the response to various phenomena. Also in this work, it is shown how thoron decay products can affect the response shape of gamma background on atmospheric precipitation.
1. Introduction
An increase of radiation gamma background in the form of bursts of different forms and duration during periods of atmospheric precipitation is registered practically in any corner of the globe [1,2,3,4,5,6,7,8]. The main task of radiation monitoring is the precise identification of the nature of registered bursts. The solution to this problem cannot avoid gamma-background modeling and comparison with measured data.
Quite a number of works have been devoted to the study of gamma-background growth due to deposited radionuclides- short-lived gamma-emitting decay products of natural radon isotopes. It has long been known that releasing from the ground radon and thoron can spread in the atmosphere to great heights due to turbulent diffusion and wind flows. Atmospheric precipitation washes out radioactive aerosols, most of which are short-lived daughter decay products (DPs) of radon and thoron. It is generally believed that Pb and Bi make the greatest contribution to the total gamma and beta background of the near-ground atmosphere because their activity in the atmosphere is almost two orders of magnitude greater than the activity of short-lived thoron DPs, such as Pb, Bi and Tl. This is true if the specific activity of U (Ra) and Th in the soil does not differ much. However, there are areas where the Th content in soil or building structures of residential or public buildings is rather high [9,10,11]. This can lead to a strong increase in the activity of thoron decay products in the atmosphere and radiation background.
If the sub-cloud space will contain a lot of thoron, or rather its decay products, it is necessary to estimate the contributions of each radionuclide deposited by rain on the ground surface to the total dose rate of gamma-radiation. Probably, this will help to better understand the role of thoron DPs in the formation of the surface-atmosphere radiation background during the periods of precipitation and afterward up to their complete radioactive decay, and also to reveal new regularities in the dynamics of the radiation background in regions with potentially elevated Th content in the ground. So it is impossible to do without knowing conversion factors.
When modeling the radiation background, we need to know the conversion factors from the unit surface activity of gamma-emitting radon and thoron daughter decay products deposited by precipitations to the dose rate created by them, which can be calculated using the Geant4 toolkit, which is widely known open-source software for physics simulation [12].
Conversion factor in the physical sense is the ambient equivalent dose rate created at height z from the Earth’s surface by a radionuclide G of unit activity, which is uniformly distributed on the Earth’s surface with an area of 1 m, measured in (Sv/h)/(Bq/m).
Conversion factors play a key role in modeling the response of gamma background to atmospheric deposition for the purpose of analyzing or deciphering experimental radiation monitoring data. Without conversion factors, it is also impossible to solve the inverse meteorological problem of determining the intensity or amount of precipitation from the measured gamma radiation.
The fact that gamma-background monitoring is not always carried out at the recommended height h = 1 m is of no small importance. In populated areas, gamma radiation detectors are often placed (fixed) on walls or roofs of buildings. When you change the height of the detector location, the geometry of measurements changes, i.e., the area of information collection, as well as the number of registered photons due to their different penetrating ability. To analyze data provided from different heights we also need to know conversion factors for every radionuclide at that altitude of interest.
In view of the above, the aim of this work was to simulate the conversion factor from rainfall-deposited unit activity of gamma-emitting radon and thoron daughter decay products to their created gamma radiation dose rate as a function of height above the Earth surface using the Geant4 toolkit. Section 2 describes the choice of radionuclides for modeling with a detailed justification, and also presents at what content of Ra and Th in the ground the activities of radon and thoron decay products in the atmosphere will be comparable. Section 3 describes the modeling geometry, environment, and characteristics of the gamma-ray source and absorber. The simulation results are discussed in Section 4. Section 5 describes the results of comparing experimental data with simulation results.
2. Choice of Dose-Forming Radionuclides for Modeling
To model deposited activity to gamma dose rate conversion factor were selected 5 relatively short-lived radionuclides-products of radon and thoron decay, on the basis of their nuclear-physical characteristics. Namely, we took into account radionuclide yield, radionuclide energy, type of radiation, and half-life given in Table 1 [13].

Table 1.
Radionuclides, used in simulation. Nuclear-physical characteristics of radionuclides.
Generally, thoron decay products are not taken into account in solving problems related to the influence of rain on the gamma background, since their activity in the surface-atmosphere is low. But in our work, we considered the products of thoron decay in order to be able to assess under what conditions they can significantly affect the gamma background (the degree of their influence under different conditions). For example, in some rocks of volcanic origin the content of Th reaches activities up to 550 Bq/kg, and in zirconium sands also called “black sands”, which as a result of sea surf accumulation on the coast of some regions of Brazil, India, and other countries, there can be a high content of Th up to 15–20 kBq/kg and more [9,10,11]. In India, Th has been detected with specific activity up to 1075 Bq/kg on the Karaikal coast [10].
We, therefore, perform gamma dose rate simulations in Geant4 also for thoron decay products, which is necessary to analyze cases of high Th content in the source-surface soil-to study the influence of atmospheric thoron (gas) and its DPs on the shape of the gamma background response during rainfall periods.
Atmospheric radionuclide activity as a function of Ra and Th in soil, calculated using the widely known model of radon (thoron) transport in the atmosphere [6], is given in Table 2. Values of radon and thoron flux densities from the soil surface, which are boundary conditions when solving radon atmospheric transport equations, corresponding to different ratios of Ra and Th contents shown in Table 2. Radon and thoron flux densities from the Earth’s surface were calculated from the equations in [14] as follows. In stationary case one-dimensional diffusion-advective equation of radon (thoron) transfer in porous medium is defined on the interval (here z is depth) and has the following form:
with boundary conditions:
where:
Table 2.
Average volumetric activity of radionuclides in the atmosphere depending on Ra and Th content in soil.
is the pore activity of radon (thoron) per unit volume of pore space, Bq/m;
v is the advective velocity of radon (thoron), m/s;
is the effective radon (thoron) diffusion coefficient, m/s;
is the radon (thoron) decay constant, s;
is the pore activity of radon (thoron), we consider it in a radioactive equilibrium with Ra (Th).
For such case it is equal to ,
where:
—radon (thoron) emanation coefficient;
is the specific activity of Ra (Th), Bq/kg;
is the solid particle density of soil, kg/m;
is the porosity of the soil, e.g.
Radon isotope flux density from the ground surface is determined according to Fick’s first law taking into account advective transport by the expression:
For the calculations we took clay loam since it is the most common type of soil, we use a surface layer of soil with the following parameters: cm/s; ; g/cm; ; advection velocity, which for the calculations was taken from 0 cm/s to cm/s.
It was determined that with equal Ra and Th content in surface soil 20 Bq/kg the activity of radon decay products in the atmosphere is ≈80 times higher than the activity of thoron decay products, therefore thoron is not considered in calculations. With Th content in the soil starting from ≈1500 Bq/kg the activities of all gamma-emitting radionuclides in the atmosphere become comparable (Table 2). As a result, all five -emitting radionuclides were considered for further modeling in Geant4: Bi, Bi, Pb, Pb and Tl.
3. Simulation Geometry
3.1. Description of the Source and Absorber
To test the extent to which the environment in which the deposited radionuclides reside affects the gamma background, it was considered that heavy rain could:
- -
- loosen the top layer of soil, so that the radionuclides will be intermixed with a thin layer of soil;
- -
- soak into the soil with a delay, so that the radionuclides will remain for some time in a thin layer of water on top of the soil.
Therefore, three variants of absorber 2–source–absorber 1 systems were used for modeling (Figure 1):
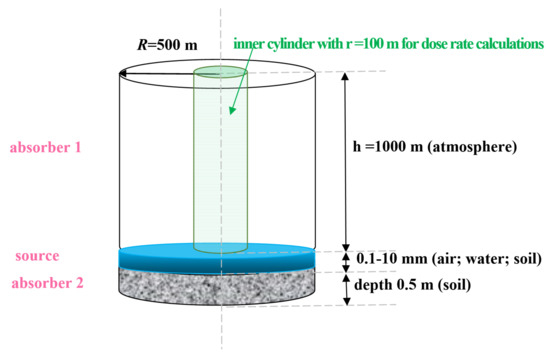
Figure 1.
Geometry of simulations in Geant4.
(V1) soil-water-air;
(V2) soil-soil-air;
(V3) soil-air-air.
We also considered a variant when there is no absorber from below (absorber 2 on Figure 1), let’s denote it by V4 (Figure 2), representing a source–absorber 1 “ground-atmosphere” system.
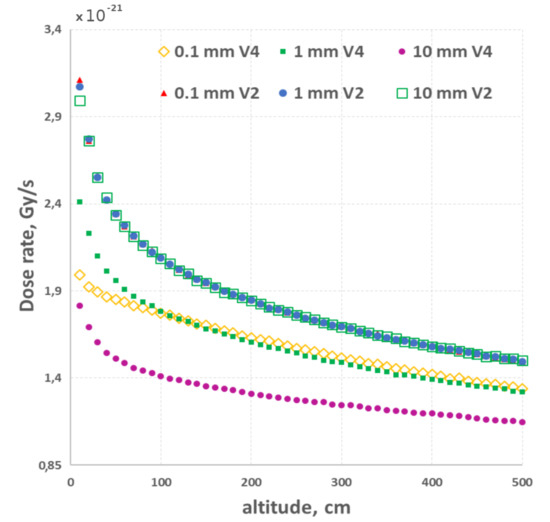
Figure 2.
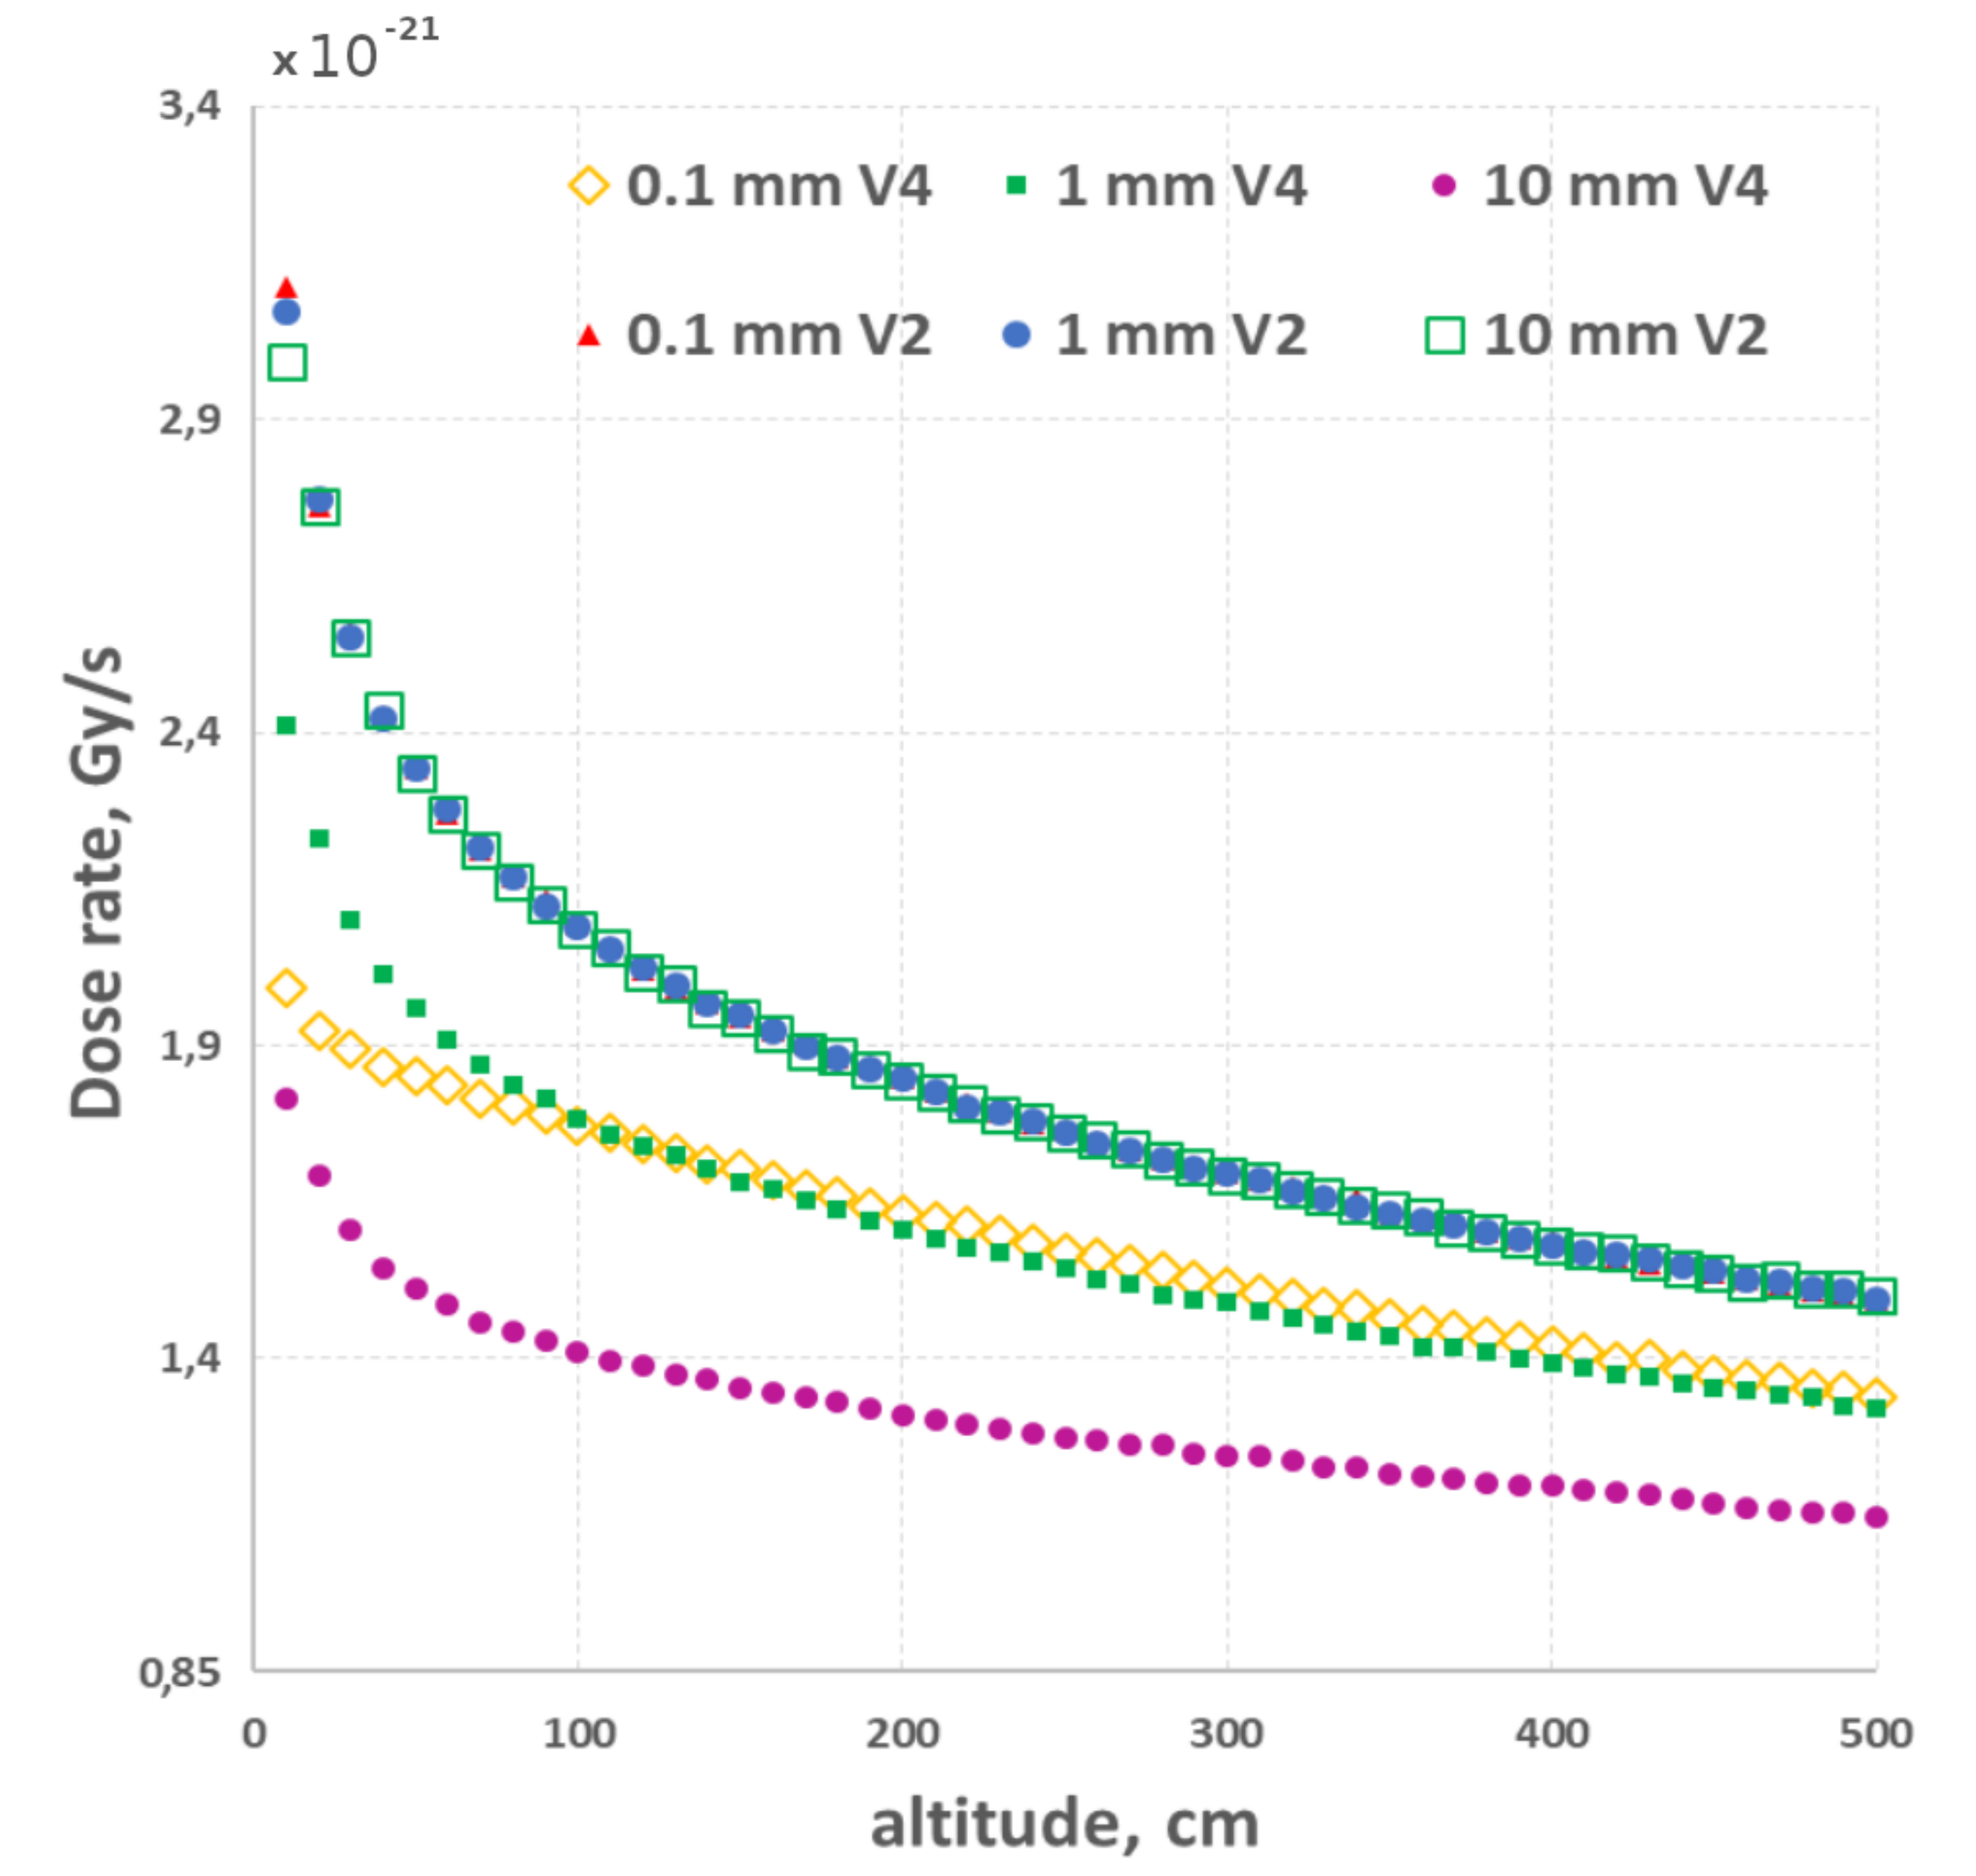
Changes of simulated gamma-ray dose rate per 1 disintegration of Bi with altitude for different source layer thicknesses.
The elemental composition and density of the media used for modeling are presented in Table 3 and Table 4. The air density for modeling was taken in the range (1.1–1.5) g/cm based on the long-term experimental data of the Geophysical Observatory of IMCES SB RAS (GO IMCES SB RAS). Elemental composition of clay loam, which is the most common soil type, was determined experimentally at the IMCES SB RAS. We used soil density 1.3 g/cm.
Table 3.
Composition of soil for simulation.
Table 4.
Composition of the atmosphere for simulation.
3.2. Choice of Geometry for Geant4 Simulation
Figure 1 shows the modeling geometry of the conversion factor from the the unit activity of gamma-emitting radon and thoron daughter decay products deposited on the Earth’s surface by rain or other atmospheric precipitation to the gamma dose rate that each radionuclide creates in the atmosphere at a different height from the Earth’s surface. The simulations were performed using the Geant4 toolkit.
For the calculations, the cylindrical geometry was chosen for all 4 variants V1, V2, V3, and V4.
The source was considered a medium (a thin layer of water, soil, or air) with radionuclides of unit activity (1 Bq) evenly distributed in this medium. The source layer was a cylinder with a constant base-circle with a radius of 500 m, and a variable height (thickness) of 0.1–10 mm. For the source we chose different thicknesses to study how much it affects the simulation result. Simulations were performed for each of the radionuclides listed in Table 1 separately.
The absorbers were the atmosphere (on top of the gamma-ray source, labeled in Figure 1 as absorber 1) and the ground (on the bottom of the gamma-ray source, labeled in Figure 1 as absorber 2). Absorber 2 was included in the physical model in order to consider how much contribution is made by the reflected upward (into the atmosphere) gamma rays from the underlying ground.
The radius of absorber 1 was chosen to be 500 m and its height 1000 m, taking into account the photon penetrability emitted by radon and thoron decay products in the air.
The same 500 m radius and 0.5 m height (thickness) were selected in absorber 2 taking into account that gamma-radiation of radon and thoron DPs are fully detained by a 50 cm layer of soil.
To mitigate edge effects influence on the final result, the absorbed dose was calculated for an inner cylinder (Figure 1 green) with a radius of 100 m. The source (soil) and the absorbing medium (air) are set in cylindrical geometry. Inner cylinder is divided by layers of 10 cm height, from to 30 m.
The physical model described above was implemented in the C++ program code. The output parameters were: (1) vertical distribution of gamma radiation absorbed dose rate Gy/s, formed in the atmosphere due to one decay of radionuclide G, which is uniformly distributed in the source layer; (2) conversion factors . In the calculations, particles with energy keV were taken into account, since there is a lower threshold of -radiation detection is widely used radiation monitoring instruments.
The calculations took into account the contribution of photons directly emitted by radionuclides, as well as secondary beta radiation.
A set of physical processes was taken on the basis of the example «extended/radioactivedecay/rdecay02» bundled with the Geant4 [12] source code (the necessary decay processes were included, as well as the interaction of radiation with matter, including Photo Electric Effect, Compton Scattering, Gamma Conversion, Bremsstrahlung).
Decay data were taken from the Evaluated Nuclear Structure Data File (ENSDF) [15] used by Geant4, which takes into account all possible decay variants.
Each radionuclide was calculated separately, i.e., no daughter products were modeled after its decay. The calculations took into account the processes of backscattering of radiation by air (absorber 1), as well as soil (absorber 2).
Each separate calculation included 2–20 billion events (decays), and was simulated using Geant 4.10.07 on Linux. Verification of simulation results with different number of events showed that the minimum required to obtain reliable values is 2 billion, and with further increase in the number of events the change in the results do not exceed 1%.
The optimal sizes of the external and internal cylinders for the calculations were determined. By increasing the volume of the outer cylinder, the calculation results did not change anymore, which confirms the correctness of the chosen physical model. An analysis of the simulation results is given in the next section.
4. Simulation Results and Their Analysis
4.1. Effect of the Source Layer Thickness on the Results
In order to study how the thickness of a source layer of soil or water, including air, with radionuclides distributed uniformly over the entire volume of this layer, affects the simulation results, calculations were performed for different thicknesses. Figure 2 shows, as an example, the simulation results for the dose rate of gamma radiation generated in the atmosphere by a single decay of Bi, which is evenly distributed in the soil layer for variant V2. The 3 layer thicknesses presented here are 0.1 mm, 1 mm, and 10 mm.
We also considered variant V4, when below the layer with radionuclides (source) there is no absorber (Figure 2), representing the source-absorber “ground-atmosphere” system.
Figure 2 shows that the calculations carried out according to variant V2, taking into account the lower layer (the ground, which is not a source of radiation, but only an absorber), give values of the conversion factor significantly higher than according to variant V4. This confirms the correctness of the built physical model, in which it is necessary to take into account the reflection of photons emitted into the lower part of the system from the ground back to the upper part of the system (atmosphere).
If we do not take into account the lower layer (absorber 2), then photons flying down from the source will be excluded by the program from calculations and further skipped, which leads to underestimated results. For the variant 0.1 mm V4, a different dependence is observed, because the layer is very thin and there is practically no absorption in it, hence the energy losses, thus the dose is reduced.
Analysis of modeling results also showed that the thickness of the layer containing deposited radionuclides does not affect the dose rate of gamma radiation in a wide range of thicknesses from 0.1 to 10 mm. This is due to the high penetrability of gamma radiation and low energy losses in the materials and thicknesses considered. Further, we will perform simulation only for the thickness of 1 mm.
4.2. Influence of the Source Material
In order to investigate whether the elemental composition of the radiation source medium affects the simulation result, calculations were performed for water, soil, and air layers of different thicknesses. Figure 3 shows, for example, simulation results for the dose rate of gamma radiation generated in the atmosphere by a single decay of Bi, which is uniformly distributed in a 1 mm thick layer of source in variant V2. The atmospheric air and soil densities for this example were 1.29 kg/m and 1.3 g/m, respectively. Elemental composition used for simulation is shown in Table 3 and Table 4.
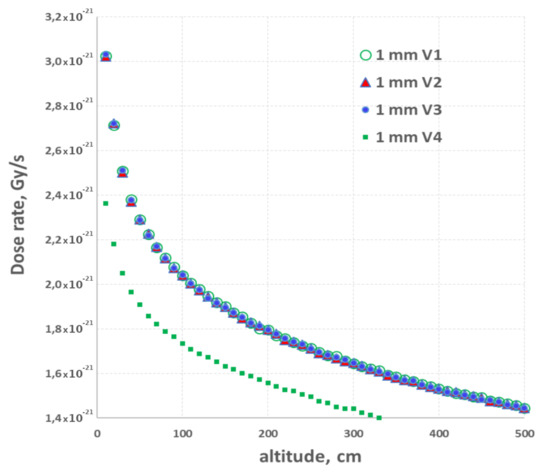
Figure 3.
Dependence of gamma-ray dose rate per 1 disintegration of Bi on altitude for different source media.
Figure 3 shows that calculations performed for different materials (water, air, and soil) but for one radionuclide give the same values of gamma-radiation dose rate and consequently the conversion factor at the same height. Dependence of conversion factor on the height of gamma background measurement is close to quasi-exponential.
Analysis of calculations when choosing the source showed that there is no significant difference in the dose rate created by the ground, air, or water. Hence, the gamma-radiation dose rate calculated for a unit surface activity of radionuclides deposited by precipitation () is a universal value and does not depend on what surface the radon daughter decay products are precipitated. Therefore, the calculated coefficients can be used for almost any geological and geographical conditions.
4.3. Influence of Absorber Density (Atmosphere)
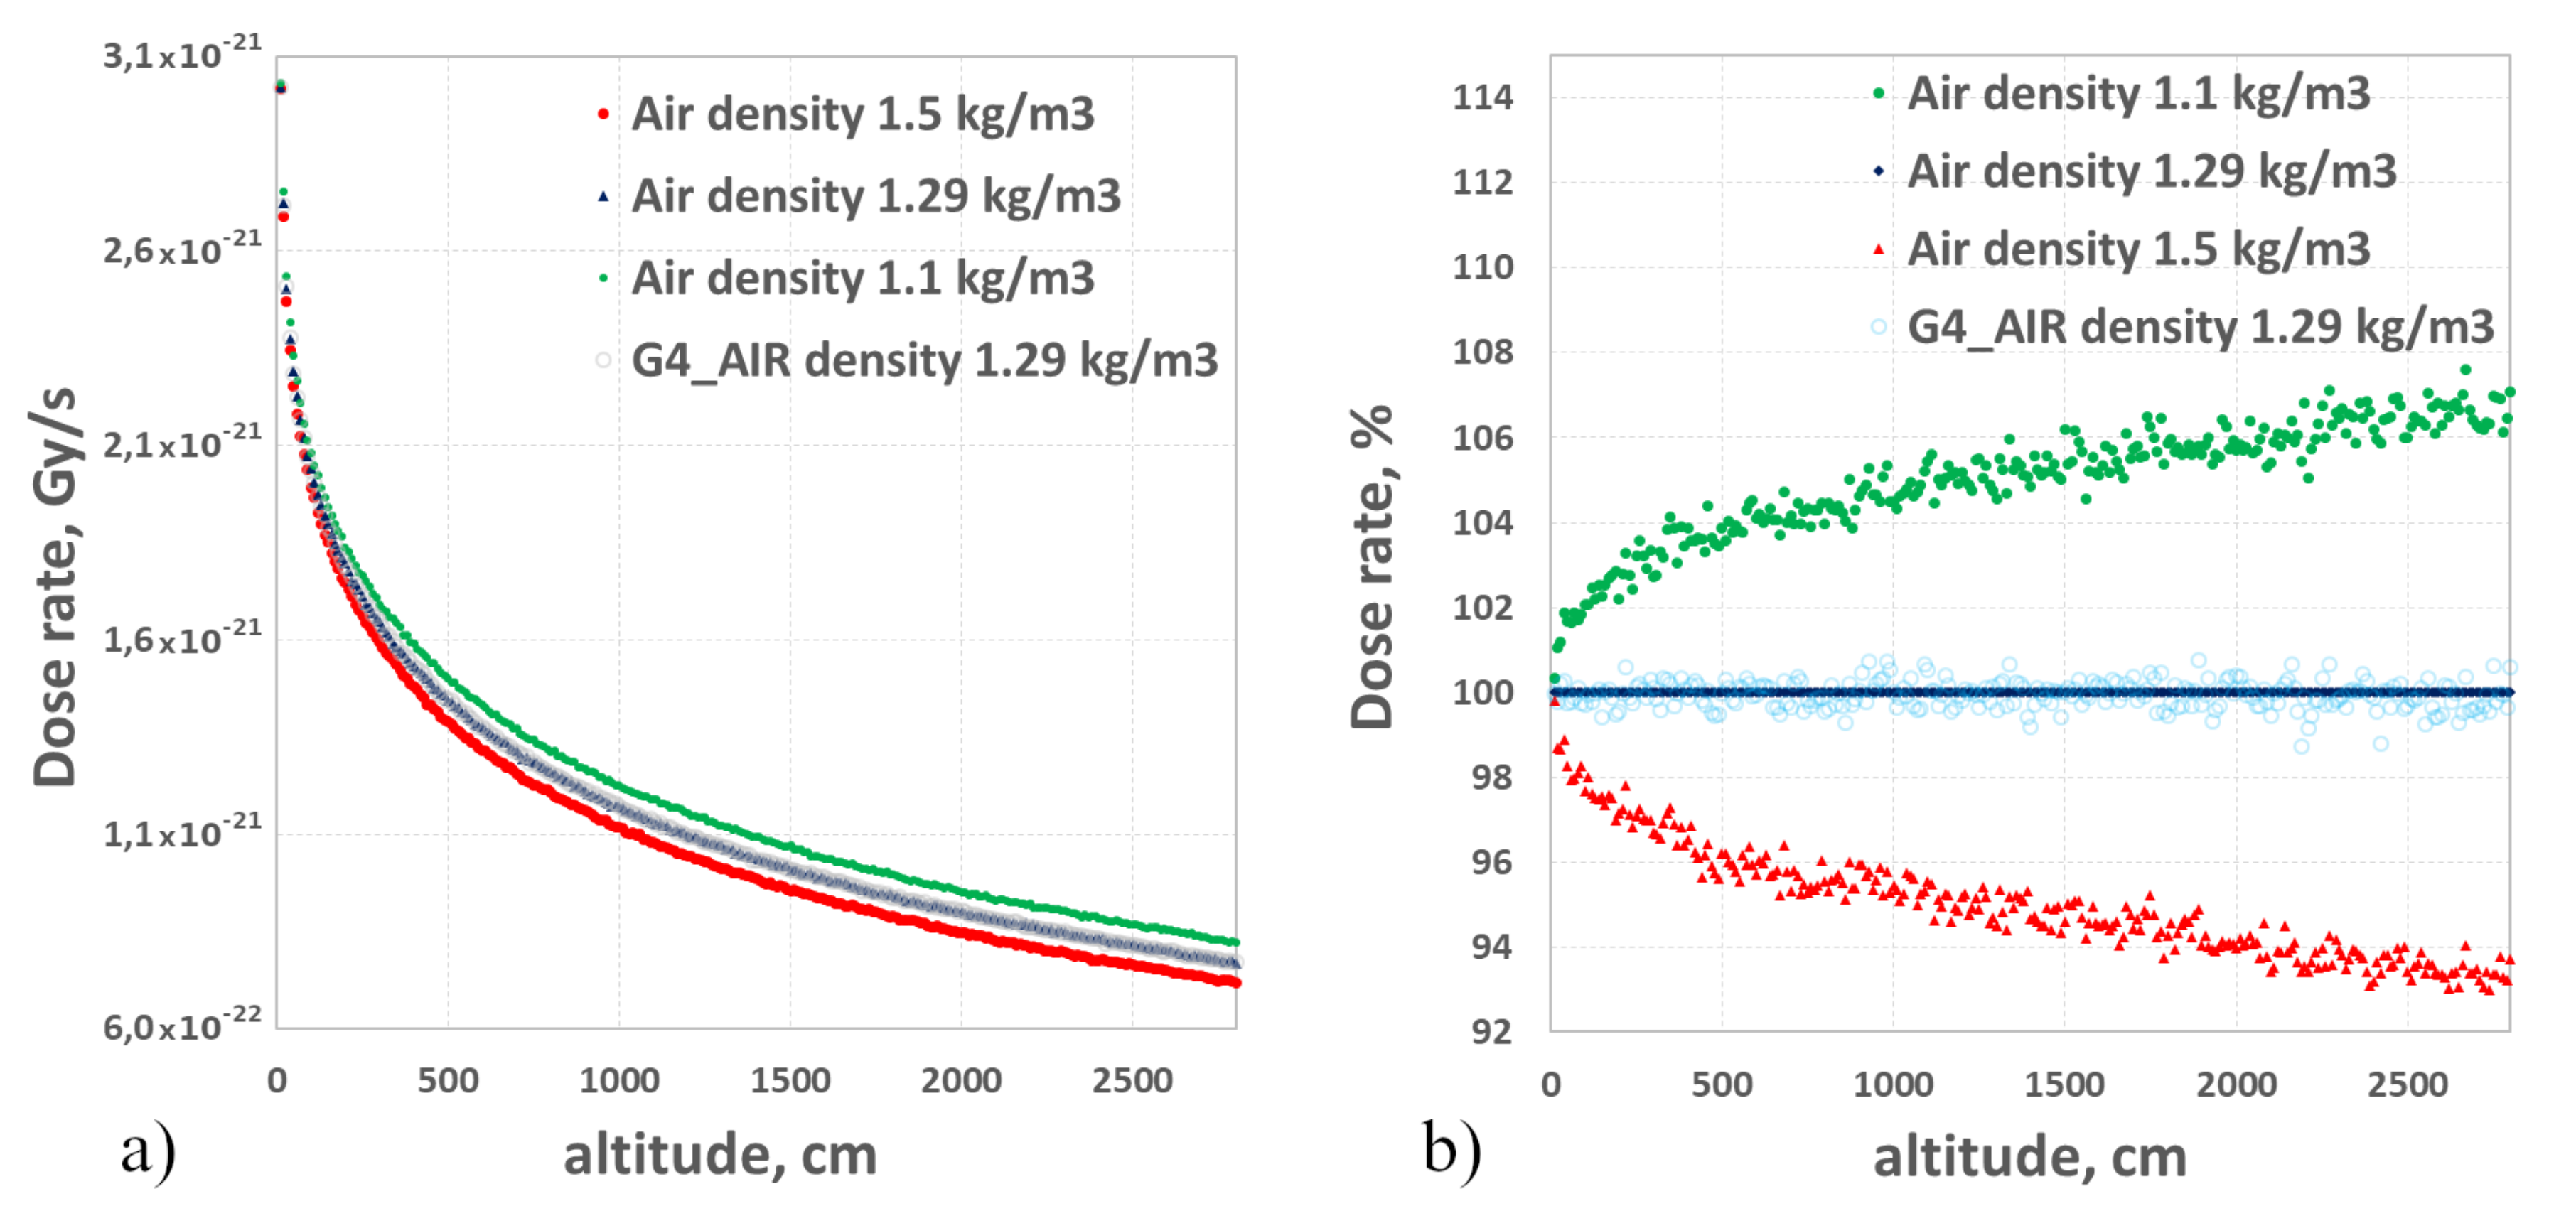
Next the dependence of gamma-radiation dose rate (created per 1 radionuclide decay) on the density of absorber 1 (atmosphere) was simulated. Figure 4a,b show for example the results of modeling of gamma-radiation dose rate formed in the atmosphere due to one decay of Bi, which is evenly distributed in a 1 mm thick soil layer under variant V2. Another atmospheric composition from the Geant4 library (labeled as G4_AIR in Figure 4) was taken for verification. Figure 4b shows the same results, but as a percentage of the values obtained with an air density of 1.29 kg/m.

Figure 4.
Changes of simulated gamma-ray dose rate per 1 disintegration of 214Bi with altitude for different atmosphere density. (a) represents the Gy/S form, and (b) represents the percentage form.
Analysis of the simulation results showed that the atmospheric density influences the -background depending on height. It is around 2% at the recommended measurement height of 1 m, but at heights higher than 1 m the atmospheric density should be taken into account in the simulation. At an atmospheric density of 1.1 kg/m, the gamma dose rates at 5 m and 20 m are increased by 4% and 6%, respectively. The higher the gamma radiation detector is installed, the more the measurement results will differ when the atmospheric density changes, which strongly depends on the season of the year. But still, the influence of atmospheric density is weaker compared to other factors, for example, precipitations, that can cause an increase of dose rate up to 100% and more.
4.4. Precipitated Activity-to-Dose Rate Conversion Factors for Rn and Tn DPs
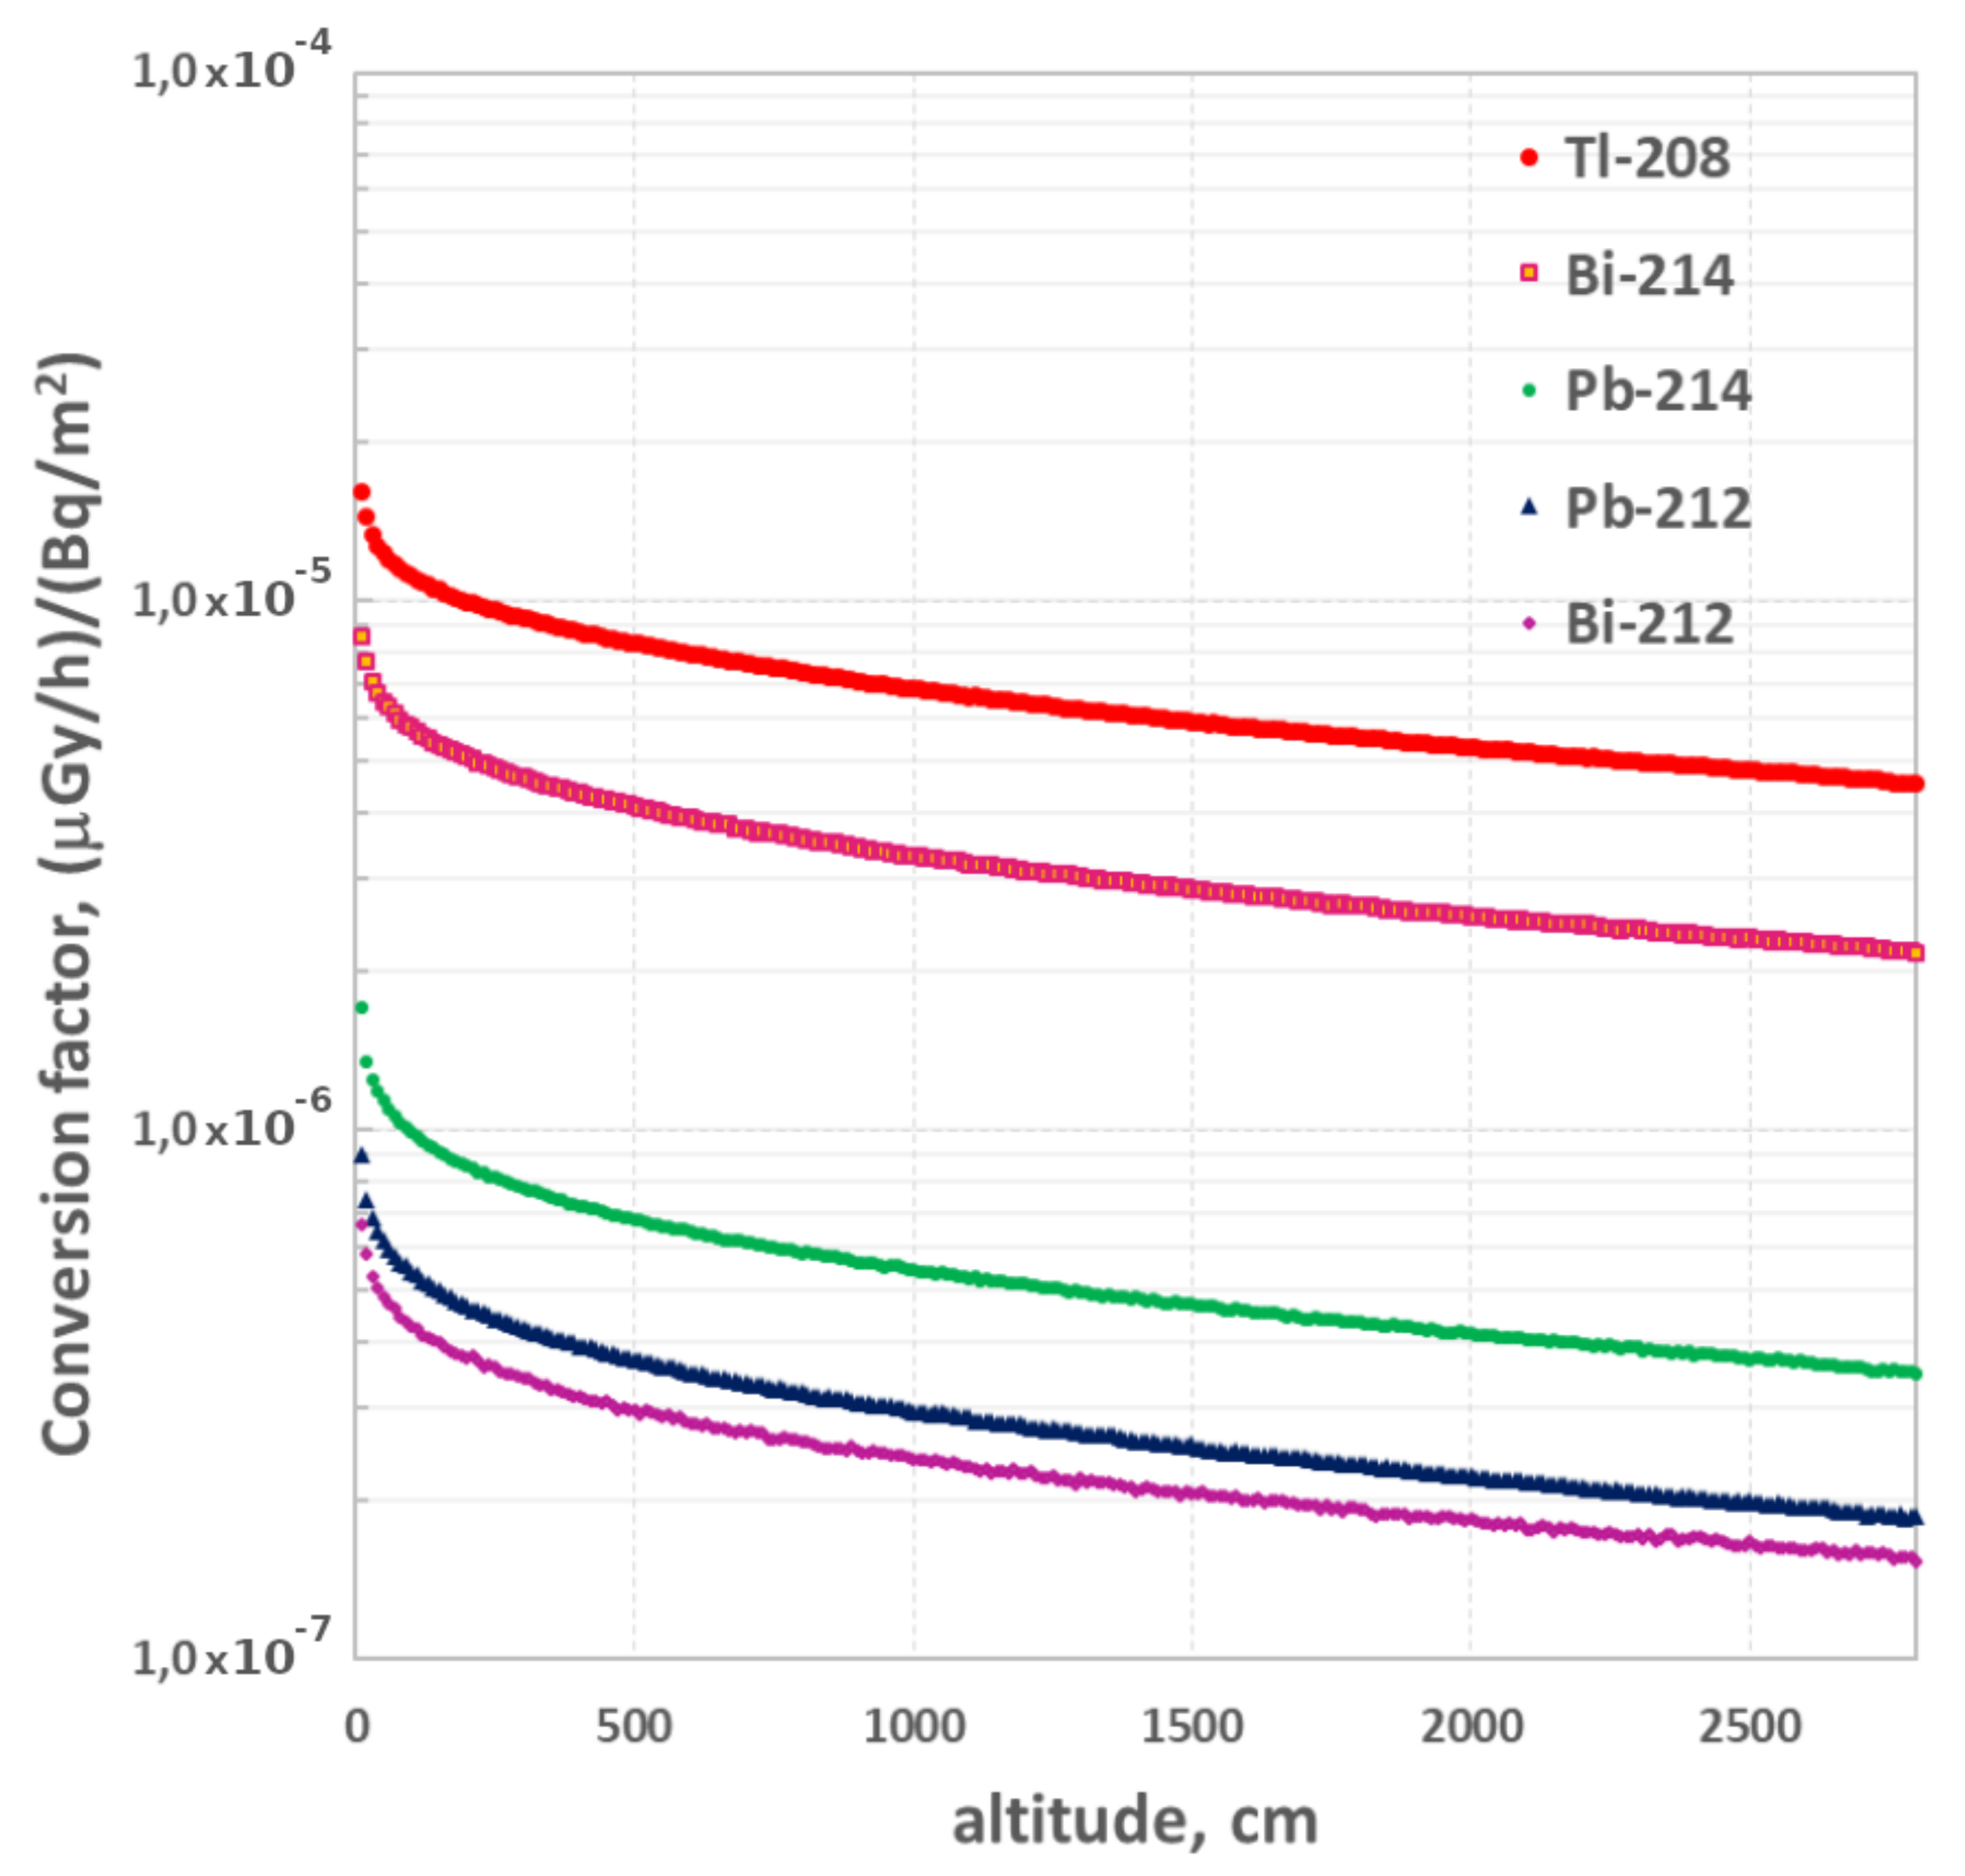
Conversion factors were calculated for each radionuclide Bi, Bi, Pb, Pb and Tl to determine the contribution of each radionuclide to the total gamma background. Simulation results for variant V2 are shown in Figure 5. Absorbed dose rate per radionuclide G decay has been recalculated into conversion factors taking into account radiation weighting factor (quality factor) that is 1 for beta and gamma-radiation. We also recalculated the surface activity deposited per m to represent the factor in units of (Sv/h)/(Bq/m).
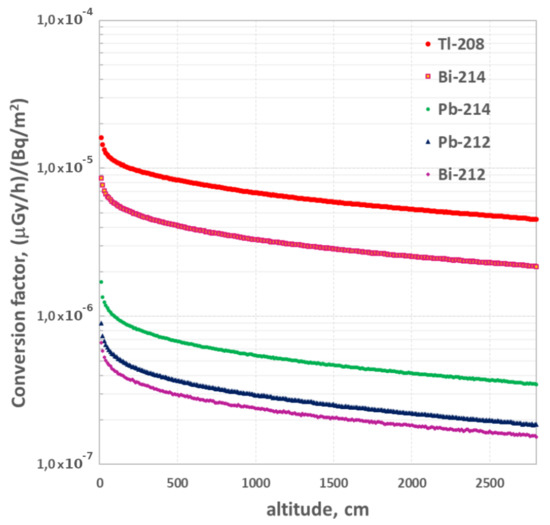
Figure 5.
Changes of simulated conversion factor for decay products of Rn and Tn.
Analysis of the modeling results revealed that the main contributor to the absorbed dose rate is Tl, which is a product of thoron decay, followed by Bi (DP of radon). It means that with the comparable activity of radon and thoron in the atmosphere the products of thoron decay should be taken into account when modeling gamma background response to atmospheric precipitation. This conclusion is somewhat different from the traditional notions [8,16]. To reinforce the importance of accounting for thoron DPs that we will discuss in Section 5, consider the non-traditional behavior of gamma background after precipitation ends, as was observed at GO IMCES.
The radionuclides Pb, Pb, and Bi contribute about an order of magnitude less to the gamma radiation dose, yet they cannot be ignored in the simulations either, as will be shown in Section 5.
Since, as was said earlier, the calculated conversion factors are universal and do not depend on geological and geographic conditions, we recommend them for use in any part of the globe. We describe how to use these conversion factors in the Appendix A.
4.5. Influence of the Precipitation Location (Shortest Distance to Its Coverage Area) in Relation to the Gamma Radiation Detector
Anomalous bursts are frequently observed in radiation monitoring data. By gamma background response shape they can be classified as related to precipitation, while no single precipitation gauge has registered rain.
To determine at what distance from the gamma-radiation detector to the nearest edge of the rain cloud projection on the Earth surface (the area of rain coverage together with precipitated radionuclides-radon and thoron DPs) the detector will still register an increase in gamma background above the background value we formed another physical model.
The model is the same as described earlier, except that:
- (a)
- the source is a thin cylinder (a “puddle” of water with radionuclides) with a radius of 500 m (assuming that the linear dimensions of the cloud are about 1 km, whose edge is moved away from the detector at a given distance;
- (b)
- because of the previous fact, size of the outer cylinder is increased to 5 km and size of the inner cylinder is shrunk to 1 m in radius, thus providing lower statistics for the same number of events (decays);
- (c)
- inner cylinder is composed of 10 cm thick layers from to 120 m.
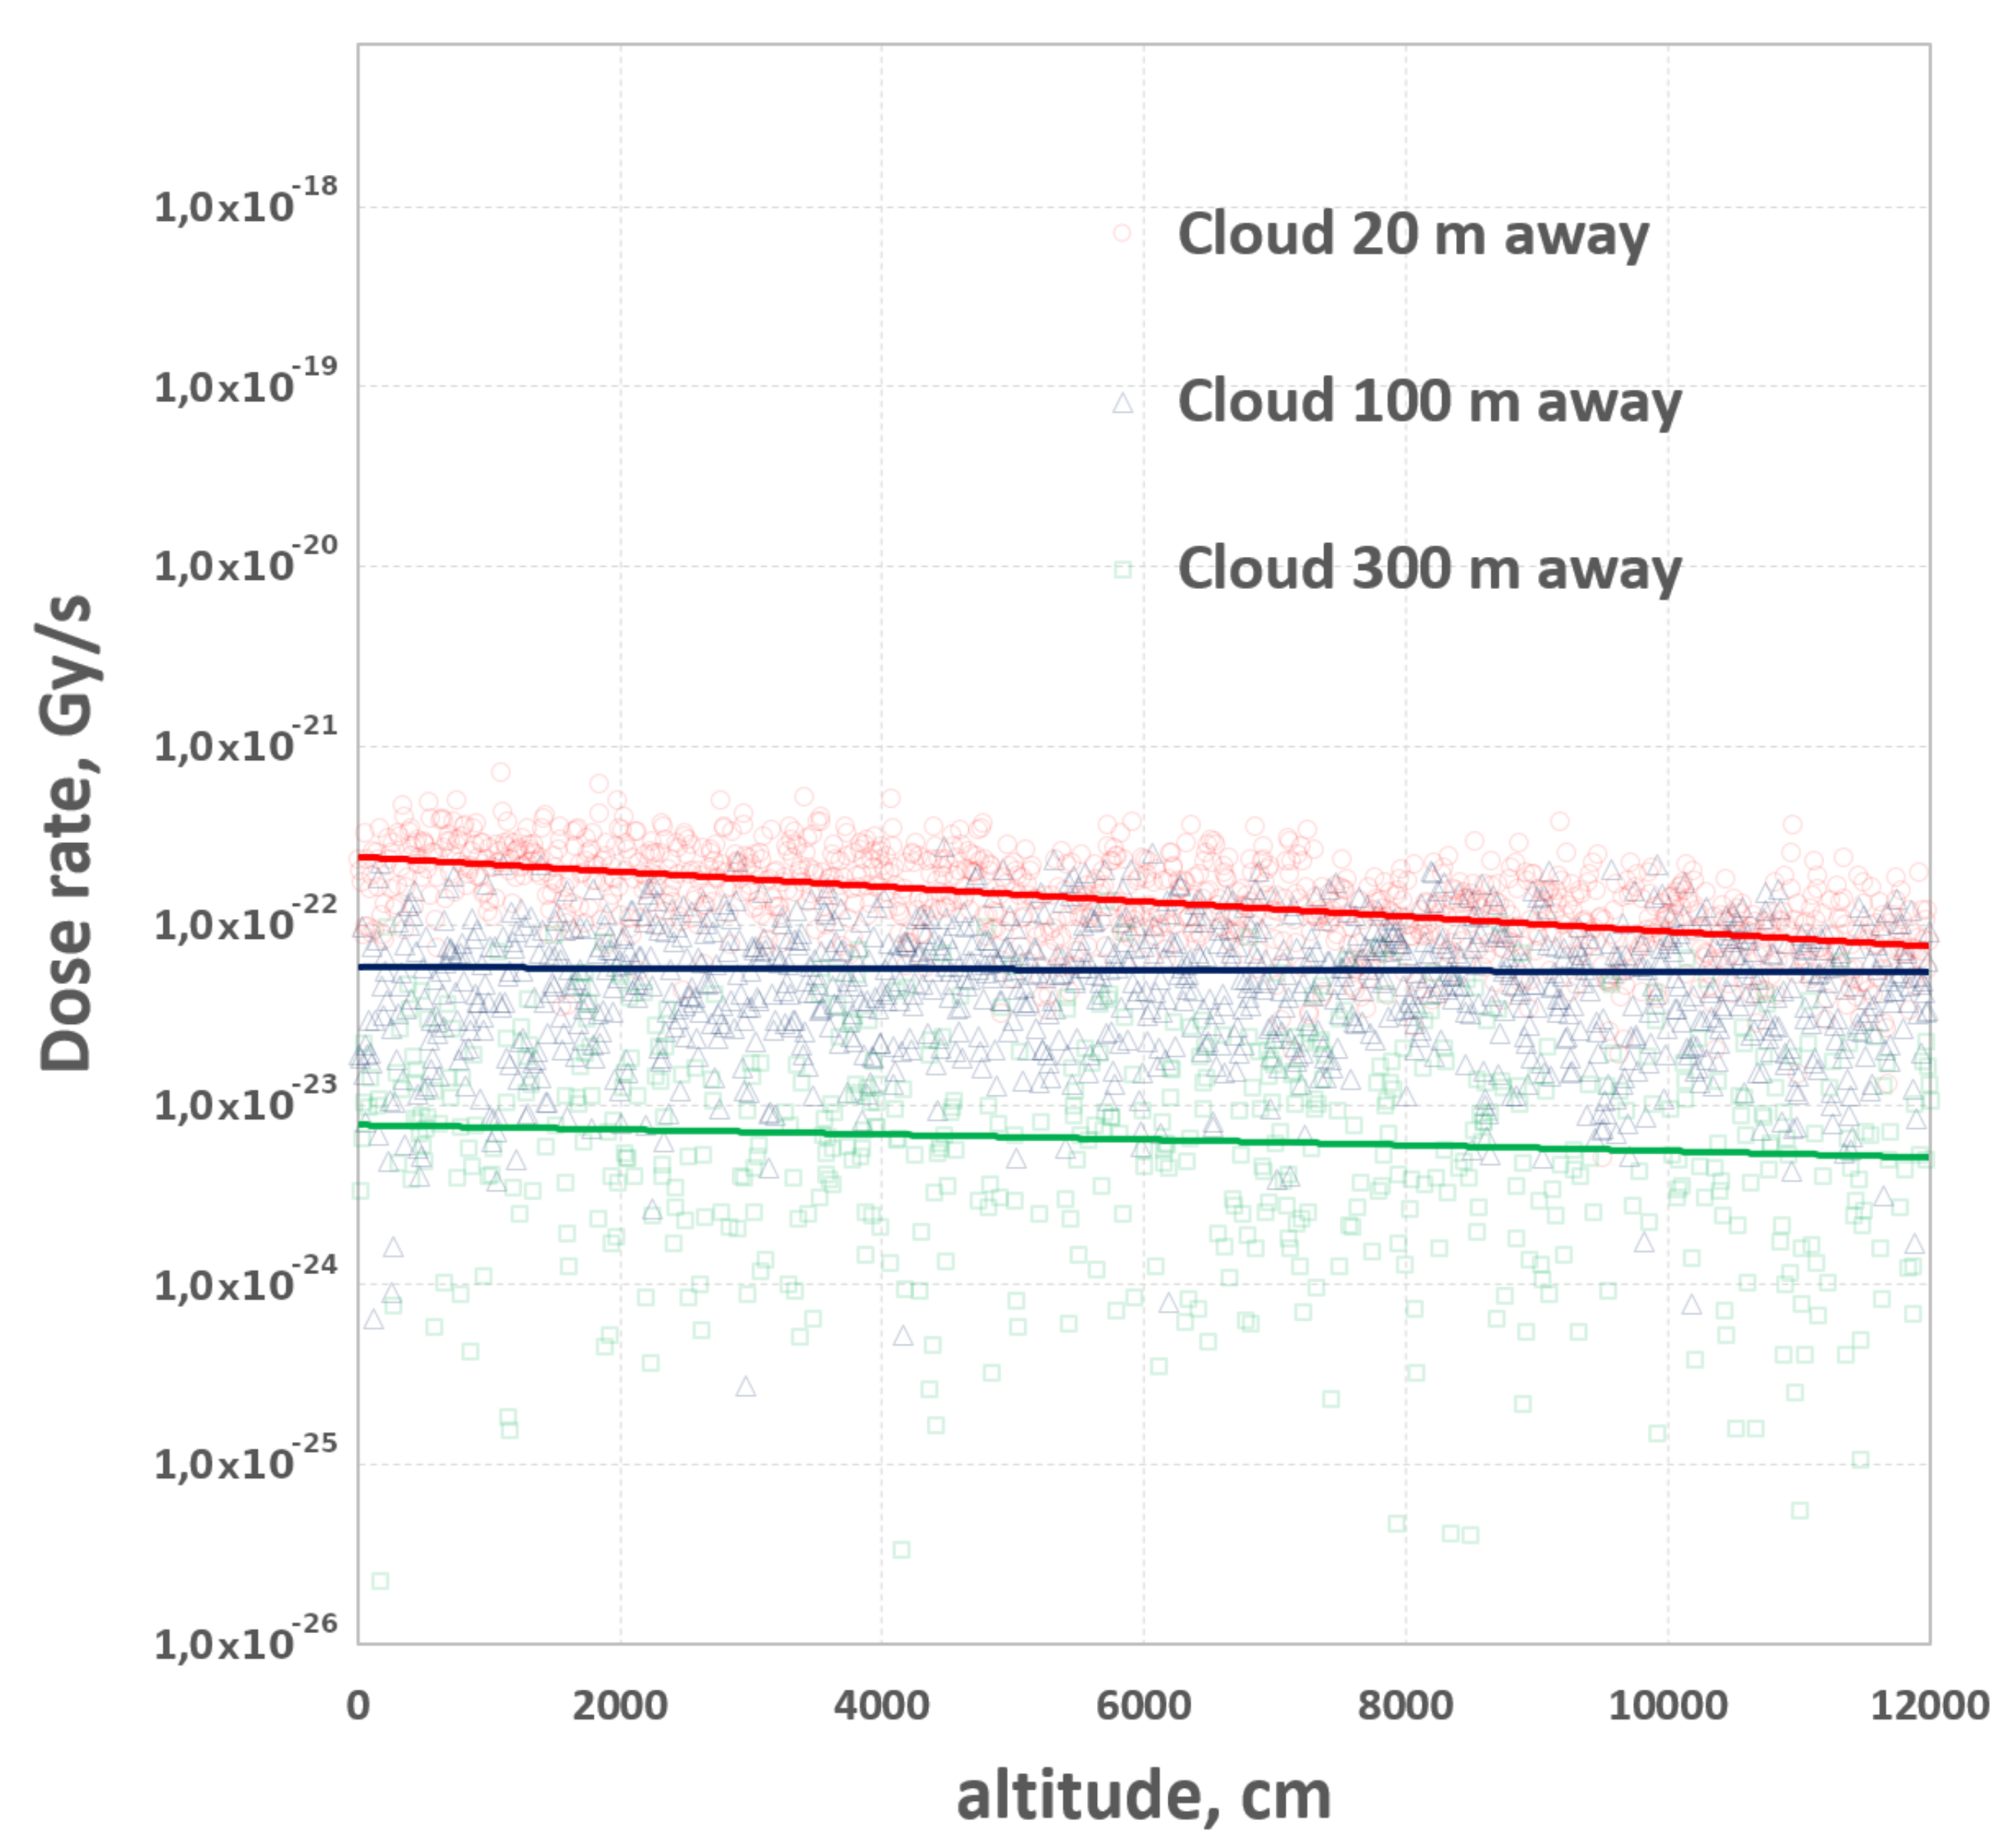
We have calculated the cases when the source is distant at 20 m, 100 m, and 300 m.
The results are shown in Figure 6. Due to the increased size of the calculation area and the restrictions in the Geant4 toolkit on the maximum number of events in one calculation, a large scatter in the values were obtained.
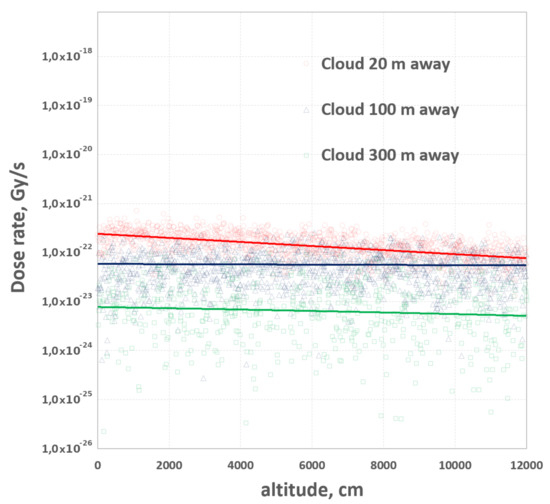
Figure 6.
Influence of rain passed by the side from the place of measurement on the dose rate per 1 decay of Bi.
Nevertheless, one can see (Figure 6) that close passing rains can still cause a response in the measured gamma-ray background, all that is valid for different heights of the detector location. Even if the rain passed from the detector located at a distance of about 300 m away, we will be able to register some changes in the gamma background if the activity of DPs radionuclides of radon isotopes is large enough. For more detailed conclusions we need additional calculations, where we will apply some techniques to increase statistics, and perform checks to get stable and reproducible results.
5. Experimental Verification of Modeling Results
The mathematical model described in [6] was used to simulate the dynamics of gamma background during periods of liquid precipitation created by Pb and Bi isotopes deposited on the Earth’s surface.
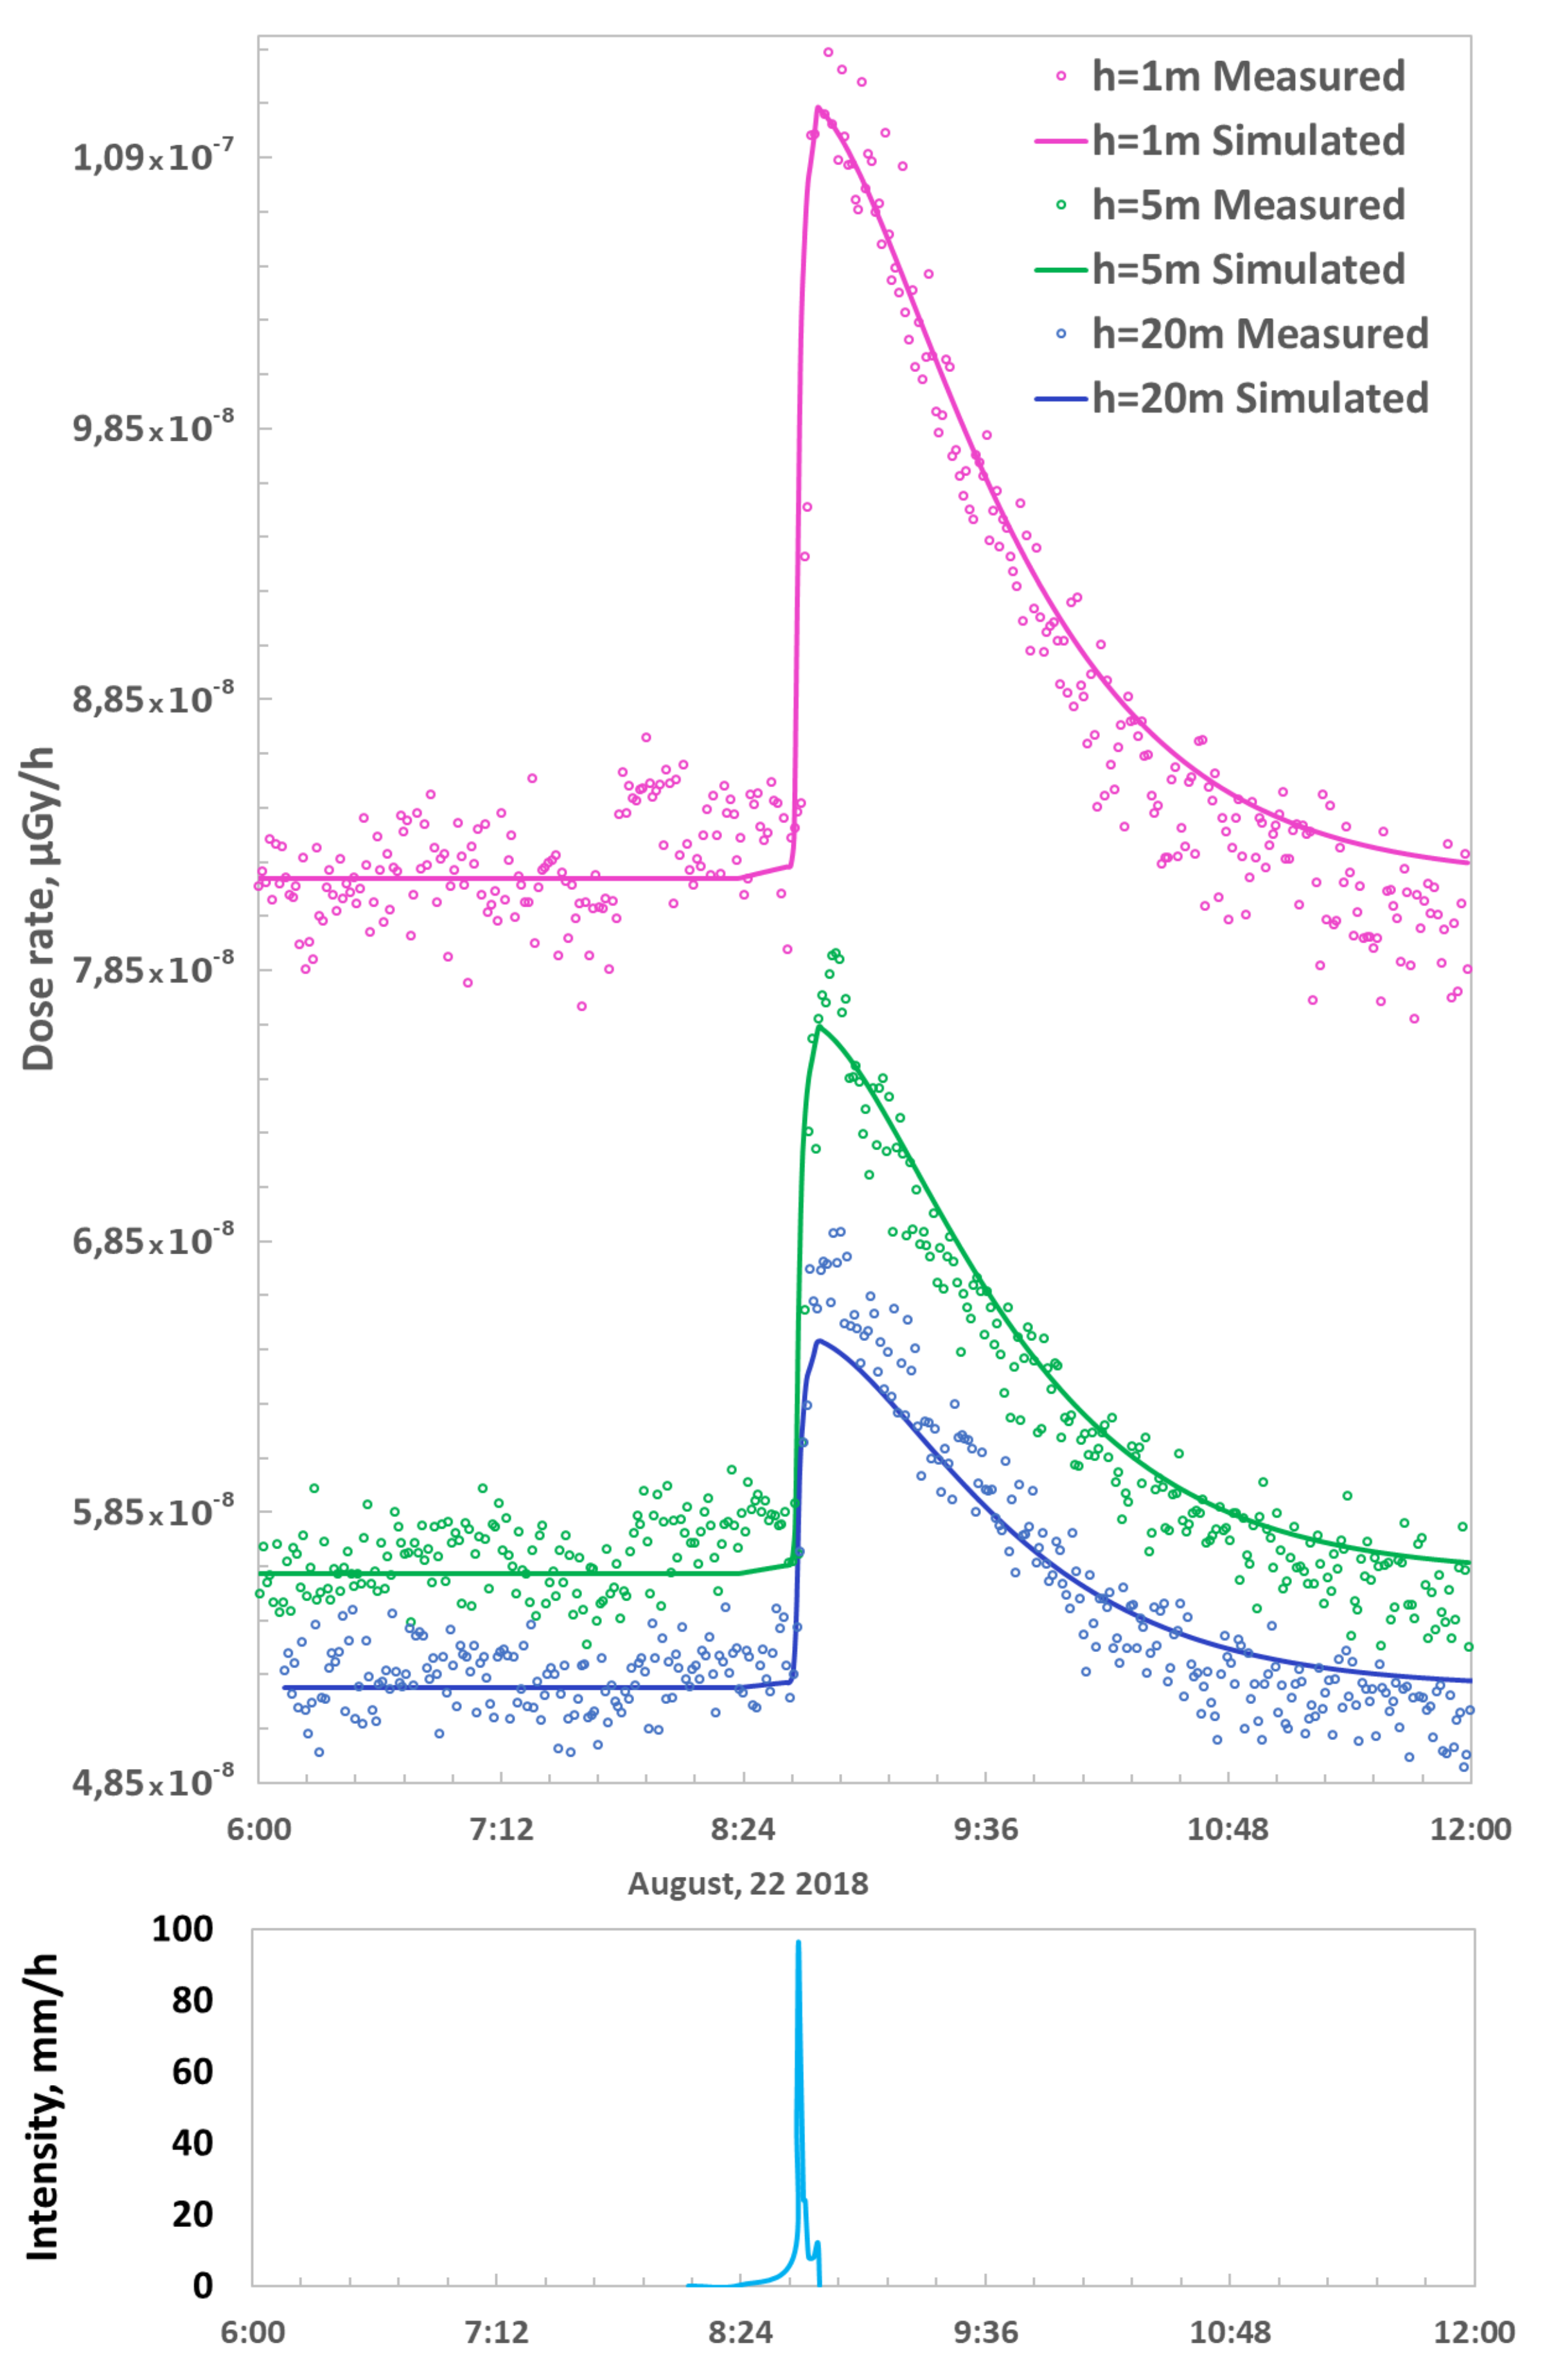
An example of using the conversion factors calculated in Geant4 to reconstruct the dynamics of the gamma radiation dose rate during the heavy rainfall of 22 August 2018 using the [6] model with measured radiation monitoring data is shown in Figure 7. The gamma radiation dose rate was measured at 3 heights simultaneously (1 m, 5 m, and 20 m) in Geophysical Observatory of IMCES SB RAS with BDKG-03 gamma radiation detectors (ATOMTEX, Republic of Belarus) with a data sampling rate of 1 min. Precipitation intensity data with a high temporal resolution were recorded by a Davis Rain Collector II shuttle rain gauge (Davis Instruments, USA), the WXT520 meteorological station (Vaisala, Finland), and the OPTIOS optical (laser) rain gauge. The average value of radon flux density measured by radiometer Alfarad (Russia) was 51.2 mBq/ms.
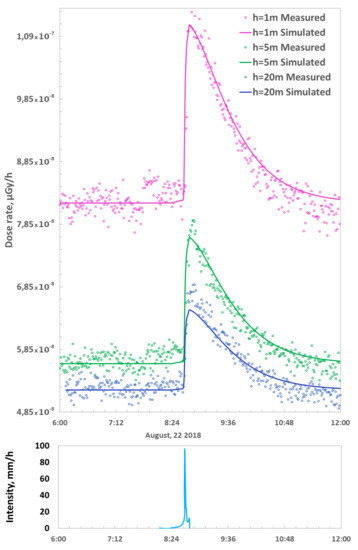
Figure 7.
Measured (circles) and calculated dose rate (solid line) during heavy rain (sky blue) at heights of 1 m (magenta), 5 m (green), and 20 m (blue). Bottom panel shows measured rain intensity.
Comparison of experimental data with simulation results using conversion factors calculated in Geant4 allowed obtaining good agreement (Figure 7) at different measurement heights.
The gamma radiation detector located at the height of 20 m from the ground surface is fixed on the flat roof with the rims of the IMCES building. During rainfall, DPs of radon isotopes may accumulate on the roof, which is an additional source of radionuclides deposited by rain. While it influences dose rate at 20 m, it could also affect 1 and 5 m to a lesser degree. Perhaps this can explain the fact that the measured gamma background at the peak is slightly higher than the calculated one.
Usually, the gamma-background after rain decreases exponentially within ≈3 h due to radioactive decay of radon DPs to the value that was observed before the rain (if the soil moisture remained virtually unchanged), or lower when the soil moisture increased significantly after the rain.
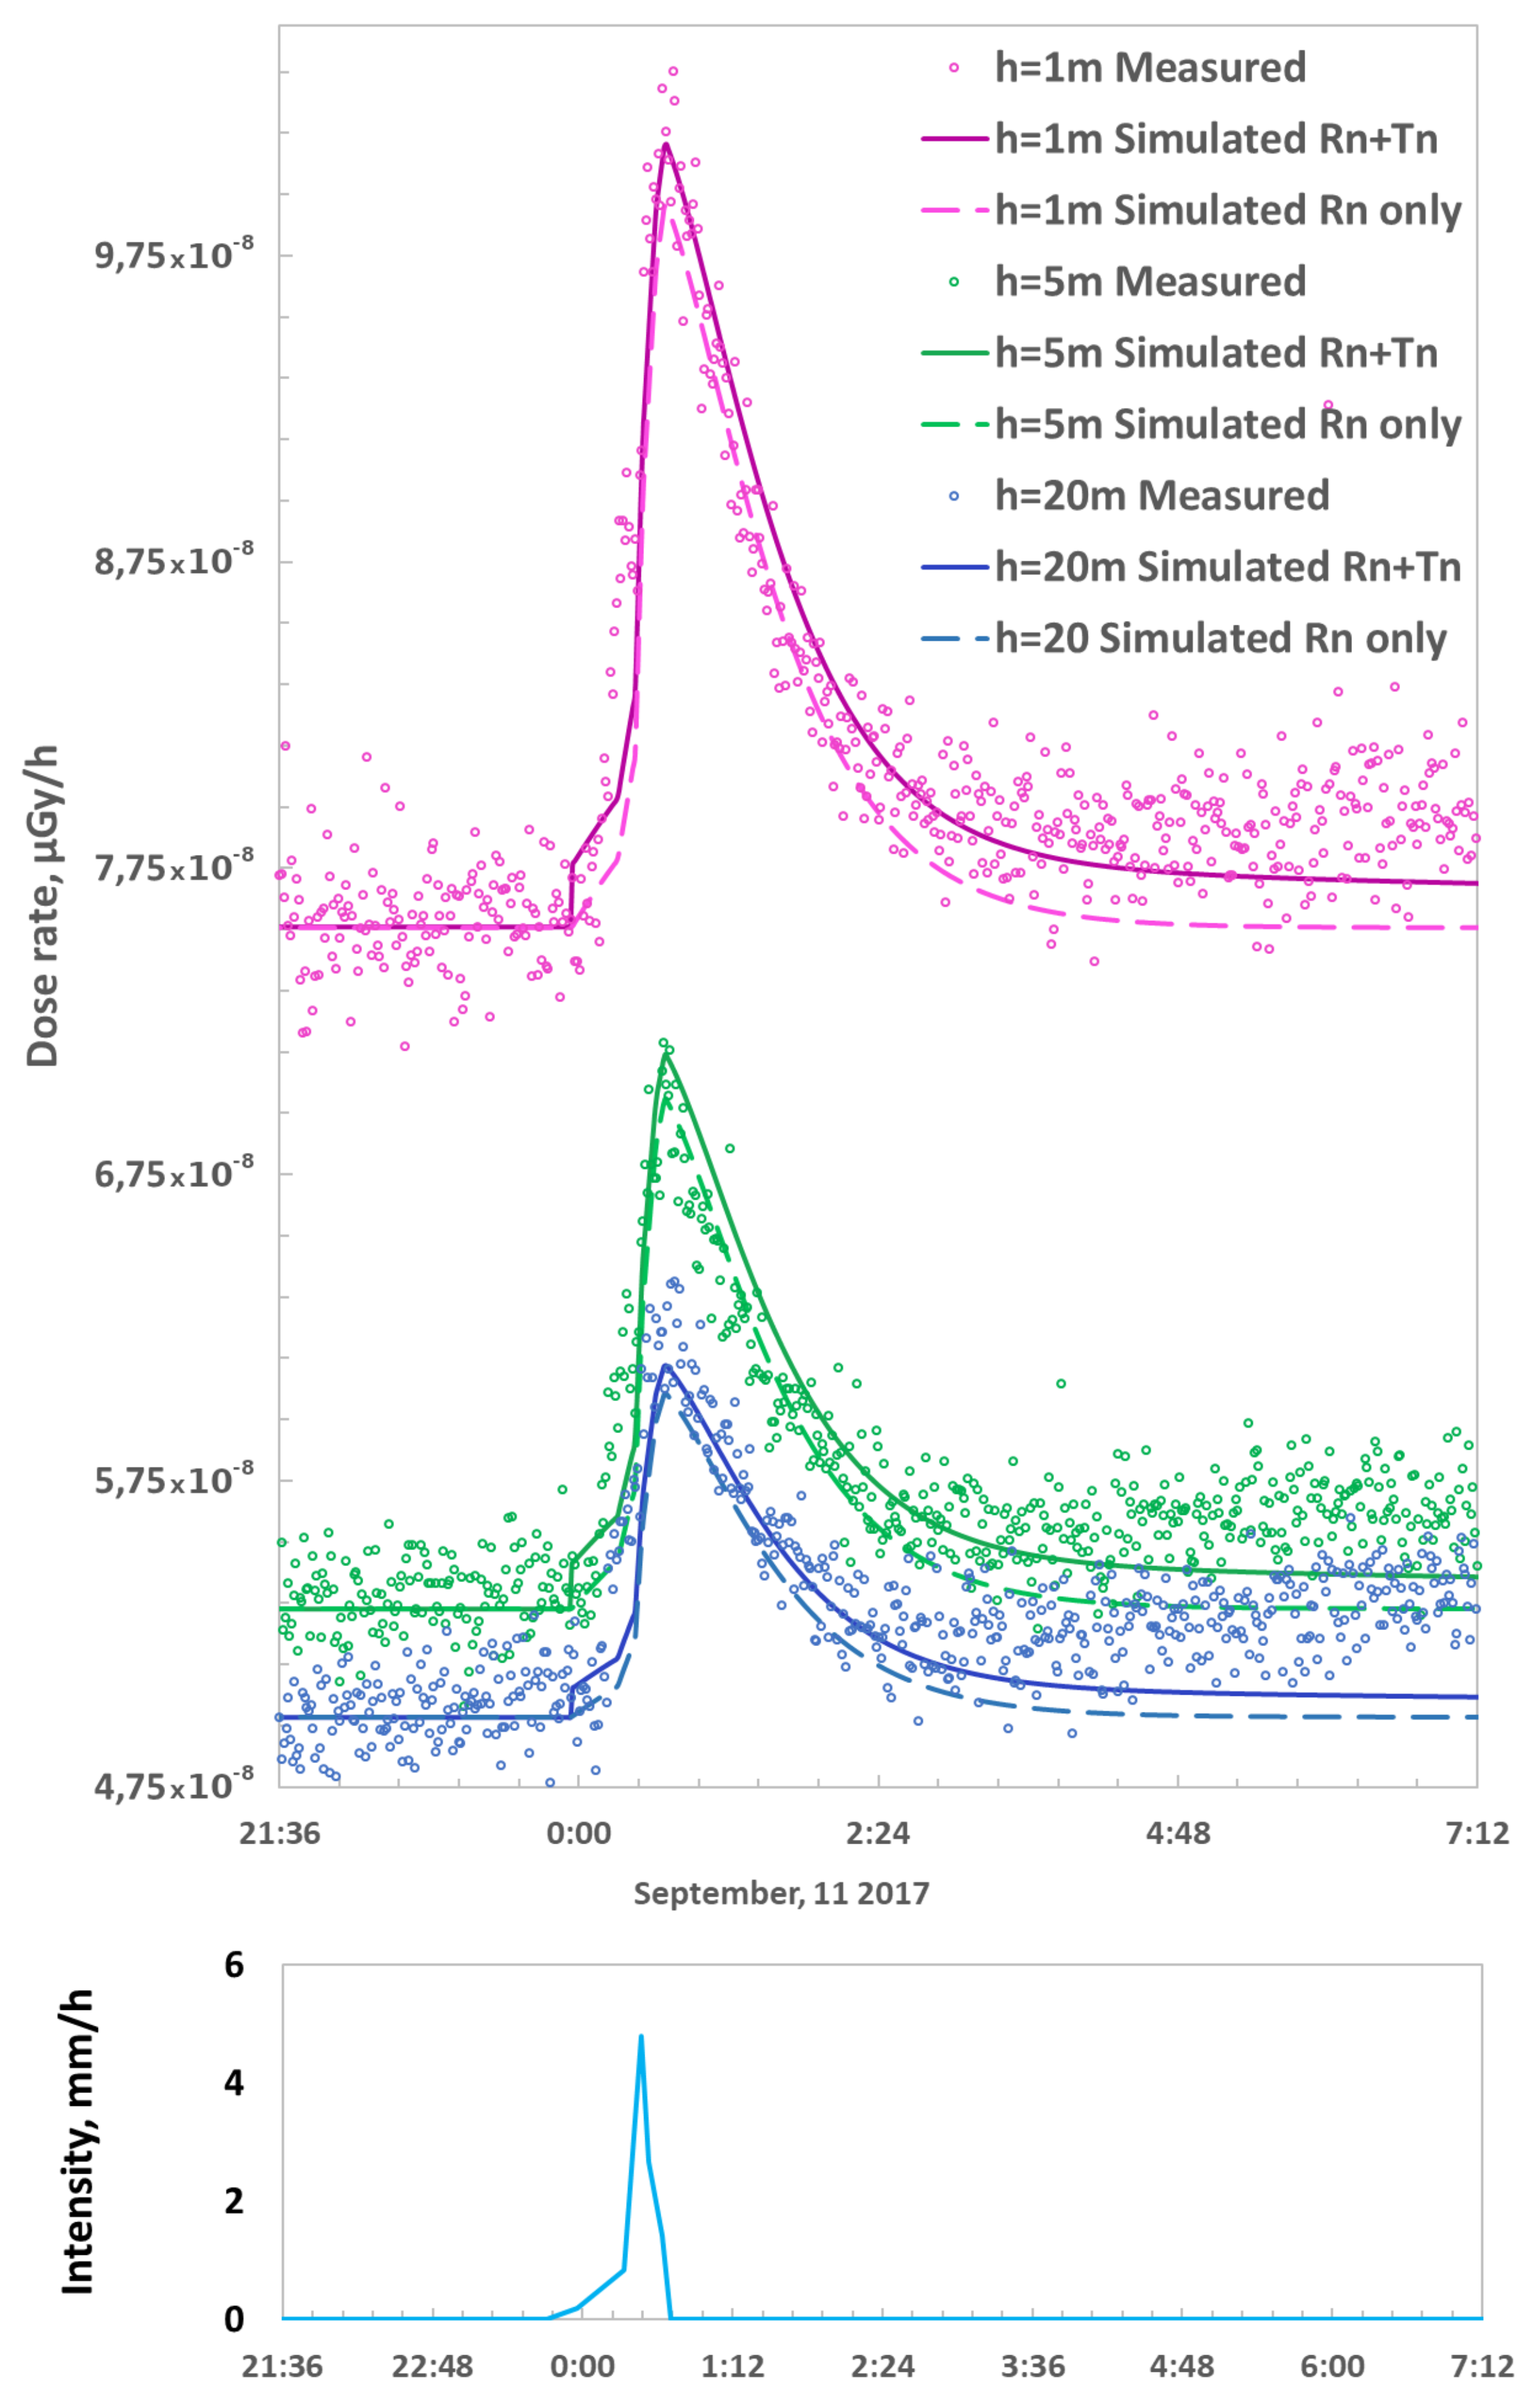
Next, let us consider the extraordinary case when, after the rain, the gamma background did not decrease to its original value, which can be seen in Figure 8. The explanation here can only be the emergence of an additional source. In the Tomsk region, there is a Tuganskoye deposit of titanium-zirconium sands with elevated thorium content. By wind streams, the naturally formed gas thoron can reach the territory where radiation monitoring is carried out (GO IMCES SB RAS).
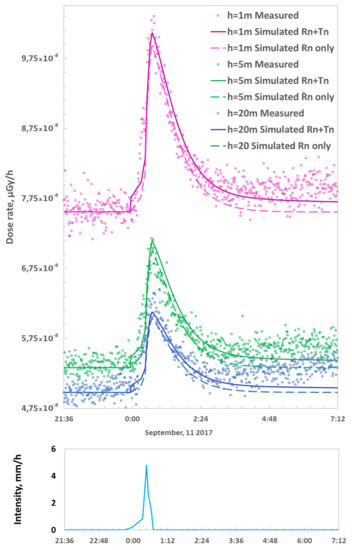
Figure 8.
Measured (circles), calculated dose rate using only Rn DPs (transparent solid line) and calculated dose rate using Rn + Tn DPs (opaque solid line), during rain (sky blue) at heights of 1 m (magenta), 5 m (green), and 20 m (blue). Bottom panel shows measured rain intensity.
In modeling the dynamics of the gamma background during the rain on 11 September 2017, we took into account the DPs of thoron. The mean value of the measured radon flux density was 49.9 mBq/mms. The thoron flux density was chosen so that the shape of the gamma-ray background response coincided with the measured one (Figure 8, magenta, simulated values–solid line). When the thoron flux density is 5000 mBq/mms, a good agreement between the measured and calculated data was obtained. If thoron, or rather its DPs, are not taken into account, the exponential decay after the end of precipitation is different (“Rn only” in Figure 8). The radioactive decay of the thoron’s DPs lasts for about five half-lives of Pb (≈53 h). The continuing increase in gamma-background after 3:00 A.M. is well explained by the increase in thoron activity up to 150–170 Bq/m recorded by the EQF 3200 radiometer (SARAD, Germany) installed at a height of 1 m from the Earth’s surface.
6. Conclusions
A physical model was developed and a C++ program was written to simulate the gamma-radiation dose rate created by radionuclides deposited on the Earth’s surface (decay products of radon isotopes). The activity-to-dose rate conversion factors for Bi, Bi, Pb, Pb and Tl were calculated.
The calculated coefficients are universal constants because they do not depend on the characteristics of the surface on which the radionuclides are deposited during precipitation.
Analysis of simulation results has allowed us to draw the following main conclusions:
- 1.
- When the specific activities of Ra and Th in soil are the same, the main contribution to gamma background is made by Pb and Bi deposited on the soil. While the daughter products of thoron decay weakly influence the shape of gamma background response.
- 2.
- When the Th specific activity is 2 times more than Ra specific activity, the precipitated thoron daughter decay products begin to contribute significantly to the gamma background and noticeably change the shape of the gamma background response in the tail part.
- 3.
- Atmospheric density can make a serious contribution of up to 6–7% to the calculated conversion factor at heights of about 20 m. Even at the recommended measurement height of 1 m, the conversion factor differs by 4–5% in the density variation ranging from 1.1 to 1.5 kg/m.
- 4.
- It was shown that if the rain cloud passes within 300 m of the detector, the detector still registers an increase in gamma background. These simulation results helped explain the bursts in radiation monitoring results in the absence of precipitation (as reported by nearby precipitation gauges).
- 5.
- Results of verification of gamma background by comparing calculated and experimental data showed good agreement at all available measurement heights (up to 20 m).
- 6.
- Previously, thoron and its decay products were undeservedly not taken into account when studying the influence of precipitation on gamma background. Consideration of thoron decay products made it possible to explain the anomalous experimental data in the tail part, after the end of precipitation.
The results obtained can be useful for modeling the dynamics of the radiation background during the periods of precipitation, as well as for determining the characteristics of precipitation by the measured gamma-background, for allowing to conduct deciphering of gamma-background by the form of response to various natural and man-made phenomena.
Author Contributions
V.Y.—research idea, formulation of research goals and objectives, validation of the model, guidance and consulting, analysis of calculation results, and final copy of the manuscript. G.Y.—investigation, obtaining analytical solutions, analysis of experimental data, visualization and verification of results, validation of the model, draft and final copy of the manuscript. R.P.—consulting, literature analysis, analysis of experimental data, part of the manuscript draft. S.S.—experimental data gathering and analysis, analysis of literature. A.K.—analysis of literature, experimental data gathering, and analysis. All authors have read and agreed to the published version of the manuscript.
Funding
This research was supported by the TPU development program.
Institutional Review Board Statement
Not applicable.
Informed Consent Statement
Not applicable.
Data Availability Statement
The data presented in this study are available on request from the corresponding author. The data are not publicly available due to privacy reasons.
Acknowledgments
The work was performed using equipment of TPU and IMCES SB RAS.
Conflicts of Interest
The authors declare no conflict of interest. The funders had no role in the design of the study; in the collection, analyses, or interpretation of data; in the writing of the manuscript, or in the decision to publish the results.
Abbreviations
The following abbreviations are used in this manuscript:
| U | uranium |
| Ra | radium |
| Rn | radon |
| Tn | thoron |
| Po | polonium |
| Pb | plumbum/lead |
| Bi | bismuth |
| Tl | thallium |
| Th | thorium |
| TPU | Tomsk Polytechnic University |
| IKIR FEB RAS | Institute of Cosmophysical Research and Radio Wave Propagation, |
| Far Eastern Branch of the Russian Academy of Sciences | |
| IMCES SB RAS | Institute of Monitoring of Climatic and Ecological Systems |
| of Siberian Branch of the Russian Academy of Sciences |
Appendix A. How to Use the Conversion Factor
To calculate the gamma background at a certain altitude h, you need to know the activity of the deposited radionuclide G for example at time t. So the dose rate for radionuclide G will be written as:
The conversion factors obtained in this work have been approximated for ease of use by the function of the following form:
where h should be in m (factor 100 is because approximation uses cm).
Coefficients for investigated radionuclides are shown in the Table A1.
So, to calculate gamma background dose rate at certain height h you should use following equations:
where is gamma background dose rate value and is dose rate change, caused by precipitation.
The change comes from gamma active DPs of radon and thoron.
These values can be calculated with known deposited (on the soil surface) activities .
Table A1.
Coefficients for calculation of conversion factor was fitted in Wolfram Mathematica for model with 99% confidence level.
Table A1.
Coefficients for calculation of conversion factor was fitted in Wolfram Mathematica for model with 99% confidence level.
| Radionuclide | a | b | c | d | e |
|---|---|---|---|---|---|
| Tl | 1.357440 | −1.363800 | 1.339920 | 1.822760 | 35.80180 |
| Pb | −2.160049 | 2.165176 | 4.685082 | −1.123887 | 37.93503 |
| Pb | −6.218427 | 6.236076 | 6.260681 | −4.112762 | 45.72015 |
| Bi | 1.107153 | 2.121279 | 2.28036 | −8.247985 | 37.12863 |
| Bi | 4.604623 | −4.617816 | 7.632427 | 3.432754 | 63.01430 |
References
- Burnett, J.L.; Croudace, I.W.; Warwick, P.E. Short-lived variations in the background gamma-radiation dose. J. Radiol. Prot. 2010, 30, 525. [Google Scholar] [CrossRef] [PubMed]
- Fujinami, N.; Watanabe, T.; Tsutsui, T. Looping variation of correlation between radon progeny concentration and dose rate in outdoor air. In Radioactivity in the Environment; Elsevier: Amsterdam, The Netherlands, 2005; Volume 7, pp. 284–289. [Google Scholar]
- Takeuchi, N.; Katase, A. Rainout-washout model for variation of environmental gamma-ray intensity by precipitation. J. Nucl. Sci. Technol. 1982, 19, 393–409. [Google Scholar] [CrossRef]
- Mercier, J.F.; Tracy, B.L.; d’Amours, R.; Chagnon, F.; Hoffman, I.; Korpach, E.P.; Ungar, R.K. Increased environmental gamma-ray dose rate during precipitation: A strong correlation with contributing air mass. J. Environ. Radioact. 2009, 100, 527–533. [Google Scholar] [CrossRef] [PubMed]
- Melintescu, A.; Chambers, S.D.; Crawford, J.; Williams, A.G.; Zorila, B.; Galeriu, D. Radon-222 related influence on ambient gamma dose. J. Environ. Radioact. 2018, 189, 67–78. [Google Scholar] [CrossRef] [PubMed]
- Yakovleva, V.; Zelinskiy, A.; Parovik, R.; Yakovlev, G.; Kobzev, A. Model for Reconstruction of γ-Background during Liquid Atmospheric Precipitation. Mathematics 2021, 9, 1636. [Google Scholar] [CrossRef]
- Inomata, Y.; Chiba, M.; Igarashi, Y.; Aoyama, M.; Hirose, K. Seasonal and spatial variations of enhanced gamma ray dose rates derived from 222Rn progeny during precipitation in Japan. Atmos. Environ. 2007, 41, 8043–8057. [Google Scholar] [CrossRef]
- Liu, H.; Daisuke, K.; Motokiyo, M.; Hirao, S.; Moriizumi, J.; Yamazawa, H. On the characteristics of the wet deposition process using radon as a tracer gas. Radiat. Prot. Dosim. 2014, 160, 83–86. [Google Scholar] [CrossRef] [PubMed]
- Valković, V. Radioactivity in the Environment. Science 2000, 696, 5–32. [Google Scholar] [CrossRef]
- Satheeshkumar, G.; Hameed, P.S.; Pillai, G.S.; Anbusaravanan, N. Environmental radioactivity evaluation in the coastal stretch of Bay of Bengal from Pondycherry to Velanganni (South East coast of India). Radiat. Prot. Environ. 2012, 35, 90–95. [Google Scholar] [CrossRef]
- Whittlestone, S.; Zahorowski, W.; Schery, S.D. Radon flux variability with season and location in Tasmania, Australia. J. Radioanal. Nucl. Chem. 1998, 236, 213–217. [Google Scholar] [CrossRef]
- Allison, J.; Amako, K.; Apostolakis, J.; Arce, P.; Asai, M.; Aso, T.; Bagli, E.; Bagulya, A.; Banerjee, S.; Barrand, G.; et al. Recent developments in Geant4. Nucl. Instrum. Methods Phys. Res. 2016, 835, 186–225. [Google Scholar] [CrossRef]
- Eckerman, K.; Endo, A. ICRP Publication 107. Nuclear decay data for dosimetric calculations. Ann. ICRP 2008, 38, 7. [Google Scholar] [PubMed]
- Yakovleva, V.S.; Parovik, R.I. Solution of diffusion-advection equation of radon transport in many-layered geological media. Nukleonika 2010, 55, 601–606. [Google Scholar]
- Tuli, J.K. Evaluated nuclear structure data file. In Nucl. Instrum. Methods Phys. Res. Sect. A Accel. Spectrome. Detect. Assoc. Equip.; 1996; 369, pp. 506–510. Available online: http://www.nndc.bnl.gov/nudat2/ (accessed on 25 December 2021). [CrossRef] [Green Version]
- Bottardi, C.; Albéri, M.; Baldoncini, M.; Chiarelli, E.; Montuschi, M.; Raptis, K.G.C.; Serafini, A.; Strati, V.; Mantovani, F. Rain rate and radon daughters’ activity. Atmos. Environ. 2020, 238, 117728. [Google Scholar] [CrossRef]


Publisher’s Note: MDPI stays neutral with regard to jurisdictional claims in published maps and institutional affiliations. |
© 2022 by the authors. Licensee MDPI, Basel, Switzerland. This article is an open access article distributed under the terms and conditions of the Creative Commons Attribution (CC BY) license (https://creativecommons.org/licenses/by/4.0/).