Abstract
The study aims to analyze the degree of similarity of some molecules belonging to two subgroups of Aminoalkylindoles. After extracting the molecules’ characteristics using Cheminformatics methods, and the computation of the Tanimoto coefficients, dendrograms and heatmaps were built to reveal the degree of similarity of the analyzed drugs. Some atom-pair similarities between the molecules in the same group were detected. The clusters determined by the k-means method divided the Benzoylindoles into two subgroups but kept all the Phenylacetylindoles together in the same set. The activity spectrum of the elements in each group was also analyzed, and similarities have been emphasized. The clustering has been validated using the Kruskal–Wallis test on the series of computed probabilities of the main effects.
MSC:
92E10; 92C99; 65D99
1. Introduction
The consumption of drugs or psychotropic substances continues to be one of the leading causes of global health problems and mortality among young people and adults [1]. In Europe, the number of drug users has risen alarmingly over the last 10 years, especially among young people in the 14–18 age group [2]. Drug use and addiction produce adverse effects such as emotional (depression, anxiety, or suicide), behavioral (especially aggression), health (e.g., hepatitis B and C), educational/learning (profoundly affecting the long- and short-term memory), brain damage (by brain contraction inducing decreased thinking or impaired thinking perception and intuition, with severe impairment of the central nervous system), and by causing road accidents [3].
Drugs are marketed as “party pills”, “legal highs”, “herbal highs”, “bath salts”, “laboratory reagents”, “designer drugs”, “research chemicals”, or new psychoactive substances (NPS). They represent a real challenge for public health because of their variety and multiplication speed [4,5].
The United Nations Office on Drugs and Crime (UNODC) [6] uses the term “new psychoactive substances” (NPSs) for “substances of abuse, in pure form or in the form of preparations, which are not controlled by the Single Convention on Narcotic Drugs or by the United Nations Convention”. NPSs refer to recent drugs and other substances on the market since the 1960s which are challenging to manage. In conformity with the World Drug Report (2019), prepared by UNODC, approximately 271,000,000 people aged 15–64 have used drugs at least once, representing 5.5% of the world’s population. In other words, 1 in 18 people uses drugs, and from 2009–2017 there was an alarming increase in drug use (about 30% worldwide) [6].
Psychoactive substances are part of different classes of chemical compounds whose classification, according to their composition, is the most rigorous criterion, from a scientific point of view. Drugs are classified based on the following criteria: depending on their source, legal or medical status, chemical structure, and psychoactive effect [7]. Given that the psychoactive compounds added to the NPS list are constantly changing due to the control measures included in the differentiated legislation worldwide [8], the possible combinations are huge, imposing a simplified classification obtained using Cheminformatics [9].
In Romania, the following substances with psychoactive potential have been identified and are under national control: synthetic cannabinoids (SCs), amphetamines, barbiturates, cocaine analogs, benzodiazepines, synthetic cathinone, phenethylamines, piperazines, and tryptamines. SCs (also known as cannabimimetic or synthetic cannabinoid receptor agonists) are substances similar to Δ9 -tetrahydrocannabinol (Δ9-THC) that have the active ingredient specific to cannabis, whose intoxication is slow, affecting perception, reflexes, and body coordination [10].
SCs and designer drugs were created to analyze different receptors and neurotransmitters to find other alternatives to traditional medicine [7]. SCs are sold to be smoked in e-cigarettes in a liquid form, known as “herbal liquid” [1] or “spice-like” herbal mixtures [11]. Some SC derivatives (e.g., JWH series) are well-known and commercialized in many European countries [12].
For many years, scientists have aimed to quickly identify and establish the correlations between drug composition and consumption results and the possible ways to cure addiction and overdose [13,14,15].
SCs are complex structural compounds with a high binding affinity and efficacity at the CB1 and CB2 receptors [16,17]. In general, a drug must be metabolized in a specific way to result in an appropriate chemical structure that matches these receptors [18].
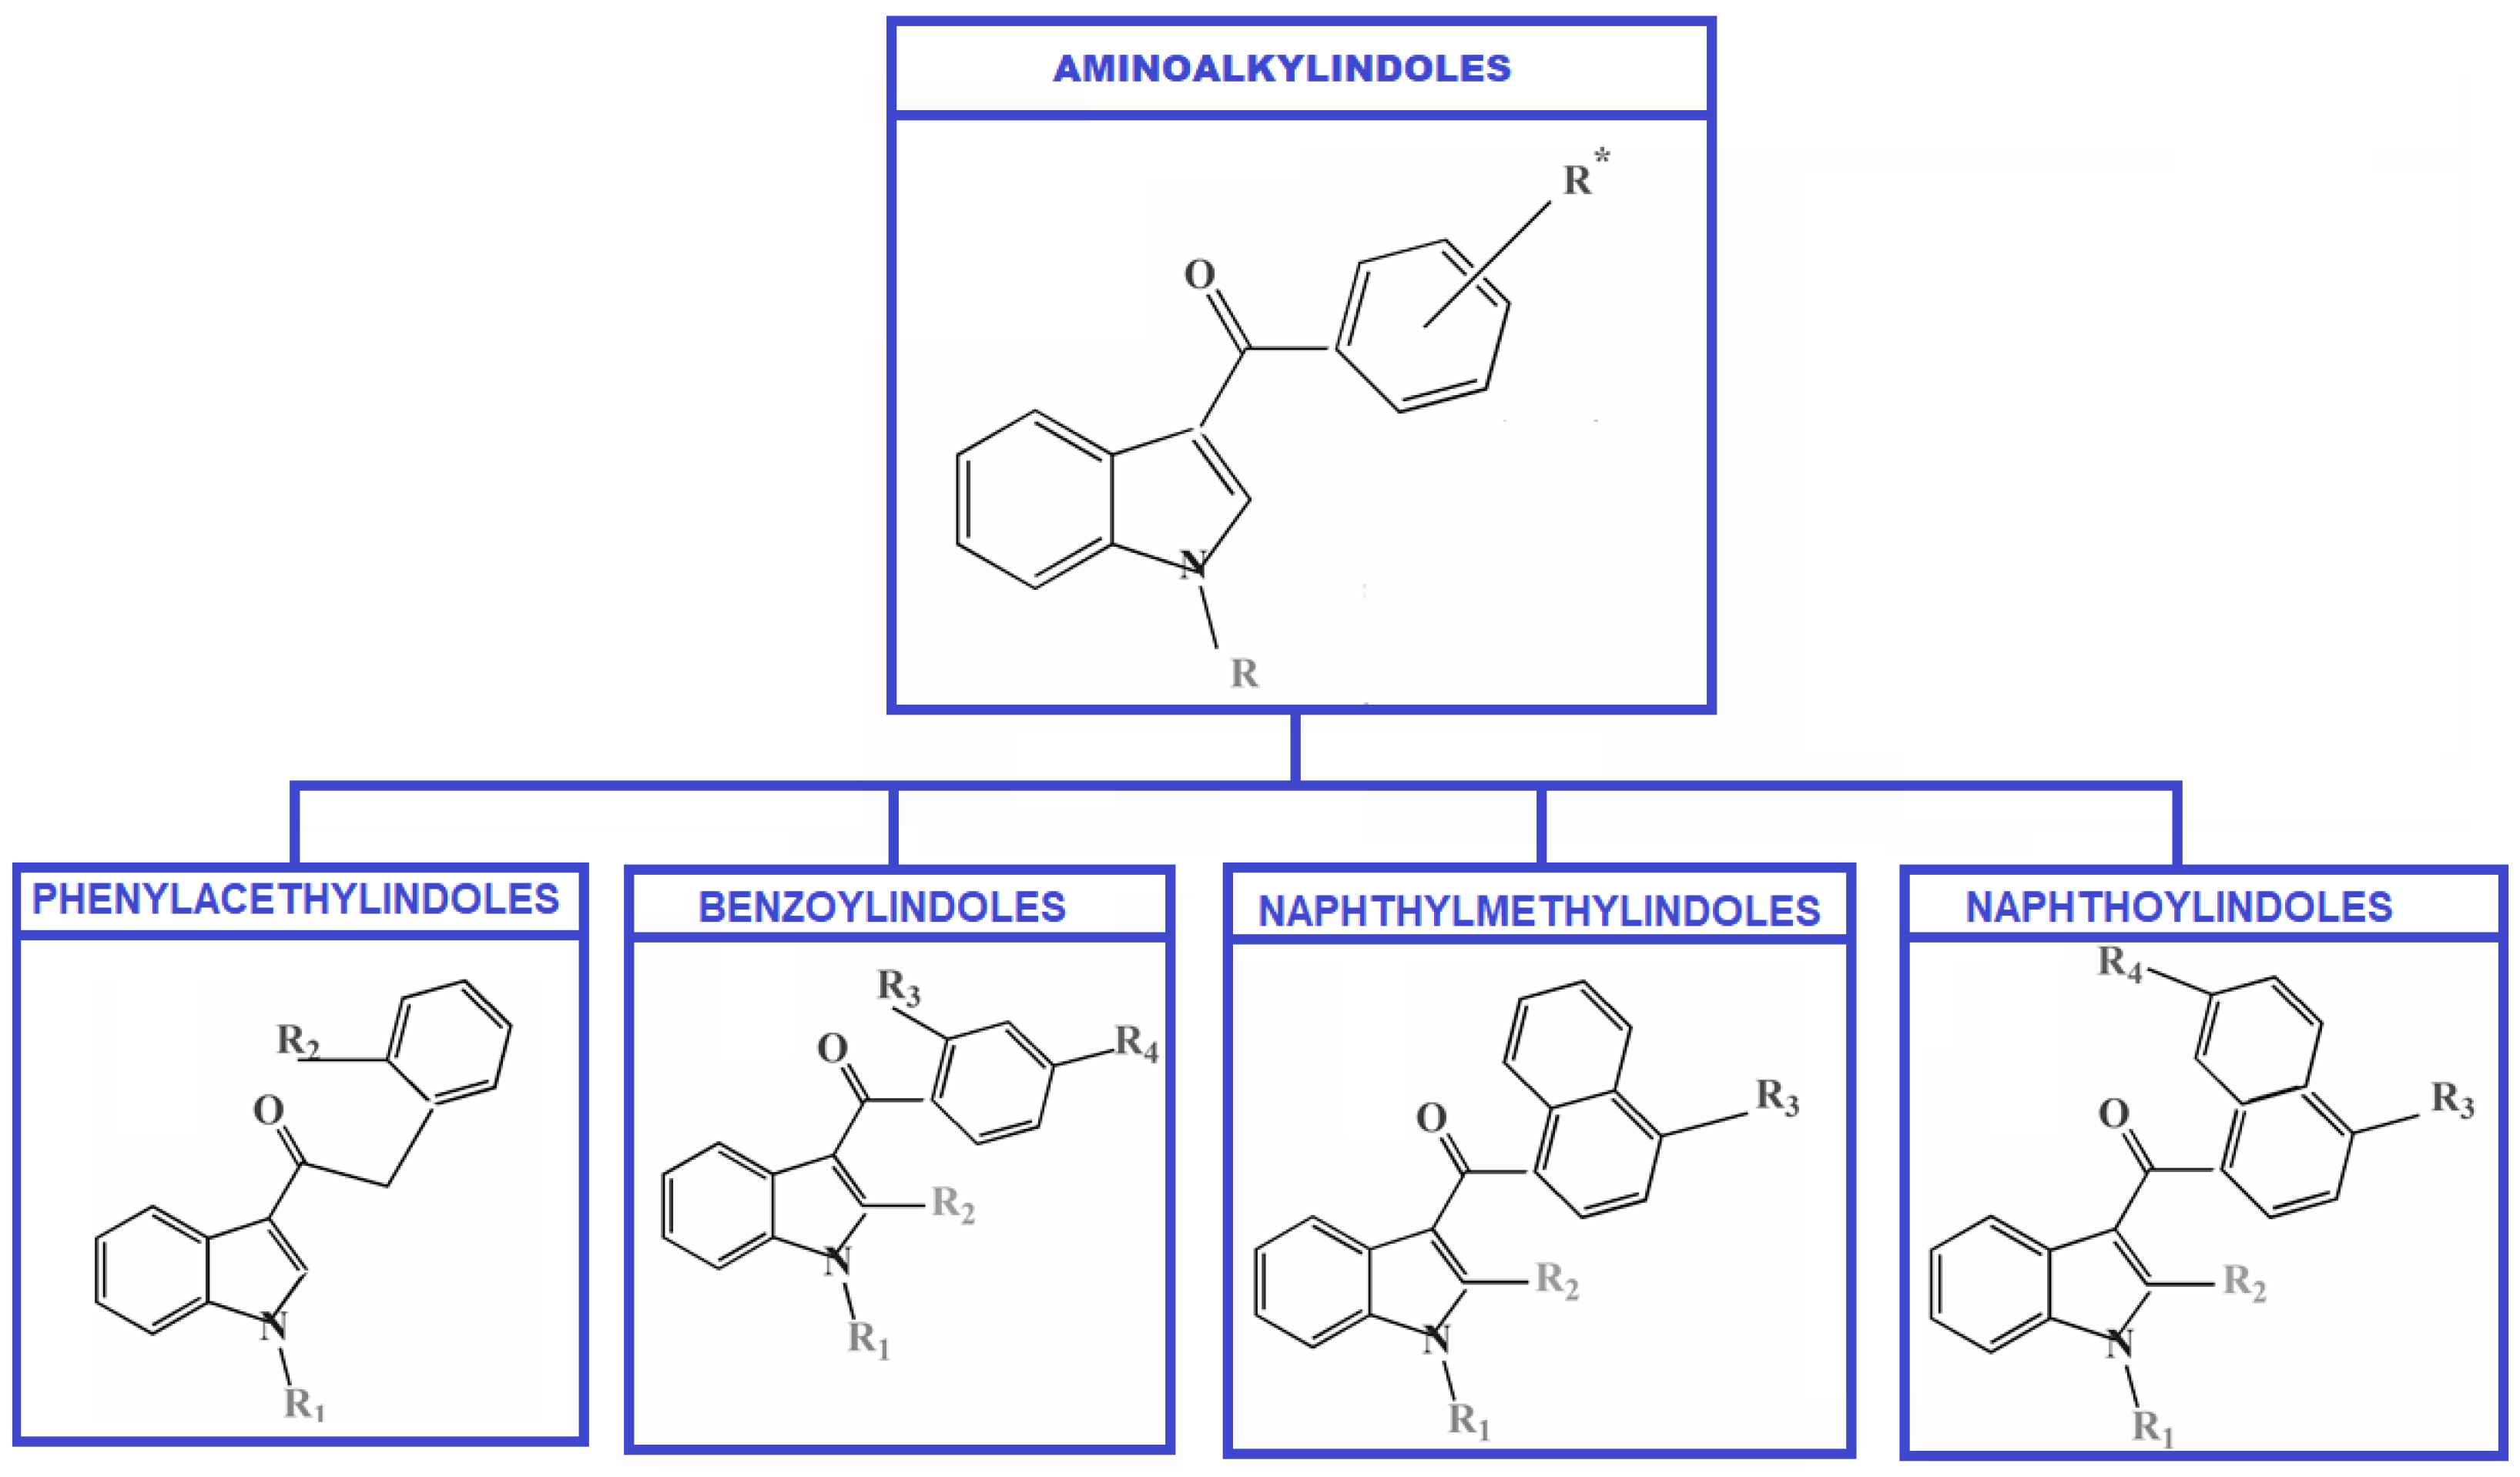
SCs can be grouped into the following categories: (a) Classical cannabinoids (with a structural relationship with Δ9-THC); (b) Non-classical cannabinoids; (c) Hybrid-forms (different combinations of classical and non-classical cannabinoids); (d) Aminoalkylindoles (AIs) or cannabinoid receptor agonists (with five structural chemical groups: Benzoylindoles, Phenylacetylindoles, Naphthylmethylindoles, Naphthoylindoles, and cannabinergic compounds); (e) Eicosanoids (endocannabinoids) [13].
AIs represent the largest group of SCs that can create derivative compounds by adding different substituents, such as alkyl, alkoxy, halogen, etc., to the aromatic ring systems, among other relatively simple alterations. The structure of the Aminoalkylindoles group with the first four subgroups is presented in Figure 1.
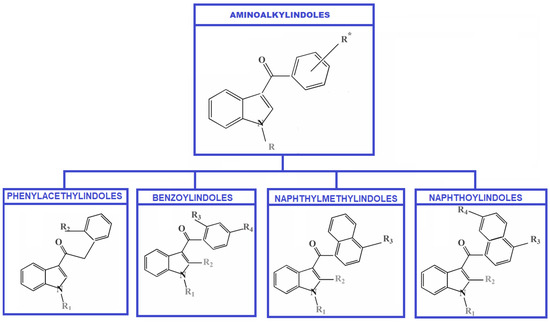
Figure 1.
Classification of Aminoalkylindoles—four subgroups.
In drug discovery, virtual screening (VS) became a powerful computational approach used for screening libraries containing different molecules for finding those with desired characteristics that will be subject to laboratory tests. VS is intended for boosting the discovery of the candidates and reduce the number of those that should be experimentally tested. VS has the main advantage of diminishing resources, cost, labor, and time.
The quantitative structure–activity relationship (QSAR) is one of the most powerful approaches to VS due to its excellent hit rate and fast throughput. After collecting the relevant data, QSAR computes the chemical descriptors on different levels of the molecular structure representation to determine the similarities/dissimilarities of the investigated structures. This is precisely what we intend to do in our work [19]. Here, we are using QSAR to emphasize the similarities/dissimilarities of the studied elements.
QSAR relies on the hypothesis that the chemical structure is responsible for the activity, so similar molecules are expected to have similar properties [20]. Still, activity cliffs (ACs) can be noticed. ACs represent groups of molecules that have similar structures and are active against the same target but exhibit high differences in potency. Since ACs capture chemical modifications that strongly influence biological activity, they are of particular interest in QSAR analysis [21].
Fingerprints are representations of specific molecular structures and may represent a structural key within a molecule; for example, computed properties of a molecule (LogP, Polar Surface area, Hydrogen Bond donor). Being more abstract than a structural key, fingerprints are more general because they do not represent pre-defined patterns [22]. They encode various descriptors of the molecular structure [23].
Different artificial intelligence approaches have been used in various domains for data analysis in the last period. Cheminformatics is a tool used to examine statistical data related to chemical structures. It has an essential role in accumulating, grouping, and analyzing chemical data. It is successfully used for determining new entities that are the base of other structures utilized to construct active molecules [24].
Utilizing an in silico method, one can predict pharmacokinetic parameters [25]. It has been shown [26,27] that each computational procedure employed in drug discovery has advantages and disadvantages. The rcdk, ChemmineR, and rpubchem packages of R or RDKIT in Python (www.rdkit.org, accessed on 15 May 2021) are powerful tools in Cheminformatics [28,29,30,31,32,33,34], helping scientists to group the information efficiently. The Chemistry Development Kit (CDK) (https://cdk.github.io/, accessed on 15 May 2021) has also been employed for the prediction of organic reactions, bioactivities of compounds, or finding the maximally bridging rings in chemical structures [35,36,37,38].
This research has been realized using the R software and its specific packages for characterizing 14 cannabinoids belonging to the Benzoylindoles and Phenylacetylindoles [39] and detecting similarities between them. Performing the hierarchical clustering and k-means algorithm resulted in grouping drugs by taking into account the computed descriptors. The activity spectrum of the elements in each group has also been analyzed, and similarities emphasized. The results come to validate the grouping of the molecules in clusters.
2. Materials and Methods
Data on which the study relies have been retrieved as .sdf files from PubChem [40]. They are molecules from the Aminoalkylindoles class, as well as the Benzoylindole and Phenylacetylindole subgroups.
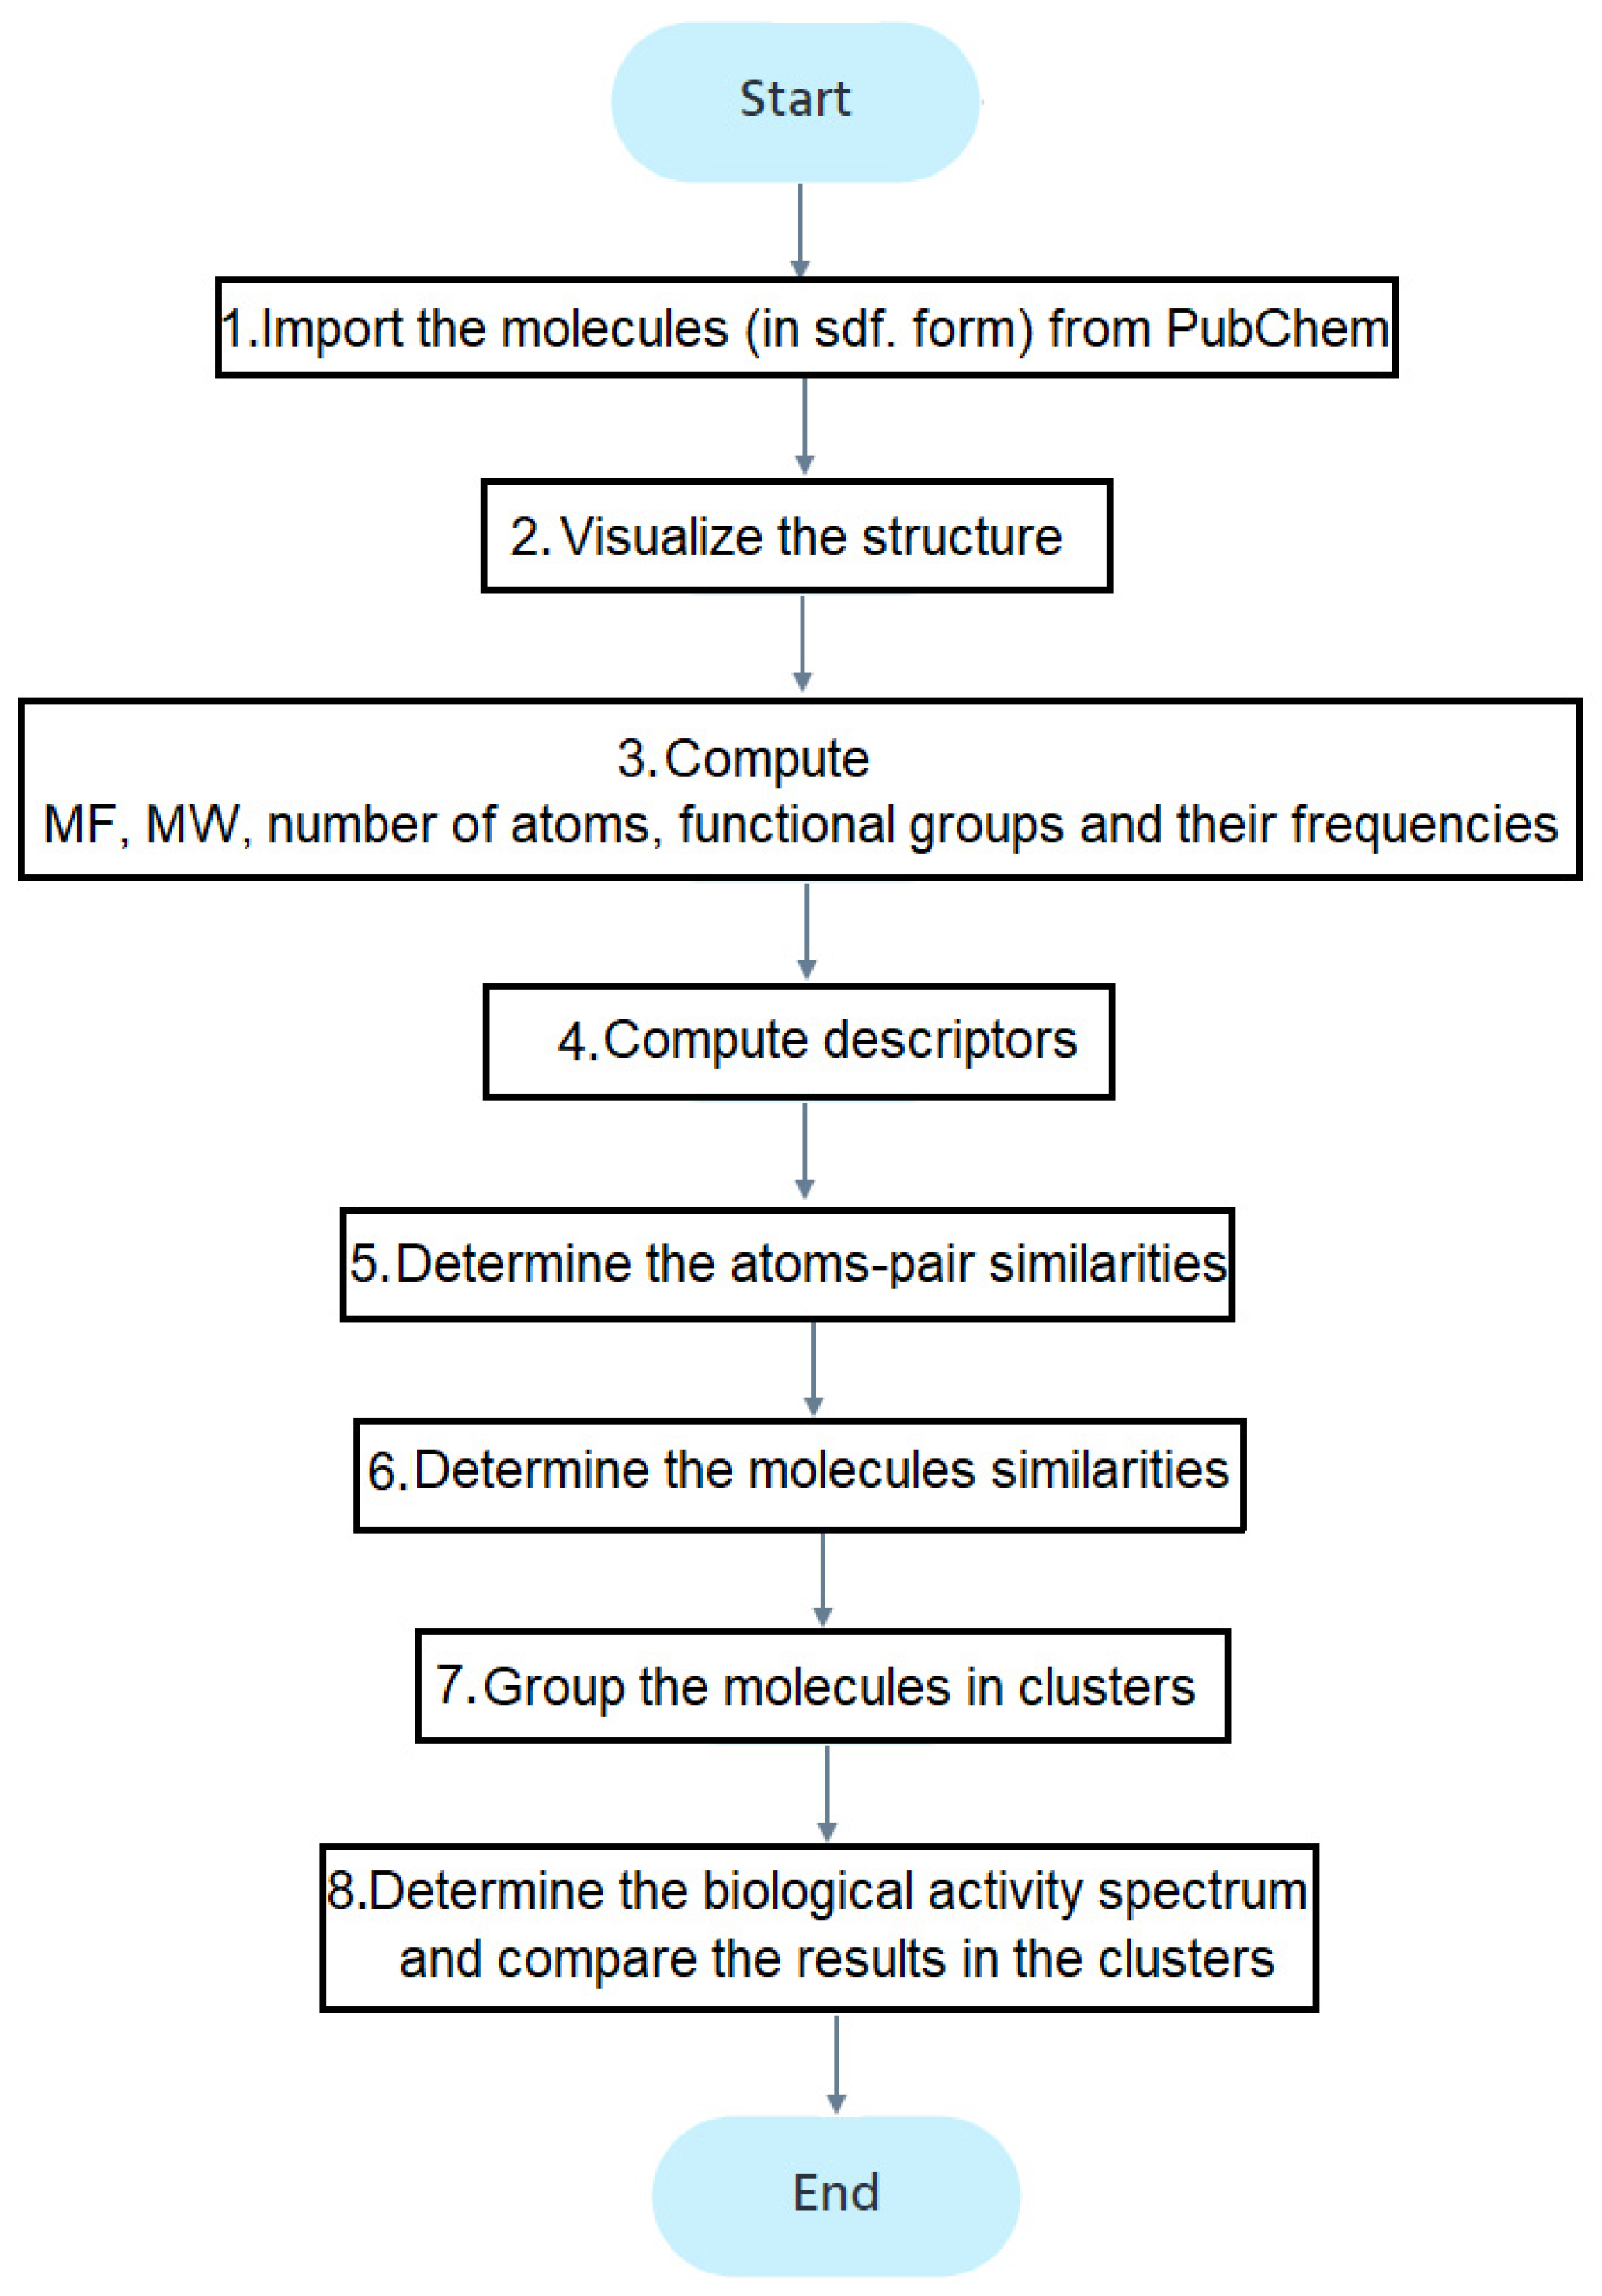
Figure 2 contains the study flowchart. After importing the molecules (step 1), their structures are drawn (step 2). The molecular formula (MF) and weights (MW), number and types of atoms, and functional groups are determined (step 3). The descriptors computed at the fourth stage, using the ChemmineOB package, are the Hydrogen Bond Acceptors (HBA1, HBA2) and Donors (HBD), log P, the molar refractivity, and topological polar surface area (TPSA) [39]. The reader may refer to [41,42,43,44,45,46,47] for details on these descriptors. The descriptors are utilized to group the molecules into clusters.
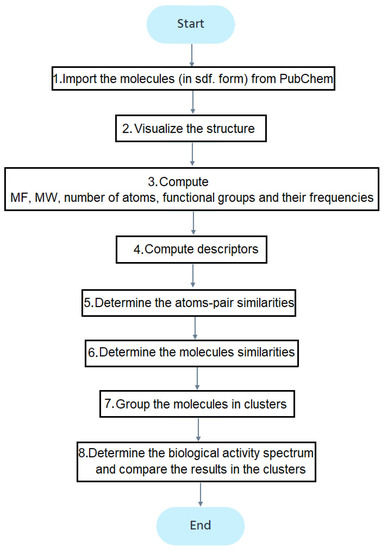
Figure 2.
The flowchart of the study.
At the fifth stage, the atom-pairs (AP) are determined with the help of ChemmineR. AP is formed by a pair of atoms and the shortest bond path length from one to the other [48,49].
Computation of the compounds’ similarity provides the sizes of the query and target molecules, the Tanimoto [49,50] and overlap coefficients, indicating the degree of overlapping of the pair of molecules (step 6).
The first form of the Tanimoto coefficient is:
and the second one is:
( being the number of the ith fragment in A (B).
If one is interested only in the absence/existence of unique fragments, both approaches lead to the binary form [48,49].
where a (b) is the number of fragments contained only by A (B), and c is the number of fragments common to A and B.
SA,B = c/(a + b + c),
Formula (3) is used in our study, together with the corresponding distance:
Generally, given two structures, A and B, the overlap coefficient is computed by:
where and are, respectively, the numbers of elements of A and B, and is the intersection of A and B.
To compute the Tanimoto index, the following fingerprints have been utilized: hierarchical elements count rings in a canonic Extended Smallest Set of Smallest Rings (ESSSR) ring set, simple pairs of APs, simple atom nearest neighbors, detailed atom neighborhoods, and simple SMART pattern.
The seventh stage aimed to group the molecules using binning [50,51], the Jarvis–Patrick procedure [52], and hierarchical clustering. The Ward 2 algorithm [53,54] has been chosen for hierarchical clustering because it minimizes the variance inside the clusters. The k-means algorithm has also been run for clustering the molecules.
The last step was to predict the biological activities spectrum, reflecting the substance’s interaction effects with physical entities [55]. For this aim, the algorithm proposed by Lagunin et al. [55], implemented in PASS [56], has been used. It computes the probability of each activity based on the structure descriptors. It returns a table that contains the biological activities and the corresponding probabilities (the likelihood of activity to exist () or not ()).
- ○
- When Pa is greater than 0.7, the probability that the substance has the specified activity in experimental conditions and is analogous to a pharmaceutical substance already studied is high.
- ○
- When Pa is between 0.5 and 0.7, the substance may present the specified activity in experimental conditions. However, the substance is different from the substance already studied.
- ○
- When Pa is less than 0.5, the probability that the substance has the specified activity is low. In the case when this activity is experimentally observed, it might be a new chemical entity [56].
The most important activities (those with probabilities greater than 0.5) exhibited by each molecule in the groups have been selected, and a table containing these probabilities and those of the corresponding activities for all the molecules in a group has been built. If a molecule does not have a certain activity, the assigned probability is zero. Using these newly built series, the Kruskal–Wallis test [57] has been performed to test the null hypothesis (H0) that the series come from the same distribution, at a significance level of 0.05. The same test has been performed for the series issued from both groups together. These tests will confirm or reject the clustering from step 7. If the null hypothesis was rejected, the test was performed for sub-groups to determine where the difference is.
3. Results and Discussion
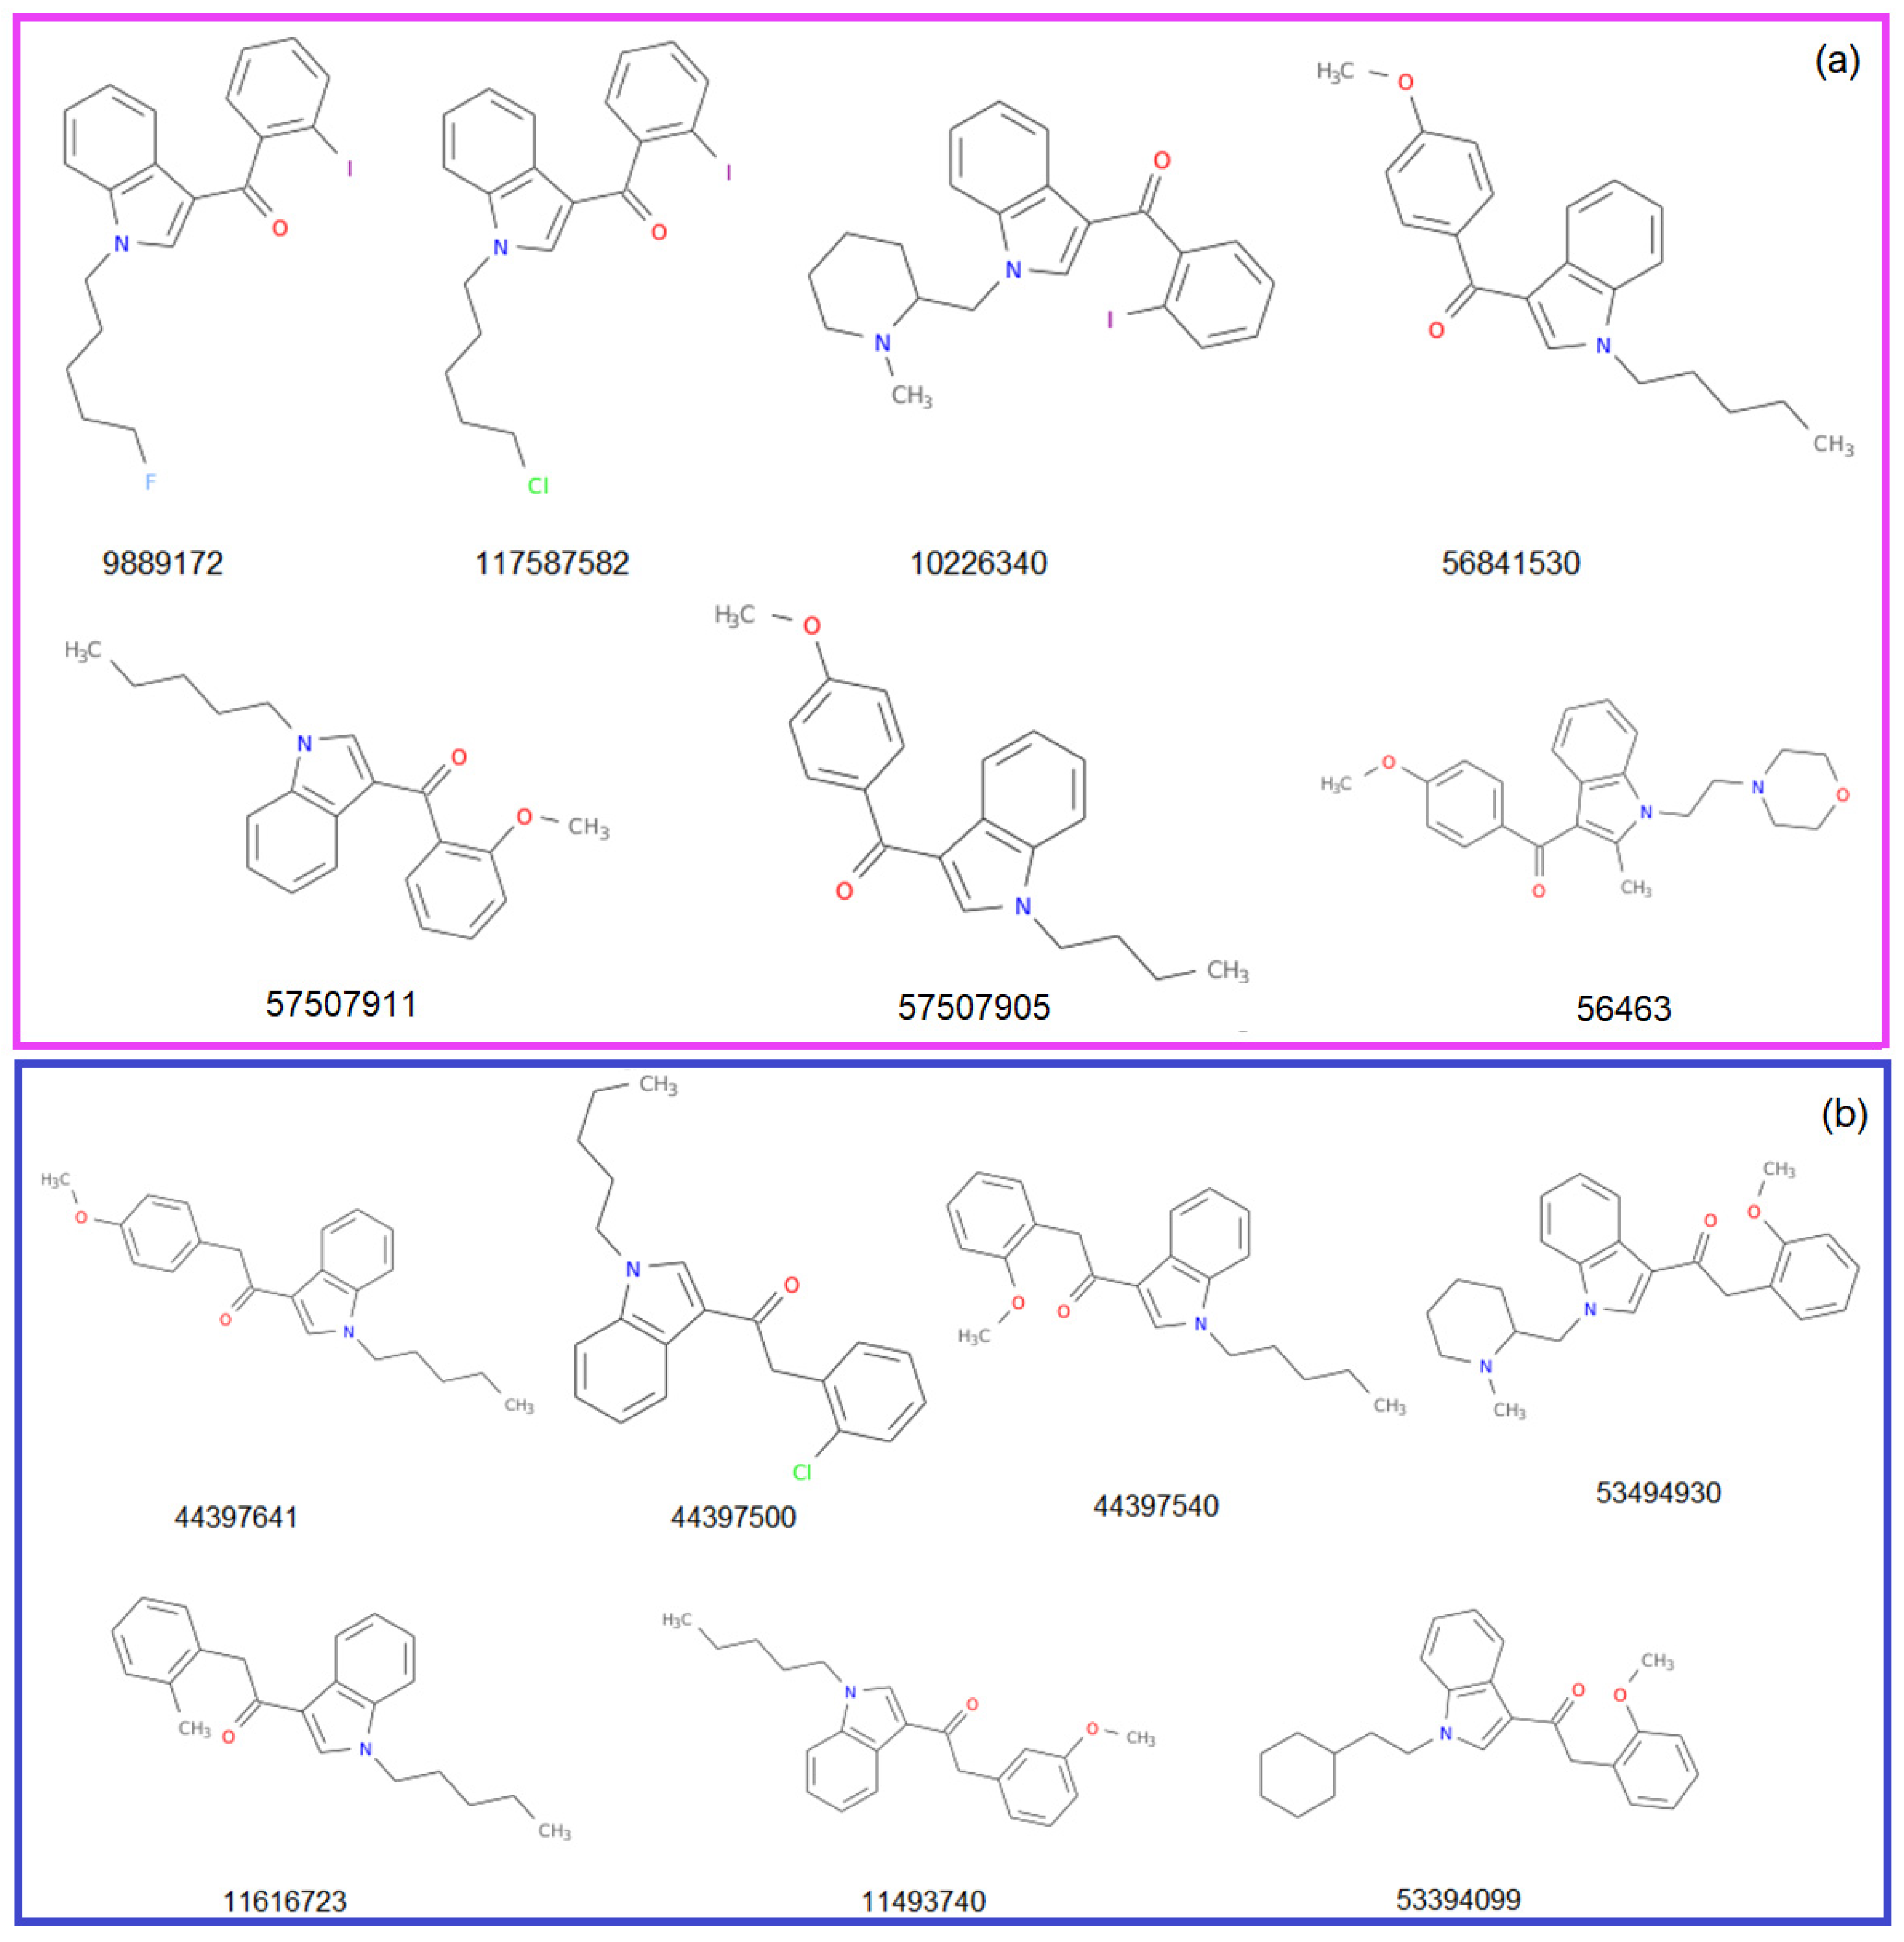
The structures of the molecules from the Benzoylindole and Phenylacetylindole groups (Group 1 and 2, respectively) are represented in Figure 3. They are accompanied by the CID (compound ID) in PubChem. The CID, MF, and MW, the atoms’ species and functional groups (present in at least one molecule), and their numbers, retrieved using ChemmineR, are presented in Table 1 and Table 2.
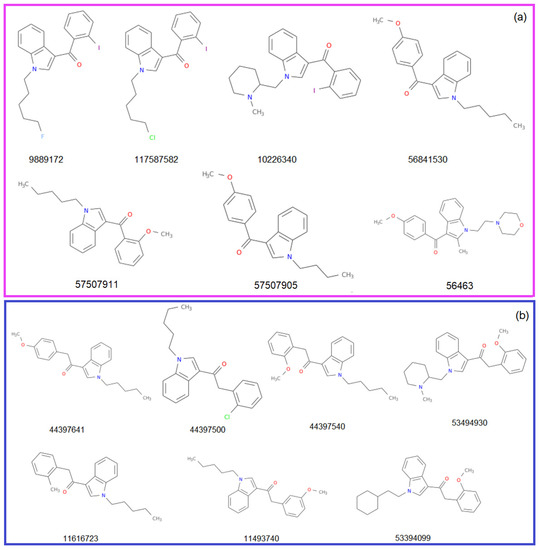
Figure 3.
The structures of the studied molecules from (a) Group 1 and (b) Group 2.

Table 1.
The CID, molecular formula, and MW of the studied drugs.
Table 2.
The atoms’ species and functional groups and their numbers.
The molar weights in Group 1 are between 307.3862 (for C20H21NO2) and 458.3353 (for C22H23IN2O). Only one molecule contains F and Cl, and three, I. The molar weights in Group 2 are between 335.4394 (for C20H21NO2) and 376.4913 (for C24H28N2O2). No molecule contains F, and one, I. All contain Cl.
The molar weights in Group 2 are between 307.3862 (C22H25NO2) and 458.3353 (C22H23IN2O). Rings, most of them aromatic, are present in all structures of the studied molecules.
The computed descriptors are given in Table 3. The values of HBA1 are lower for the first group than for the second, and HBD is absent for both groups. logP is generally lower for Benzoylindoles (the highest value is 5.8860) than for Phenylacetylindoles (the highest value is 6.0457). The molecule ID 53394099 has the highest hydrophilicity. TPSA varies in more significant limits for Group 1 (22.00 to 43.70) than for Group 2 (22.00 to 34.47). The higher the TPSA is, the lower the drug transport is.
Table 3.
Molecules’ descriptors.
Table 4 displays the values of the Tanimoto coefficients, indicating the similarities of the atoms belonging to pairs of structures. The highest values were computed for the couples (9889172, 117587582) and (57507911, 57507905) (with the coefficients 0.8497 and 0.8462, respectively) in Group 1, and (44397540, 11616723) and (44397500, 11616723) in Group 2 (with the coefficients 0.8526 and 0.8467, respectively).
Table 4.
Tanimoto coefficients for the atoms’ similarities.
Table 5 shows the similarities of pairs of atoms belonging to pair of molecules from Benzoylindoles and Phenylacetylindoles. The highest value of the Tanimoto coefficient corresponds to (9989172, 44397500). It is bigger than that corresponding to the couple (57507905, 56463), whose molecules both belong to the first group.
Table 5.
Similarities of pairs of atoms belonging to pair of molecules from Benzoylindoles and Phenylacetylindoles.
The similarities of the molecules’ couples, one belonging to Benzoylindoles and the other to Phenylacetylindoles, indicated by the Tanimoto coefficient, are shown in Table 6. The rank of the similarity is given in brackets. Minus (−) signifies that the similarity rank is higher than eight. The molecule with the ID 53394099, absent from the table, has a similarity rank higher than eight, along with all the molecules in the first group.
Table 6.
The similarity of molecules’ couples, one of them belonging to Benzoylindoles and the other to Phenylacetylindoles (Tanimoto coefficient). The number in the brackets represents the similarity rank. Minus (−) signifies that the rank of similarity is higher than eight.
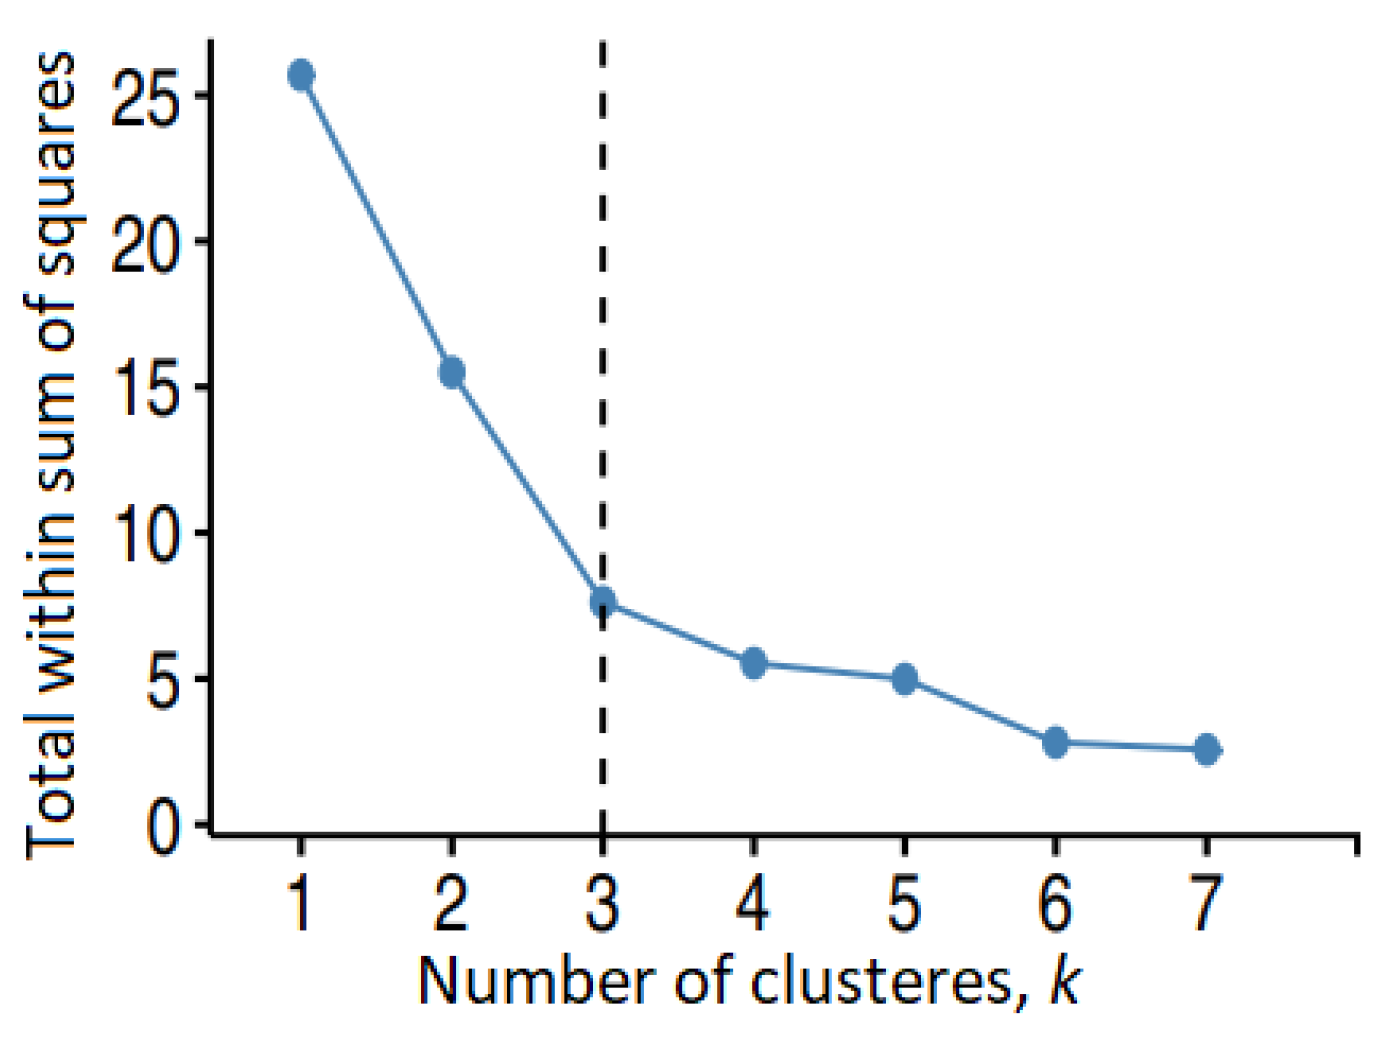
After the similarity analysis, the molecules were grouped in clusters using different algorithms. For Group 1, the binning provided various numbers of clusters (1, 2, 7), depending on the cutoff. The Jarvis–Patrick algorithm provided two (or one) clusters when it took into account four (5 and 6) neighbors. The elbow method (Figure 4) selected the number of clusters (three) in the k-means algorithm.
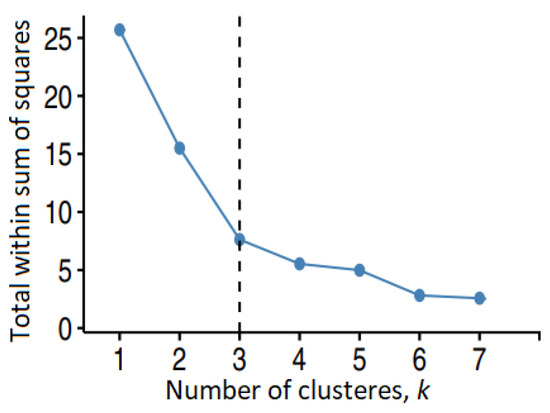
Figure 4.
The elbow method for determining the optimal number of clusters for Group 1 in the k-means algorithm.
Running the mentioned algorithm, we found two clusters with three elements and one with one—ID 56463. Similar results were found for the second group.
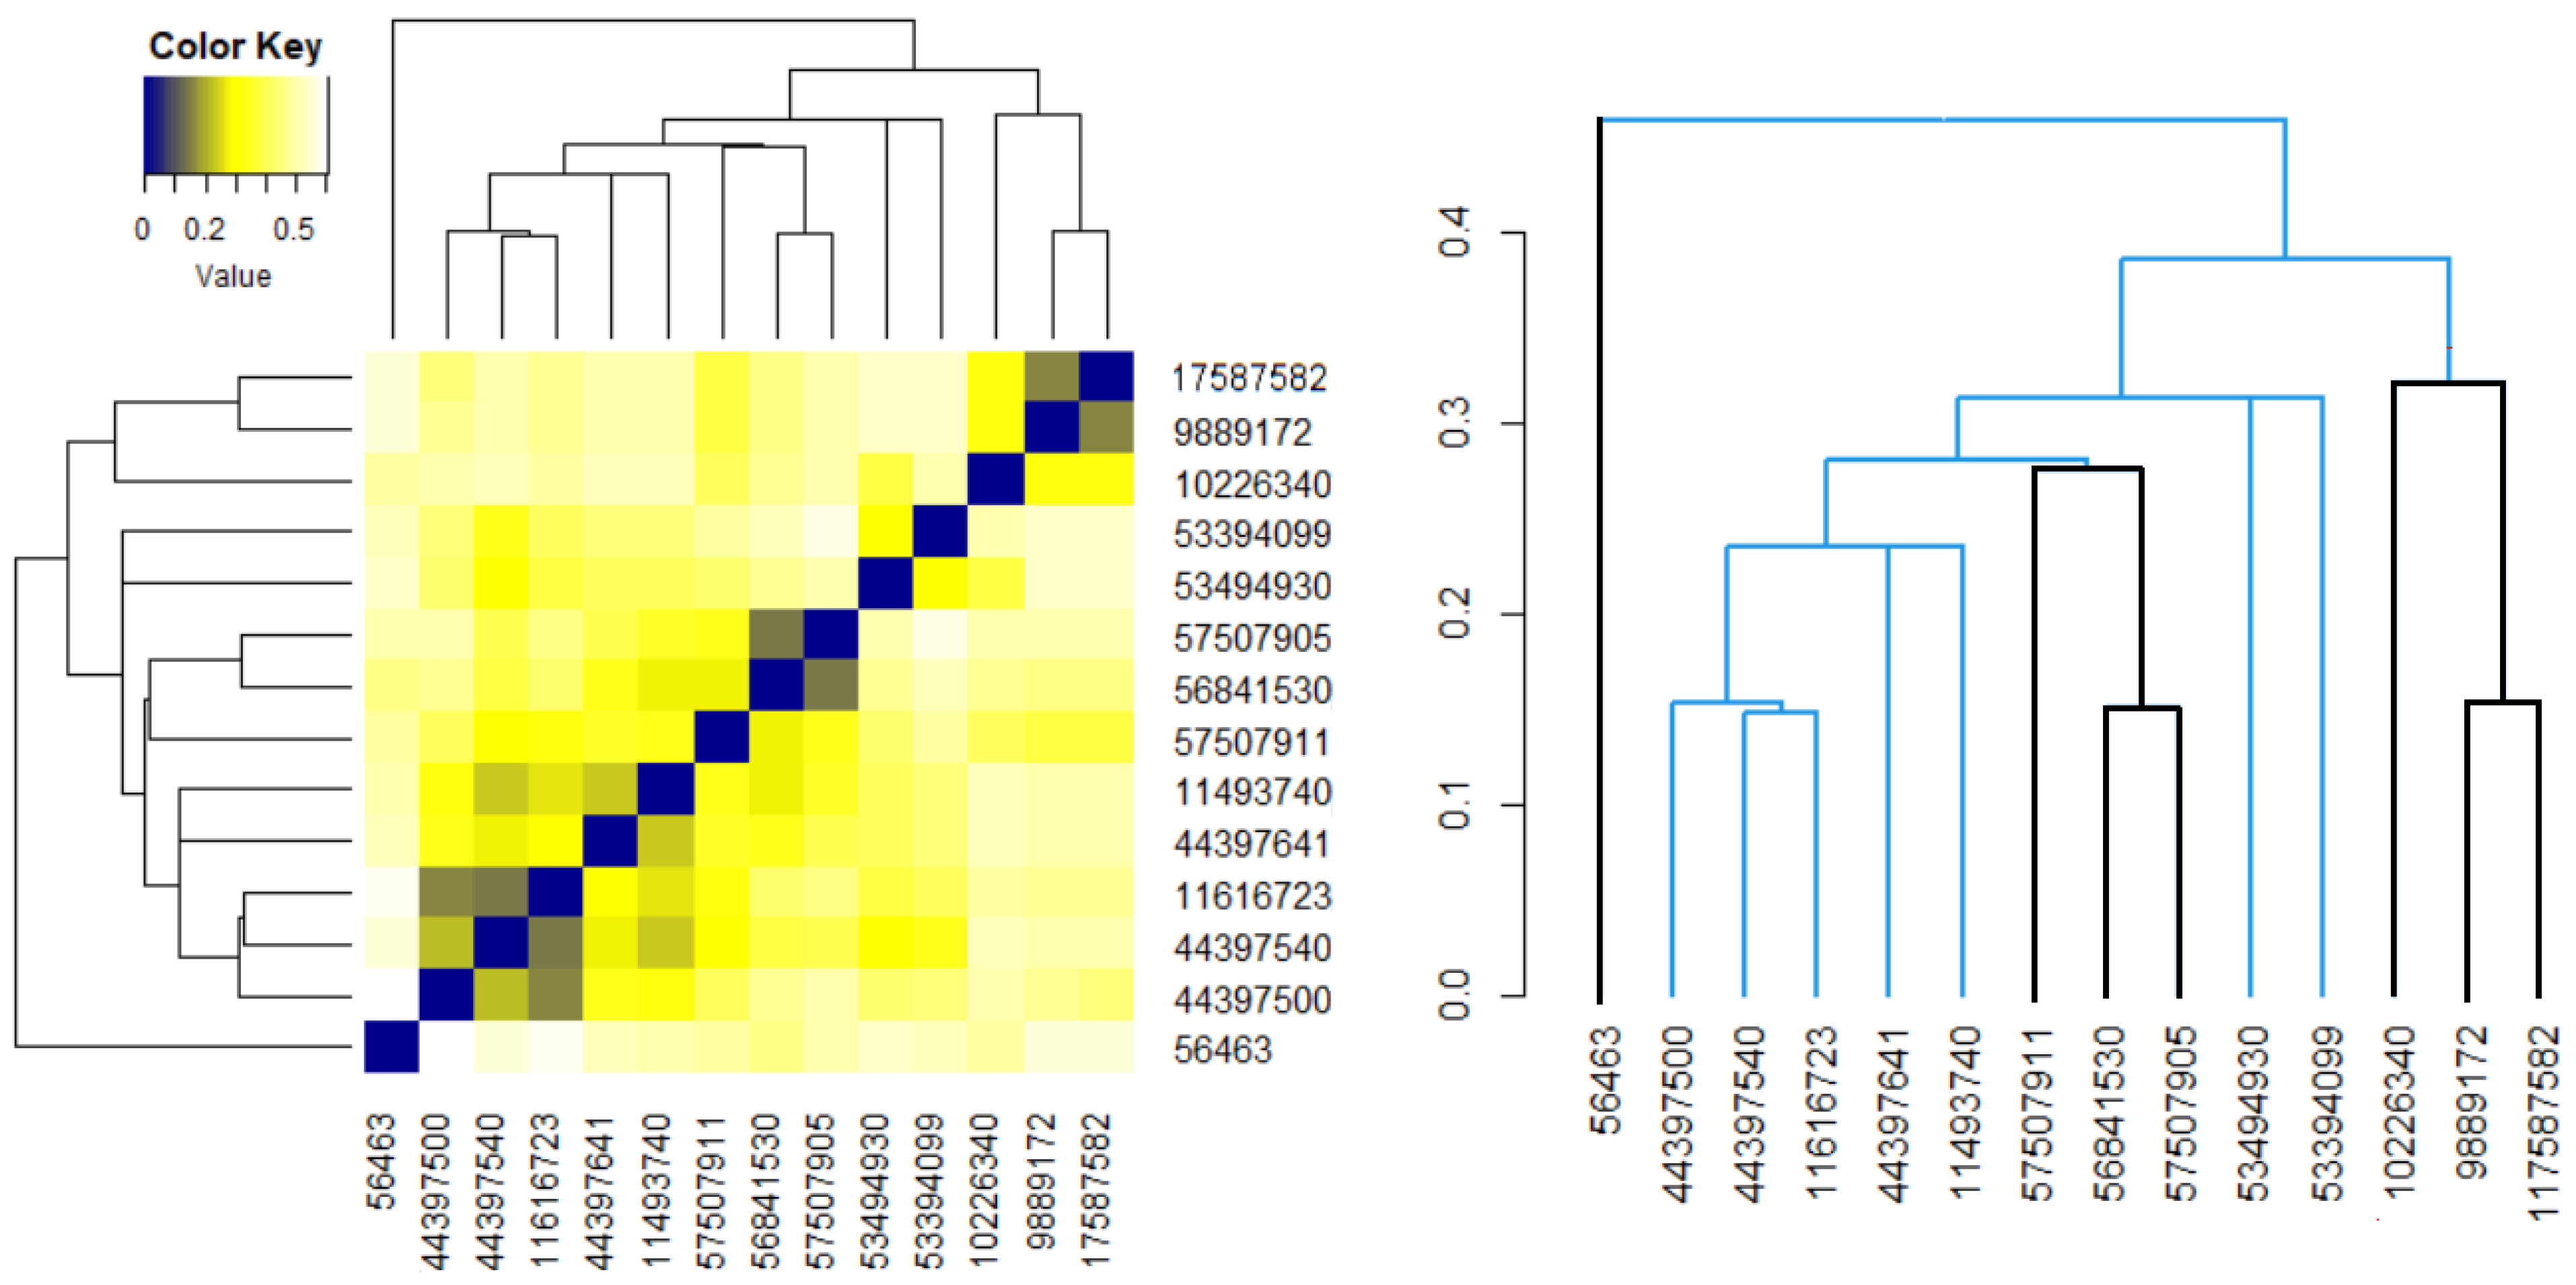
Figure 5 contains the results of the hierarchical clustering for both groups. In the heatmaps, the darker the color the higher the similarity of the compounds is. The squares in dark blue are associated with the similarity 1—meaning a compound with itself. The dendrograms indicate the similarity strength. The higher the branch between the two compounds is, the lower the similarity.
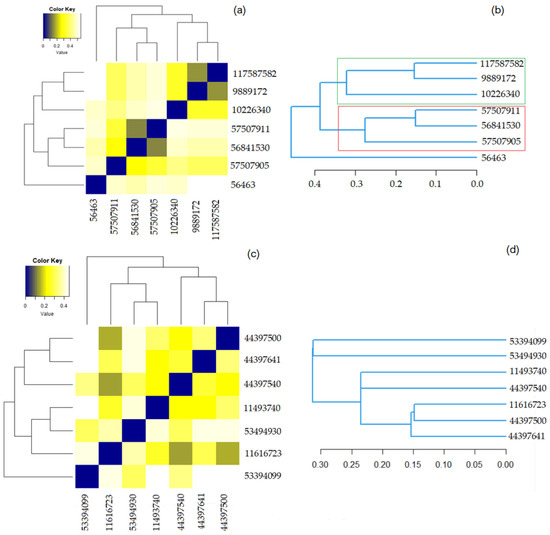
Figure 5.
(a) The heatmap for Benzoylindoles; (b) The dendrogram for Benzoylindoles; (c) The heatmap for Phenylacetylindoles; (d) The dendrogram for Phenylacetylindoles.
Figure 5a shows that the most similar molecules in Group 1 are those in the couples (9889172, 117587582) and (56841530, 579507911), for which the Tanimoto coefficient is equal to 0.900 and the overlap coefficient is 0.9583. The second highest similarity is between (10226340, 117587582) and (10226340, 9889172). Both have the overlap coefficient of 0.9583 and the Tanimoto one is equal to 0.8519.
Figure 5c shows that the highest similarity is that of the pairs (11616723, 44397500), (44397500, 44397641), and (11616723, 44397641). The corresponding Tanimoto and the overlap coefficients of the last two pairs are both 0.8846. The overlap coefficient (Tanimoto) of the first couple is 0.9011 (0.9152).
Figure 5b,d show that the distances between the elements in the Phenylacetylindoles group are smaller than those between the molecules in the Benzoylindoles group, in concordance with the results on the molecules’ similarity. It is also emphasized on the scale from Figure 6, where the branches of the molecules in Group 1 are in black.

Figure 6.
The heatmap and dendrogram for all molecules. The black branches correspond to the molecules in the first group.
An analogous approach was followed for the 14 molecules, without considering the groups’ appurtenance. The heatmap and the dendrogram are shown in Figure 6. It results that molecule 56463 presents the highest dissimilarities to the others. The most similar Benzoylindoles are those with CIDs 9889172, 117587582 and those with CIDs 56481530, 957507905. Among the Phenylacetylindoles, the highest similarities are those of the molecules with the second, third, and fourth CIDs in Table 6.
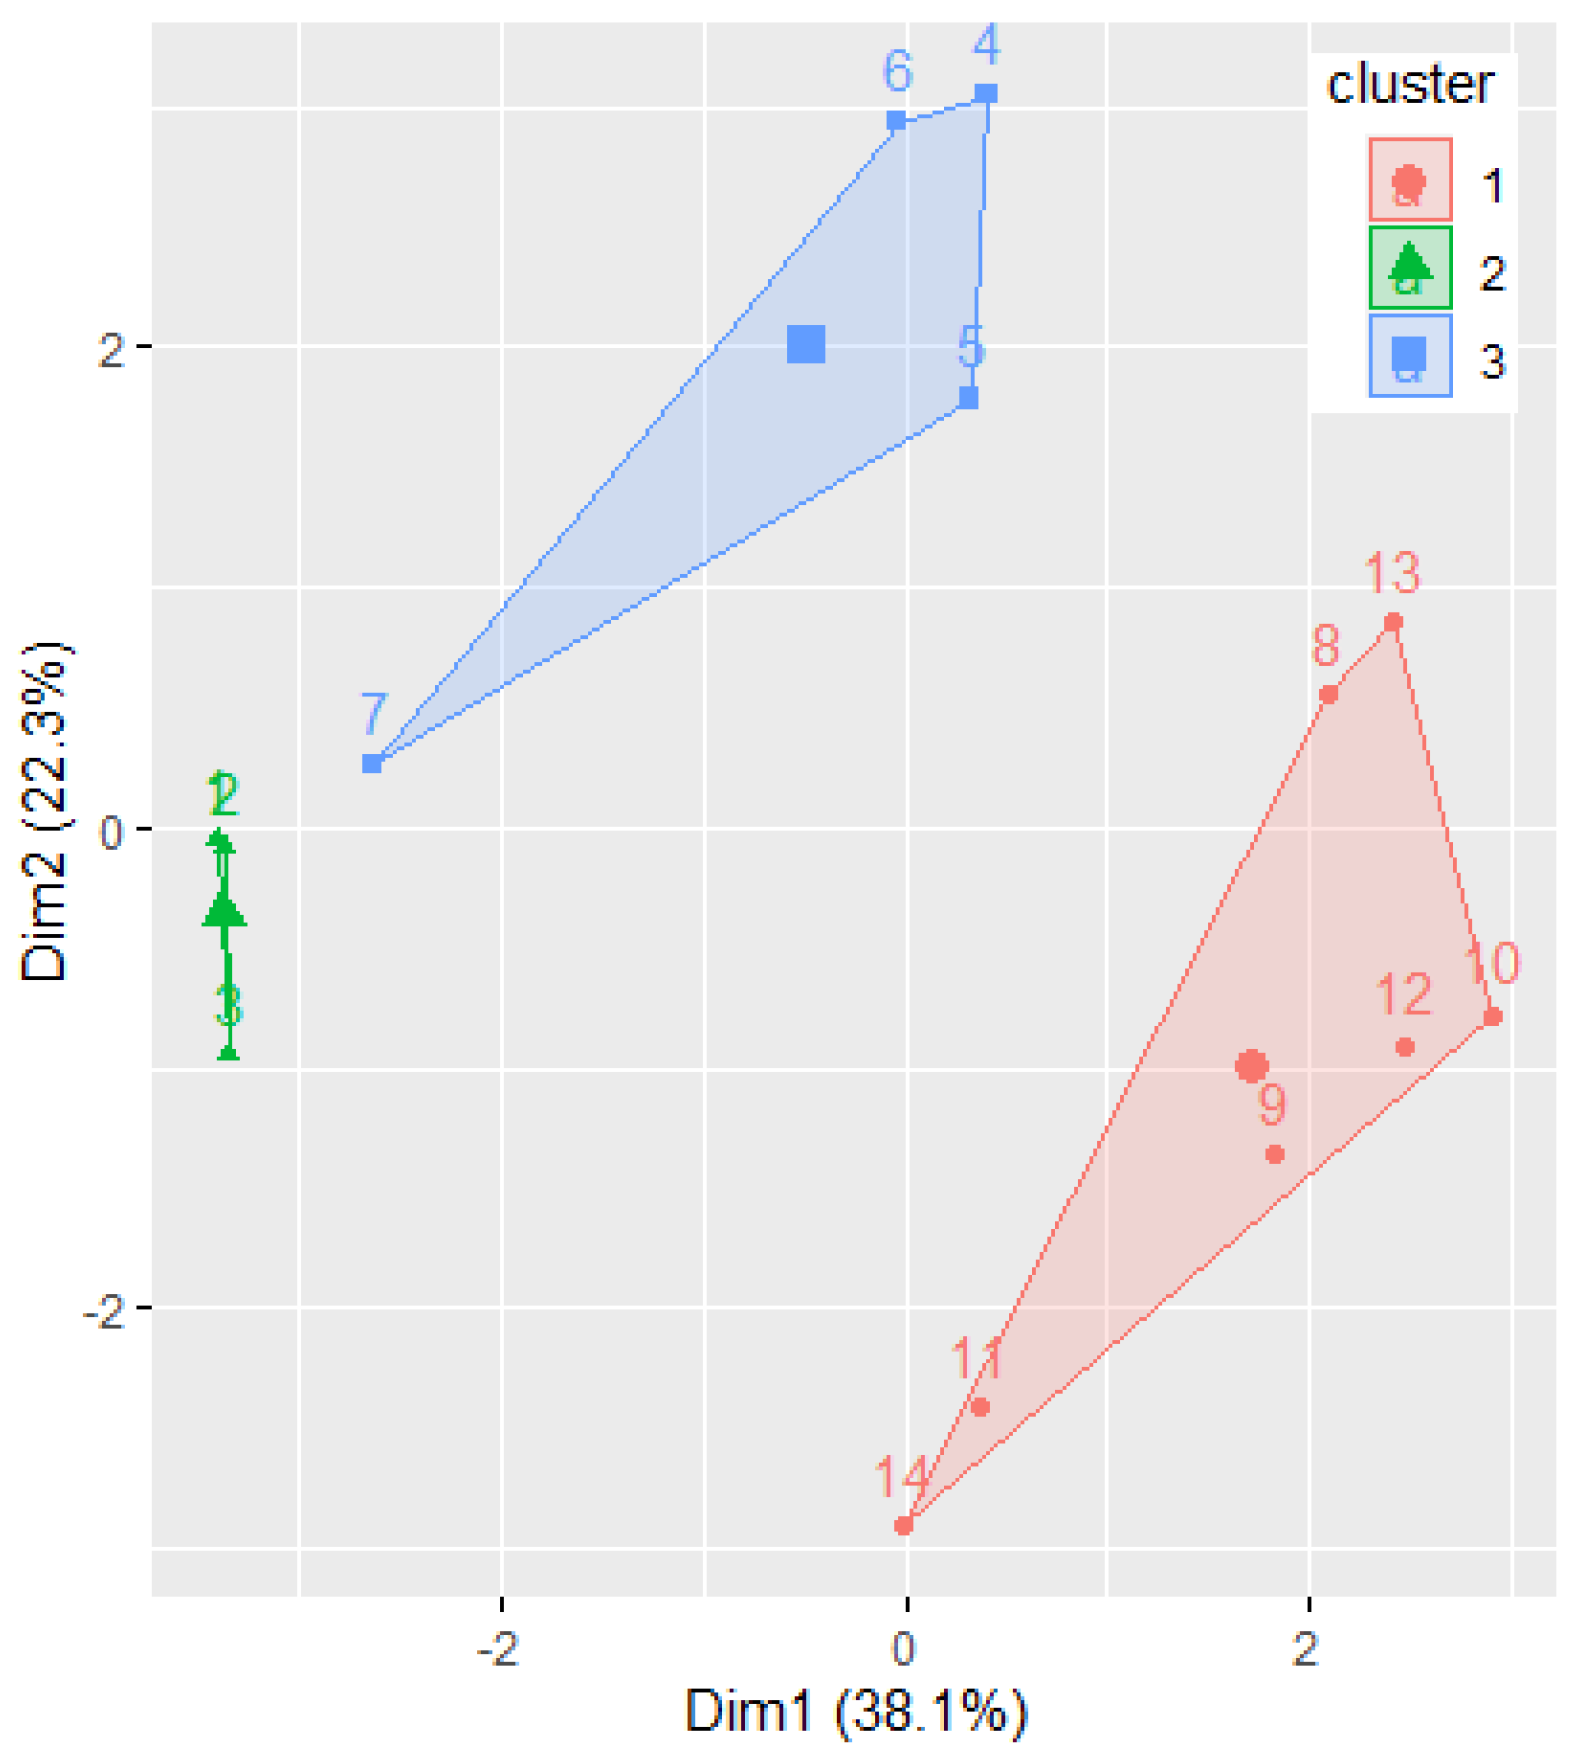
Figure 7 displays the clusters determined by the k-means algorithm, with k = 3.
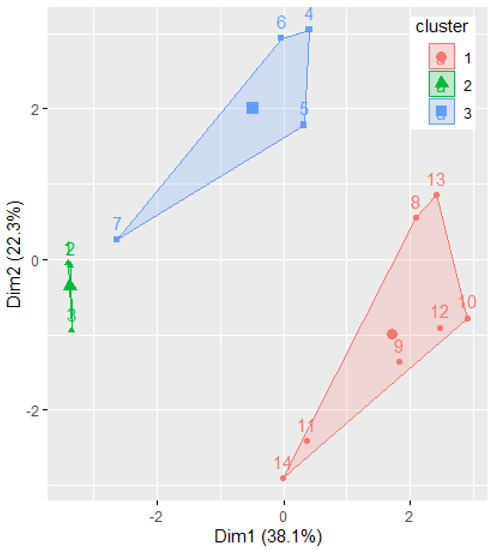
Figure 7.
The results of grouping the molecules by k-means algorithm. The Ox and Oy axes are the first two PCs.
Phenylacetylindoles belong to the first cluster, confirming the previous findings. Benzoylindoles with CIDs 9889172, 117587582, and 10226340 belong to one cluster, whereas the other Benzoylindoles belong to another. Remark the concordance of this classification with Figure 5b. At first sight, there is a disagreement between the molecules’ classification by IUPAC in only two classes: Benzoylindoles and Phenylacetylindoles. This is not the case, because the dendrogram (Figure 6) provides a classification based on the distances between the molecules, putting together the dendrograms in Figure 5d and Figure 6 and taking into account the branches’ lengths, indicated under the dendrograms.
Moreover, the clustering provided in Figure 7 confirms the homogeneity of the elements in Group 2. The existence of two different clusters for the elements in Group 1 results from applying the k-mean algorithm, with k = 3.
Table 7 presents the positive and negative effects of the molecules in Group 1 with probabilities of apparition greater than or equal to 0.5.
Table 7.
Positive and negative effects of the Benzoylindoles that appear with probabilities greater than 0.5.
The effects that appear with probabilities between 0.3 and 0.5 are presented in Table S1 (Supplementary material) for the molecules in Group 1. The molecule 10226340 is likely to act as a Nicotinic alpha4beta4 receptor agonist and Analgesic (Pa = 0.775, and Pa = 0.731, respectively), the molecules 57507911, 56841530, and 57507905 are likely to act as an Antineurotic and Gluconate 2-dehydrogenase (acceptor) inhibitor, and the molecule 56463 is expected to act as an Antineurotic. The molecules 9889172 (and 10226340) have a Pa > 0.5 (0.301) associated with the Antineurogenic pain and Nicotinic alpha4beta2 receptor antagonist effects. Pa is greater than 0.5 for the Lymphocytopoiesis inhibitor effect for the molecule 117587582, and 0.5 > Pa > 0.3 for the same effect for 9889172 and 10226340. The molecule 10226340 has an analgesic effect whose Pa = 0.731, whereas the same effect has an associated probability of 0.448 (0.336) for the molecule 9889172 (117587582).
Effects such as Analgesic, Antineoplastic alkaloid, Glycosylphosphatidylinositol phospholipase D inhibitor, Peptide agonist, Thromboxane B2 antagonist, and NADPH- cytochrome-c2 reductase inhibitor have probabilities between 0.3 and 0.5 for the molecules 9889172 and 117587582. Given that the molecules 9889172, 117587582, and 10226340 are in the same cluster, the presence of these activities confirmed in experiments for one of the molecules may indicate the same effect for the other molecules.
The adverse effects of 9889172 are not known well. Based on the actual knowledge, only 10 such effects have been identified, such as Photoallergy dermatitis, Allergic contact dermatitis (with 0.7 > Pa > 0.5), Cyanosis, Nail discoloration, and Torsades de pointes (0.5 > Pa > 0.3). These effects are noted with probabilities between 0.3 and 0.5 for at least one molecule in the same cluster. Effects related to the postural position damage and respiratory issues have probabilities less than 0.5 for the molecules 117587582 and 10226340. The confirmation by experiments of such effects for one of the molecules in the first cluster will represent a warning for using the other two molecules in Cluster 1.
The analysis of the effects of the molecules in the second cluster emphasizes a high concordance between their effects. All the positive effects are common. Some of them, which do not appear in Table 8, appear in Table S1 from the Supplementary Materials, with probabilities close to 0.5; for example, Saccharopepsin inhibitor, Chymosin inhibitor, and Acrocylindropepsin inhibitor, with Pa = 0.491, Amine dehydrogenase inhibitor with Pa = 0.49 for molecule 56841530, or Gastrin inhibitor (Pa = 0.484) for 57507905.
Table 8.
Positive and negative effects of Phenylacetylindoles with probabilities greater than 0.5.
The adverse effects listed for the molecule 56841530 (with Pa 0.5) are common with those listed for 57507911 and 57507905. Fibrosis interstitial, Delirium, Dystonia, Dysphoria, Hematuria, Hypothermic, Cyanosis, and Conjunctivitis are common in 57507911 and 57507905, with Pa > 0.5, and appear for 56841530 (Table S1, Supplementary material) with probabilities between 0.424 and 0.468.
The molecule 56463 has Antineurotic (Pa > 0.7), Gluconate 2-dehydrogenase (acceptor) inhibitor, Calcium channel (voltage-sensitive) activator, Aspulvinone dimethylallyl transferase inhibitor, and Gastrin inhibitor (Pa > 0.54) positive effects, and Twitching, Hepatitis, Dystonia, and Nephritis adverse effects (Pa > 0.512). These effects are common to the other molecules in Group 2, with probabilities over 0.5. Still, there are common effects with the other molecules in Group 2, with smaller probabilities, which explain the presence of 56463 in a separate cluster in Figure 7.
An analogous procedure has been applied to the Phenylacetylindoles. Table 8 contains the positive and negative effects of the molecules in this group, with probabilities of apparition greater than or equal to 0.5. All molecules but 53494930 have antineurotic effects, all but 11616723 are Gluconate 2-dehydrogenase (acceptor) inhibitors, most of them act as Taurine dehydrogenase inhibitors and Thromboxane B2 antagonists and antiallergics, with probabilities greater than 0.5. Some molecules have the same properties with probabilities between 0.3 and 0.5. For example, the molecules are Chlordecone reductase inhibitors, but the probability for 53494930 is 0.434 (Table S2 in Supplementary material).
The main negative effects with probabilities above 0.5 for almost all Phenylacetylindoles are shivering, twitching, sweating, and hypothermic. Still, the following probabilities have been computed: 0.478—44397500, 0.417—44397540, 0.439—53494950, 0.499—53394099. For CID 11616723, the probability to act as hypothermic is 0.423. For 53394099, the following probabilities have been computed: 0.387—shivering, 0.447—twitching, 0.286—hypothermic. The effects that appear with probabilities between 0.3 and 0.5 are presented in Table S2 (Supplementary Materials).
To validate the clustering from Figure 7, the Kruskal–Wallis test has been performed to the series of probabilities corresponding to the most significant effects of the elements in both groups (presented in Table 9 and Table 10).
Table 9.
The series of probabilities used to perform the Kruskal–Wallis test on Group 1. The bold numbers are probabilities less than 0.5.
Table 10.
The series of probabilities used to perform the Kruskal–Wallis test on Group 2. The bold numbers are probabilities less than 0.5.
The main effects were considered those whose probabilities are higher than 0.5 for at least one molecule. If another molecule has the same effect, the associated probability is filled in Table 9 or Table 10, depending on the group to which it belongs. If the molecule does not have a certain effect, the probability filled in the tale is zero.
The p-value for the test performed with all 14 series (putting together the effects from Table 9 and Table 10) is 0.000, so the null hypothesis can be rejected, meaning that there are significant differences in the series distributions.
To distinguish the series resulting from the same distribution, the same test has been performed for the first three molecules in Group 1 (belonging to the second cluster), the last four molecules in Group 1 (belonging to the third cluster), and Group 2 (the third cluster), respectively. The corresponding p-values are 0.4362, 0.1128, and 0.1004, respectively. Since all are higher than 0.05, it results that the series in each of the three clusters are not significantly different from the viewpoint of their positive effects.
Similar tests, performed for the negative effects, lead to the same results. So, the clustering is validated.
4. Conclusions
In this research, the authors utilized the Cheminformatics methods for the analysis of the Benzoylindole and Phenylacetylindole groups of drugs that complete the knowledge [39] about them. Similarity indices and clustering techniques have emphasized the structural similarities and differences between these groups. The highest similarities exist between the molecules in the second group. These are emphasized by the second group’s dendrograms (the length of the highest branches being 0.3, the other being lower than 0.22). By comparison, the branches’ sizes in the dendrogram of Group 1 are generally larger than for Group 2.
The comparisons of the biological activities spectra show that the most similar activities of the molecules in the first group are those of 57507911, 56841530, and 57507905, confirming the grouping provided by the dendrogram (Figure 5b). Analogous conclusions can be drawn from the dendrogram for Group 2 (Figure 5d).
Performing the k-means algorithm for k = 3 results in three clusters, one containing all the molecules in Group 2, while the other two being formed by three and four molecules in Group 1. Performing the same analysis for k = 2 results in two clusters (superposed to Groups 1 and 2). Still, the best clustering is obtained for k = 3 because between the sum of squares/total sum of squares of the distances is 52.0%, compared to only 31.6%, for k = 2.
To validate the clustering results, the probabilities of the main effects of the activity spectra have been utilized to build series to which the Kruskal–Wallis test has been applied. The test results are in concordance with the grouping issued by the k-means algorithm.
Given that the activity spectra have been determined with certain probabilities, future experimental studies should confirm the findings related to particular actions of the molecules of interest and the clustering validation. While this kind of experiment involves human subjects, it is challenging and time-consuming to conduct it without considering the necessary infrastructure, protocols that must be defined and followed, and the approvals that must be obtained. Therefore, our study may be considered as the first step in larger research on these two groups of drugs.
Supplementary Materials
The following supporting information can be downloaded at: https://www.mdpi.com/article/10.3390/math10091543/s1, Table S1: Positive and negative effects of the molecules in Group 1, and the probabilities of their activities; Table S2: Positive and negative effects of the mol-ecules in Group 2, and the probabilities of their activities.
Author Contributions
Conceptualization, L.B. and C.Ș.D.; methodology, A.B.; software, A.B. and C.Ș.D.; validation, A.B., L.B. and C.Ș.D.; formal analysis, L.B.; investigation, A.B., L.B. and C.Ș.D.; resources, A.B.; data curation, L.B.; writing—original draft preparation, A.B., L.B. and C.Ș.D.; writing—review and editing, C.Ș.D.; supervision, A.B.; project administration, A.B. All authors have read and agreed to the published version of the manuscript.
Funding
This research received no external funding.
Institutional Review Board Statement
Not applicable.
Informed Consent Statement
Not applicable.
Data Availability Statement
Data has been downloaded from PubChem: https://pubchem.ncbi.nlm.nih.gov (accessed on 15 May 2021).
Conflicts of Interest
The authors declare no conflict of interest.
References
- Hardon, A. Chemical Youth. In Critical Studies in Risk and Uncertainty; Palgrave Macmillan: Cham, Switzerland, 2021; pp. 81–111. [Google Scholar] [CrossRef]
- EMCDDA. European Monitoring Centre for Drugs and Drug Addiction, Drug-Related Deaths and Mortality in Europe. 2019. Available online: https://www.emcdda.europa.eu/system/files/publications/11485/20193286_TD0319444ENN_PDF.pdf (accessed on 10 February 2022).
- O’Mahony Carey, S. Psychoactive Substances. A Guide to Ethnobotanical Plants and Herbs, Synthetic Chemicals, Compounds and Products, Health Service Executive South (Edition 1.1). Available online: http://lab.bnn.go.id/nps_alert_system/publikasi%20web/Psychoactive%20plant/Psychoactive_plant.pdf (accessed on 15 May 2021).
- EMCDDA. European Monitoring Center for Drugs and Drugs Addiction, Perspectives on Drugs Health Responses to New Psychoactive Substances. 2016. Available online: https://www.emcdda.europa.eu/system/files/publications/2933/NPS%20health%20responses_POD2016.pdf (accessed on 15 May 2021).
- EMCDDA. European Monitoring Center for Drugs and Drugs Addiction, Perspectives on Drugs Synthetic Cannabinoids in Europe. 2017. Available online: https://www.emcdda.europa.eu/system/files/publications/2753/POD_Synthetic%20cannabinoids0.pdf (accessed on 15 May 2021).
- UNODC. United Nations Office on Drugs and Crime, Global Overview of Drug Demand and Supply. 2019. Available online: https://wdr.unodc.org/wdr2019/prelaunch/WDR19_Booklet_2_DRUG_DEMAND.pdf (accessed on 10 February 2022).
- Shafi, A.; Berry, A.J.; Sumnall, H.; Wood, D.M.; Tracy, D.K. New psychoactive substances: A review and updates. Ther. Adv. Psychopharmacol. 2020, 10, e2045125320967197. [Google Scholar] [CrossRef] [PubMed]
- van Amsterdam, J.; Nutt, D.; van den Brink, W. Generic legislation of new psychoactive drugs. J. Psychopharmacol. 2013, 27, 317–324. [Google Scholar] [CrossRef] [PubMed]
- Elliott, L.; Haddock, C.K.; Campos, S.; Benoit, E. Polysubstance use patterns and novel synthetics: A cluster analysis from three U.S. cities. PLoS ONE 2019, 14, e0225273. [Google Scholar] [CrossRef] [PubMed]
- Vlădescu, C.; Scîntee, S.G.; Olsavszky, V.; Hernández-Quevedo, C.; Sagan, A. Romania: Health System Review. Health Syst. Trans. 2016, 18, 1–170. [Google Scholar]
- Ernst, L.; Langer, N.; Bockelmann, A.; Salkhordeh, E.; Beuerle, T. Identification and quantification of synthetic cannabinoids in ‘spice-like’ herbal mixtures: Update of the German situation in summer 2018. Forensic Sci. Int. 2019, 294, 96–102. [Google Scholar] [CrossRef] [PubMed]
- Zapata, F.; Matey, J.M.; Montalvo, G.; García-Ruiz, C. Chemical classification of new psychoactive substances (NPS). Microchem. J. 2021, 163, 105877. [Google Scholar] [CrossRef]
- Lesiak, A.D.; Shepard, J.R. Recent advances in forensic drug analysis by DART-MS. Bioanalysis 2014, 6, 819–842. [Google Scholar] [CrossRef]
- Mignani, S.; Rodrigues, J.; Tomas, H.; Jalal, R.; Pal Singh, P.; Majoral, J.P.; Vishwakarma, R.A. Present drug-likeness filters in medicinal chemistry during the hit and lead optimization process: How far can they be simplified? Drug Discov. Today 2018, 23, 605–615. [Google Scholar] [CrossRef]
- Rogers, P.J. Food and drug addictions: Similarities and differences. Pharmacol. Biochem. Behav. 2017, 153, 182–190. [Google Scholar] [CrossRef] [Green Version]
- Alves, V.L.; Gonçalves, J.L.; Aguiar, J.; Teixeira, H.M.; Câmara, J.S. The synthetic cannabinoids phenomenon: From structure to toxicological properties. A review. Crit. Rev. Toxicol. 2020, 50, 359–382. [Google Scholar] [CrossRef]
- Soltaninejad, K. Clinical and Forensic Toxicological Aspects of Synthetic Cannabinoids: A Review and Update. Asia Pac. J. Med. Toxicol. 2020, 9, 108–118. [Google Scholar] [CrossRef]
- Potts, A.J.; Cano, C.; Thomas, S.H.L.; Hill, S.L. Synthetic cannabinoid receptor agonists: Classification and nomenclature. Clin. Toxicol. 2020, 58, 82–98. [Google Scholar] [CrossRef] [PubMed]
- Kwon, S.; Bae, H.; Jo, J. Comprehensive ensemble in QSAR prediction for drug discovery. BMC Bioinformatics 2019, 20, 521. [Google Scholar] [CrossRef]
- Gini, G. The QSAR similarity principle in the deep learning era: Confirmation or revision? Found Chem. 2020, 22, 383–402. [Google Scholar] [CrossRef]
- Stumpfe, D.; Hu, H.; Bajorath, J. Evolving Concept of Activity Cliffs. ACS Omega 2019, 4, 14360–14368. [Google Scholar] [CrossRef]
- Examples of Fingerprint and Descriptors. Available online: https://www.cambridgemedchemconsulting.com/resources/hit_identification/examples_descriptors.php (accessed on 11 February 2021).
- Godden, J.W.; Stahura, F.L.; Bajorath, J. Anatomy of fingerprint search calculations on structurally diverse sets of active compounds. J. Chem. Inf. Model. 2005, 45, 1812–1819. [Google Scholar] [CrossRef] [PubMed]
- Voicu, A.; Duteanu, N.; Voicu, M.; Daliborca, V.; Dumitrascu, V. The rcdk and cluster R packages applied to drug candidate selection. J. Cheminformatics 2020, 12, 3. [Google Scholar] [CrossRef] [Green Version]
- Swandana, R.; Aisyah, P.; Syahdi, R.R. Prediction analysis of pharmacokinetic parameters of several oral systemic drugs using in silico method. Int. J. Appl. Pharm. 2020, 12, 260–263. [Google Scholar] [CrossRef]
- Leelananda, S.P.; Lindert, S. Computational Methods in Drug Discovery. Beilstein J. Org. Chem. 2016, 12, 2694–2718. [Google Scholar] [CrossRef] [Green Version]
- Sliwoski, G.; Kothiwale, S.; Meiler, J.; Lowe, E.W., Jr. Computational Methods in Drug Discovery. Pharmacol. Rev. 2014, 66, 334–395. [Google Scholar] [CrossRef] [Green Version]
- Willett, P. Similarity Searching Using 2D Structural Fingerprints. In Chemoinformatics and Computational Chemical Biology; Bajorath, J., Ed.; Humana Press: Totowa, NJ, USA, 2011; pp. 133–158. [Google Scholar] [CrossRef] [Green Version]
- Guha, R.; Gilbert, K.; Fox, G.; Pierce, M.; Wild, D.; Yuan, H. Advances in cheminformatics methodologies and infrastructure to support the data mining of large, heterogeneous chemical datasets. Cur. Comput.-Aid. Drug 2010, 6, 50–67. [Google Scholar] [CrossRef] [PubMed]
- Cao, Y.; Charisi, A.; Cheng, L.C.; Jiang, T.; Girke, T. ChemmineR: A compound mining framework for R. Bioinformatics 2008, 24, 1733–1734. [Google Scholar] [CrossRef] [PubMed] [Green Version]
- Wang, Y.; Backman, T.W.; Horan, K.; Girke, T. fmcsR: Mismatch tolerant maximum common substructure searching in R. Bioinformatics 2013, 29, 2792–2794. [Google Scholar] [CrossRef] [PubMed] [Green Version]
- Guha, R. Chemical Informatics Functionality in R. J. Stat. Softw. 2007, 18, 1–16. [Google Scholar] [CrossRef] [Green Version]
- Guha, R.; Cherto, M.R. rcdk: Integrating the CDK with R. Available online: https://mran.microsoft.com/snapshot/2017-02-04/web/packages/rcdk/vignettes/rcdk.pdf (accessed on 15 May 2021).
- Mente, S.; Kuhn, M. The use of the R language for medicinal chemistry applications. Curr. Top. Med. Chem. 2012, 12, 1957–1964. [Google Scholar] [CrossRef] [PubMed]
- Alvarsson, J.; Lampa, S.; Schaal, W.; Andersson, C.; Wikberg, J.E.S.; Spjuth, O. Large-scale ligand-based predictive modelling using support vector machines. J. Cheminform. 2016, 8, 39. [Google Scholar] [CrossRef] [Green Version]
- Marth, C.J.; Gallego, G.M.; Lee, J.C.; Lebold, T.P.; Kulyk, S.; Kou, K.G.M.; Qin, J.; Lilien, R.; Sarpong, R. Network-analysis-guided synthesis of weisaconitine D and liljestrandinine. Nature 2015, 528, 493–498. [Google Scholar] [CrossRef] [Green Version]
- Segler, M.H.S.; Waller, M.P. Modelling chemical reasoning to predict and invent reactions. Chem. Eur. J. 2017, 23, 6118–6128. [Google Scholar] [CrossRef] [Green Version]
- Willighagen, E.L.; Mayfield, J.W.; Alvarsson, J.; Berg, A.; Carlson, L.; Jeliazkova, N.; Kuhn, S.; Pluskal, T.; Rojas-Chertó, M.; Spjuth, O.; et al. The Chemistry Development Kit (CDK) v2.0: Atom typing, depiction, molecular formulas, and substructure searching. J. Cheminform. 2017, 9, 33. [Google Scholar] [CrossRef] [Green Version]
- Bărbulescu, A.; Barbeș, L.; Dumitriu, C.-Ş. Computer-Aided Classification of New Psychoactive Substances. J. Chem. 2021, 2021, 4816970. [Google Scholar] [CrossRef]
- PubChem. Available online: https://pubchem.ncbi.nlm.nih.gov (accessed on 5 May 2021).
- Kubinyi, H. Hydrogen Bonding: The Last Mystery in Drug Design. In Pharmacokinetic Optimization in Drug Research: Biological, Physicochemical, and Computational Strategies; Testa, B., van de Waterbeemd, H., Folkers, G., Guy, R., Eds.; Verlag Helvetica Chimica Acta: Zürich, Switzerland, 2001; pp. 513–521. [Google Scholar]
- Caron, G.; Vallaro, M.; Ermondi, G. Log P as a tool in intramolecular hydrogen bond considerations. Drug Discov. Today 2018, 27, 65–70. [Google Scholar] [CrossRef] [PubMed] [Green Version]
- Patrick, G.L. An Introduction to Médicinal Chemistry; Oxford University Press: Oxford, UK, 1995. [Google Scholar]
- Cuesta, S.A.; Mora, J.R.; Márquez, E.A. In Silico Screening of the DrugBank Database to Search for Possible Drugs against SARS-CoV-2. Molecules 2021, 26, 1100. [Google Scholar] [CrossRef] [PubMed]
- Ertl, P.; Rohde, B.; Selzer, P. Fast Calculation of Molecular Polar Surface Area as a Sum of Fragment-Based Contributions and Its Application to the Prediction of Drug Transport Properties. J. Med. Chem. 2000, 43, 3714–3717. [Google Scholar] [CrossRef] [PubMed]
- Vistoli, G.; Pedretti, A. Molecular Fields to Assess Recognition Forces and Property Spaces. Comp. Med. Chem. II 2007, 5, 577–602. [Google Scholar]
- Turner, J.V.; Agatonovic-Kustrin, S. In Silico Prediction of Oral Bioavailability. Comp. Med. Chem. II 2007, 5, 699–724. [Google Scholar]
- Chen, X.; Reynolds, C.H. Performance of Similarity Measures in 2D Fragment-Based Similarity Searching: Comparison of Structural Descriptors and Similarity Coefficients. J. Chem. Inf. Comput. Sci. 2002, 42, 1407–1414. [Google Scholar] [CrossRef]
- Monev, V. Introduction to Similarity Searching in Chemistry. Match-Commun. Math. Comp. Chem. 2004, 51, 7–38. [Google Scholar]
- Bajusz, D.; Rácz, A.; Héberger, K. Why is Tanimoto index an appropriate choice for fingerprint-based similarity calculations? J. Cheminformatics 2015, 7, 20. [Google Scholar] [CrossRef] [Green Version]
- Tversky, A. Features of Similarity. Psychol. Rev. 1977, 84, 327–352. [Google Scholar] [CrossRef]
- Jarvis, R.A.; Patrick, E.A. Clustering Using a Similarity Measure Based on Shared Near Neighbors. IEEE Trans. Comput. 1973, 22, 1025–1034. [Google Scholar] [CrossRef]
- Murtagh, F.; Contreras, P. Algorithms for hierarchical clustering: An overview. Wiley Interdiscip. Rev. Data Min. Knowl. Discov. 2021, 2, 86–97. [Google Scholar] [CrossRef]
- Ward, J.H., Jr. Hierarchical Grouping to Optimize an Objective Function. J. Am. Stat. Assoc. 1963, 58, 236–244. [Google Scholar] [CrossRef]
- Lagunin, A.; Stepanchikova, A.; Filimonov, D.; Poroikov, V. PASS: Prediction of activity spectra for biologically active substances. Bioinformatics 2000, 16, 747–748. [Google Scholar] [CrossRef] [PubMed]
- Filimonov, D.A.; Lagunin, A.A.; Gloriozova, T.A.; Rudik, A.V.; Druzhilovskii, D.S.; Pogodin, P.V.; Poroikov, V.V. Prediction of the biological activity spectra of organic compounds using the PASS online web resource. Chem. Heterocyclic Comp. 2014, 50, 444–457. [Google Scholar] [CrossRef]
- Kruskal, W.H.; Wallis, W.A. Use of ranks in one-criterion variance analysis. J. Am. Stat. Assoc. 1952, 47, 583–621. [Google Scholar] [CrossRef]

Publisher’s Note: MDPI stays neutral with regard to jurisdictional claims in published maps and institutional affiliations. |
© 2022 by the authors. Licensee MDPI, Basel, Switzerland. This article is an open access article distributed under the terms and conditions of the Creative Commons Attribution (CC BY) license (https://creativecommons.org/licenses/by/4.0/).