Article

Platform Operations under Dual-Channel Catering Supply Chain

1
School of Business, Macau University of Science and Technology, Macau, China
2
School of Logistics Management and Engineering, Nanning Normal University, Nanning 530011, China
3
School of Fashion and Textiles, The Hong Kong Polytechnic University, Hongkong, China
*
Authors to whom correspondence should be addressed.
These authors contributed equally to this work.
Mathematics 2023, 11(16), 3610; https://doi.org/10.3390/math11163610
Submission received: 29 June 2023 / Revised: 6 August 2023 / Accepted: 18 August 2023 / Published: 21 August 2023
(This article belongs to the Special Issue Modeling, Simulation and Optimization of Supply Chains)

Abstract

:
In the modern catering business model, restaurants usually use established platforms to promote their food and use two channels to sell their food: online and offline sales. We construct demand functions for online and offline, considering promotion and substitution relationships by a revised Bertrand model. We first consider three classic models: the decentralized decision model, the equilibrium decision model, and the centralized decision model. In the decentralized decision model, the platform decides both the promotional effort and the online discount; in the equilibrium decision model, the platform decides the online discount, while the food service provider decides the promotional effort. In the centralized decision model, the takeaway platform and the food service provider have maximized the overall profit as the decisive goal. We find that the online discount decreases in price when the impact factor of the online promotion is high but increases in price when the impact factor of the online promotion is low. Then, we analyze and compare the results under three models. We find that when the substitution factor is low enough, or the impactor factor of online promotion is low enough, the global optimal platform discount is higher than the equilibrium platform discount and the decentralized online discount; otherwise, the results are the opposite. In addition, the global optimal promotional effort is always higher than the optimal promotional effort in the decentralized model. When the substitution factor is low enough, or the impactor factor of online promotion is low enough, the global optimal promotional effort is higher than the equilibrium optimal promotional effort; otherwise, the result is the opposite.

1. Background

With the rapid development of the Internet, the O2O (Online To Offline) business model has come into people’s daily lives, bringing great convenience to people. The O2O model is a combination of the physical economy and the Internet. Consumers can buy online and spend offline through the O2O platform. This business model can reduce the waste of resources. Internet platforms can use the O2O model to sell products to consumers. In this way, the platform uses its traffic to earn profits. Consumers can learn more about the products and purchase from the O2O platform to get a better buying experience. Merchants can also use the O2O platform to promote their products to increase sales volume and gain higher profits. Zhao et al. [1] believe that the takeout O2O model is one of the better-developed branches of the O2O business model. On the one hand, this is because the O2O model brings great convenience to people, on the other hand, it is because the platforms have attracted many consumers through price subsidies.
The takeaway O2O platform is developing rapidly while facing many problems. Zhao et al. [1] point out that during the early development stages of the takeaway industry, most takeaway platforms expanded their markets by subsidizing them to attract customers. The price subsidies of the takeaway platform have an impact on the offline sales of the food service providers. Zhi-Wei et al. [2] point out that takeaway platforms will take away some of the profits of the restaurant industry, which may lead to a decline in the profits of food service providers.
Food service providers, represented by small and medium-sized food service providers, cannot promote their products well because of the limitation of channels. Therefore, they may need to rely on takeaway platforms represented by Meituan for promotion, and online takeout sales can also generate additional revenue for food service providers. On the other hand, there is some substitution between take-out and in-store dining, so there is competition between online and offline sales. Moreover, service providers have to share a portion of their online takeaway sales with the platform, which will also have an impact on their profits. Takeaway platforms rely on food service providers to provide takeaway goods. Likewise, takeaway sales are also affected by offline sales, so they also need to make reasonable decisions to maximize their profits.
Therefore, the game between the takeaway platform and the food service provider is a process that deserves in-depth study. In the modern catering business model, restaurants usually use two channels to sell their food: online and offline sales. Some restaurants use established platforms to promote and sell their food online. For example, the Meituan platform helps great chain restaurants to sell their food online, but the great chain restaurants control the promotion of their brand. The Eleme www.ele.me (accessed on 6 August 2023) takeaway platform usually integrates small restaurants to promote and sell their food online. Some restaurants build their platform to promote and sell their food online. This situation also exists in reality, where many large food service companies have the ability to advertise and build their own online takeaway sales platforms. KFC (Kentucky Fried Chicken) www.kfc.com (accessed on 6 August 2023), for example, has its own takeaway platform. In each case, what are the platform and restaurant’s optimal decisions to maximize their profits? In each model, how do the exogenous parameters, such as revenue share and promotion impact factor, affect the platform and the restaurant’s optimal decisions? How do the different models affect the platform and the restaurant’s optimal decisions and profits? In this work, we will answer the above research questions. We use a methodology that examines dual-channel decision models for the takeout industry.
In this paper, we first construct demand functions for online and offline, considering promotion as well as substitution relationships. The profit functions of food service providers and takeaway platforms in partial cooperation situations are subsequently constructed. In the partially cooperative case, food service providers need to rely on the platform to sell takeaways, after which they will share a portion of the revenue with the platform. In this case, we consider two classic models: the decentralized decision model and the equilibrium decision model. In the decentralized decision model, the platform decides both the promotional effort and the online discount; in the equilibrium decision model, the platform decides the online discount, while the food service provider decides the promotional effort. After that, we consider the case of full cooperation (centralized decision model), in which both the takeaway platform and the food service provider have maximized the overall profit as the decisive goal. In this case, we find the global optimal promotional effort and the global optimal platform discount. Then, we analyze and compare the results under three models. Our main innovation includes promotional effort as a decision variable and as a participant’s decision variable, along with the online discount. At the same time, we compare three different models, the decentralized decision model, the equilibrium decision model, and the centralized decision model, whereas other works in the literature mostly compare only two of them.
In Section 2, we review some of the relevant literature from recent years. In Section 3, we consider the case of a food service provider partially partnering with a takeaway platform. We first assume that the food service provider operates an independent offline channel while partnering with a takeaway platform to operate online sales. The takeaway platform will decide on adjusting the online price and the promotional effort according to its interests. We then consider the case that the food service provider chooses the level of promotion to be purchased from the platform and the platform decides on the adjustment of online prices. We calculate the optimal decision for these two scenarios and perform a sensitivity analysis. Then, we consider the case where the food service provider is fully partnered with an inside platform. This is where the food service provider and the platform can be considered as a whole part. The firm decides on the true price online and how much to advertise based on the total online and offline utility. Again, we find the optimal decision and perform a sensitivity analysis. In Section 4, we compare the results under partial cooperation with those under full cooperation. Conclusions are summarized in Section 5. Proofs of all lemmas and propositions are provided in Appendix A.

2. Literature Review
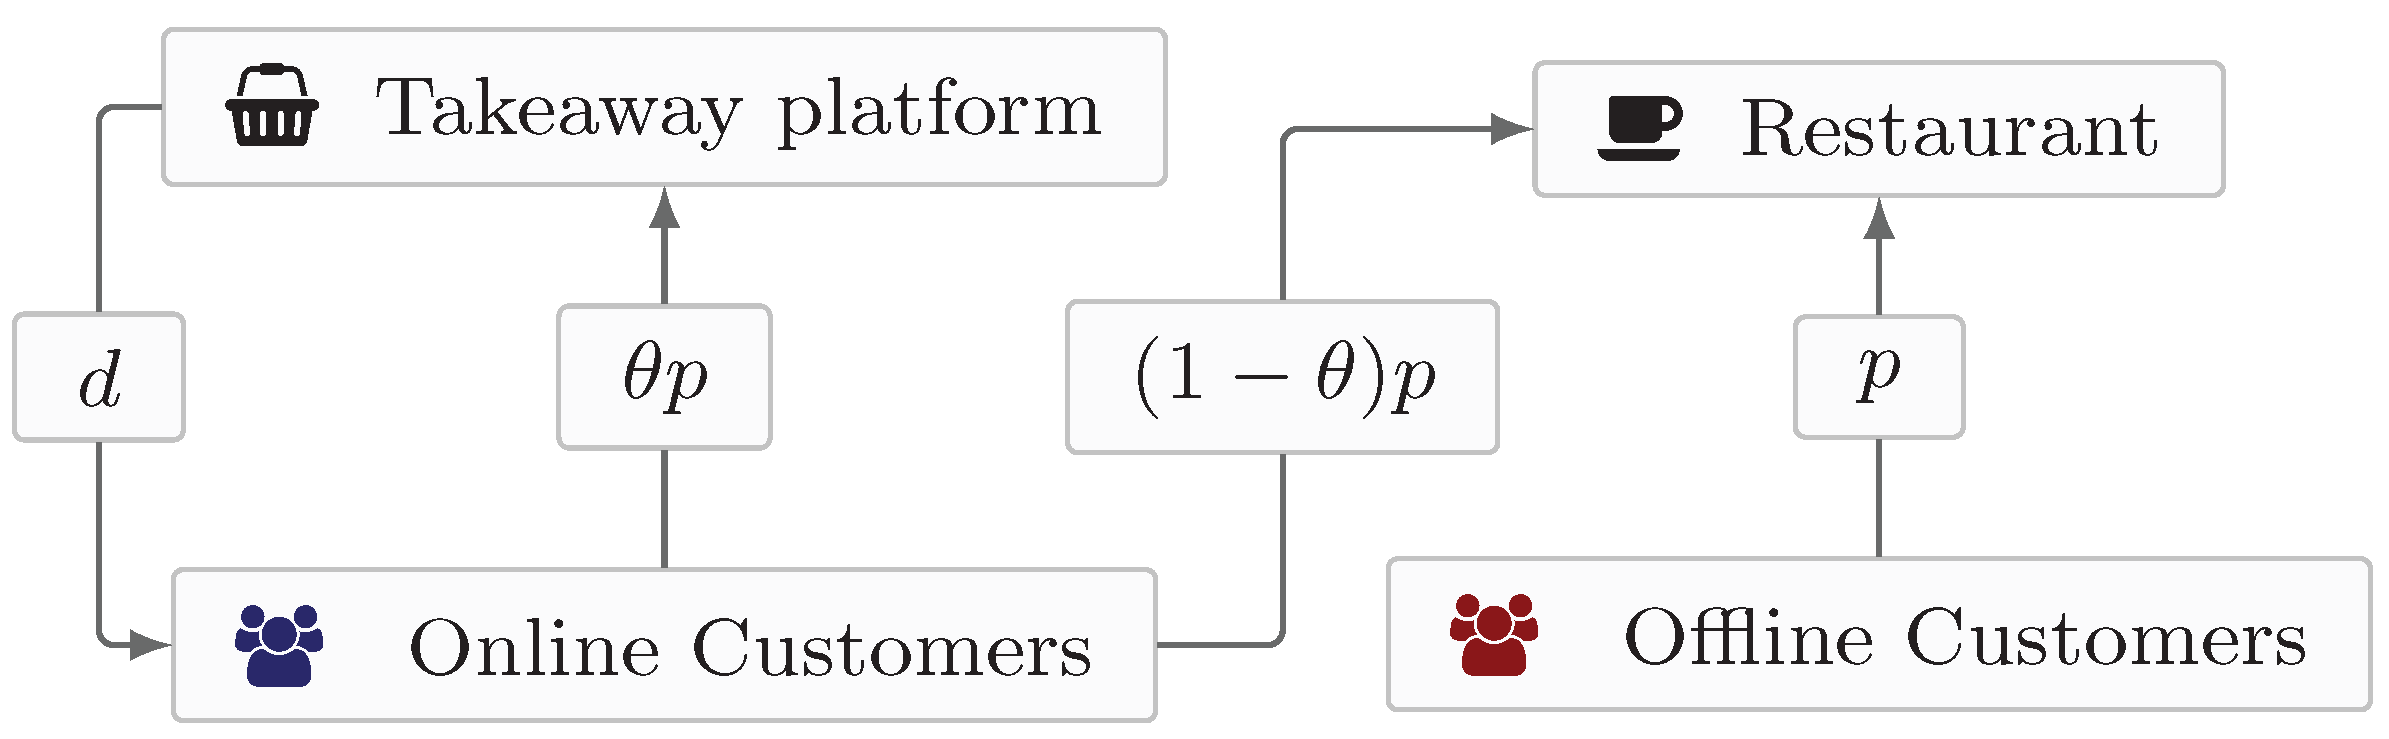
There are two streams in the literature: dual-channel and catering supply chain.
The first stream is the dual-channel business model. A classic dual-channel business model is the O2O or online-to-offline business model, which combines offline business opportunities with the Internet and makes the Internet a platform for offline transactions. Many scholars have studied group buying under an O2O model. Anand and Aron [3] studied the online group-buying market. Kauffman and Wang [4] assess the effectiveness of the group-buying business model and reveal the reasons why many group-buying sites fail. Lai et al. [5] examine how the degree of market price dispersion affects consumers’ intention to join group-buying transactions. Recently, Kim et al. [6] explored whether adopting the O2O model can effectively improve the competitiveness of small stores. Their study found that the emergence of O2O business models is changing the business environment in the retail industry and making companies more competitive. Qin and Hou [7] analyzed the advantages of the O2O model in the fresh produce industry, pointed out the problems of the domestic fresh produce O2O model, divided fresh produce into four categories, and proposed the corresponding O2O model. Pei et al. [8] found that the utility and ease of use of the O2O platform had a significant positive effect on user experience, the user experience of the O2O platform had a significant positive impact on user satisfaction, and the user satisfaction of the O2O platform had a significant positive effect on user loyalty.
Some scholars studied how to operate the dual-channel business model. Hsiao and Chen [9] studied the introduction of the Internet channel by manufacturers and found that manufacturers were more willing to use the Internet channel when it was either very profitable or less profitable. Zhang et al. [10] examine the “order online, pick up in store” strategy of a dual-channel retailer. In the monopoly case, it is found that this strategy decreases the retailer’s market share and reduces its profits. In the competitive case, this strategy increases the retailer’s market share and profits. Pei et al. [11] point out that due to the growth of e-commerce, many manufacturers are opening their online channels, leading to intense channel competition with offline retailer partners. This study proposes an innovative coordination mechanism where manufacturers’ rebates to offline consumers are combined with volume discounts for retailers. This coordination mechanism can be used to reduce channel competition and enhance profits for both parties. Govindan and Malomfalean [12] demonstrates that the O2O business model using a coordination mechanism can achieve the best results and highest earnings in the case of demand determination; the same results were obtained in the case of random demand. Viswanathan and Wang [13] consider a single-supplier, single-retailer distribution channel and find that offering discounts allows perfect supply chain coordination. Lei et al. [14] analyze the effects of strategic consumer behaviors on online retailers and offline retailers in a dual-channel supply chain and find that a more patient consumer would not wait for a lower price in Period 2. Yi et al. [15] study the differential pricing of a dual-channel supply chain. The results show that the total profit of a supply chain under the centralized decision scenario is better than the decentralized decision scenario. Fang et al. [16] discuss a closed-loop supply chain composed of an OEM, an AR that is licensed by the OEM to carry out remanufacturing activities in the presence of strategic consumers under carbon cap-and-trade regulations. The results showed that optimal decisions are affected by the carbon price, carbon allowance allocation, and consumer preferences for remanufactured products. Zhao and Zhou [17] explored the impacts of two-sided market platforms on participants’ trading strategies and found that the platform plays a crucial role in coordinating and guiding participants on both sides.
The second literature stream is the catering supply chain. The food service provider industry is now an industry that commonly uses the O2O model, and due to the rapid development of the take-out industry in recent years, there have been many related studies. Zhao et al. [1] studied the development status of O2O takeaway industry in China. Chen et al. [18] found that when a food service provider has many traditional customers, joining a takeaway platform may simply change the composition of customers, at which point take-out can hurt the food service provider. Food service providers and takeaway platforms can coordinate to create a win-win situation. Du et al. [19] studied four takeaway models: 1. self-built platform and self-delivery, 2. self-built platform and third-party delivery, 3. third-party platform and self-delivery, and 4. third-party platform and third-party delivery. Pei et al. [20] use a neural network model to evaluate the customer experience of food service provider O2O take-out and conduct simulation training to obtain a model that can evaluate the customer experience of food service provider O2O take-out. Yeo et al. [21] studied the relationship between consumers’ attitudes and behavioral willingness to sell services to others. Jun et al. [22] studied the factors influencing customers’ willingness to use online meal delivery services during the COVID-19 epidemic.
Wang [23] constructs an onsite and offsite promotion decision model and compares the results based on the decentralized decision situation, centralized decision situation, and promotion investment sharing situation. The results show that centralized decision makes the onsite promotion investment decrease. The food service provider industry tends to offer discounts for online consumption in the O2O model. Zhang et al. [24] used data from food service providers in Shanghai, China to conduct a new empirical analysis on prices and coupons and found that the average price of food service providers that provide coupons is higher than that of similar food service providers that do not issue coupons. Luo and Ni [25] studied the problem of price subsidies in the take-out industry and found that in the scenario with price subsidies, food service providers always raise their sales prices; the price increase is proportional to the strength of the subsidies, and the price subsidies can bring higher profits to both parties. Zheng and Guo [26] studied the best pricing strategy for food service providers working with third-party websites in a competitive environment. The results suggest that all food service providers should not be encouraged to participate in online price discounts. This is especially true for food service providers with fixed service capacity. When the number of offline loyal customers is relatively small, participation and online price discounts are recommended.
The innovation of our study is that we consider the optimal promotional effort along with the platform’s optimal online discount or surcharge. Tang et al. [27] investigates the decision optimization problem of a manufacturer and a retailer in the wholesale and direct selling dual channels under centralized and decentralized decision-making. Under centralized decision-making, the supply chain maximizes profits by optimizing prices in both channels. Under decentralized decision-making, the manufacturer maximizes its profit by optimizing the wholesale price and the direct selling price, and the retailer maximizes its profit by optimizing the retail price. Dan et al. [28]’s study of the decision optimization problem for dual channels under centralized and decentralized decision-making takes into account the additional variable of service level, which affects the demand in both channels. There are few studies in the literature that examine the impact of promotion on the takeaway industry. We consider the discount or surcharge on the online price and the variable of promotional effort. The promotional effort affects demand in both channels as well. In addition, we consider the case where only the platform makes the decision.

3. Model

There are three scenarios: decentralized decision model, separate decision model, and centralized decision model. The main difference between the three scenarios is who decides the platform’s discount and the promotional effort. In the decentralized decision model, the takeaway platform decides both the platform’s discount and the promotional effort; in the separate decision model, the platform decides the promotional effort while the food service provider decides the platform’s discount; in the centralized decision model, the platform and the food service provider are considered as a centralized whole and decide both the platform’s discount and the promotional effort.

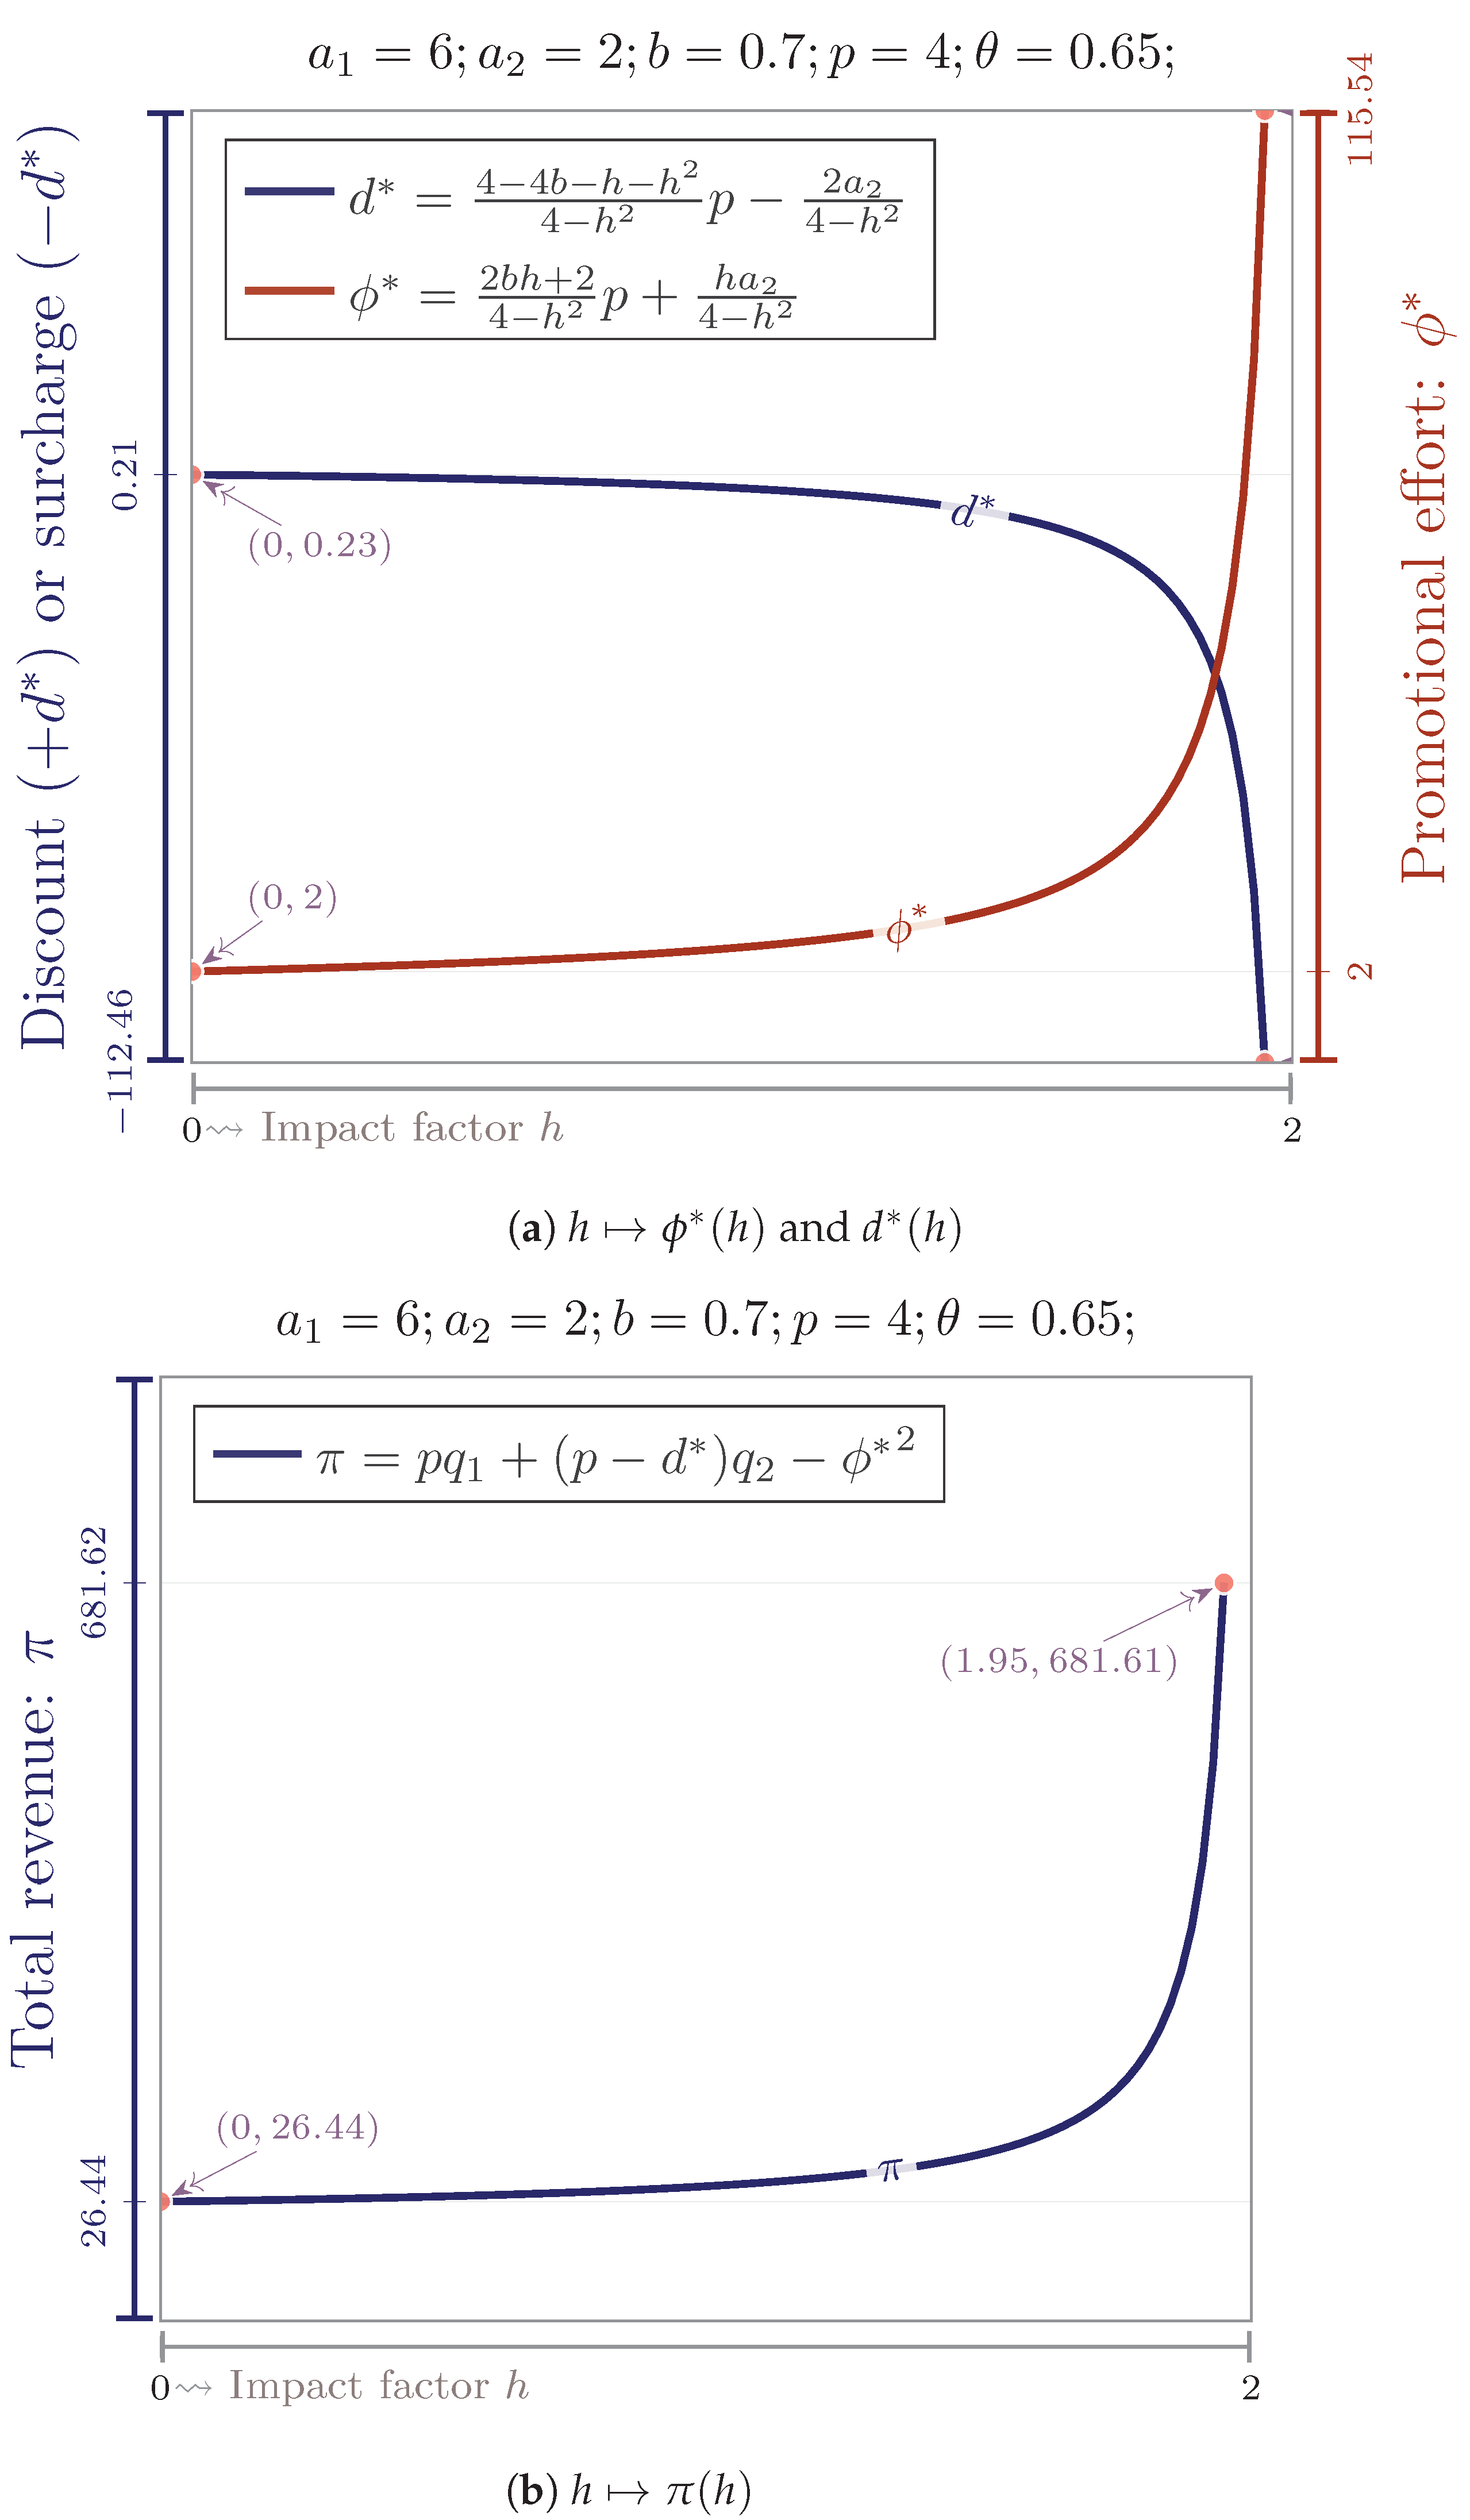
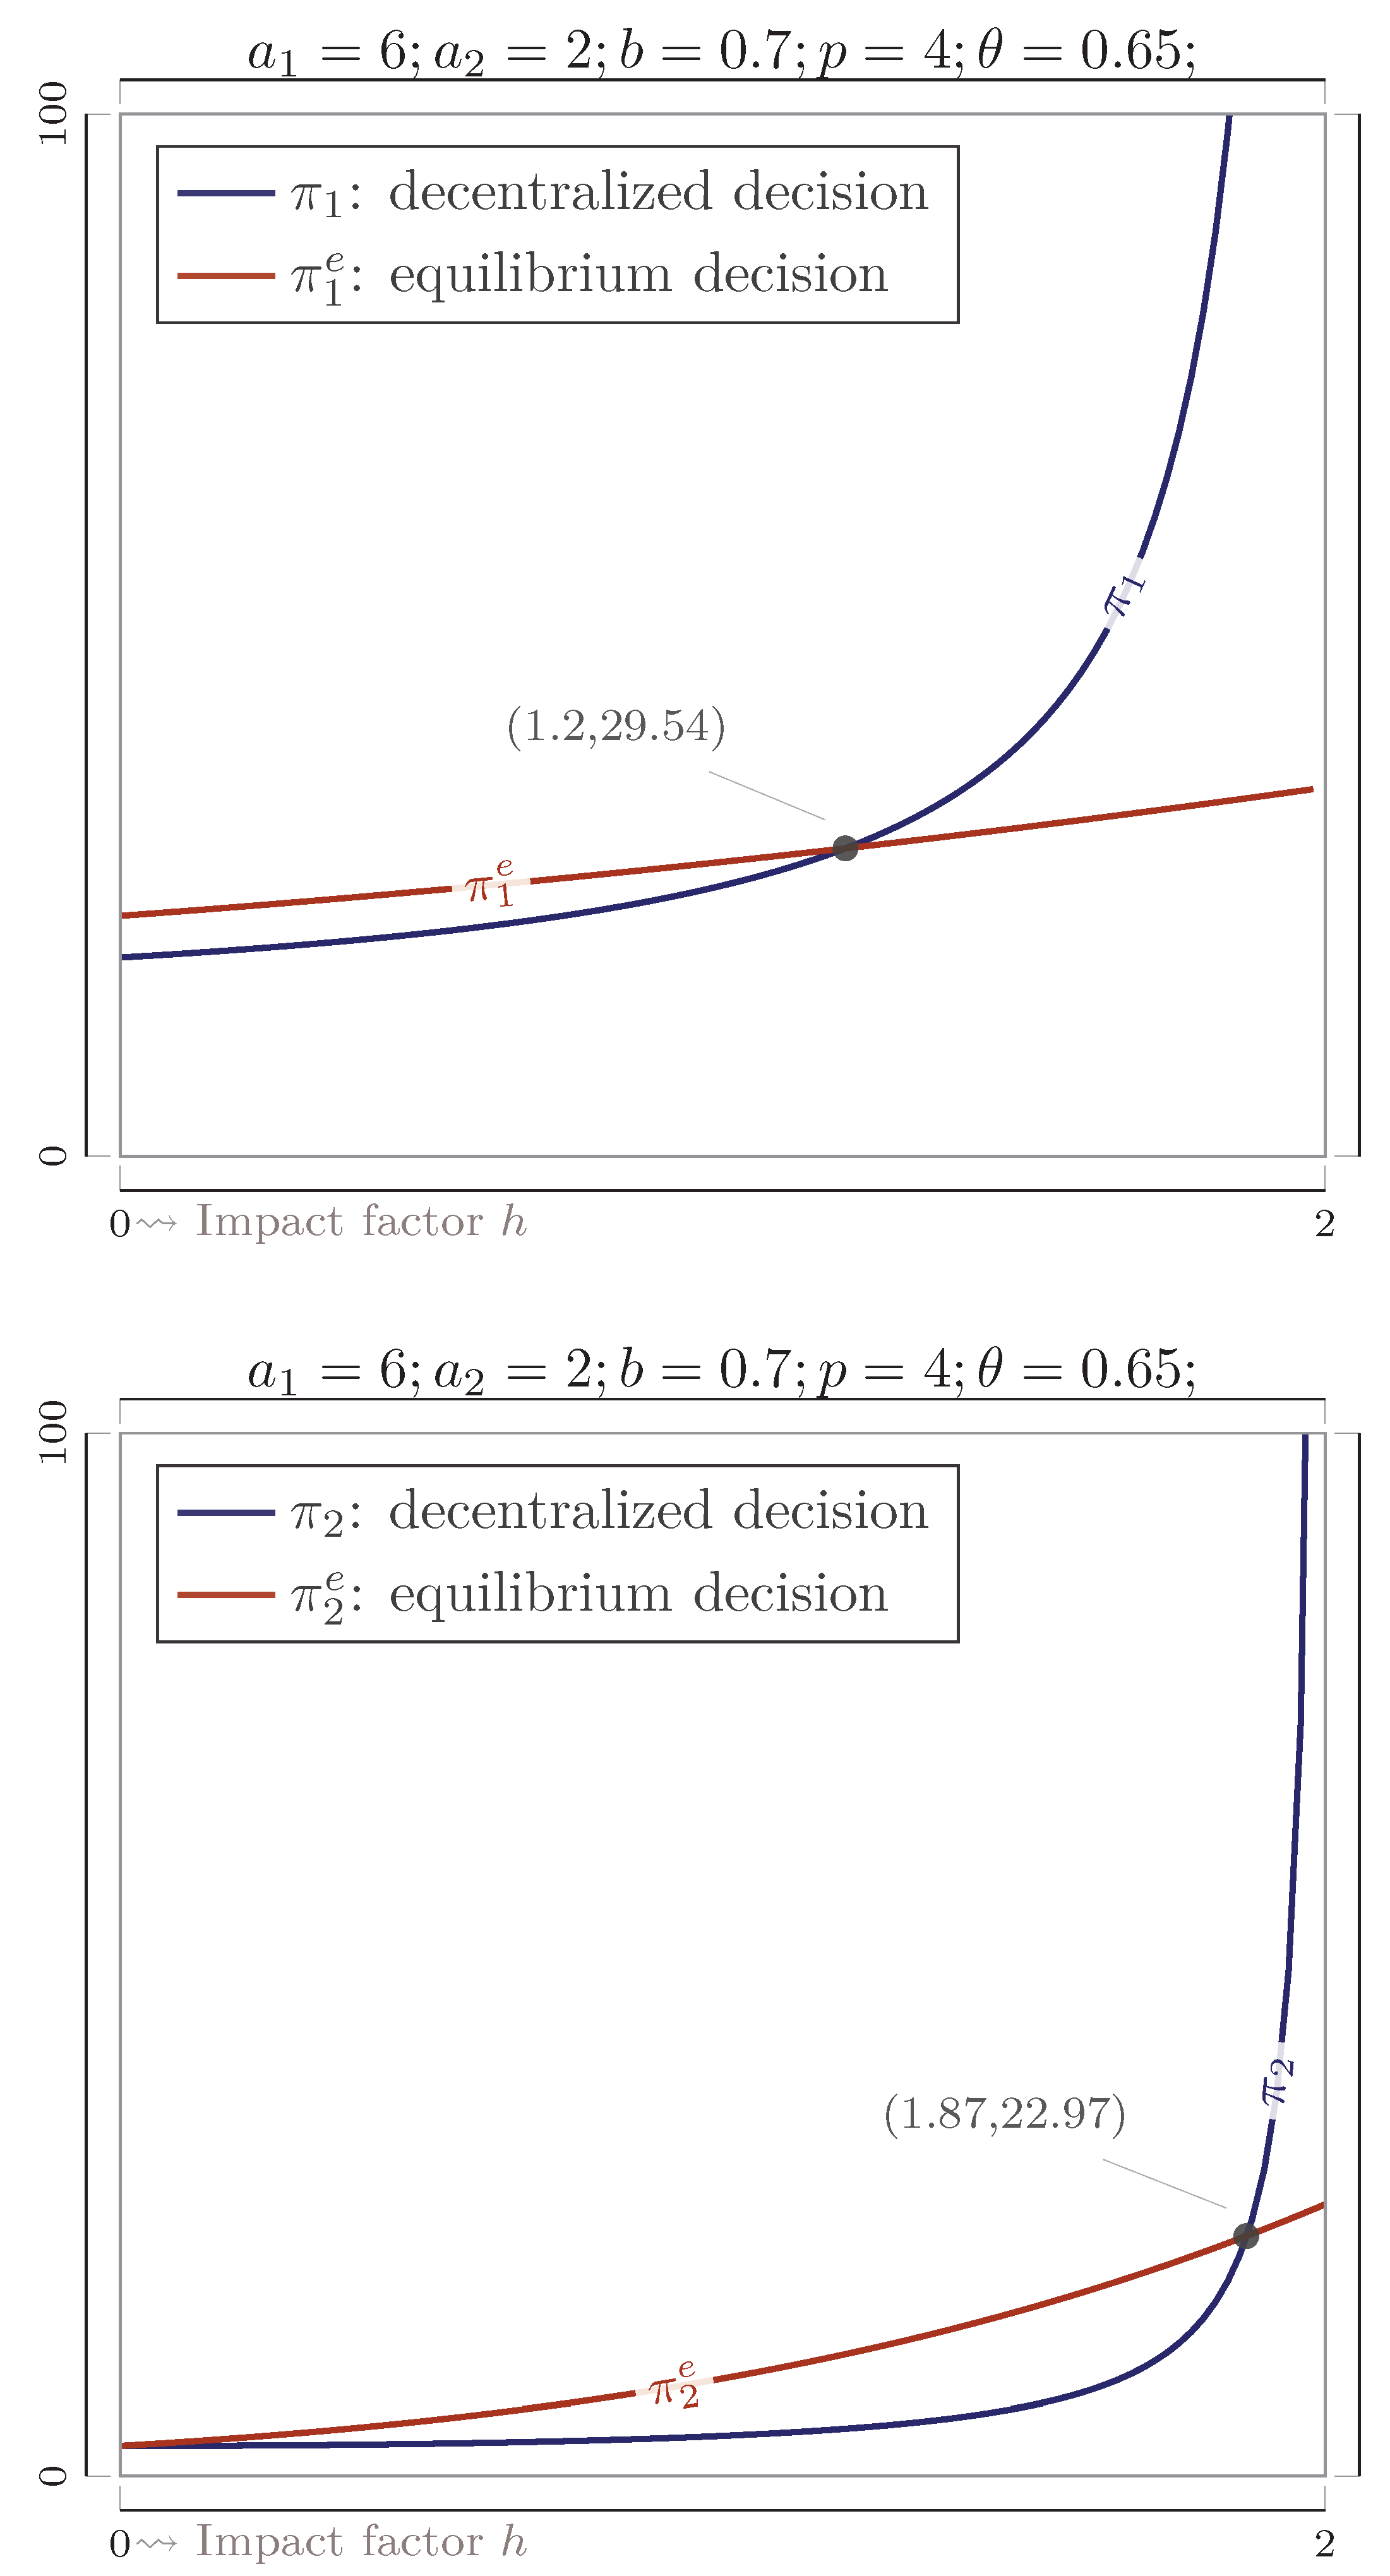
3.1. Decentralized Decision Model

First of all, let us consider the decentralized decision model.
In this model, we assume that there is only one platform and one food service provider in the market. The food service provider operates offline sales, while online takeaways are sold through the platform. In this section, we assume that the food service provider relies on the platform to help promote its products. The promotion affects the number of people who dine offline and order takeaway online. The offline sales price is p. The online sales price is the same as the offline sales price. (See Figure 1). Usually, the platform will either provide a discount or charge a surcharge for the online sales to differentiate pricing from the offline sales, which we assume to be d. Note that d can be negative, indicating that the platform will then choose to charge a surcharge instead of providing a discount, so the actual online sales price for customers is  p d . The platform takes a percentage of revenue from online sales as a revenue share, which is  θ . The platform will promote the products with a promotional effort of  ϕ , which is determined by the platform, and we assume that the cost is  ϕ 2 . The magnitude of the impact of promotion on the online and offline markets is different. We assume that the promotion with degree  ϕ  can increase the offline market by  ϕ  and the online market by  h ϕ , where h is the coefficient of the impact of promotion on the online market. The degree of promotion online and offline will not differ much, and to make the model meaningful, we assume that  h < 2 . The original market sizes online and offline were  a 1  and  a 2 . The definitions of the symbols can be found in Table 1.
After determining the operational flow of the model, we can construct expressions for the offline demand of the food service provider as well as the online demand of the platform. We use a Bertrand model to construct the offline demand and online demand. The offline demand is
q 1 = a 1 + ϕ p + b ( p d ) ,
while the online demand function is
q 2 = a 2 + h ϕ ( p d ) + b p .
Thus, the profit of the food service provider is
π 1 = p q 1 + ( 1 θ ) p q 2 ,
where  p q 1  is the offline revenue while  ( 1 θ ) p q 2  is the online revenue.
The profit of the platform is
π 2 = ( θ p d ) q 2 ϕ 2 ,
where  ( θ p d ) q 2  is the revenue for the platform while  ϕ 2  is the promotional effort cost for the platform.
Due to this, the platform may sell products from multiple food service providers simultaneously, so the proportion of profits from the platform is generally fixed. In this scenario, the platform maximizes its profit by determining both  ϕ  and d. The optimization function is as follows:
max d , ϕ π 2 = ( θ p d ) q 2 ϕ 2 .
Solving the above optimization function, we obtain the following lemma.
Lemma 1.
The optimal platform discount is
d c = 2 ( 1 + θ b ) p θ h 2 p 2 a 2 4 h 2 ,
and the optimal promotional effort is
ϕ c = h ( θ + b 1 ) p + h a 2 4 h 2 .
The optimal platform discount  d c  and the optimal promotional effort  ϕ c  are affected by the exogenous parameters. Next, we analyze the impact of the parameters on the optimal platform discount and the optimal promotional effort. We get the following proposition.
Proposition 1.
(i) 
If  b < 1 + θ θ h 2 2 d c  increase in p, else decreases in p, and if  b > 1 θ ϕ c  increase in p, else decreases in p;
(ii) 
d c  strictly decreases b, and  ϕ c  strictly increases b;
(iii) 
ϕ c  strictly increases in θ; If  h > 2 d c  decreases in θ, else increases in θ;
(iv) 
if  b < 1 θ a 2 p d c  increase in h but  ϕ c  decrease in h, else  d c  decreases in h but  ϕ c  increase in h.
For simplicity, the effect of each parameter on the optimal platform discount  d c  and the optimal promotional effort  ϕ c  is summarized in Table 2.
The parameters b will affect online and offline sales. As substitution factor b increases, both online and offline sales increase. As shown in Figure 2a, the platform will increase its actual online price by reducing the online discount. The discount reduction increases the actual online sales price such that the platform advances the promotion to increase its total profit. Therefore, the profits of both the food service provider and the platform increase. (See Figure 2b).
When the substitution factor b is low enough ( b < min { 1 + θ θ h 2 2 , 1 θ } ), the online sales are low. In the Bertrand model, the increment in the sale price p significantly leads to a decrement in the sale quantity. As shown in Figure 3a, the platform gives a higher discount to online customers to increase online sales. At the same time, the platform also decreases promotion to save promotional costs. Since the platform can adjust the real price online by adding a surcharge or giving a discount, it is less affected by price changes. The profit of offline sales will be affected by the price, and too-high or too-low prices will make the profit of offline sales low. As shown in Figure 3b, the profit of the food service provider first increases and then decreases in the sale price. The platform is different; the increment of the online discount attracts some offline customers to buy food online, so the platform’s profit is decreased in the sale price. When the substitution factor b is high enough ( b > max { 1 + θ θ h 2 2 , 1 θ } ), the online sales are high. In the Bertrand model, the increment in the sale price p insignificantly leads to a decrement in the sale quantity. As shown in Figure 3a, the platform gives a higher surcharge to online customers to encourage more profit. At the same time, the platform also increases promotion efforts to attract more customers online and offline. Therefore, with the increases in both price and sales (including online and offline), both the profit of the food service provider and the profit of the platform are increasing.
θ  is the revenue share of the platform. As shown in Figure 4a, the increment in platform revenue always motivates the platform to promote the product more. When the impact factor of promotion on online sales is low ( h < 2 ), the promotional effort cannot significantly increase online sales, so a higher discount should be provided to increase online sales such that the actual price for online customers is decreased. The food service provider’s profit is decreased. However, when the impact factor of promotion on online sales is high ( h > 2 ), the promotional effort can significantly increase online sales, so a lower discount should be provided to increase the platform’s revenue such that the actual price for online customers is increased. The food service provider’s profit is increased. (See Figure 4b). As the share ratio of the platform increases, the platform’s profit is obviously increasing.
A high impact factor of promotion on online sales h makes the promotional effort significantly increase online sales. When the substitution factor is high ( b > 1 θ a 2 p ), online sales are large. When the impact factor of promotion increases, the platform should decrease the discount  d c  to encourage more profit. (See Figure 5a,b). The decrement of  d c  increases the platform’s unit revenue  p θ d c . Then, the platform should increase the optimal promotional effort  ϕ c  to increase the platform’s profit. However, when the substitution factor is low ( b < 1 θ a 2 p ), online sales are small. When the impact factor of promotion increases, the platform should increase the discount  d c  to decrease the actual online price to attract more online customers. (See Figure 5a,b). Then, the platform should decrease the optimal promotional effort  ϕ c  to save promotion costs. Then, as the impact factor of promotion increases, the platform increases its profit by increasing the online discount and decreasing promotional efforts. However, increasing the online discount and decreasing promotional efforts lead to a decrease in offline sales, which hurts the food service provider’s profit. Therefore, the food service provider’s profit decreases in the impact factor of online promotion.

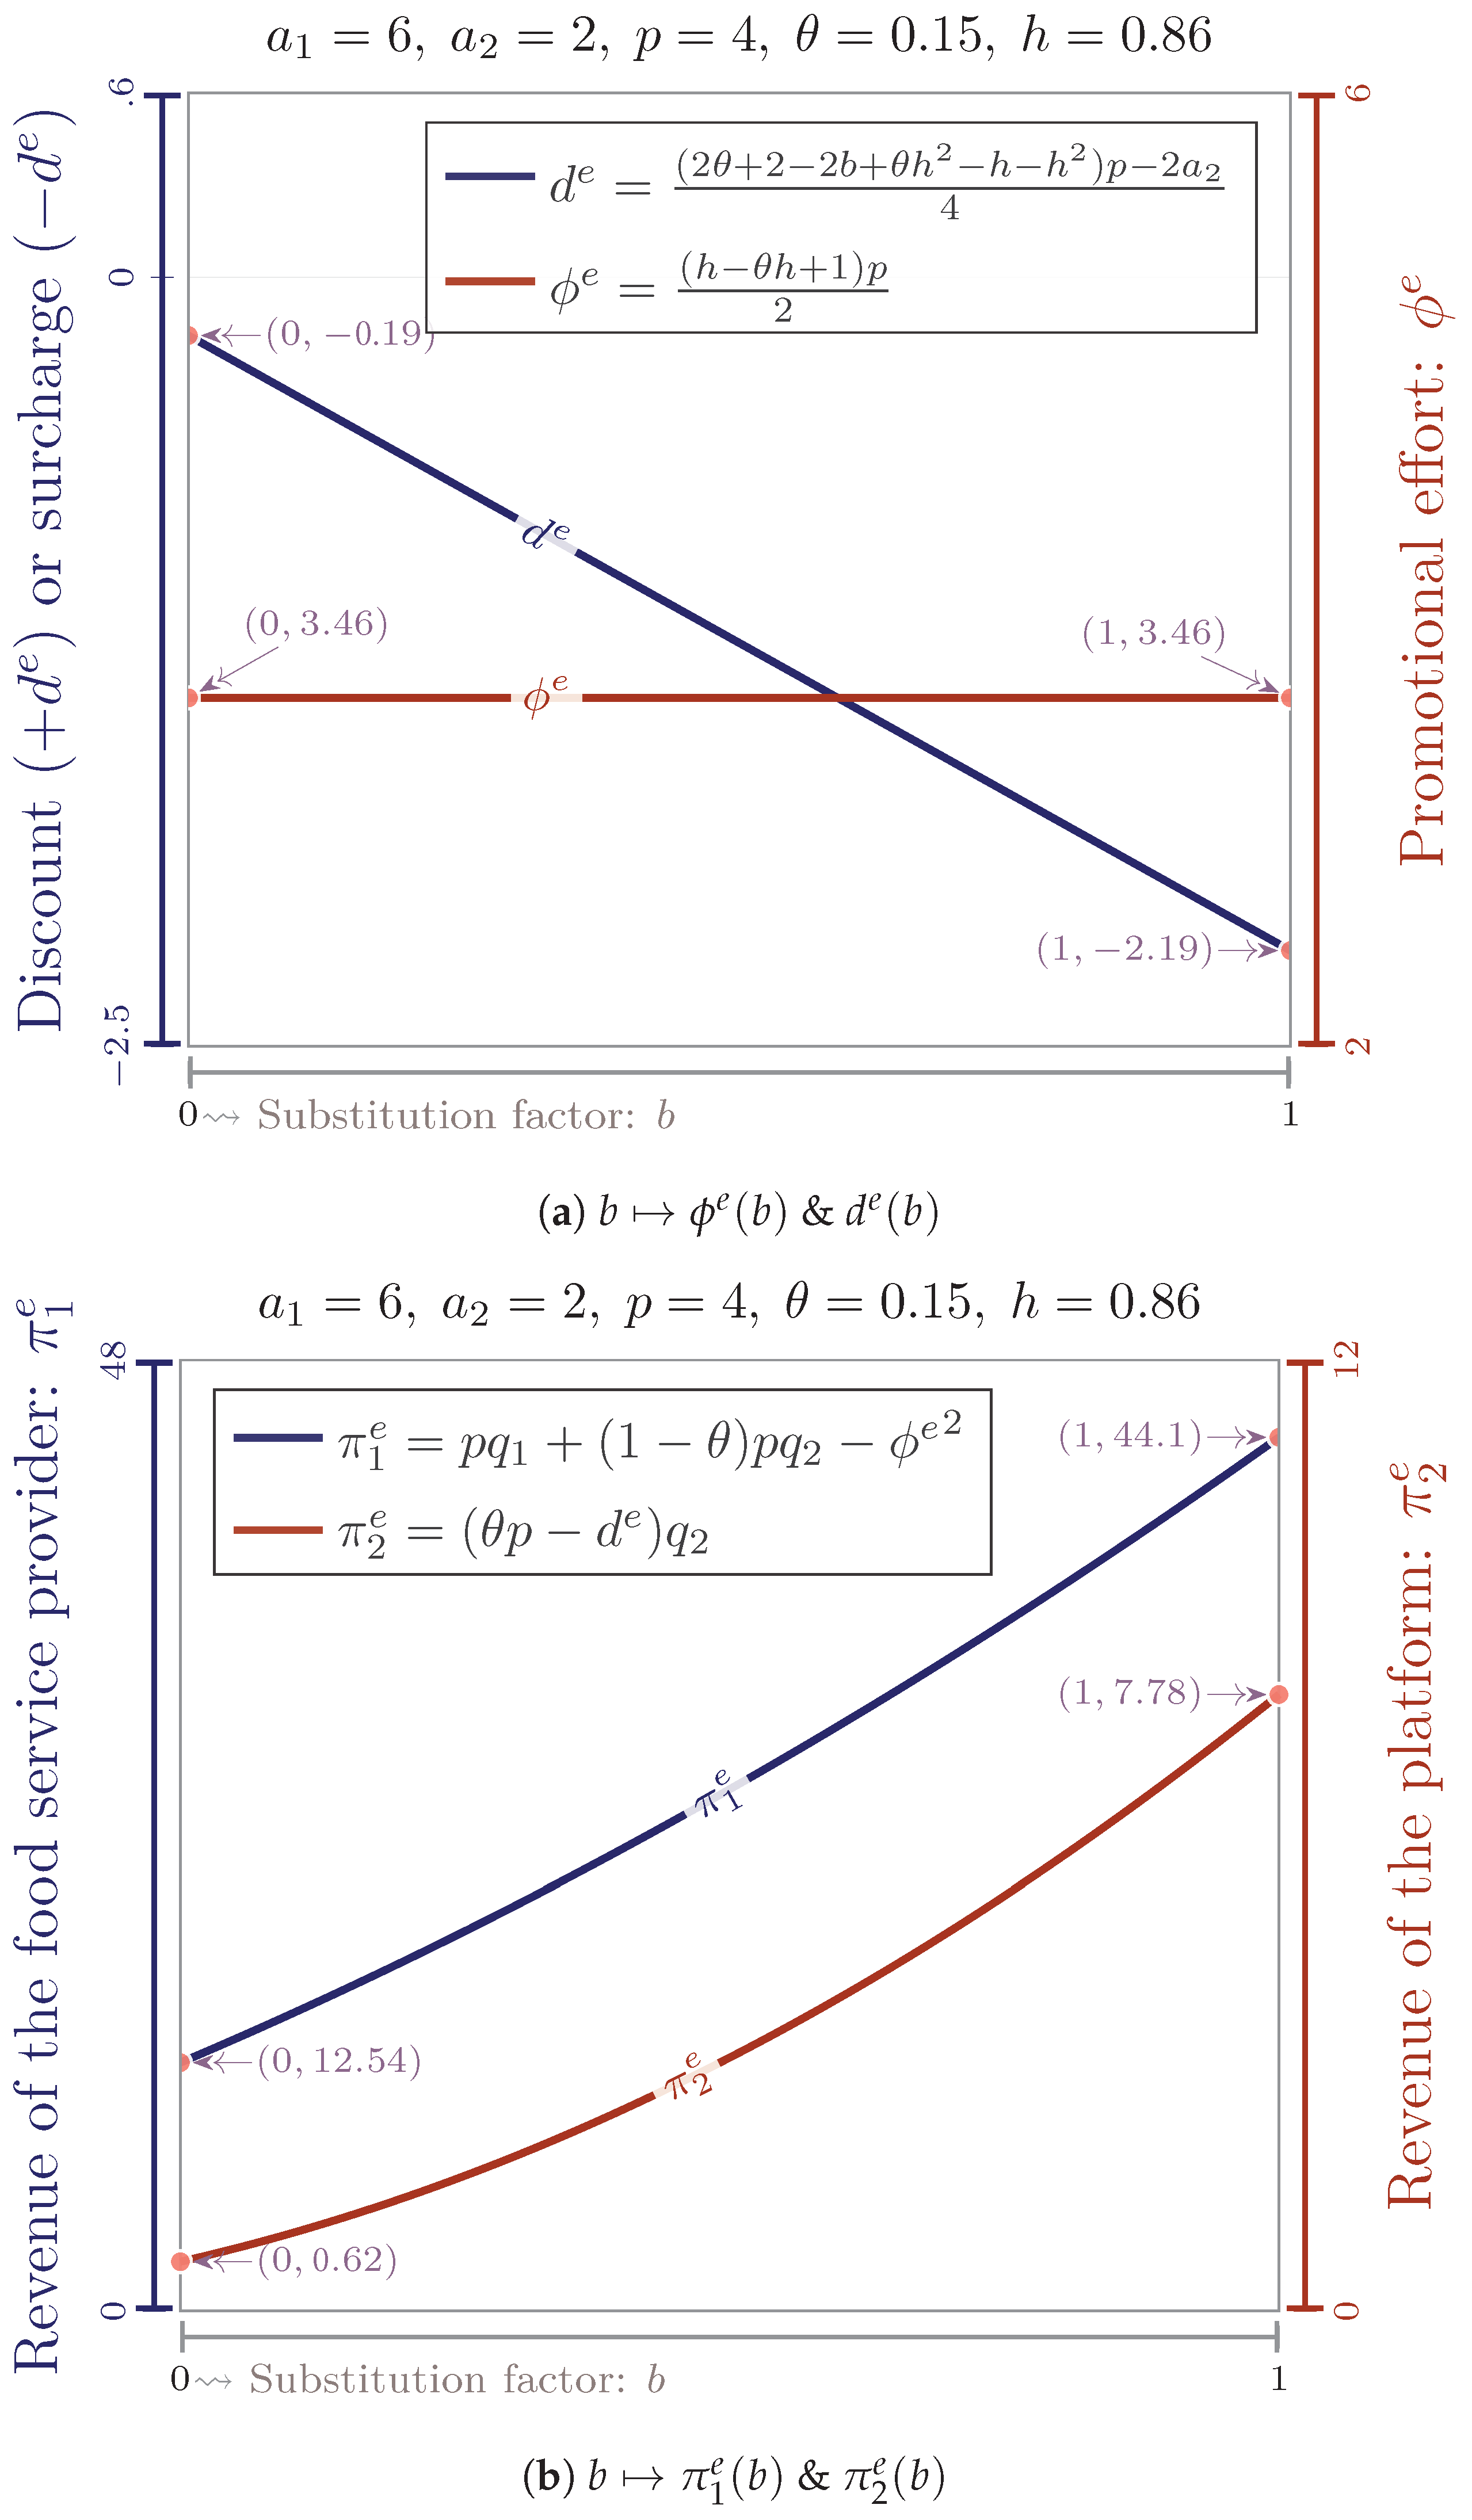
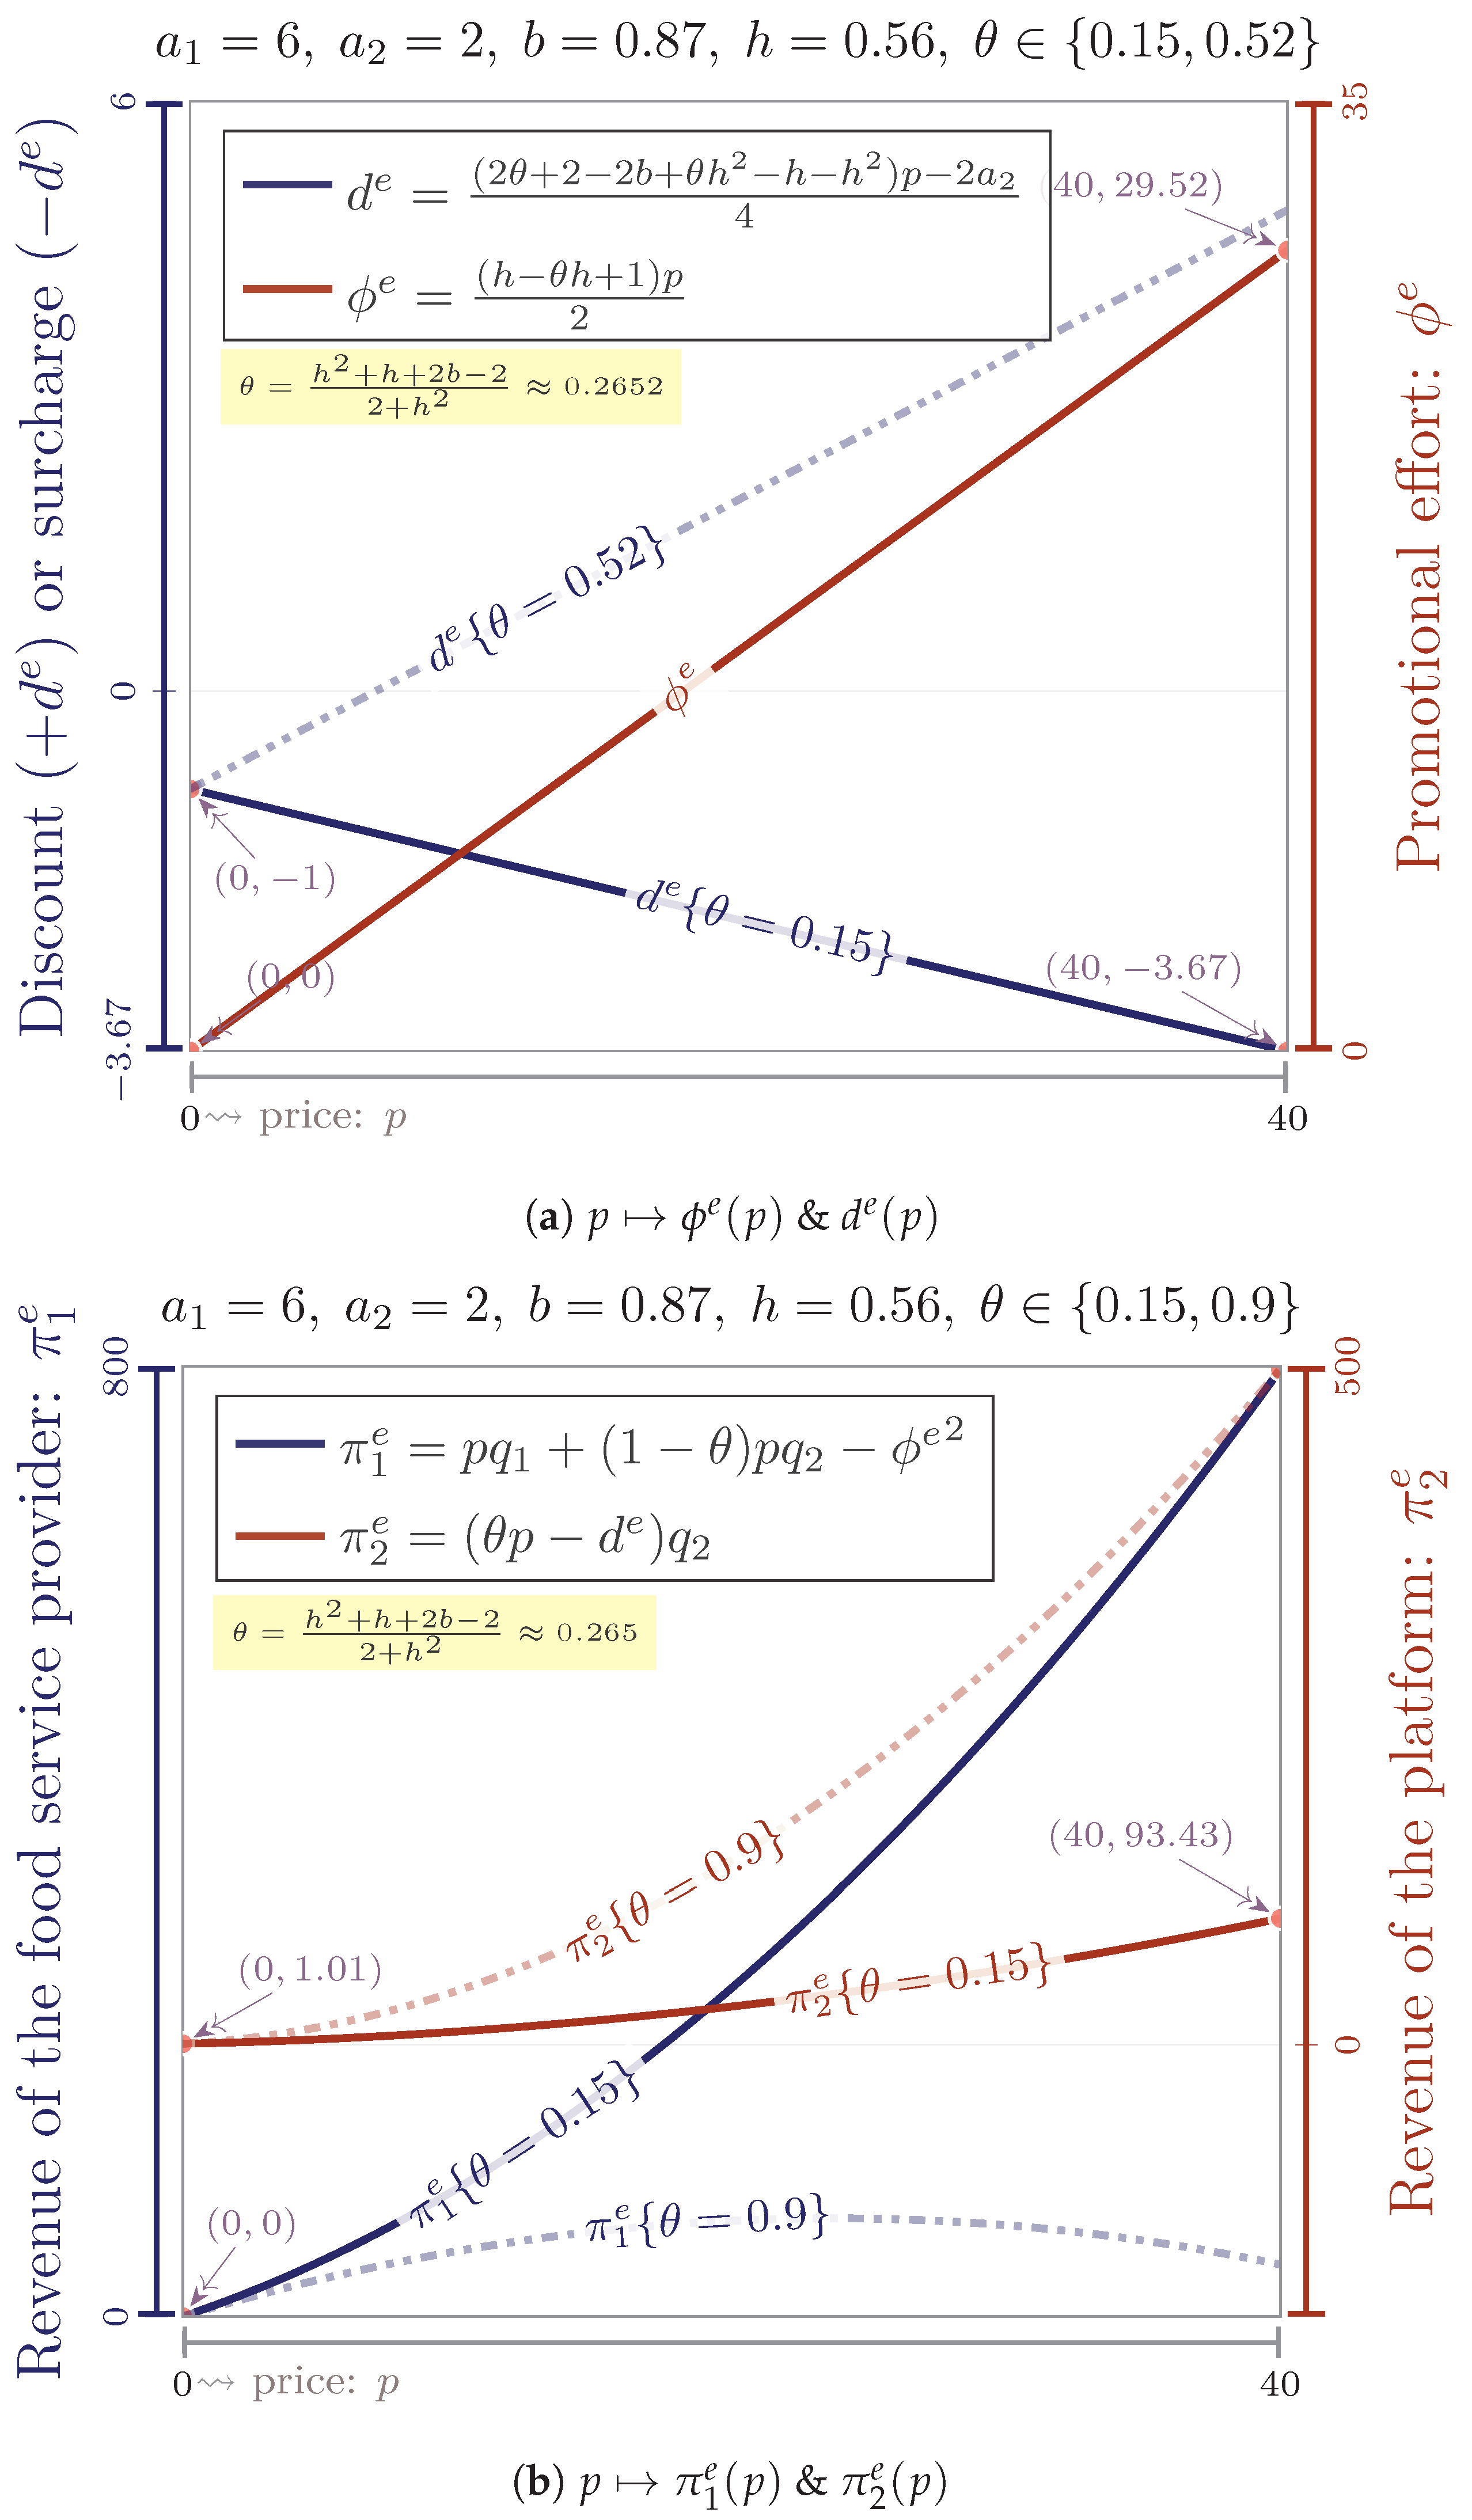
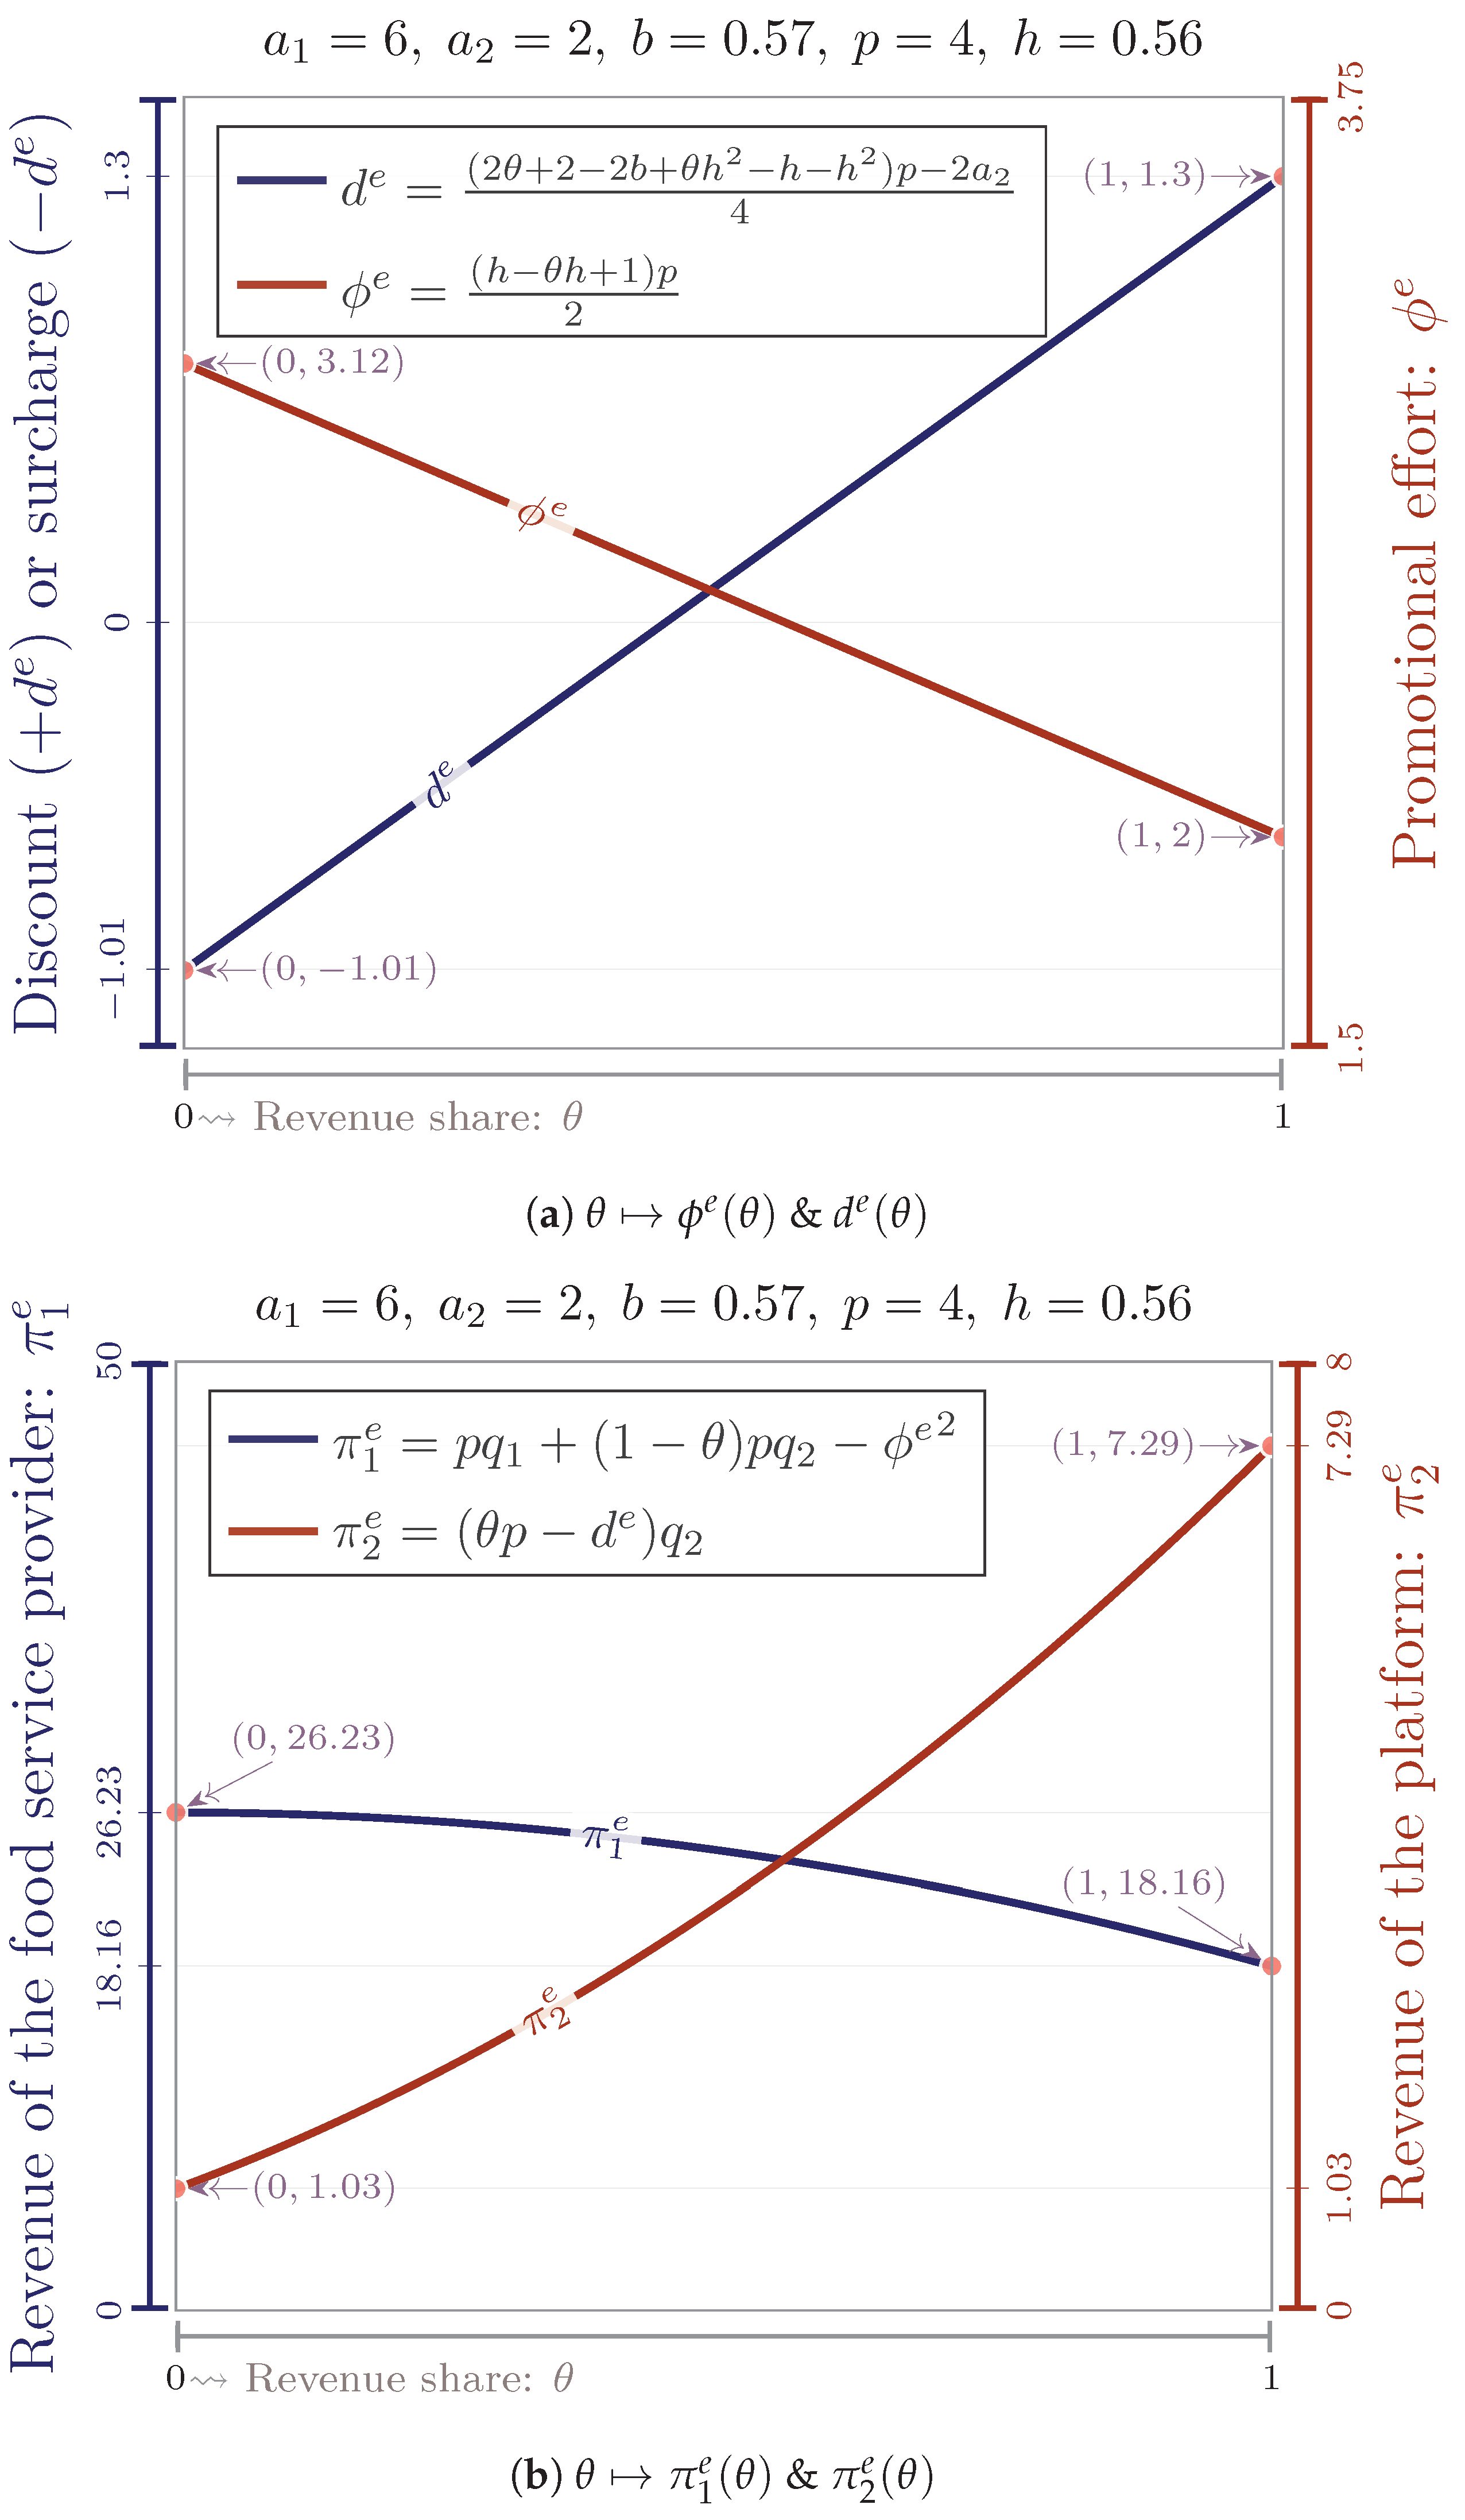
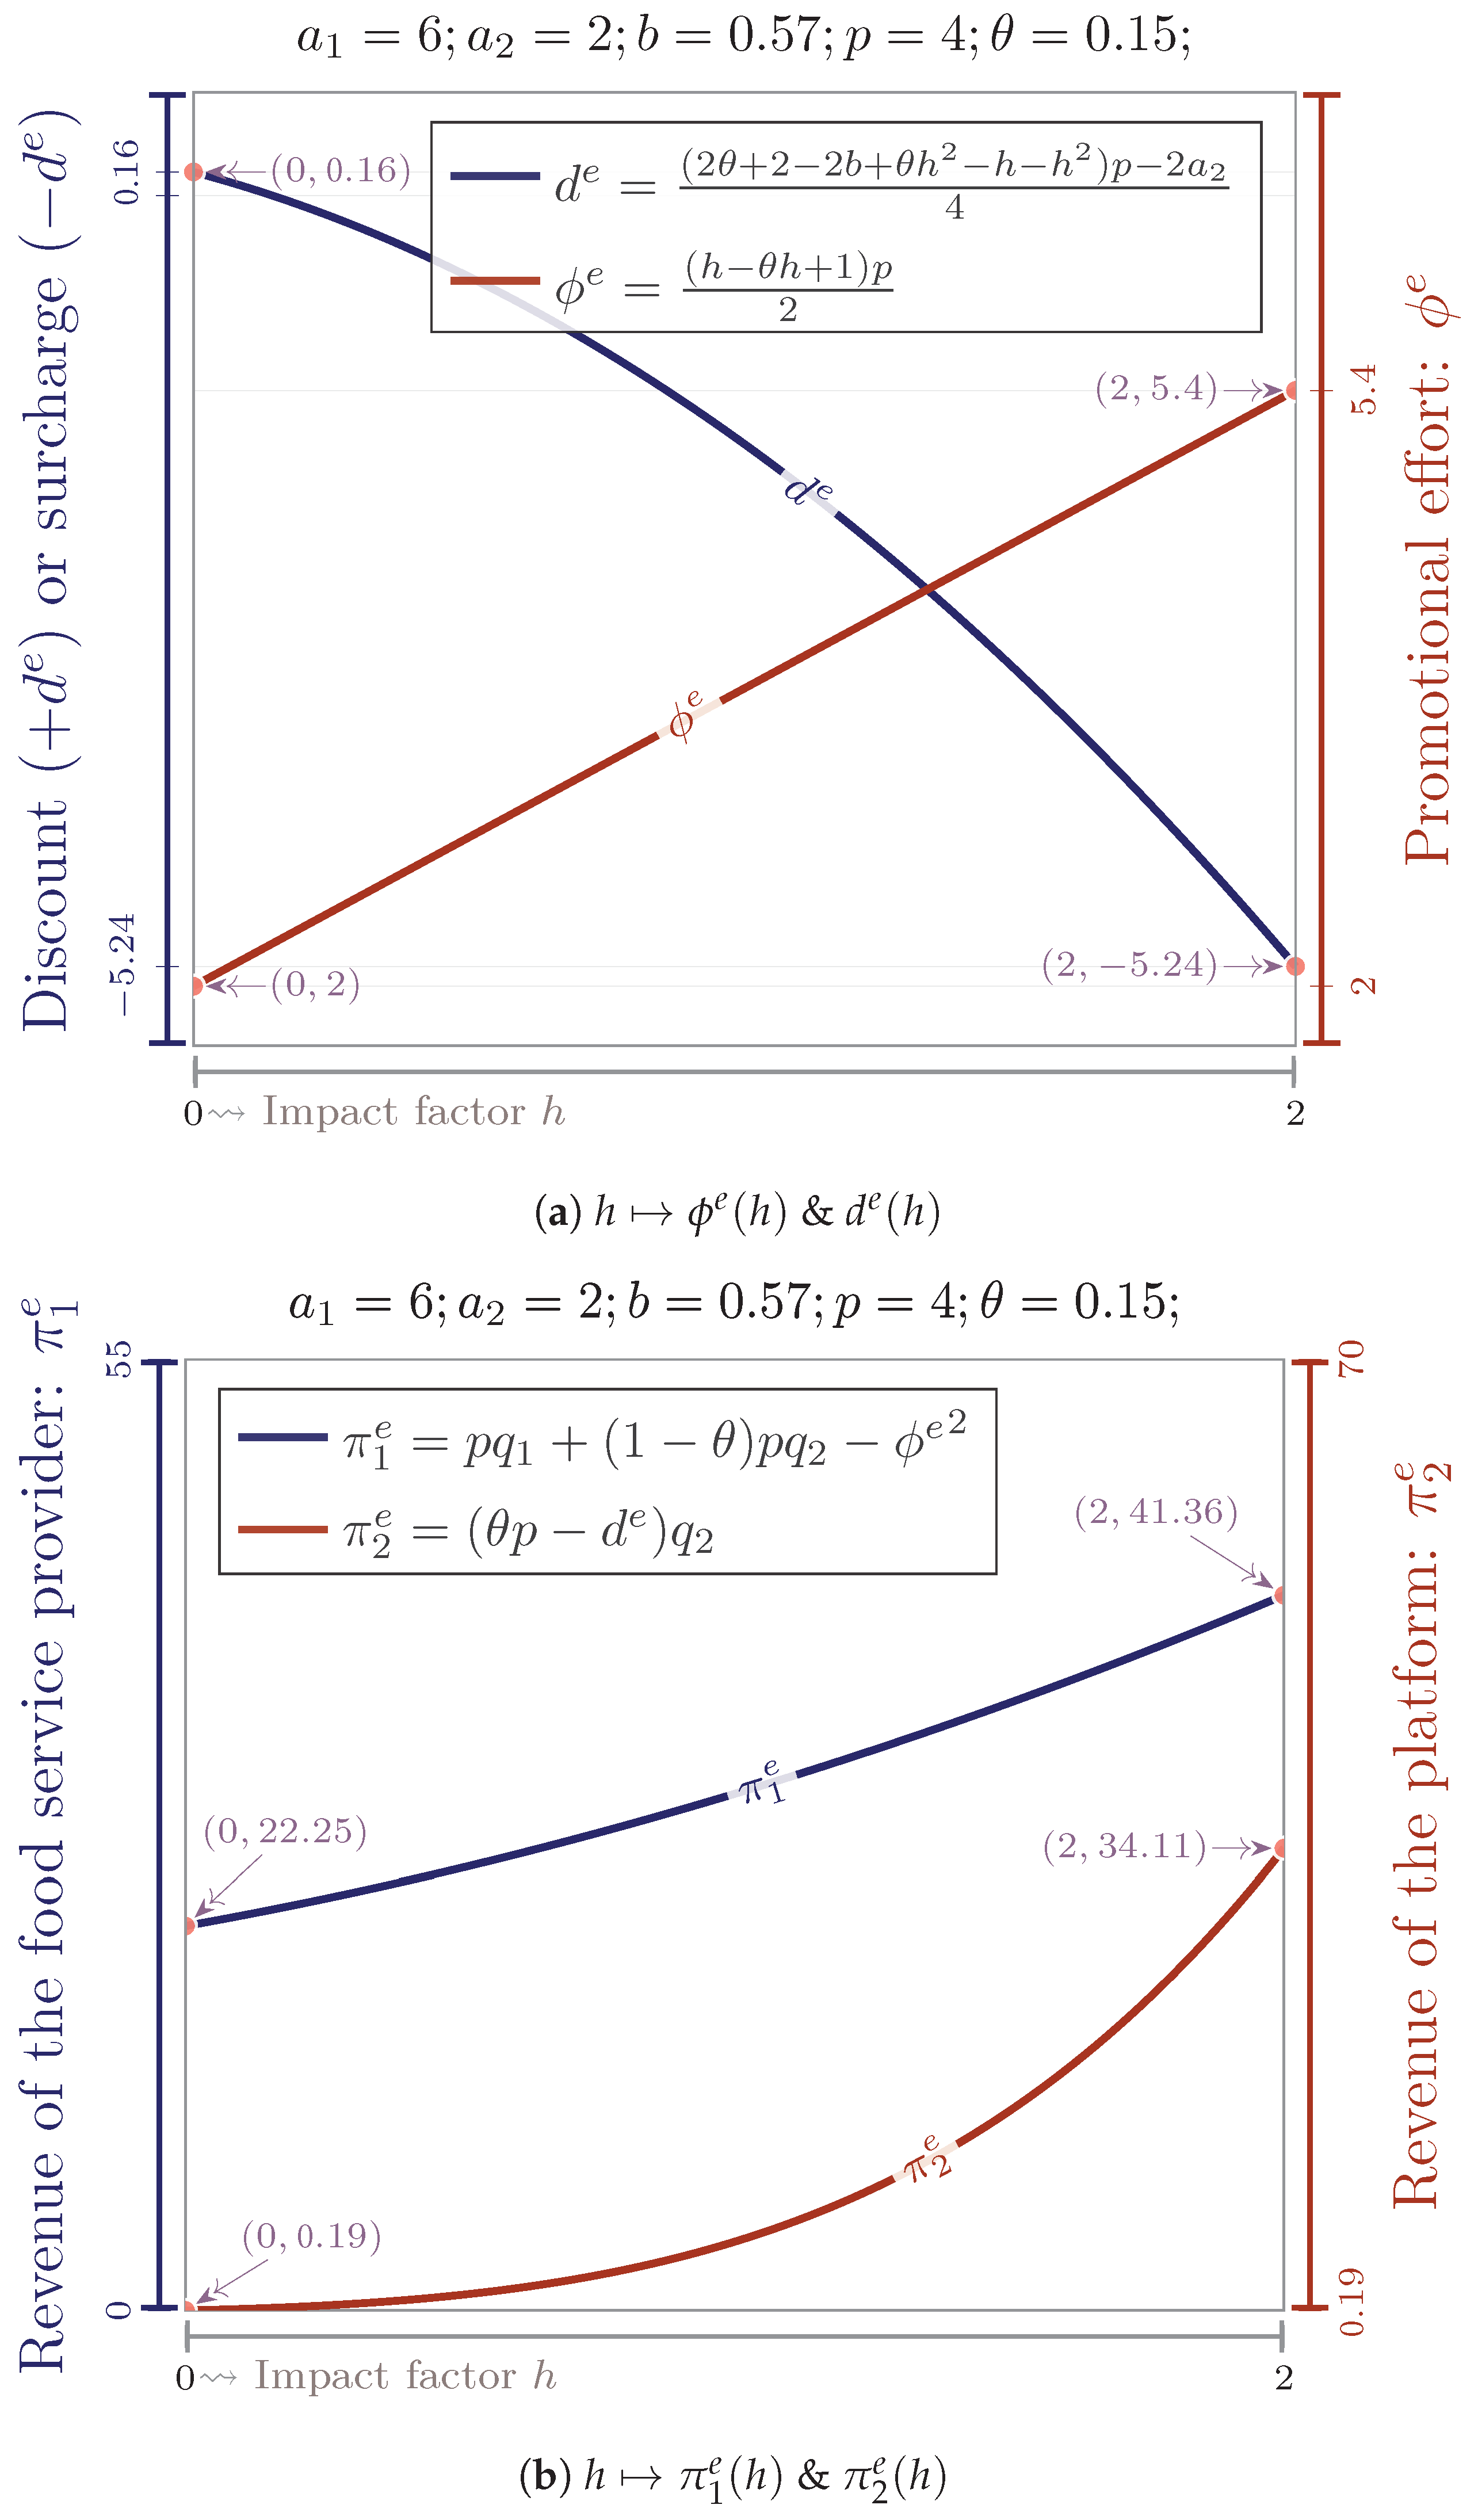
3.2. Equilibrium Decision Model

In this section, we consider the case where the food service provider determines the promotional effort  ϕ , and the platform determines the discount d.
The food service provider maximizes its profit by deciding  ϕ , and the profit optimization function of the service provider is
max ϕ π 1 e = p q 1 + ( 1 θ ) p q 2 ϕ 2 .
The platform maximizes its profit by deciding d, and the profit optimization function of the platform is
max d π 2 e = ( θ p d ) q 2 .
When both the food service provider and the platform maximize their profits, there is an equilibrium. We show the equilibrium in the following lemma.
Lemma 2.
The equilibrium platform discount is
d e = ( 2 θ + 2 2 b + θ h 2 h h 2 ) p 2 a 2 4 ,
and the equilibrium promotional effort is
ϕ e = ( h θ h + 1 ) p 2 .
The equilibrium platform discount  d e  and the equilibrium promotional effort  ϕ e . Next, we analyze the impact of the parameters on the equilibrium platform discount and the equilibrium promotional effort. We get the following proposition.
Proposition 2.
(i) 
d e  strictly decreases in b, h, but increases in θ;
(ii) 
if  θ > h 2 + h + 2 b 2 2 + h 2 d e  increases in p, else  d e  decreases in p;
(iii) 
ϕ e  strictly increases in p and h, but decreases in θ.
For simplicity, the effect of each parameter on the equilibrium platform discount  d e  and the equilibrium promotional effort  ϕ e  is summarized in Table 3.
The parameter b will affect online and offline sales as when substitution factor b increases, both online and offline sales increase. As shown in Figure 6a, the platform will increase its actual online price by reducing the online discount  d e . Therefore, the profits of both the food service provider and the platform increase. (See Figure 6b).
The parameter p will affect the unit profit of the product. As prices increase, the food service provider will try to increase the sales of its products. As shown in Figure 7a, the food service provider will increase promotion to attract more customers to explore more profit. When the platform’s revenue share is low ( θ < h 2 + h + 2 b 2 2 + h 2 ), the impact of price increment is low, so the platform should increase the actual online price  θ p d e  by increasing the online surcharge ( d e ) to increase profit. When the platform’s revenue share is high ( θ > h 2 + h + 2 b 2 2 + h 2 ), the impact of price increment is low, so the platform should attract more online customers by increasing the online discount ( + d e ) to retain online customers. Therefore, as shown in Figure 7b, when the platform’s revenue share is low, the profits of both the food service provider and the platform increase in price p. However, when the platform’s revenue share is high, since the platform increases the online discount to attract more online customers, the offline customers are decreased. Therefore, the profit of the food service provider first increases and then decreases in the sale price.
θ  is the revenue share of the platform. As shown in Figure 8a, the decrement in the food service provider’s revenue share always makes the platform less motivated to promote the product. As the revenue share of the platform increases, the unit profit of the food for the platform is increased, so a higher discount should be provided such that the actual price for online customers is decreased to increase online sales. Therefore, the platform’s profit is obviously increasing. However, since the revenue share of the food service provider is decreased, and the offline sales are decreased due to the decrement of the actual price for online customers, the food service provider’s profit is decreased.
A high impact factor of promotion on online sales h makes the promotional effort significantly increase online sales, so the food service provider should increase the equilibrium promotional effort  ϕ e  to increase its profit. The increment of  ϕ e  and h increases online sales such that the platform decreases the online discount  d e  to increase profit. (See Figure 9a,b). Due to the increment of the actual online price  p d e  and the promotional effort  ϕ e , the offline sales are increased such that the profit of the food service provider is also increased.

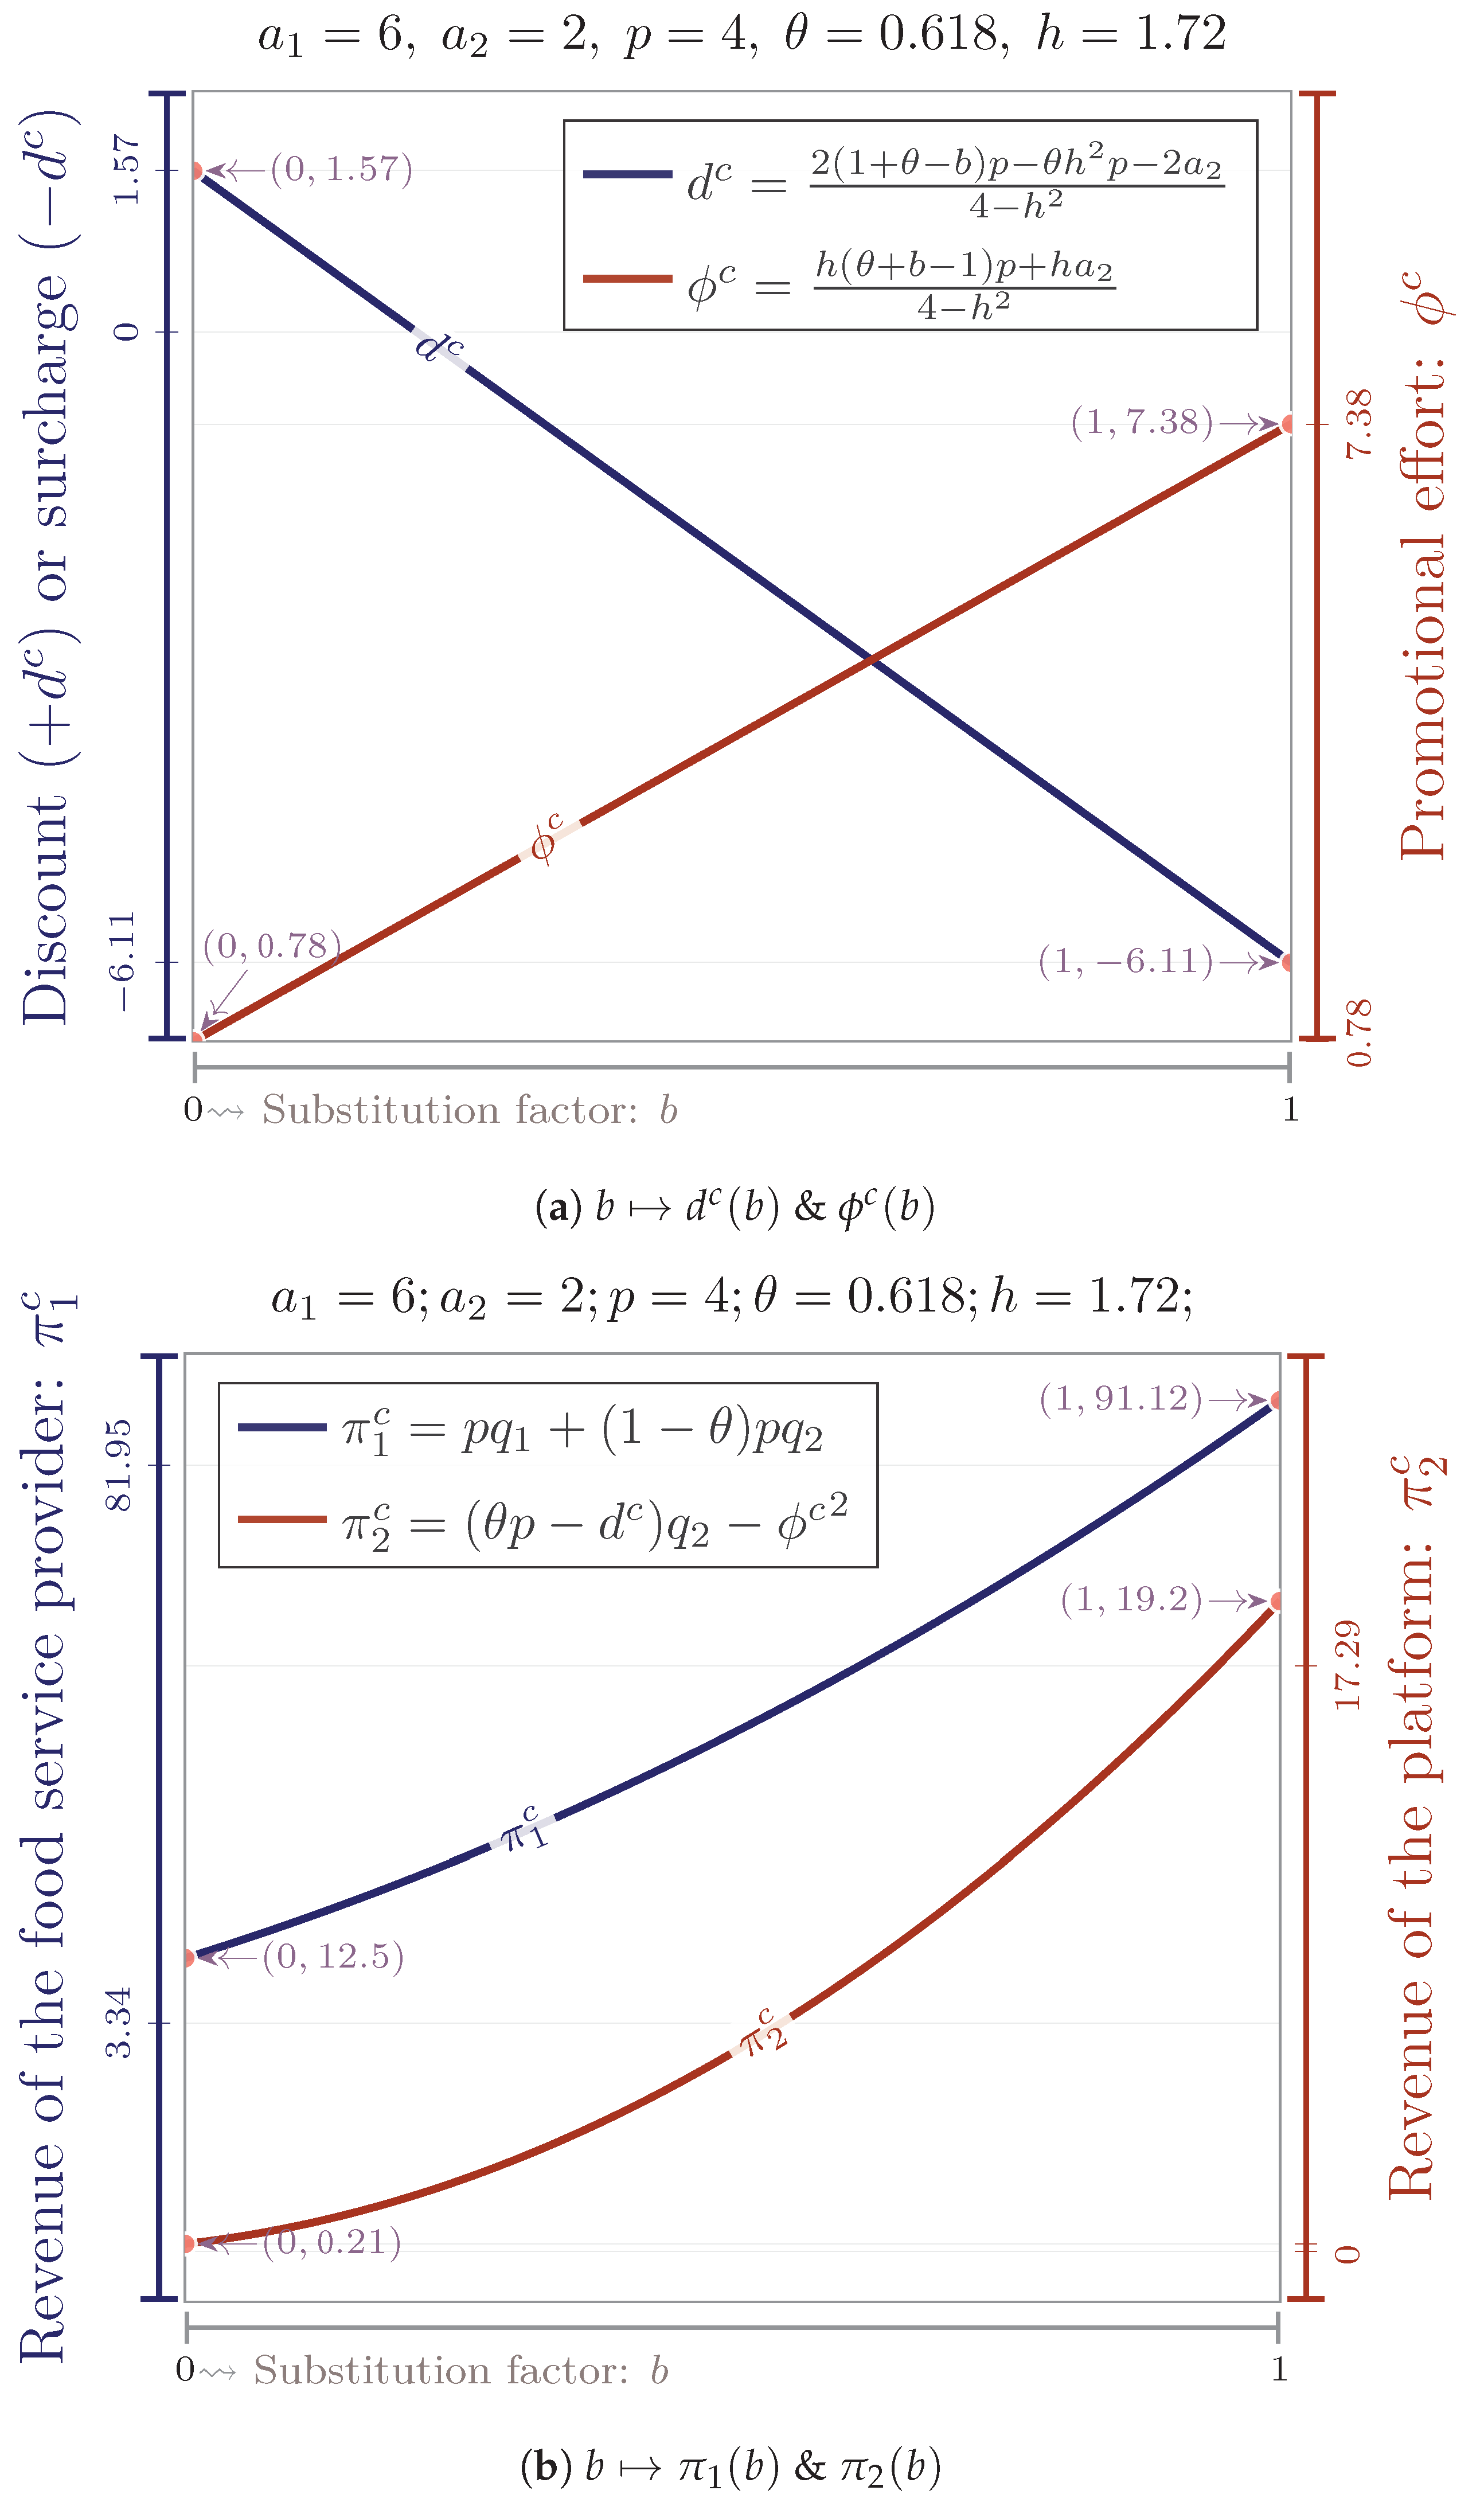
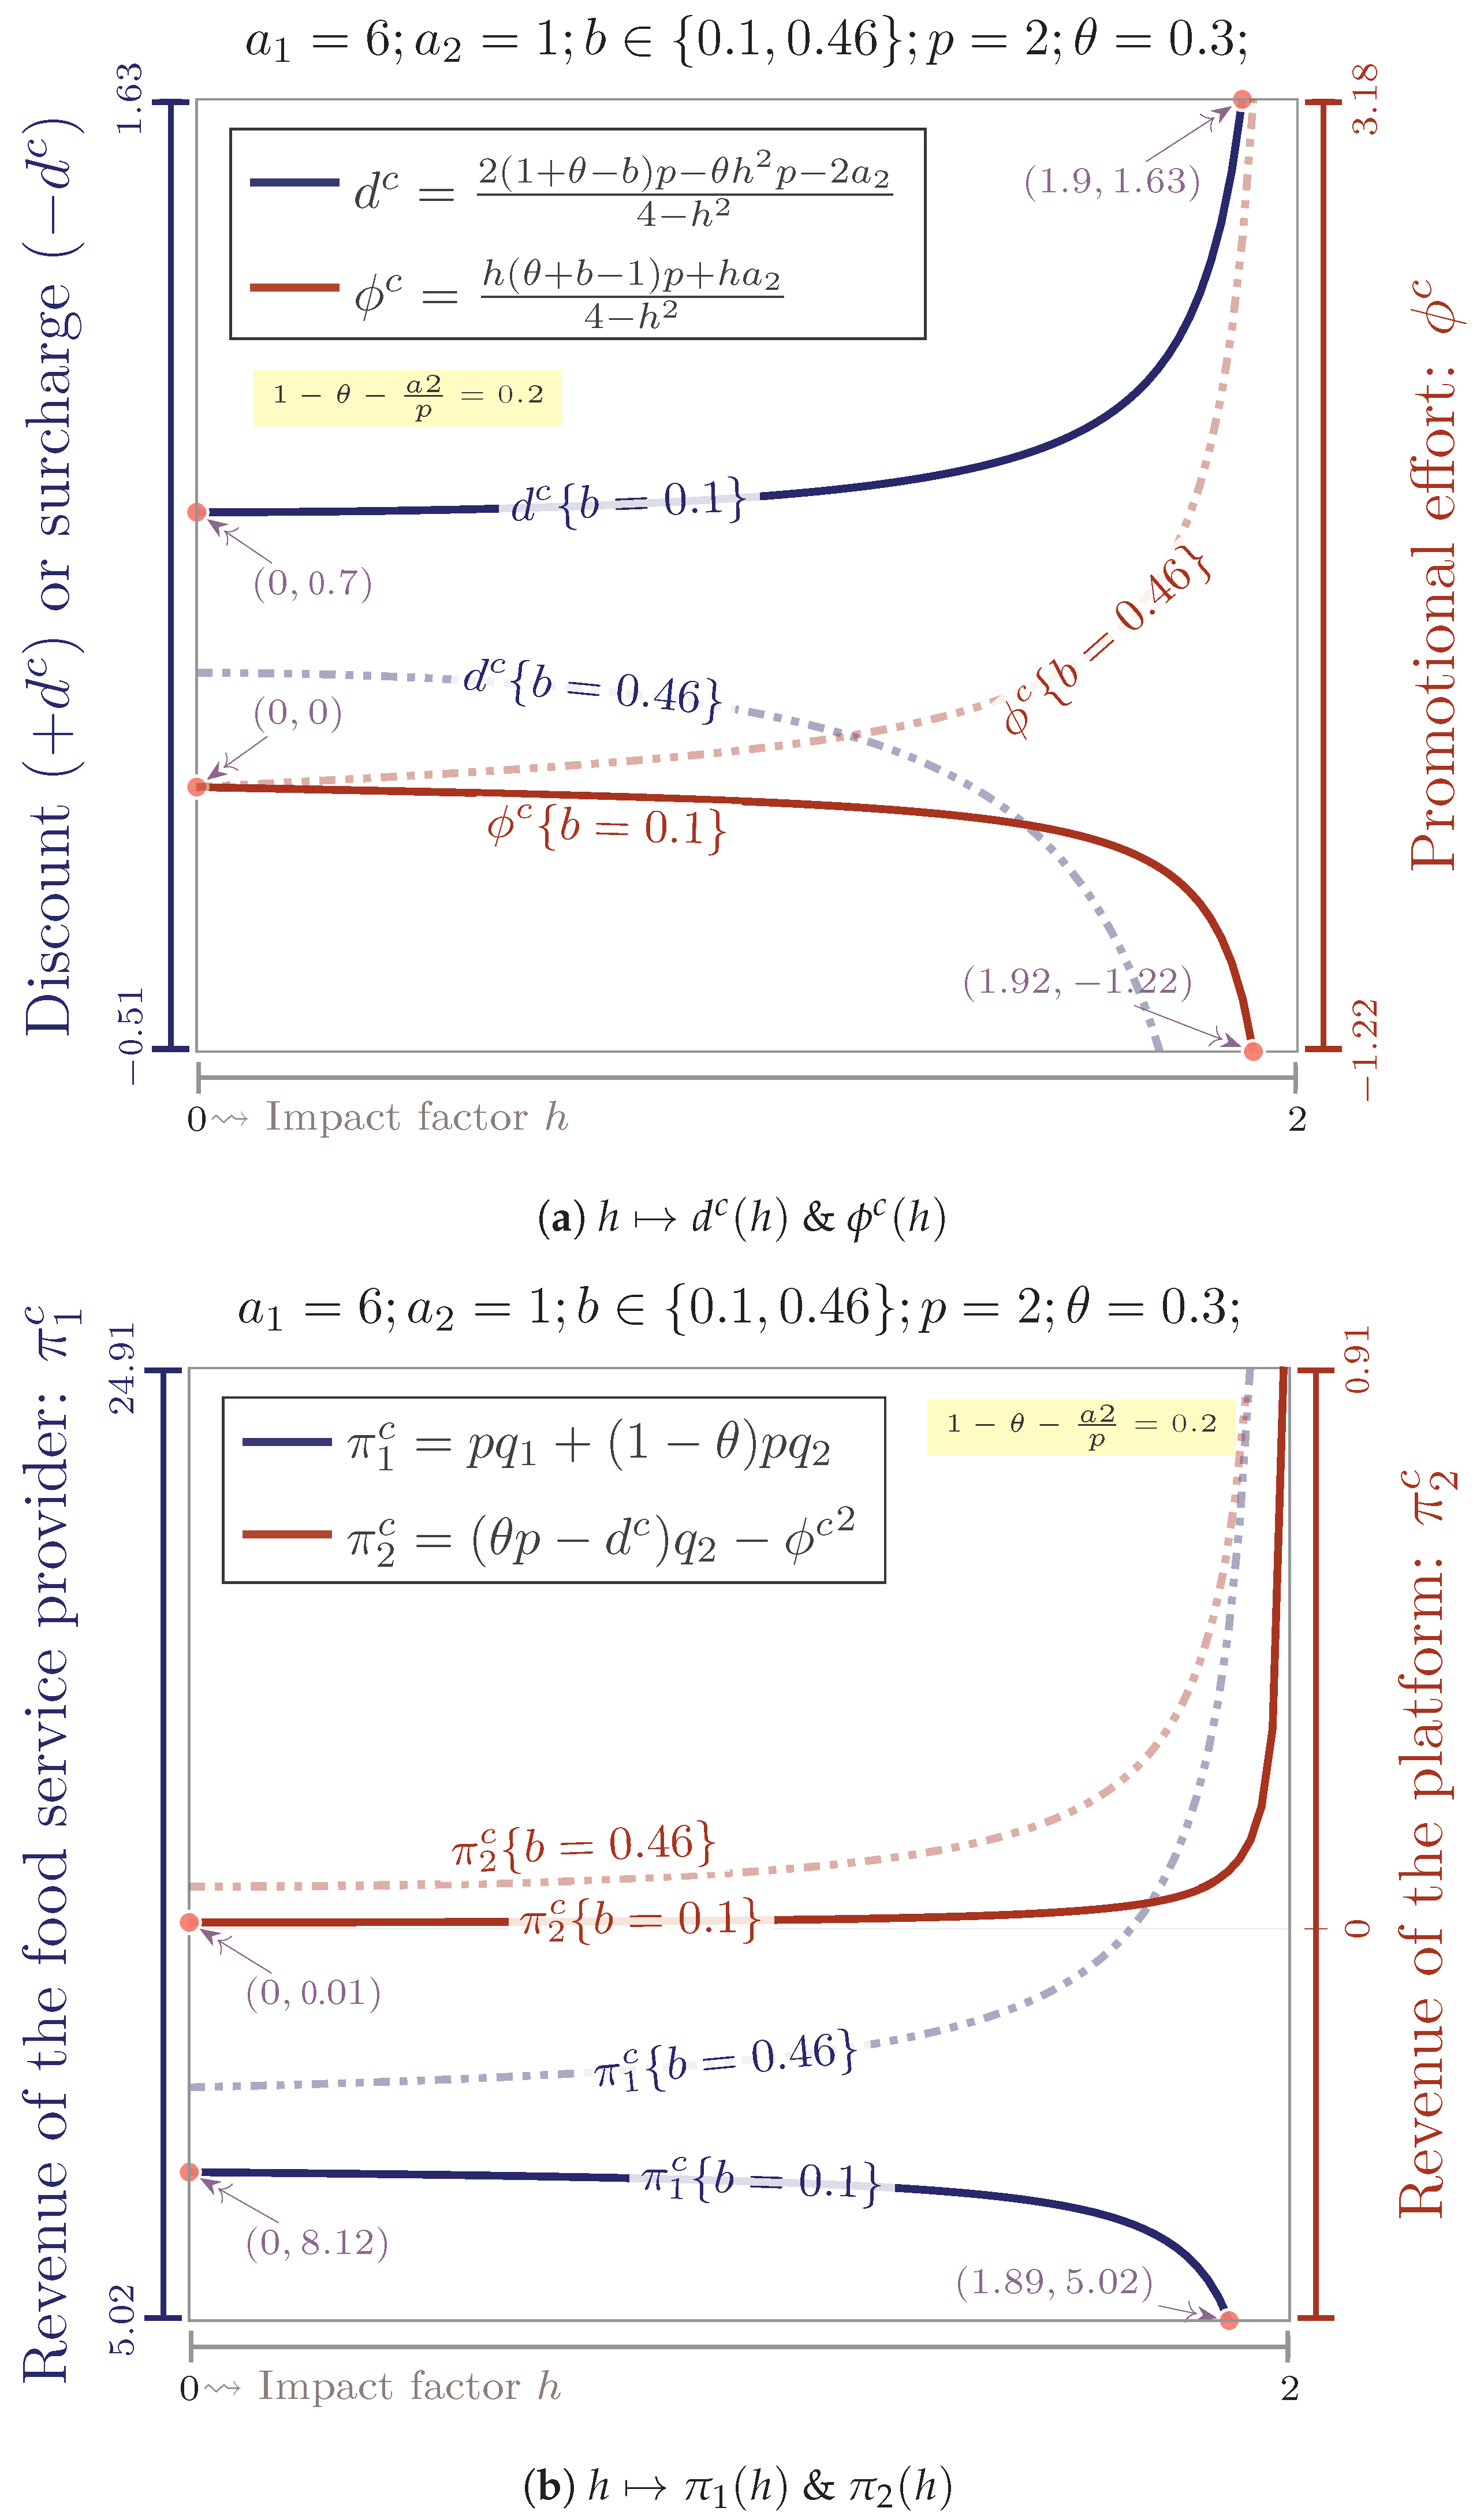
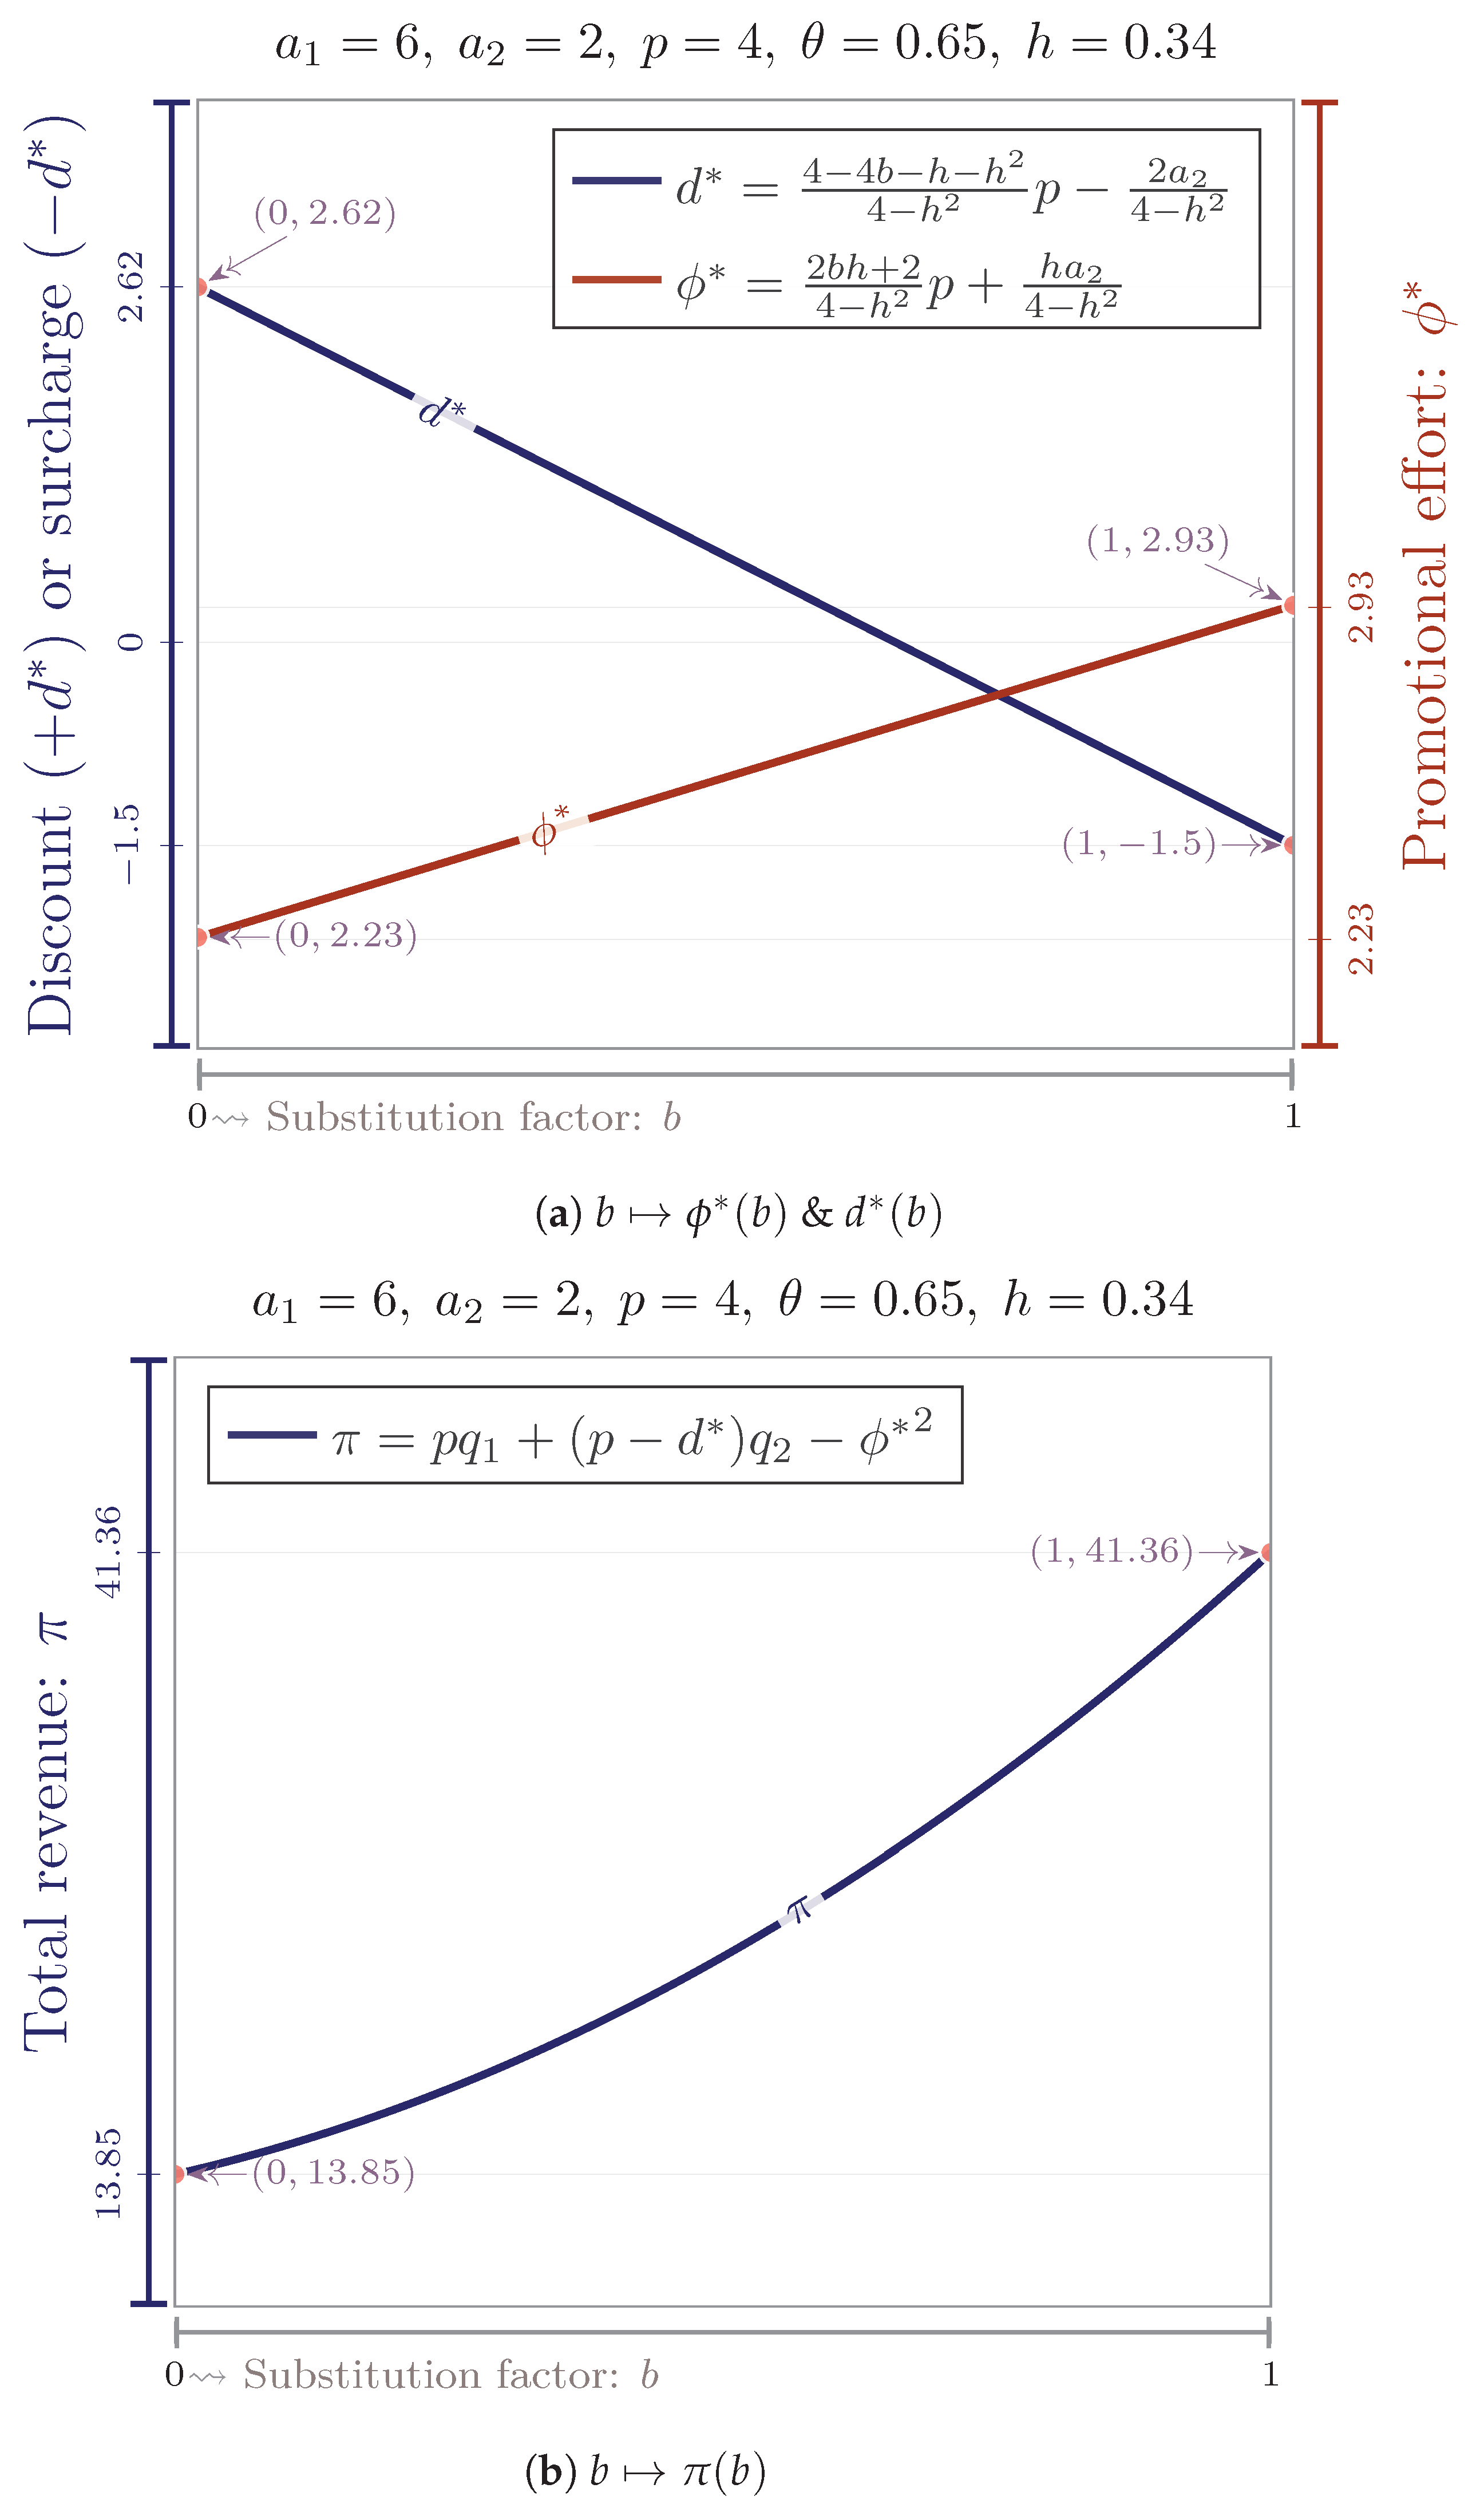
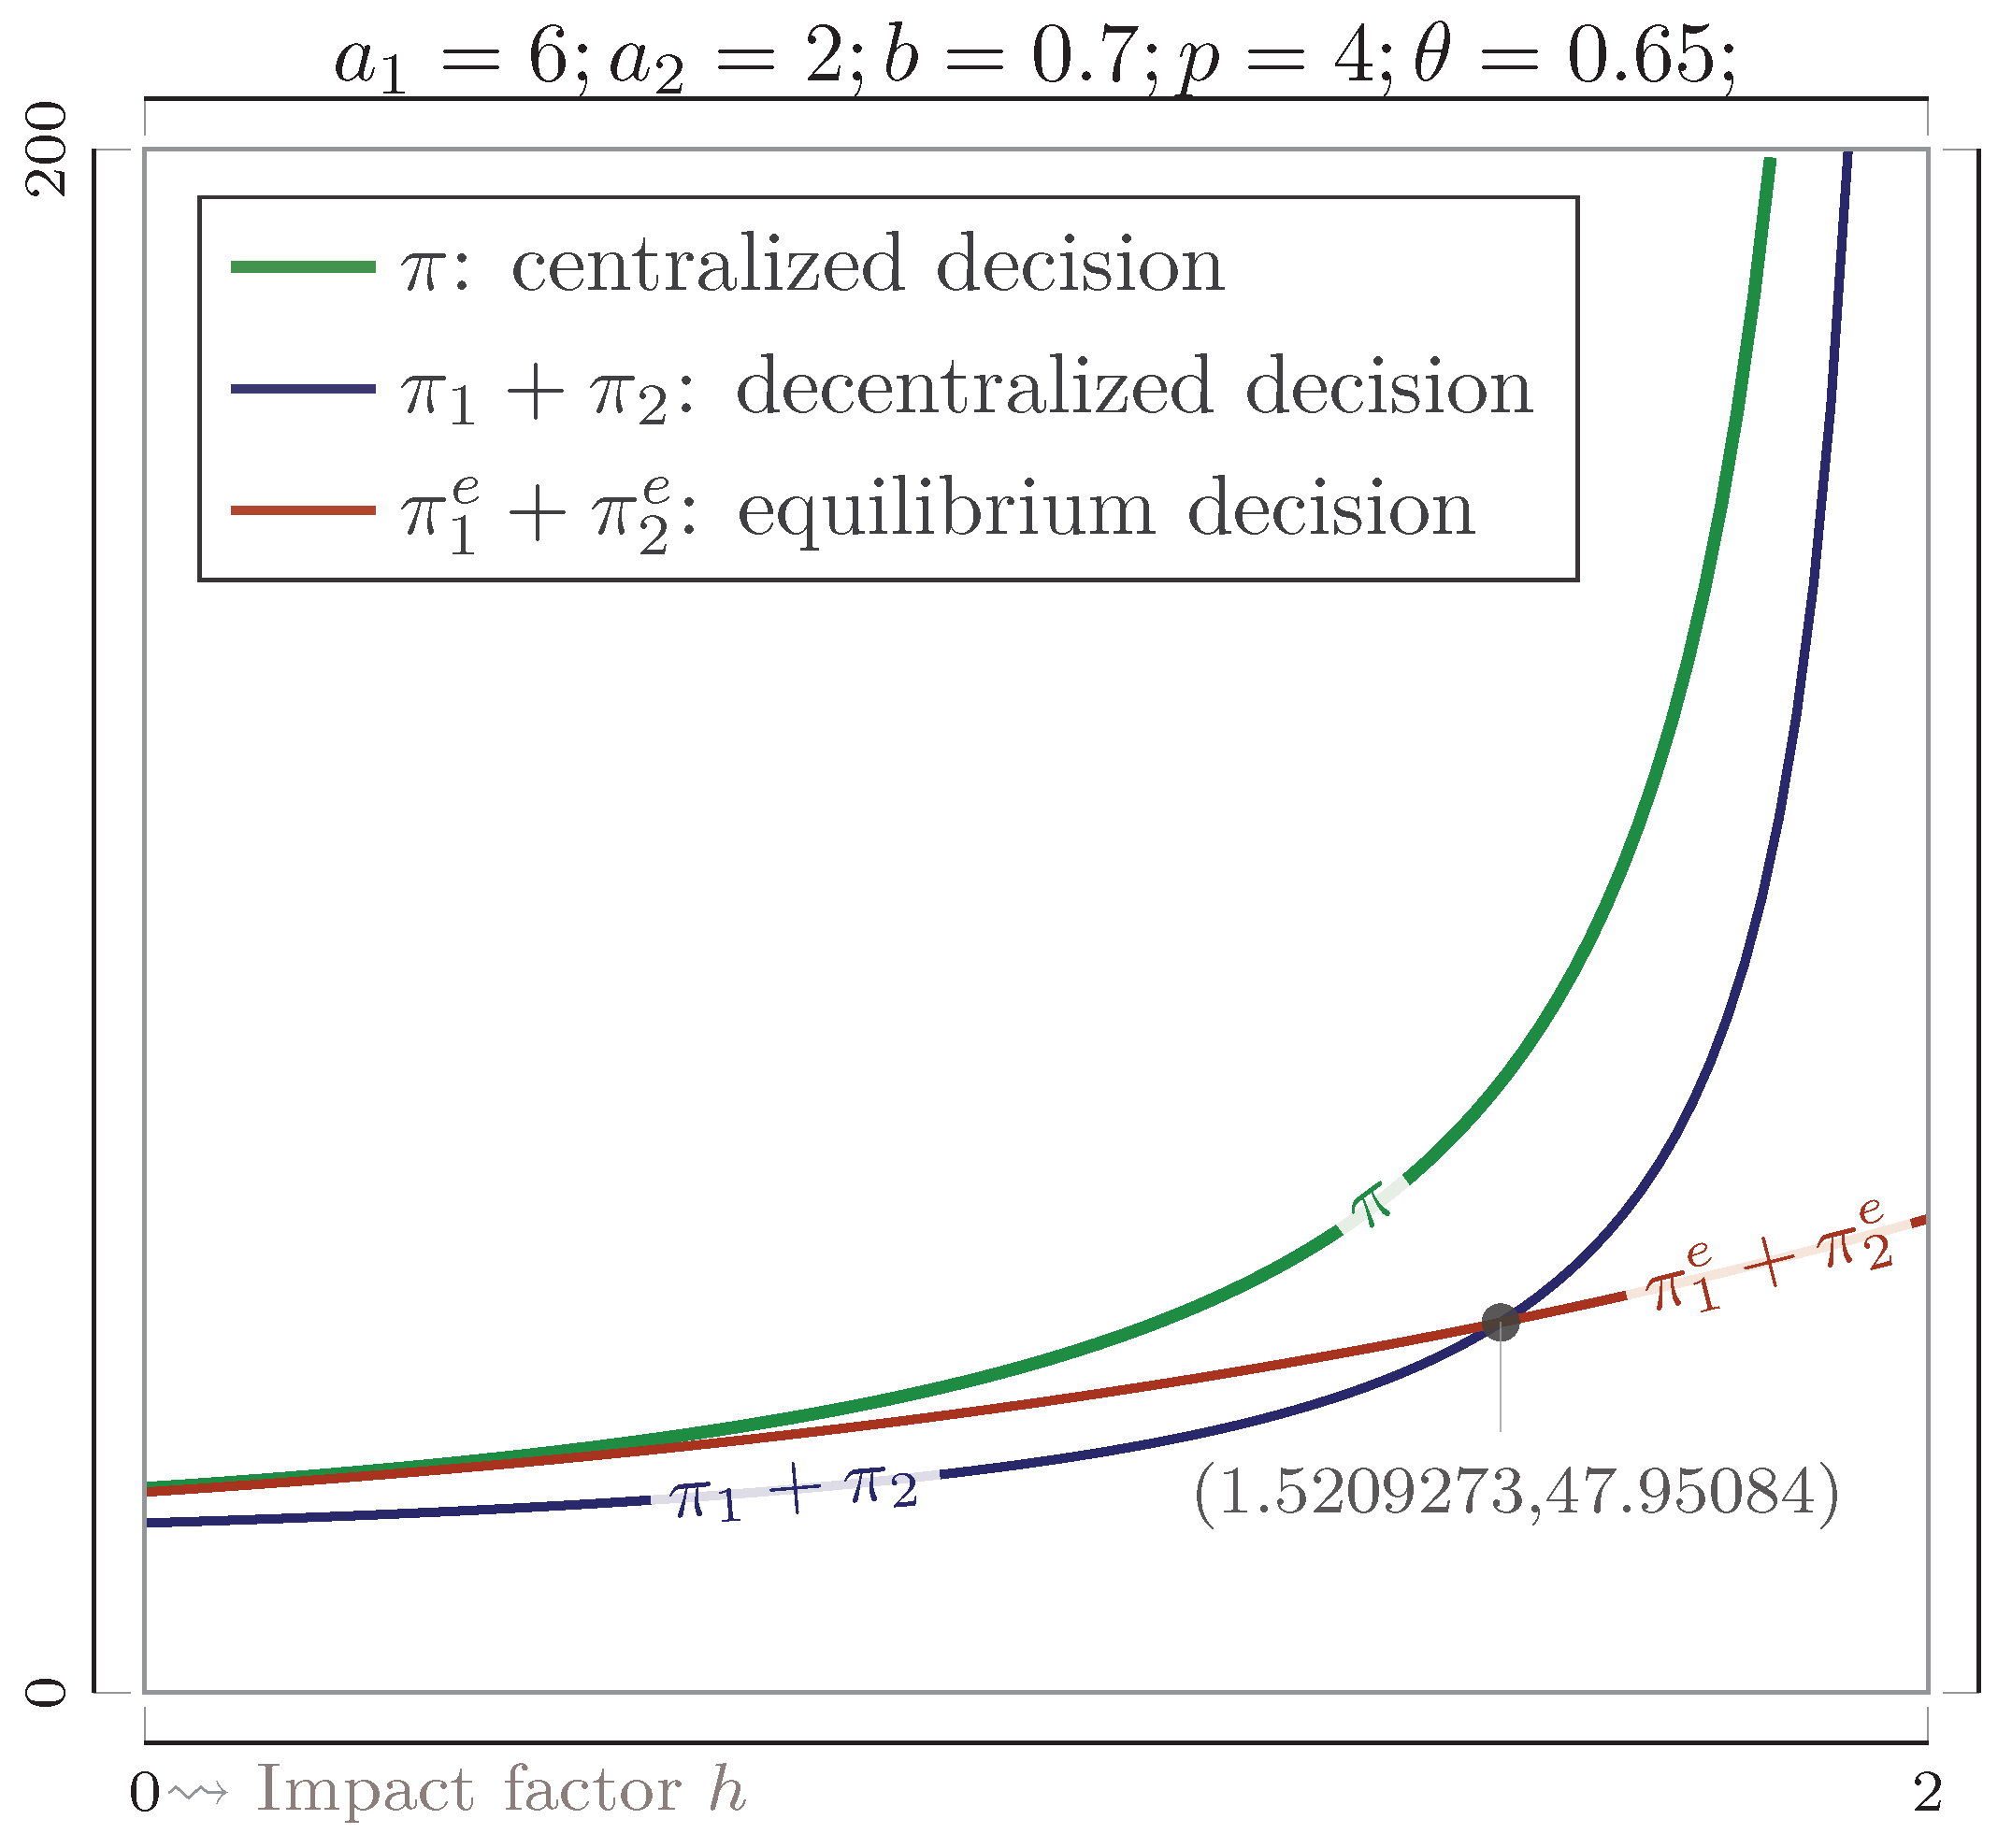
3.3. Centralized Decision Model

In this part, we consider the case that the platform and the food service provider are deeply cooperative, or the food service provider has and only uses its own online sales platform. Then, the food service provider and the platform are considered as a whole. The online and offline sales cash flow is shown in Figure 10. They are centralized to decide on the promotional effort and the discount for online customers. Then, the supply chain profit optimization function is
max d , ϕ π = π 1 + π 2 = p q 1 + ( p d ) q 2 ϕ 2 .
The promotional effort  ϕ  and the discount for online sales d are decided simultaneously to maximize the supply chain profit. We obtain the following lemma.
Lemma 3.
The global optimal platform discount is
d * = 4 4 b h h 2 4 h 2 p 2 a 2 4 h 2 ,
and the global optimal promotional effort is
ϕ * = 2 b h + 2 4 h 2 p + h a 2 4 h 2 .
The global optimal platform discount  d *  and the global optimal promotional effort  ϕ *  are affected by the exogenous parameters. Next, we analyze the impact of the parameters on the global optimal platform discount and the global optimal promotional effort. We obtain the following proposition.
Proposition 3.
(i) 
d *  strictly decreases in b and h;
(ii) 
If  h > 17 16 b 1 2 d *  decreases in p, else  d *  increases in p;
(iii) 
ϕ *  strictly increases in price p, b and h.
For simplicity, the effect of each parameter on the global optimal platform discount  d *  and the global optimal promotional effort  ϕ *  is summarized in Table 4.
As shown in Figure 11a, when the substitution factor b increases, both online sales and offline sales increase such that the platform reduces the discount and increases promotional efforts to explore more profit. Therefore, the revenue of the supply chain will increase. (See Figure 11b).
The parameter p will affect the unit profit of the product. As prices increase, the supply chain will try to increase the sales of its products. As shown in Figure 12a, the supply chain will increase promotion to attract more customers to increase profit. When the impact factor of promotion on online sales is high ( h > 17 16 b 1 2 ), the increment of promotional effort can significantly increase online sales. Then, the supply chain should increase the actual online price  p d *  by decreasing the online discount to increase profit. When the impact factor of promotion on online sales is low ( h < 17 16 b 1 2 ), the increment of promotional effort cannot significantly increase online sales. Then, the supply chain should attract more online customers by increasing the online discount to increase profit. Therefore, as shown in Figure 12b, in both of the two situations, the supply chain profit increases in price.
A high impact factor of promotion on online sales h makes the promotional effort significantly increase online sales, so the platform should increase the promotional effort  ϕ *  to increase the platform’s profit. The increment of  ϕ *  and h increases online sales such that the platform decreases the online discount  d *  to increase profit. (See Figure 13a,b). Due to the increment of the actual online price  p d *  and the promotional effort  ϕ * , the supply chain profit increases in the impact factor of promotion on online sales h.

4. The Comparison of the Three Scenarios

In this section, we first compare the profit of supply chain members under decentralized and equilibrium decisions, then we compare the sum of supply chain members’ profits with the profit of the supply chain under centralized decisions, and finally, we discuss the platform discounts d and the optimal promotional  ϕ  efforts among the three different scenarios.

4.1. Comparing the Profit of Each Member under Different Scenarios 

We explore the impact of the parameter h on the profitability of supply chain members when they make either decentralized or equilibrium decisions. The results of the study depicted in Figure 14 show that there exists a critical point for h. Once the value of h exceeds this crucial point, the supply chain members can obtain better profits by choosing to decentralize their decisions. The opposite is true when h is below the critical point.

4.2. Comparing the Total Profits under Different Scenarios

We compared the total profits concerning parameter h under three different scenarios, where the total profit under decentralized and equilibrium decisions is the sum of the platform’s and restaurants’ profits. As shown in Figure 15, the supply chain profit is highest under the centralized model.

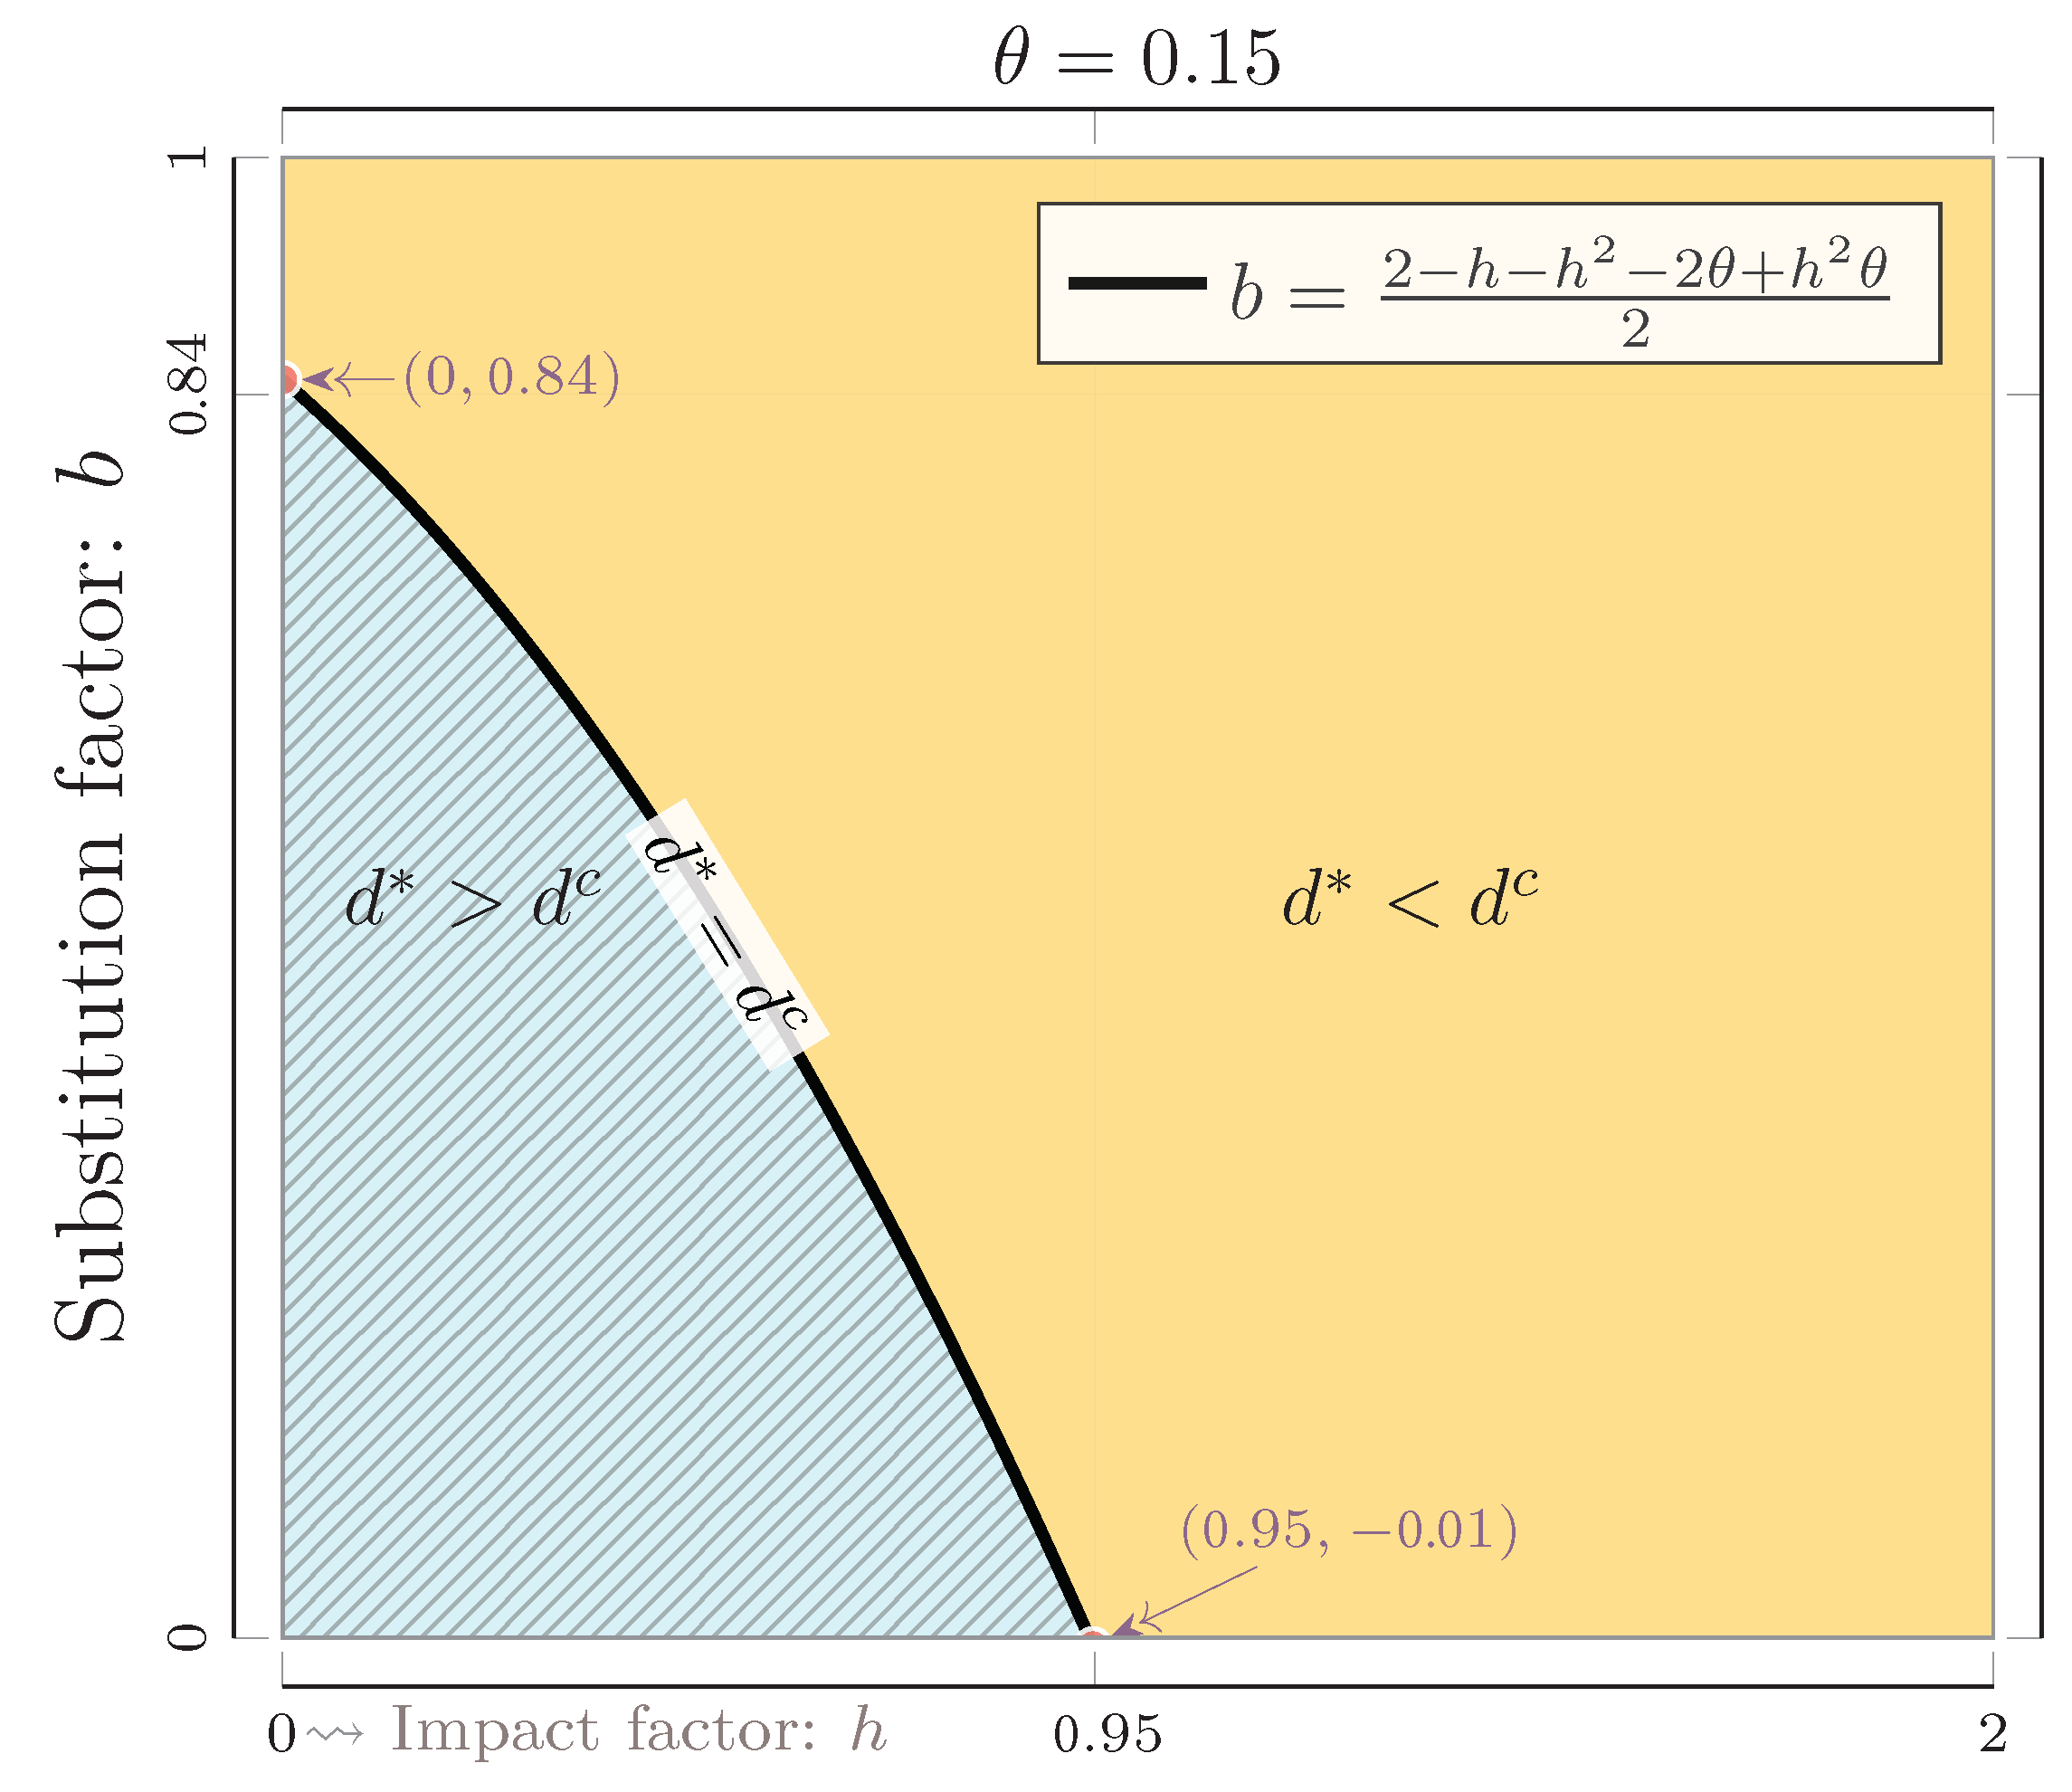
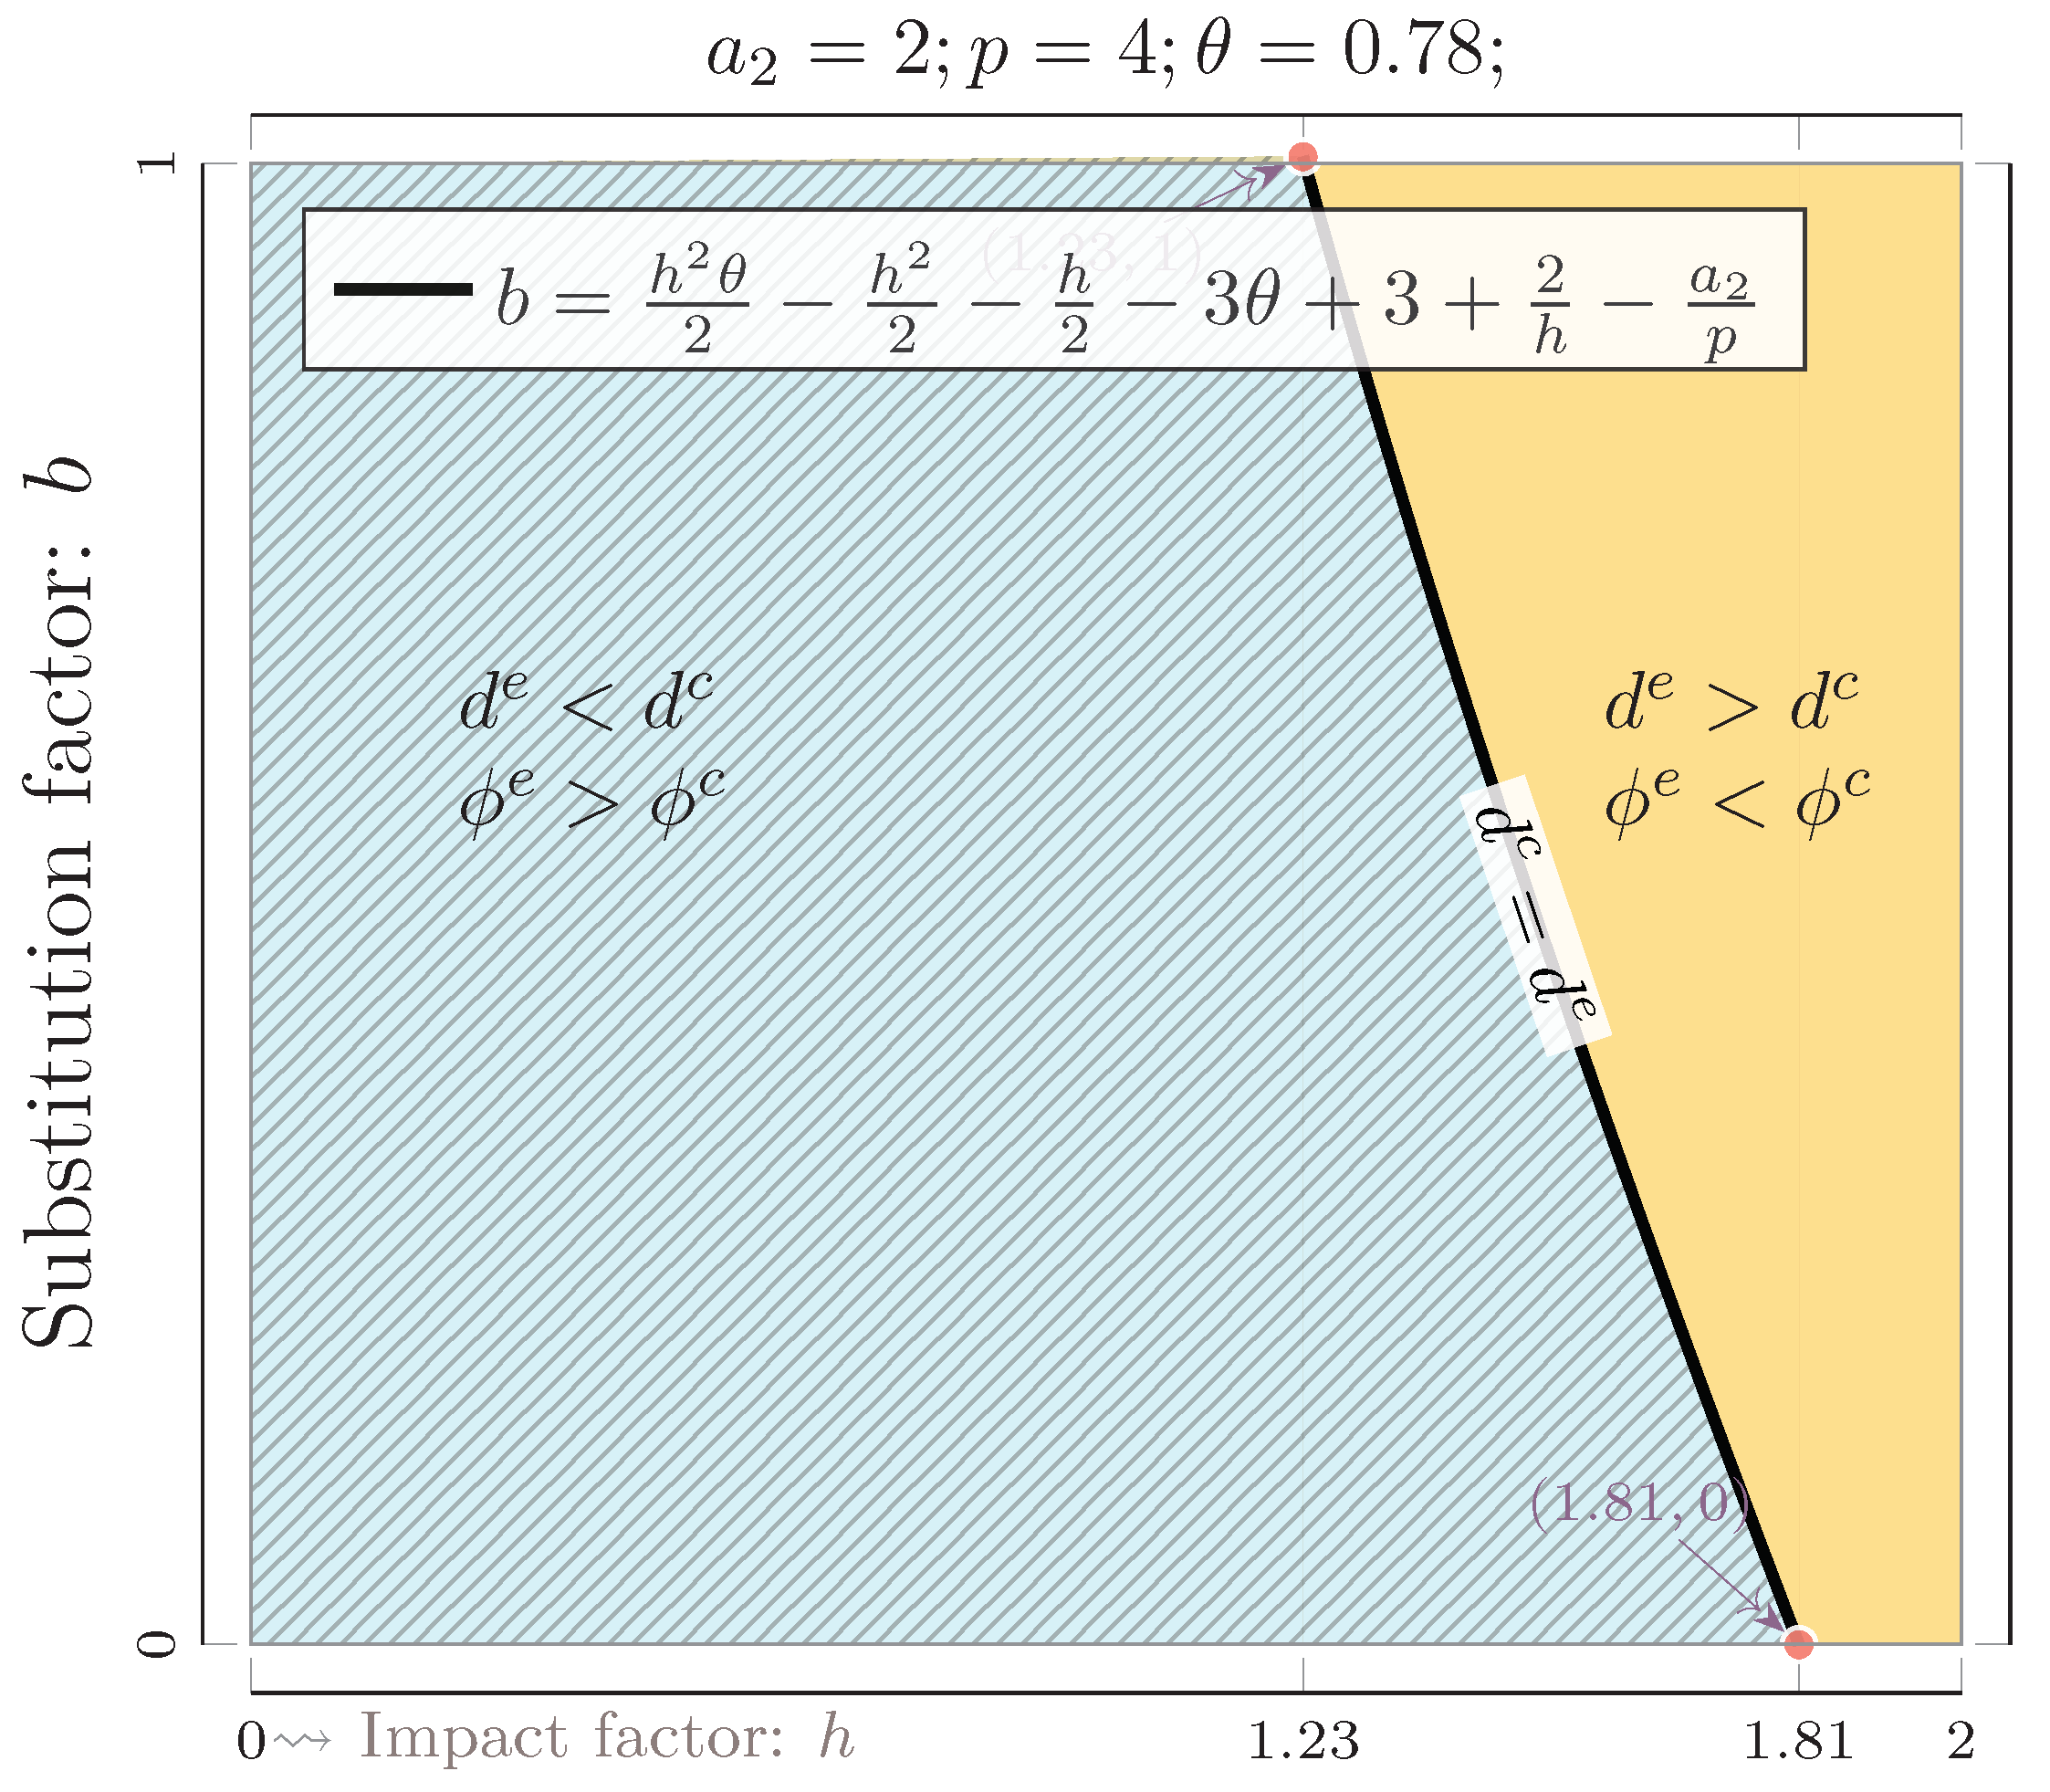
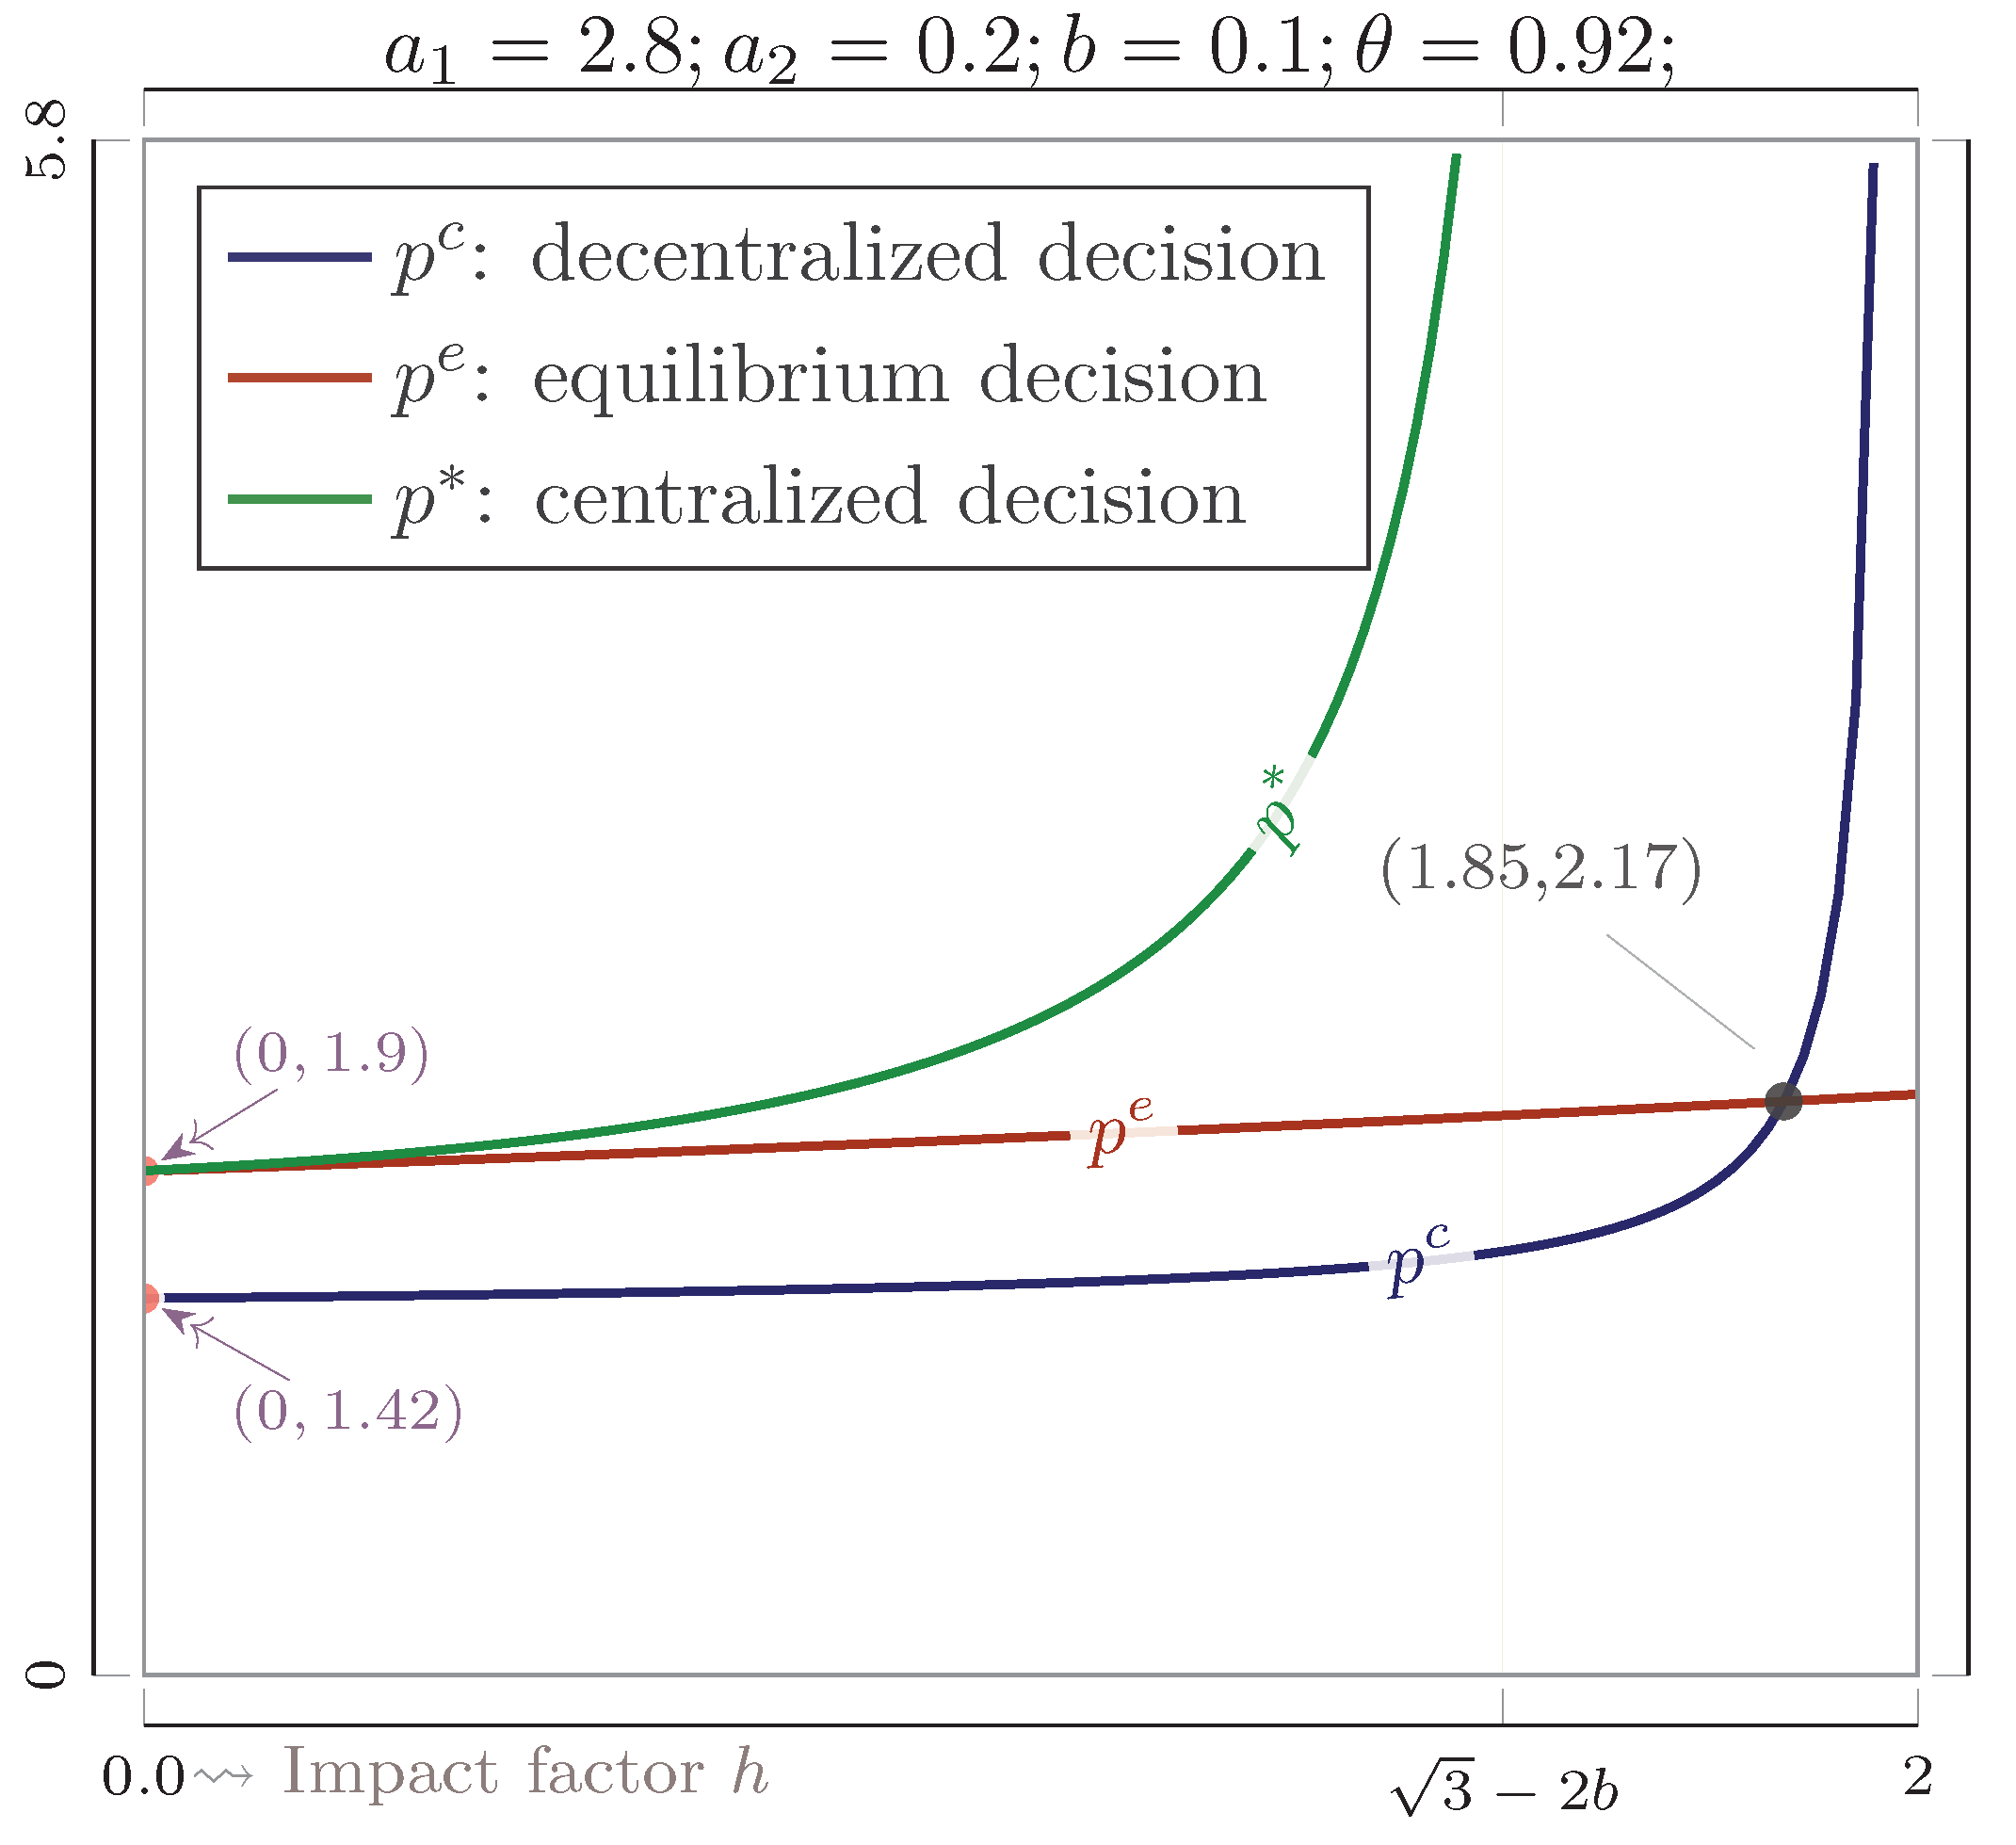
4.3. Comparing Platform Discounts and Optimal Promotional Efforts under Different Scenarios

In this section, we will compare the platform discounts d and the optimal promotional  ϕ  efforts among the three different scenarios.
We first compare the platform discounts and the optimal promotional efforts between the centralized decision model and the decentralized decision model.
Proposition 4.
(i)  ϕ *  is always higher than  ϕ c ; (ii) when  b < 2 h h 2 2 θ + h 2 θ 2 d *  is higher than  d c , else  d * < d c .
The revenue under the centralized decision model includes online demand  q 1  and offline demand  q 2 , but under the decentralized decision model, since the platform decides the promotion effort, its revenue only includes part of online sales. Consequently, the promotional effort has a greater impact on sales under the centralized decision model than that under the decentralized decision model. Then, the global optimal promotional effort is always higher than the optimal promotional effort for the platform, i.e.,  ϕ * > ϕ c . As shown in Figure 16, when the substitution factor b is low ( b < 2 h h 2 2 θ + h 2 θ 2 ), under a centralized decision model, the impact of d on offline demand is low, and the discount mainly increases the online demand. However, when the substitution factor b is high ( b > 2 h h 2 2 θ + h 2 θ 2 ), under a centralized decision model, the impact of d on offline demand is high as the online discount mainly decreases the offline demand. Therefore, when the substitution factor b is low, under the centralized decision model, a higher online discount is provided than that under the decentralized decision model, i.e.,  d * > d c .
Proposition 5.
(i) When  b < 2 a 2 h 2 + h 4 p θ h 4 p h 3 p 2 h 2 p θ + 2 h 2 p 8 p θ + 8 p 2 p ( h 2 + 4 ) d *  is higher than  d e , else  d * < d e ; (ii) when  b > 1 θ ( 1 θ ) h 2 4 h 4 a 2 2 p ϕ *  is higher than  ϕ e , else  ϕ * < ϕ e .
The revenue under the centralized decision model includes online demand  q 1  and offline demand  q 2 , but under the equilibrium decision model, since the food service provider decides the promotion effort, its revenue includes offline sales and the part of online sales. When the substitution factor b is low ( b < 2 a 2 h 2 + h 4 p θ h 4 p h 3 p 2 h 2 p θ + 2 h 2 p 8 p θ + 8 p 2 p ( h 2 + 4 ) ), under a centralized decision model, the impact of d on offline demand is low, and the discount mainly increases the online demand. However, when the substitution factor b is high ( b > 2 a 2 h 2 + h 4 p θ h 4 p h 3 p 2 h 2 p θ + 2 h 2 p 8 p θ + 8 p 2 p ( h 2 + 4 ) ), under a centralized decision model, the impact of d on offline demand is high, and the online discount mainly decreases the offline demand. Therefore, when the substitution factor b is low, under the centralized decision model, a higher online discount is provided than that under the equilibrium decision model, i.e.,  d * > d e ; else  d * < d e . (See Figure 17a).
As shown in Figure 17b, only when the substitution factor b is high enough ( b > 1 θ ( 1 θ ) h 2 4 h 4 a 2 2 p ), the promotional effort has a greater impact on the sales under the equilibrium decision model than that under the decentralized decision model. Then, the global optimal promotional effort is higher than the equilibrium promotional effort for the platform, i.e.,  ϕ * > ϕ c .
Proposition 6.
(i) When  b > h 2 θ 2 h 2 2 h 2 3 θ + 3 + 2 h a 2 p d e  is higher than  d c  and  ϕ c  is higher than  ϕ e , else,  d c  is higher than  d e  and  ϕ e  is higher than  ϕ c .
The only difference between the decentralized decision model and the equilibrium decision model is who decides the promotional effort: the platform or the food service provider. Under the equilibrium decision model, since the food service provider decides the promotional effort, the equilibrium promotional effort is not related to the substitution b since the platform can only control online discounts and can not control the promotional effort. When the substitution factor is low ( b < h 2 θ 2 h 2 2 h 2 3 θ + 3 + 2 h a 2 p ), the impact of discount on the offline sales is low; then, a lower online discount should be provided under the equilibrium decision model. Under the decentralized decision model, the platform can control both online discounts and promotional efforts. The benefit for the platform from the promotional effort is smaller than that of the food service provider. Then, the platform will set a lower promotional effort. At the same time, to retain more online customers, the platform will set a higher online discount. Therefore, when the substitution factor is low, the equilibrium platform discount is higher than the optimal platform discount, i.e.,  d e < d c , but the equilibrium promotional effort is higher than the optimal promotional effort, i.e.,  ϕ e > ϕ c . (See Figure 18).

5. Extension

In this section, we consider the optimal price under the three scenarios. Under the decentralized decision model and the equilibrium decision model, the food service provider decides the retail price. However, under the centralized decision model, the retail price is decided to maximize the supply chain profit. Under the decentralized decision model, the food service provider maximizes its profit by adjusting the retail price. Then, the profit optimization function is
max p π 1 ( d c , ϕ c ) = p q 1 ( d c , ϕ c ) + ( 1 θ ) p q 2 ( d c , ϕ c ) .
Under the equilibrium decision model, the food service provider maximizes its profit by adjusting the retail price. Then, the profit optimization function is
max p π 1 ( d e , ϕ e ) = p q 1 ( d e , ϕ e ) + ( 1 θ ) p q 2 ( d e , ϕ e ) .
Under the centralized decision-making model, since the entire supply chain is considered as a whole when the supply chain decides on the optimal discount and promotional effort, the price is decided to maximize the supply chain profit. Then, the supply chain profit optimization function is
max p π = π 1 ( d * , ϕ * ) + π 2 ( d * , ϕ * ) = p q 1 ( d * , ϕ * ) + ( p d * ) q 2 ( d * , ϕ * ) ϕ * 2 .
Then, we obtain the following proposition.
Proposition 7.
In the decentralized decision model, the food service provider’s optimal price is
p c = a 1 h 2 a 2 h 4 a 1 2 ( 1 θ + b ) a 2 4 b 2 + 2 ( 1 θ ) b h 2 + 2 b h + 8 b ( 1 θ ) + 2 h 2 2 h ( 1 θ ) 4 ( 1 θ ) 2 8 ;
in the equilibrium decision model, the food service provider’s optimal price is
p e = 2 a 1 + ( 1 + b θ ) a 2 3 + 2 ( 1 θ ) 2 b h 2 ( 1 θ ) 4 b ( 1 θ ) h ( 1 θ ) b h 2 b 2 ;
the supply chain’s optimal price is
p * = a 1 h 2 4 a 1 4 a 2 b a 2 h 2 ( 4 b 2 + 2 b h + h 2 3 ) .
Next, we compare the prices among three scenarios. Furthermore, we analyzed the effect of the impact factor of promotional on online sales h on optimal pricing under three decision scenarios. As shown in Figure 19, under all three scenarios, the optimal price increases with h. Because of the competition between online and offline sales under the decentralized decision and the equilibrium decision models, the decentralized optimal price and the equilibrium price are always lower than the centralized optimal price. The increment of h leads to a higher promotional effort, and the higher promotional effort leads to a higher retail price. In addition, because the food service provider’s revenue is from online and offline sales but the platform’s revenue is only from online, the impact of the promotional effort on the service provider’s sales is more sensitive than on the platform’s sales. Since the platform decides on the promotional effort under equilibrium but the food service provider decides on the promotional effort under the decentralized decision model, the impact of h on the retail price is more sensitive under the decentralized decision model than under the equilibrium decision model. Then, as h increases, the price comparison result between the decentralized decision and the equilibrium decision models is different. In particular, there exists a threshold within the two decentralized models. When h is less than the threshold, the equilibrium price is higher than the decentralized price. However, when h is higher than the threshold, the equilibrium price is lower than the decentralized price. (See Figure 19).

6. Conclusions

We construct demand functions for online and offline sales, considering promotion as well as substitution relationships. The profit functions of food service providers and takeaway platforms in partial cooperation situations are subsequently constructed. In the partially cooperative case, food service providers need to rely on the well-established platform to sell takeaways, after which they will share a portion of the revenue with the platform. In this case, we consider two classic models: the decentralized decision model and the equilibrium decision model. In the decentralized decision model, the platform decides both the promotional effort and the online discount; in the equilibrium decision model, the platform decides the online discount, while the food service provider decides the promotional effort.

6.1. Results Summary

In the decentralized decision model, we find that the online discount decreases in price when the substitution factor is high but decreases in price when the substitution factor is low. The promotional effort increases in price when the substitution factor is high but decreases in price when the substitution factor is low. The online discount decreases in the platform’s revenue share when the impact factor of the online promotion is high but increases in the platform’s revenue share when the impact factor of the online promotion is high. As the impact factor of the online promotion increases, when the substitution factor is high, the online discount decreases, and the promotional effort increases, but when the substitution factor is low, the online discount increases, and the promotional effort decreases.
In the equilibrium decision model, the online discount increases in price when the platform’s revenue share is high but decreases in price when the platform’s revenue share is low.
After that, we consider the centralized decision model, in which both the takeaway platform and the food service provider have maximized the overall profit as the decisive goal. We find that the online discount decreases in price when the impact factor of the online promotion is high but increases in price when the impact factor of the online promotion is low.
Then, we analyze and compare the results under three models. We find that when the substitution factor is low enough, or the impactor factor of online promotion is low enough, the global optimal platform discount is higher than both the equilibrium platform discount and the decentralized online discount; otherwise, the results are the opposite.
The global optimal promotional effort is always higher than that in the decentralized model. When the substitution factor is low enough, or the impactor factor of online promotion is low enough, the global optimal promotional effort is higher than the equilibrium optimal promotional effort; otherwise, the result is the opposite.

6.2. Managerial Implications

We have found that the entire supply chain is most profitable under the centralized decision model, so those large restaurants that have the ability to build their own online takeaway platform should build their own takeaway platforms. In addition, we find that under the decentralized decision model, when promotion works well in the takeaway channel, the takeaway platform reduces the online discount as the platform’s share percentage increases and spends the saved money on promotion. When the promotion does not work well in the takeaway channel, as the platform share percentage increases, the takeaway platform will increase both promotion and discount. So, a takeaway platform, when the takeaway market is better, can charge a higher revenue share, reduce the online subsidies, and increase promotion. Food service providers’ profits will increase as they face less competition offline due to the increase in takeaway prices, and the increased promotion will bring more customers offline. In addition, when the takeaway market is bad, food service providers should strive for a lower revenue share.

6.3. Limitations and Further Study

In this paper, only two variables are selected as decision variables in order to get more intuitive results. More decision variables can be added in the future, such as price p. This paper only studies the case of a single food service provider and a single takeaway platform, and in future research, we can consider studying the case of multiple food service providers or multiple takeaway platforms competing with each other.

Author Contributions

Conceptualization, X.L. and K.L.; methodology, X.L. and K.L.; software, Y.L.; validation, X.L., K.L. and Y.L.; formal analysis, X.L. and K.L.; resources, X.L.; data curation, Y.L.; writing—original draft preparation, X.L. and K.L.; writing—review and editing, X.L., K.L. and Y.L.; visualization, Y.L.; supervision, X.L.; project administration, Y.L.; funding acquisition, X.L. All authors have read and agreed to the published version of the manuscript.

Funding

This research was funded by Macau University of Science and Technology Faculty Research Grants through FRG-22-094-INT.

Data Availability Statement

The data used to support the findings of this study are included within the article. More (e.g., TikZ/PGF source code and data, etc.) can be downloaded from the author’s Github: https://github.com/iihciyekub/Mathematics-figtexdata-230629 (accessed on 29 June 2023).

Acknowledgments

The authors thank the editor and four anonymous reviewers of the paper. Their constructive suggestions and comments have considerably improved the quality of the paper. The authors thank the funding from Macau University of Science and Technology Faculty Research Grants through FRG-22-094-INT.

Conflicts of Interest

The authors declare no conflict of interest.

Abbreviations

The following abbreviations are used in this manuscript:
O2OOnline to Offline

Appendix A

Appendix A.1. Proof of Lemma 1

Find the partial derivatives of  π 2  with respect to  ϕ , d, respectively, and make the partial derivatives equal to zero to obtain
π 2 ϕ = h p θ h d 2 ϕ = 0 ,
π 2 d = p θ d a 2 h ϕ + p d b p = 0 .
Solving the system of equations yields
ϕ c = h ( θ + b 1 ) p + h a 2 4 h 2 ,
d c = 2 ( 1 + θ b ) p θ h 2 p 2 a 2 4 h 2 .
Since  2 π 2 ϕ = 2 2 π 2 d = 2 2 π 2 ϕ d = h , so in the case of  h < 2 , the Hesse matrix is a negative definite matrix, so the equation  π 2  is maximum at the point  ( ϕ c , d c ) .

Appendix A.2. Proof of Proposition 1

d c p = 2 ( 1 + θ b ) θ h 2 4 h 2 .
So when  b < 1 + θ θ h 2 2 d c p > 0 d c  increases in p when  b > 1 + θ θ h 2 2 d c p < 0 d c  decrease in p.
d c b = 2 p 4 h 2 < 0 ,
d c  decreases in b.
d c θ = ( 2 h 2 ) p 4 h 2 .
So when  h < 2 d c θ > 0 d c  increases in  θ  when  h > 2 d c θ < 0 d c  decreases in  θ .
d c h = 4 h [ ( 1 θ b ) p a 2 ] ( 4 h 2 ) 2 .
So when  b < 1 θ a 2 p d c h > 0 d c  increases in h when  b > 1 θ a 2 p d c h < 0 d c  decreases in h.
ϕ c p = h ( θ + b 1 ) 4 h 2 .
So When  b > 1 θ ϕ c p > 0 ϕ c  increases in p when  b < 1 θ ϕ c p < 0 ϕ c  decreases in p.
ϕ c b = h p 4 h 2 > 0 ,
ϕ c  increase in b.
ϕ c θ = h p 4 h 2 > 0 ,
ϕ c  increase in  θ .
ϕ c h = ( 4 + h 2 ) [ ( θ + b 1 ) p + a 2 ] ( 4 h 2 ) 2 .
So when  b > 1 θ a 2 p ϕ c h > 0 ϕ c  increases in h when  b < 1 θ a 2 p ϕ c h < 0 ϕ c  decreases in h.

Appendix A.3. Proof of Lemma 2

Find the partial derivatives of  π 1  with respect to  ϕ , and make the partial derivatives equal to zero to obtain
π 1 ϕ = p + ( 1 θ ) h p 2 ϕ = 0 .
Solving the equation yields
ϕ e = ( h θ h + 1 ) p 2 .
Find the partial derivatives of  π 2  with respect to d, and make the partial derivatives equal to zero to obtain
π 2 p = a 2 h ϕ c + ( p d ) b p + ( θ p d ) = 0 ,
d e = ( 2 θ + 2 2 b + θ h 2 h h 2 ) p 2 a 2 4 .

Appendix A.4. Proof of Proposition 2

d e p = 2 θ + 2 2 b + θ h 2 h h 2 4 .
When  θ > h 2 + h + 2 b 2 2 + h 2 d e p > 0  means that  d e  increases in p, else  d e p < 0 , means that  d e  decreases in p
d e b = 2 p 4 < 0 ,
d e  decrease in b.
d e θ = 2 + h 2 4 p > 0 ,
d e  increase in  θ .
d e h = 2 θ h 1 2 h 4 p < 0 ,
d e  decrease in h.
ϕ e p = ( h θ h + 1 ) 2 > 0 ,
ϕ e  increase in p.
ϕ e θ = h p 2 < 0 ,
ϕ e  decrease in  θ .
ϕ e h = ( 1 θ ) p 2 > 0 ,
ϕ e  increase in h.

Appendix A.5. Proof of Lemma 3

Find the partial derivatives of  π  with respect to  ϕ  and d, respectively, and make the partial derivatives equal to zero to obtain
π ϕ = p + h p h d 2 ϕ = 0 ,
π d = p b p d ( a 2 + h ϕ ( p d ) + b p ) = 0 .
Solving the system of equations yields
ϕ * = 2 b h + 2 4 h 2 p + h a 2 4 h 2 ,
d * = 4 4 b h h 2 4 h 2 p 2 a 2 4 h 2 .
Since  2 π ϕ 2 = 2 2 π d 2 = 2 2 π ϕ d = h , so in the case of  h < 2 , the Hesse matrix is a negative definite matrix, so the equation  π  is maximum at the point  ( ϕ * , d * ) .

Appendix A.6. Proof of Proposition 3

d * p = 4 4 b h h 2 4 h 2 .
If  h > 17 16 b 1 2 d * p < 0 , so  d *  decreases in p. If  h < 17 16 b 1 2 d * p > 0 , so  d *  increases in p.
d * b = 4 p 4 h 2 < 0 ,
d *  decrease in b.
d * h = h 2 p 4 p 8 b h p 4 h a 2 ( 4 h 2 ) 2 < 0 ,
d *  decrease in h.
ϕ * p = 2 b h + 2 4 h 2 > 0 ,
ϕ *  increase in p.
ϕ * b = 2 h p 4 h 2 > 0 ,
ϕ *  increase in b.
ϕ * h = 2 b p + a 2 4 h 2 + 4 b h 2 + 4 h ( 4 h 2 ) 2 p + 2 h 2 a 2 ( 4 h 2 ) 2 > 0 ,
ϕ *  increase in h.

Appendix A.7. Proof of Proposition 4

d c d * = p ( 2 b h 2 θ + h 2 + h + 2 θ 2 ) 4 h 2 ,
when  b > 2 h h 2 2 θ + h 2 θ 2 d c d * > 0 d c  is greater than  d * , else,  d c d * > 0 d c  is no greater than  d * .
ϕ c ϕ * = ( θ b 1 ) h p 2 p 4 h 2 < 0 ,
ϕ *  is greater than  ϕ c .

Appendix A.8. Proof of Proposition 5

d * d e = 8 p 8 b p 8 θ p 4 θ h 2 p + 2 h 2 θ p + 2 h 2 p 2 b h 2 p + h 4 θ p h 3 p h 4 p 2 h 2 a 2 > 0 ,
b < 2 a 2 h 2 + h 4 p θ h 4 p h 3 p 2 h 2 p θ + 2 h 2 p 8 p θ + 8 p 2 p ( h 2 + 4 ) .
When  b < 2 a 2 h 2 + h 4 p θ h 4 p h 3 p 2 h 2 p θ + 2 h 2 p 8 p θ + 8 p 2 p ( h 2 + 4 ) d *  is greater than  d e , else,  d *  is no greater than  d e .
ϕ * ϕ e = 4 b h p + 2 h a 2 4 h p + 4 θ h p + h 3 p h 3 θ p + h 2 p > 0 ,
b > 1 θ ( 1 θ ) h 2 4 h 4 a 2 2 p .
When  b > 1 θ ( 1 θ ) h 2 4 h 4 a 2 2 p ϕ *  is greater than  ϕ e , else,  ϕ *  is no greater than  ϕ e .

Appendix A.9. Proof of Proposition 6

d e d c = 6 θ h p 4 h p 6 h 2 p + 2 b h 2 p θ h 4 p + h 3 p + h 4 p + 2 h 2 a 2 > 0 .
b > h 2 θ 2 h 2 2 h 2 3 θ + 3 + 2 h a 2 p .
When  b > h 2 θ 2 h 2 2 h 2 3 θ + 3 + 2 h a 2 p d e  is greater than  d * , else,  d e  is no greater than  d * .
ϕ e ϕ c = 6 h p 6 θ h p + 4 p h 3 p + θ h 3 p h 2 p 2 h a 2 2 h b p > 0 .
b < h 2 θ 2 h 2 2 h 2 3 θ + 3 + 2 h a 2 p .
When  b h 2 θ 2 h 2 2 h 2 3 θ + 3 + 2 h a 2 p ϕ e  is greater than  ϕ c , else,  ϕ e  is no greater than  ϕ c .

Appendix A.10. Proof of Proposition 7

Based on (15), taking the first-order derivative of  π 1  with respect to p and making it equal to 0, we obtain
p c = a 1 h 2 a 2 h 4 a 1 2 ( 1 θ + b ) a 2 4 b 2 + 2 ( 1 θ ) b h 2 + 2 b h + 8 b ( 1 θ ) + 2 h 2 2 h ( 1 θ ) 4 ( 1 θ ) 2 8 .
Based on (16), taking the first-order derivative of  π 1  with respect to p and making it equal to 0, we obtain
p e = 2 a 1 + ( 1 + b θ ) a 2 3 + 2 ( 1 θ ) 2 b h 2 ( 1 θ ) 4 b ( 1 θ ) h ( 1 θ ) b h 2 b 2 .
Based on (17), taking the first-order derivative of  π  with respect to p and making it equal to 0, we obtain
p * = a 1 h 2 4 a 1 4 a 2 b a 2 h 2 ( 4 b 2 + 2 b h + h 2 3 ) .

References

  1. Zhao, X.; Lin, W.; Cen, S.; Zhu, H.; Duan, M.; Li, W.; Zhu, S. The online-to-offline (O2O) food delivery industry and its recent development in China. Eur. J. Clin. Nutr. 2021, 75, 232–237. [Google Scholar] [CrossRef] [PubMed]
  2. Zhi-Wei, Z.; Han, Q.; Statistics, S.O. Will Restaurants Earn More after They Joined the Take-out Platform?—A Survey Based on 267 Restaurants in Kaifeng. Econ. Surv. 2018, 35, 121–127. [Google Scholar]
  3. Anand, K.S.; Aron, R. Group buying on the web: A comparison of price-discovery mechanisms. Manag. Sci. 2003, 49, 1546–1562. [Google Scholar] [CrossRef]
  4. Kauffman, R.J.; Wang, B. New buyers’ arrival under dynamic pricing market microstructure: The case of group-buying discounts on the Internet. J. Manag. Inf. Syst. 2001, 18, 157–188. [Google Scholar] [CrossRef]
  5. Lai, H.; Doong, H.S.; Yang, C.Y. The effect of price dispersion in an e-market on consumers’ intentions to join group buying. In Proceedings of the 39th IEEE Annual Hawaii International Conference on System Sciences (HICSS’06), Kauia, HI, USA, 4–7 January 2006; Volume 6, p. 116a. [Google Scholar]
  6. Kim, H.; Ryu, M.H.; Lee, D.; Kim, J.H. Should a small-sized store have both online and offline channels? An efficiency analysis of the O2O platform strategy. J. Retail. Consum. Serv. 2022, 64, 102823. [Google Scholar] [CrossRef]
  7. Qin, B.; Hou, H. Research on O2O model of fresh products. In Proceedings of the 2016 IEEE International Conference on Logistics, Informatics and Service Sciences (LISS), Sydney, NSW, Australia, 24–27 July 2016; pp. 1–4. [Google Scholar] [CrossRef]
  8. Pei, Y.; Xue, W.; Yang, Y.; Li, D.; Li, Y. The Impacts of user experience on user loyalty based on O2O innovation platform. J. Electron. Commer. Organ. (JECO) 2019, 17, 79–87. [Google Scholar] [CrossRef]
  9. Hsiao, L.; Chen, Y.J. Strategic motive for introducing internet channels in a supply chain. Prod. Oper. Manag. 2014, 23, 36–47. [Google Scholar] [CrossRef]
  10. Zhang, P.; He, Y.; Zhao, X. “Preorder-online, pickup-in-store” strategy for a dual-channel retailer. Transp. Res. Part E Logist. Transp. Rev. 2019, 122, 27–47. [Google Scholar] [CrossRef]
  11. Pei, Z.; Wooldridge, B.R.; Swimberghe, K.R. Manufacturer rebate and channel coordination in O2O retailing. J. Retail. Consum. Serv. 2021, 58, 102268. [Google Scholar] [CrossRef]
  12. Govindan, K.; Malomfalean, A. A framework for evaluation of supply chain coordination by contracts under O2O environment. Int. J. Prod. Econ. 2019, 215, 11–23. [Google Scholar] [CrossRef]
  13. Viswanathan, S.; Wang, Q. Discount pricing decisions in distribution channels with price-sensitive demand. Eur. J. Oper. Res. 2003, 149, 571–587. [Google Scholar] [CrossRef]
  14. Lei, Q.; He, J.; Huang, F. Impacts of Online and Offline Channel Structures on Two-Period Supply Chains with Strategic Consumers. Mathematics 2020, 8, 34. [Google Scholar] [CrossRef]
  15. Yi, S.; Yu, L.; Zhang, Z. Research on Pricing Strategy of Dual-Channel Supply Chain Based on Customer Value and Value-Added Service. Mathematics 2021, 9, 11. [Google Scholar] [CrossRef]
  16. Fang, Y.; Ren, Z.; Yang, F. The Impact of Carbon Allowance Allocation Rules on Remanufacturing Decisions in a Closed-Loop Supply Chain. Mathematics 2023, 11, 2817. [Google Scholar] [CrossRef]
  17. Zhao, Y.; Zhou, S. The Impact of Two-Sided Market Platforms on Participants’ Trading Strategies: An Evolutionary Game Analysis. Mathematics 2023, 11, 1927. [Google Scholar] [CrossRef]
  18. Chen, M.; Hu, M.; Wang, J. Food delivery service and restaurant: Friend or foe? Manag. Sci. 2022, 68, 6539–6551. [Google Scholar] [CrossRef]
  19. Du, Z.; Fan, Z.P.; Gao, G.X. Choice of O2O food delivery mode: Self-built platform or third-party platform? Self-delivery or third-party delivery? IEEE Trans. Eng. Manag. 2021, 70, 2206–2219. [Google Scholar] [CrossRef]
  20. Pei, Y.L.; Li, D.D.; Xue, W.X. The evaluation of customer experience using BP neural network-taking catering O2O takeout. Concurr. Comput. Pract. Exp. 2020, 32, e5515. [Google Scholar] [CrossRef]
  21. Yeo, V.C.S.; Goh, S.K.; Rezaei, S. Consumer experiences, attitude and behavioral intention toward online food delivery (OFD) services. J. Retail. Consum. Serv. 2017, 35, 150–162. [Google Scholar] [CrossRef]
  22. Jun, K.; Yoon, B.; Lee, S.; Lee, D.S. Factors influencing customer decisions to use online food delivery service during the COVID-19 pandemic. Foods 2022, 11, 64. [Google Scholar] [CrossRef]
  23. Wang, T. A Study on the Choice of Online Marketplace Co-Opetition Strategy Considering the Promotional Behavior of a Store on an E-Commerce Platform. Mathematics 2023, 11, 2263. [Google Scholar] [CrossRef]
  24. Zhang, J.C.; Savage, S.J.; Chen, Y. Consumer uncertainty and price discrimination through online coupons: An empirical study of restaurants in Shanghai. Inf. Econ. Policy 2015, 33, 43–55. [Google Scholar] [CrossRef]
  25. Luo, K.; Ni, G. The effects of price subsidy on take-away pricing and revenue. In Proceedings of the 2019 IEEE International Conference on Industrial Engineering and Systems Management (IESM), Shanghai, China, 25–27 September 2019; pp. 1–5. [Google Scholar]
  26. Zheng, X.; Guo, X. E-retailing of restaurant services: Pricing strategies in a competing online environment. J. Oper. Res. Soc. 2016, 67, 1408–1418. [Google Scholar] [CrossRef]
  27. Tang, C.; Cao, E.; Shi, Z. Channel Competition and Coordination of a Dual-Channel Supply Chain under Interval Demand. Mathematics 2023, 11, 2720. [Google Scholar] [CrossRef]
  28. Dan, B.; Xu, G.; Liu, C. Pricing policies in a dual-channel supply chain with retail services. Int. J. Prod. Econ. 2012, 139, 312–320. [Google Scholar] [CrossRef]
Figure 1. Cash flow of the online and offline sales of restaurants under decentralized decision model.
Mathematics 11 03610 g001
Figure 2. Sensitivity analysis of b.
Mathematics 11 03610 g002
Figure 3. Sensitivity analysis of p.
Mathematics 11 03610 g003
Figure 4. Sensitivity analysis of  θ .
Mathematics 11 03610 g004
Figure 5. Sensitivity analysis of h.
Mathematics 11 03610 g005
Figure 6. Sensitivity analysis of substitution factor b.
Mathematics 11 03610 g006
Figure 7. Sensitivity analysis of price p.
Mathematics 11 03610 g007
Figure 8. Sensitivity analysis of percentage  θ .
Mathematics 11 03610 g008
Figure 9. Sensitivity analysis of impact factor h.
Mathematics 11 03610 g009
Figure 10. Cash flow diagram for online and offline sales of restaurants under fully cooperative.
Mathematics 11 03610 g010
Figure 11. Sensitivity analysis of substitution factor b.
Mathematics 11 03610 g011
Figure 12. Sensitivity analysis of price p when  h < 17 16 b 1 2 .
Mathematics 11 03610 g012
Figure 13. Sensitivity analysis of Impact factor h.
Mathematics 11 03610 g013
Figure 14. Comparing profit of each member under different scenarios.
Mathematics 11 03610 g014
Figure 15. Comparison of total profits under different scenarios.
Mathematics 11 03610 g015
Figure 16. Comparison of d in the case of the centralized and decentralized decision model.
Mathematics 11 03610 g016
Figure 17. Comparison of d and  ϕ  in the case of the centralized and equilibrium decision model.
Mathematics 11 03610 g017
Figure 18. Comparison of d and  ϕ  in the case of the decentralized and equilibrium decision model.
Mathematics 11 03610 g018
Figure 19. A comparison of optimal pricing under different scenarios.
Mathematics 11 03610 g019
Table 1. Definitions of Symbols.
SymbolDescription
Parameters:
  a 1 The original market size offline;
  a 2 The original market size online;
  q 1 Offline sales volume;
  q 2 Online sales volume;
bSubstitution factor;
pThe price of producing products;
  θ Platform’s revenue share of the online sales;
hImpact factor of promotion on online sales;
Decision variables:
dA discount (when  d > 0 ) or a surcharge (when  d < 0 ) for the online sales;
  ϕ Promotional effort;
Revenue functions:
  π 1 The revenue of the food service provider;
  π 2 The revenue of the platform;
  π Total revenue of the food service provider and the platform.
Table 2. The impact of parameters on the optimal platform discount  d c  and the optimal promotional effort  ϕ c .
  d c   ϕ c
ConditionsPropertyConditionsProperty
p   b > 1 + θ θ h 2 2   b > 1 θ
  b < 1 + θ θ h 2 2   b < 1 θ
bMathematics 11 03610 i001Mathematics 11 03610 i001
θ   h > 2 Mathematics 11 03610 i001
  h < 2
h   b > 1 θ a 2 p   b > 1 θ a 2 p
  b < 1 θ a 2 p   b < 1 θ a 2 p
↗: increase; ↘: decrease; Mathematics 11 03610 i001: without conditions.
Table 3. The impact of parameters on the equilibrium platform discount  d e  and the equilibrium promotional effort  ϕ e .
  d e   ϕ e
ConditionsPropertyConditionsProperty
p   θ > h 2 + h + 2 b 2 2 + h 2 Mathematics 11 03610 i001
  θ < h 2 + h + 2 b 2 2 + h 2
bMathematics 11 03610 i001nonenone
  θ Mathematics 11 03610 i001Mathematics 11 03610 i001
hMathematics 11 03610 i001Mathematics 11 03610 i001
↗: Increase; ↘: Decrease; Mathematics 11 03610 i001: Without conditions; none: Independent.
Table 4. The impact of parameters on the global optimal platform discount  d *  and the global optimal promotional effort  ϕ * .
  d *   ϕ *
ConditionsPropertyConditionsProperty
p   h > 17 16 b 1 2 Mathematics 11 03610 i001
  h < 17 16 b 1 2
bMathematics 11 03610 i001Mathematics 11 03610 i001
  θ nonenonenonenone
hMathematics 11 03610 i001Mathematics 11 03610 i001
↗: Increase; ↘: Decrease; Mathematics 11 03610 i001: Without conditions; none: Independent.
Disclaimer/Publisher’s Note: The statements, opinions and data contained in all publications are solely those of the individual author(s) and contributor(s) and not of MDPI and/or the editor(s). MDPI and/or the editor(s) disclaim responsibility for any injury to people or property resulting from any ideas, methods, instructions or products referred to in the content.

