Abstract
In recent years, the problem of potential-induced degradation (PID) phenomenon has been deeply associated with solar power issues because it causes serious power attenuation of solar panels and results in lowering its power generation efficiency. Thus, effectively identifying the PID problem from insights of industry data analysis to reduce production costs and increase the performance of power generation is an interesting and important subject for the solar power industry. Moreover, by the traditional standard rule (IEC62804) and the condition of a 96 h testing time, the costs of testing time and assembling materials against PID are very high and must be improved. Given the above reasons, this study proposes a hybrid procedure to organizes four mathematical methods: the mini-module testing, solar cell testing, a settling time, and a neural network, which are named as Method-1–Method-4, respectively, to efficiently solve the PID problem. Consequently, there are four key outcomes from the empirical results for solar power application: (1) In Method-1 with a 96 h testing time, it was found that the large module with higher costs and the mini module with lower costs have a positive correlation; thus, we can replace the large-module testing by the effective mini module for lower cost on module materials. (2) In Method-2 with a 24 h testing time, it was also found that the mini module and the solar cell are positively correlated; this result provides evidence that we can conduct the PID test by the easier solar cell to lower the costs. (3) In Method-3, the settling time achieves an average accuracy of 94% for PID prediction with a 14 h testing time. (4) In Method-4, the experimental result provides an accuracy of 80% when identifying the PID problem with the mathematical neural network model and are obtained within a 2 h testing time. From the above results, these methods succeed in reducing cost of materials and testing time during the manufacturing process; thus, this study has an industrial application value. Concurrently, Method-3 and Method-4 are rarely seen in the limited literature review for identifying PID problem; therefore, this study also offers a novel contribution for technical application innovation.
Keywords:
solar cell; potential induced degradation; mathematical models; industry data analysis; neural networks MSC:
03C30; 03C98
1. Introduction
This section first illustrates related issues on potential induced degradation (PID) phenomenon for solar panels, including basic knowledge and research motivation, limitations in previous studies, research intentions, and novelty and contribution of this study.
1.1. Basic Knowledge Related and Research Motivation of the Study
Due to limited natural resources, the energy crisis is a serious issue globally, showing an urgent need for green energy and in particular for solar power. Solar power is vital form of energy, with an unlimited natural resource in inexhaustible supplies because it can continuously convert useful energy from raw sunlight into usable power. In practice, two forms of energy, heat and electricity, are generated through the use of solar panels to real-world use in order to solve the problem of energy crisis. There are two kinds of spontaneous reduction of power generation efficiency in solar panels; one is light-induced degradation (LID) [1,2,3], and the other is potential-induced degradation (PID) [4,5,6,7]. Degradation occurs due to sunlight in LID, but in PID, it is induced by high voltage. Specifically, PID is a phenomenon that negatively affects the cells of photovoltaic (PV) modules, and it causes an accelerated degradation in transformation performance [8,9]. Since PID causes a significant decline in the power of solar cells, it is important to effectively prevent the PID phenomenon in the implemented field. Identifying and solving the related problems of the PID phenomenon is the motivation of this study, in order to provide new and significant insights for both researchers and practitioners.
In previous studies, there has been a focus on the improvement of solar-cell materials to prevent PID [10,11], especially crystalline silicon solar cells [12,13]; thus, control of the base resistivity of materials is one of the methods to reduce PID. Earlier studies have pointed out that the PID problem can be effectively slowed down [14] when the base resistivity is higher. In addition, it is also an effective method to change the reflection index (RI) value of the anti-reflective coating of solar cells [14]; generally, a higher RI value in the anti-reflection coating has better PID resistance. There is a frequently used approach in PID prevention to improve module packaging materials [15]; the main structure of the general module includes front glass, ethylene vinyl acetate (EVA), solar cells, and back-sheet. From the study of Kambe et al. [16], the use of chemically strengthened glass package module can effectively reduce the occurrence of PID. Kapur et al. [17] pointed out that the encapsulation of EVA between the glass layer and the solar panel can also prevent PID. Thus, it is found that if the volume resistivity of EVA is increased or the ionomer film is used, the solar cells can be more resistant to PID [18]. From the descriptions mentioned above, most previous studies contribute to the improvement of materials for lowering the PID phenomenon; however, this method’s shortcoming is time and cost efficiency. Interestingly and importantly, various factors may influence practical PID issues; thus, it is a meaningful issue to effectively recognize the identifiable factors from of the benefiting industry data analysis. This method of appliable data analysis is emphasized in this study.
1.2. Shortcomings and Contributions of Previous Studies and Research Purposes of This Study
Furthermore, we have further reviewed and studied past research [10,11,12,13,14,15,16,17,18], and it is clear that most of the articles are focused on large modules (also known as standard modules) for the PID test. However, there are three influential differences from past studies for different combinations of modules, which contribute different degrees of production variances but result in some shortcomings such as testing time and production costs. (1) Packaging materials of large modules require a larger amount of production costs, which is cost consuming. (2) The factory tested by the mini module instead of the large module can only save costs on module packaging materials. (3) Solar cell testing is mainly to simulate high-voltage stress on the large module for solar power to induce degradation of the solar cell, and then measure the shunt resistance and analyze the PID by measuring results [19], which is both time consuming and costly. Furthermore, the shunt resistance can decrease with testing time [19]; therefore, how to shorten the testing time and accurately predict the PID phenomenon simultaneously is the key objective of this study. It is expected that using an effective method, such as mathematical models, can not only save testing costs, but it can also obtain testing results quicker, thereby overcoming the relevant shortcomings of testing time and production costs.
Given the above reasons, this study first tests and compares the PID phenomenon by sequentially organizing two methods of the large module with the mini module and the mini module with the solar cell. We aim to further propose a third method of a settling time to also test the PID, because the attenuation of parallel resistance for PID is like a capacitor discharge that releases the charge, and solar cell degradation is like a feature pattern. Based on this information, to find out and predict the PID problem in advance by using collected and measured industry data is aligned with application analysis. In addition, from a limited review, the traditional methods for prediction are contributing to the use of intuitionistic fuzzy logic [19] and C-means clustering [20] for industrial data, etc. However, due to the uncertainty and complexity of real-life industry data, the prediction process is filled with a considerable noise, and the problem makes the prediction results of traditional methods less robust. Therefore, an emerging requirement and challenge to cover the traditional methods are focused on an appropriated mathematical algorithm that can eliminate noise and accurately predict the data results of industry applications through some useful values, like generalized tricking eigenvalues. Hereafter, a variety of neural network (NN) structures, such as convolution neural network (CNN) [21,22] or back propagation neural network (BPNN) [23], that can bridge the research gap, because it is like a black box system and can be used for different applications in different industry fields, particularly in those that can be trained only with input and output data without having a well-defined mathematical model framework. Thus, this study uses a good alternative of a NN model as the fourth method to effectively address the PID issues to provide a prevention purpose against the PID problem in advance. Summarily, this study proposes a hybrid procedure to organize four methods, which are named Method-1–Method-4 for easy presentation. This is to drive an effective testing and prediction method from the perspective of industry data application, in order to suitably identify the PID phenomenon with comparative studies, and to enhance solar power performance as a green and clean energy source in this industry.
1.3. Novelty and Contribution of the Study
Importantly, this study proposes a hybrid four-method model in order to achieve the key purpose of reducing costs of materials and testing time during manufacturing process of solar panels; more interestingly, the proposed model is not yet found in past studies on the function of identifying PID for solar power industry. Simultaneously, both the proposed Method-3 and the organized Method-4 were also infrequent in the limited literature review on testing the PID phenomenon of solar panels; this study thus has a novel contribution with a technologically innovative application for industry fields. Afterwards, the experiments are executed in a practical way from a solar power industry perspective, and thus have industrial application value with managerial advantages and benefits. The study concludes with positive novel contributions for both developments of technology and application when compared to previous studies.
The remainder of this study is described as follows: Section 2 reviews the related issues and factors of the PID phenomenon. Subsequently, Section 3 introduces the proposed hybrid procedure of a four-method model, including mini module testing, solar cell testing, a settling time, and a mathematical neural network, for identifying the PID problem. Section 4 presents the empirical results of industry data analysis conducted in the four-method model. Finally, a conclusion and possible future research studies are presented and discussed in Section 5.
2. Literature Review
In this section, we review descriptions of the related research applications concerning background knowledge on the PID issue. This includes the PID phenomenon with a testing application for large modules and prevention applications, as well as the critical factors influencing the PID phenomenon for mini modules.
2.1. PID Phenomenon with a Testing Application Case
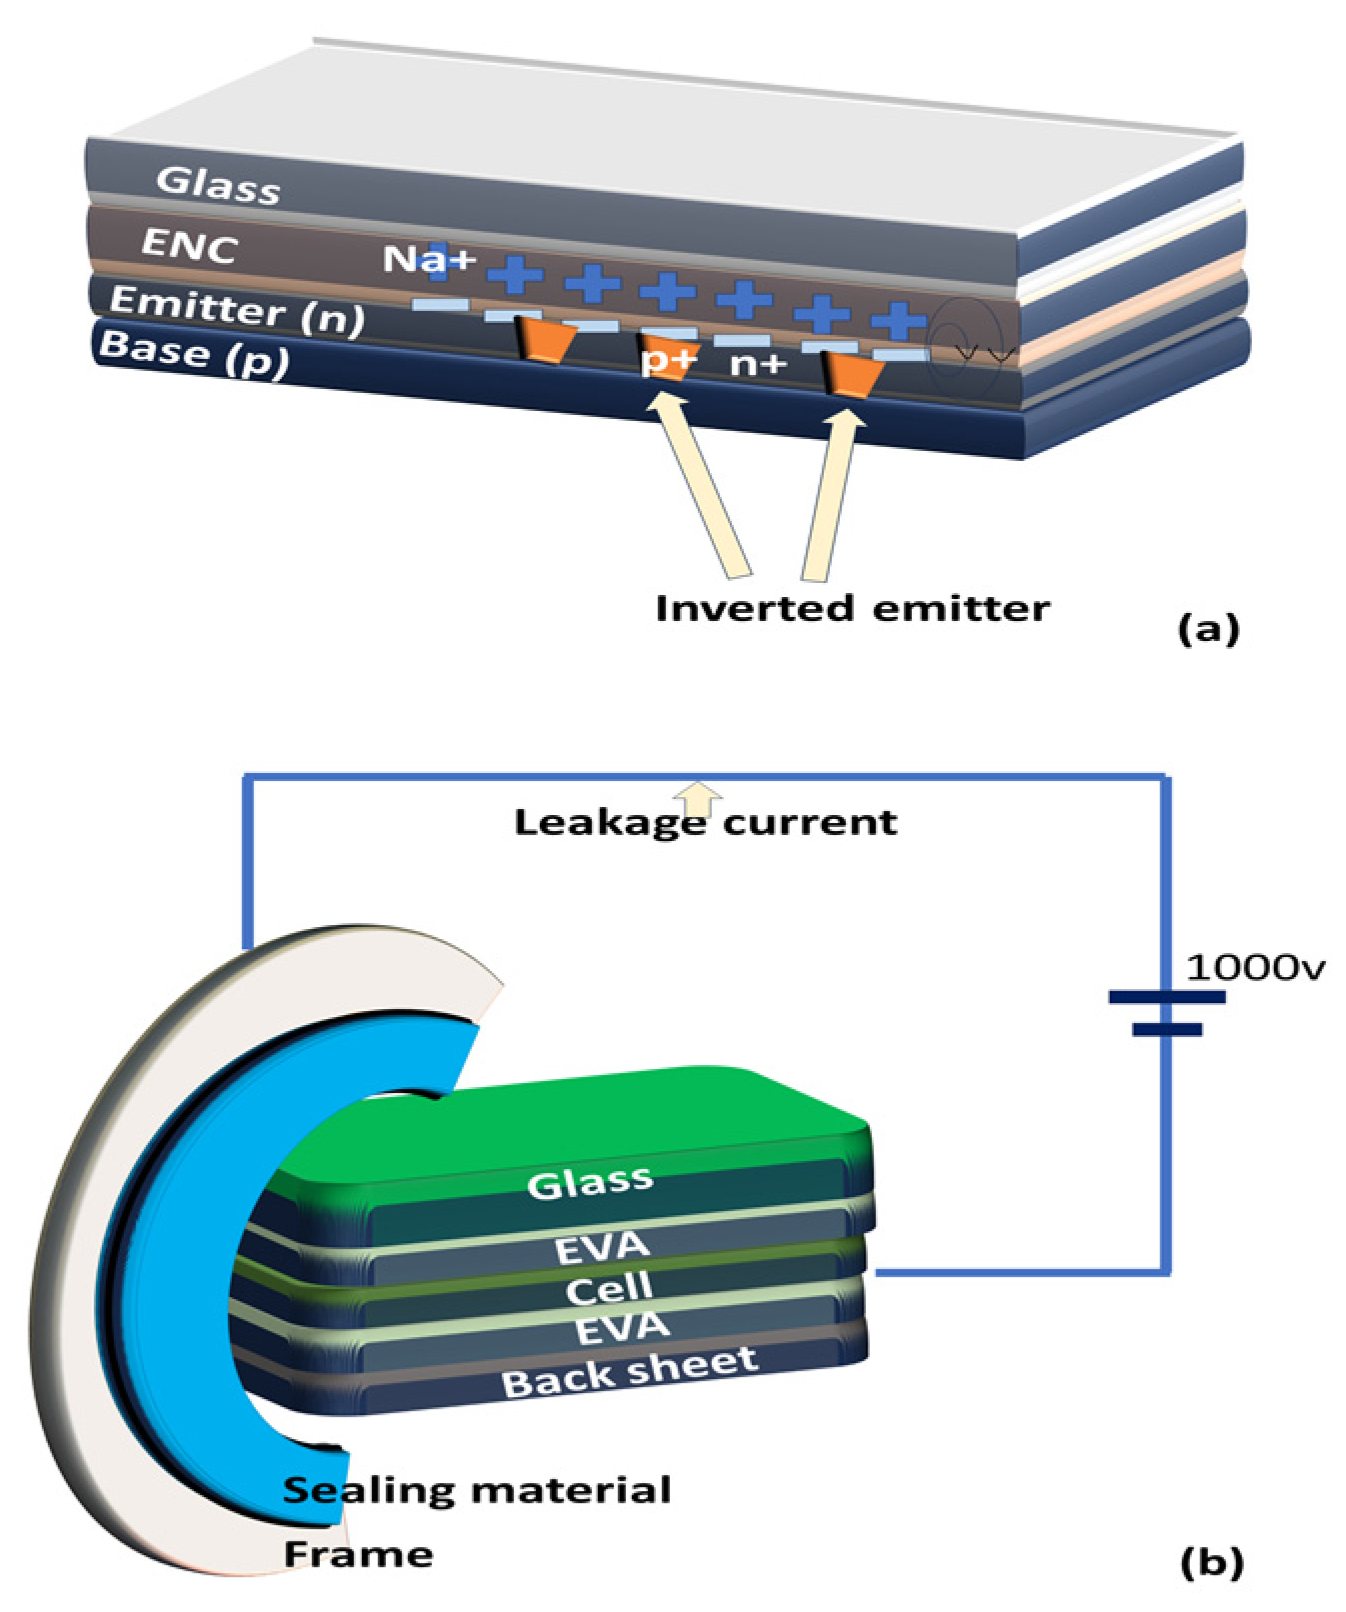
The induction-induced decrease in PID electric potential refers to solar module panels composed of solar cells. These panels utilize series and parallel connections on the module board to generate electrical power when exposed to outdoor sunlight. Once the module board generates power outdoors, the sequential connection of multiple solar module panels, leads to an increase in system voltage. This, in turn, causes a spontaneous decline in power induction when the solar module board is exposed to higher terminal voltage. This situation is called the PID phenomenon [3,14]. Figure 1 shows the schematic diagram for the PID effect, which causes a leaked current to make and block the parallel resistance decline. In detail, two images labelled Figure 1a,b are described as follows: (1) Several manufacturing steps, as well as the inherent material quality of solar cells, have been identified as contributing significantly to the degree of PID susceptibility in solar cells. Ion migration is also a mechanism related to PID in photovoltaic modules. Under certain conditions, particularly when subjected to high pressures and temperatures, the migration of ions through the front glass and encapsulant of traditional crystalline silicon PV modules can cause PID, as shown in Figure 1a. (2) Sodium ions naturally exist in the structural glass materials of photovoltaic modules. Under normal operating conditions, these ions remain relatively stationary. However, when the module is exposed to elevated voltage, Na+ ions may drift through the module structure due to the presence of an electric field. The high-temperature conditions often encountered in photovoltaic systems can accelerate this drift. Leakage current can flow from the module frame to the solar cell along several different paths, as shown in Figure 1b. In addition, solar module panels affected by the PID phenomenon can be imaged by Electroluminescence (EL) [24], and can be distinguished from the phenomena of decline. The main reason for the occurrence of the PID phenomenon [25] is that the solar cell after evoking the potential, due to the situation of polar dispersion caused by the leakage of the current after the accumulation of ions, so that the battery is influenced by the evoked current impact, causes damage. The PID decline is a significant phenomenon associated with a decrease in rated power [4]. According to Schütze et al.’s study [4], when a solar panel experiences the PID phenomenon, both the short-circuit current (Isc), represented on the Y-axis, and the open-circuit voltage (Voc), represented on the X-axis, decrease with the maximum power point (MPP) of the modules. This reduction is also influenced by a potential induction decay within the module panel. Moreover, it is worth noting that for crystalline silicon solar modules, approximately 10 square meters are required for each 1 kW installation. If 10 kW is installed, the required space is approximately 100 square meters. According to a survey conducted by the International Energy Agency (IEA), 46% of global terminal electricity consumption is used for motor equipment. In this context, the Integrated Motor & Drive (IMD) can improve operating efficiency and energy-saving benefits; in this context, the use of solar power and the design of drive and control systems becomes crucial. High-efficiency motors must comply with a power range from 0.37 kW to 200 kW, motor voltage < 600 V ± 10%, and a 60 Hz frequency. IE5 is currently the highest level of motor energy efficiency.

Figure 1.
A schematic diagram for the PID effect of causing the leaked current to make the downward parallel resistance. (a) Formation of reverse charge in solar cell and (b) leakage current simulation circuit of solar cell module.
Importantly, from the research results of Schütze et al. [4], it is established that the PID phenomenon leads to a decline in the maximum power output of solar module panels, thereby reducing the power generation efficiency of the module board. Therefore, it is absolutely necessary to carry out testing on the PID problem on solar modules. However, the costs of labor and material resources are too large when testing with large-module boards. Given this constraint, a general testing method is recommended by replacing large modules with mini-module panels. This practical approach can reduce the costs of testing time, but it necessitates an increase in the number of samples. Moreover, insights from Wang et al.’s study [26] indicate that a small module (e.g., mini module) is composed of important materials commonly found in solar cell packaging. These materials mainly include glass, packaging material for EVA, solar cells, and a waterproof backsheet.
2.2. Different Testing Methods and Prevention Applications
Accordingly, following the end of Section 1.2, which focuses on green and clean energy sources, reliability becomes a key priority alongside increasing its power generation efficiency. With an increasing demand for solar energy alternatives, recent years have seen an increasing emphasis on attaining both high conversion rates and high stability in these energy sources. Therefore, the reliability testing of solar modules [27] has become an integral part of how to produce dependable batteries for solar module use, as well as pursuing a minimum 25-year lifespan through reliability testing [28,29]. The reliability testing regulations for solar panels are constantly updated, mainly limited by the test regulations in IEC61215 and specified by IEC62804, which was issued in 2015 for the PID test. These regulations aim to ensure that solar panels provide the benefits of stable power generation.
An effective verification method for PID testing is a meaningful concern for promoting the manufacturing process of solar power. There are four types of testing verifications, which can be used for identifying the PID problem.
- (1)
- Large-module testing the most time- and cost-consumption: As mentioned earlier, most studies addressing the PID phenomenon have focused on packaging solar panels into large modules [30] for further study, although packaging in solar module panels requires coordinating with automatic and semi-automatic machines from the packaging factory; it generally consumes a lot of materials and production costs, including module glass, copper band (ribbon), EVA, waterproof backbone, solar cell panels, and module aluminum frames for packaging testing.
- (2)
- Mini-module testing with higher costs: In line with current conservation efforts in solar cell factories, PID verification is carried out by saving on material size of the module packaging. This involves downscaling from a large-module board to a single-piece module (i.e., mini module) plate [26] for testing in general factories; although it undoubtedly saves on cost, the tested mini-module board gets discarded without reuse, which is still a cost burden. This real case exposes practical shortcomings of costs in the solar energy industry. In addition, due to the artificial welding, material cutting, and component assembly that mini modules require, it is easy to cause testing measurement errors because of labor operation omissions. Furthermore, the most widely adopted PID test method in practice is the use of mini-module boards, which control the temperature of the test sample at 60 °C, the relative humidity at 85%, and the test time at 96 h, to comply with the IEC62804 standard test regulation [31].
- (3)
- Solar cell testing with reduced time and cost consumption: Since there is a lack with its the extended testing time and the mass production from solar cell manufacturing line pose a challenge for quickly identifying the quality of the batteries currently produced in regard to their resistance to the PID problem. Thus, the development of a good simulation test should be carried out directly at the solar cell production end, and the use of an effective PID test for solar cell [25] is relatively important in order to meet the requirements of the industry.
- (4)
- A valuable model with minimal time and cost consumption: In a review of previous studies [4,14], they mainly focused on the differences of high-power point endured by the solar module ends to induce the battery decay phenomenon. To achieve this, a power supply of −1000 volts was used to simulate a series of high-power points for the differences carried out by practical data collection from solar power factories. The interconnected resistance was measured alongside the results in order to conduct the analysis of PID using industry data analysis [18]. Testing with this method, such as a settling time approach and a mathematical NN method, in data applications yields rich insights for a visually oriented effective analysis. This not only can save on cost of the testing, but also can get the testing results faster.
3. Materials and Methods
To minimize the costs of PID testing time, this study effectively proposes a hybrid procedure to organize four mathematical approaches. Thus, this section describes four testing comparisons for the proposed hybrid models on the PID issue, including the mini-module testing, solar cell testing, a settling time, and a mathematical neural network, for identifying PID problem into the following four subsections, respectively.
3.1. Mini-Module Testing
In this subsection, testing mini modules focuses on comparisons between large modules under the problem of PID, in order to verify whether there is positive correlation between mini modules and large modules.
PID susceptibility is tested with IEC62804 standard conditions (i.e., 60 °C, 85% relative humidity, negative bias 1000 V, and 96 h test time), and solar cells with three different RI values are prepared for comparison operation [31,32]. To make the experimental design closer to the general solar cell company’s solar cell design, the selected RI values of the three groups are 2.00, 2.10, and 2.16, respectively. In general, the higher the RI value indicates the denser the anti-reflection layer, the less likely it is to produce the PID phenomenon. Each group takes several large modules and mini modules for highlighting the results of comparison testing. To avoid interference with experimental results in the testing due to material factors, the mini modules use the same packaging material as the panel of large modules. In accordance with the specifications of IEC 62804, if the power measured during the PID testing exceeds 5% compared to the initial value, the module is deemed to have failed the PID test. Importantly, for the part of the mini modules, we add an EL image to observe and measure whether there is the situation of PID failure case. The following mathematical formations are defined as the process for comparison.
- (1)
- Suppose that the number of large-module tests is , while the percentage of the large module in the pass of PID test is called and the percentage of the large module in the failure of PID test is called That is, . Similarly, the number of mini-module tests is , while the percentage of mini modules in the passed PID test is called , and the percentage of the mini modules in the failure of PID test is called Then, .
- (2)
- When or , it is identified that the testing result of large module and mini module exhibits a positive correlation.
- (3)
- In the comparison result, if the large module has a positive correlation with the mini-module, the mini-module testing results can be used to analyze, thereby reducing the testing cost of time.
Based on the above process for the mini-module testing approach, the testing result can be identified; thus, the cost of verification time for a positive correlation can be greatly reduced.
3.2. Solar Cell Testing
Afterwards, in the PID testing, due to the testing results distortion caused by personal error in manual welding and packaging, use of a mini module can offer the benefit of cheaper testing costs and more sample data than a large module. Therefore, in order to reduce the potential manual error (usually due to abnormal welding or material contamination), it is important that the solar cell is accordingly used for PID testing in this experiment to determine whether the testing results of the solar cell and the mini module are positively correlated. In the experimental method of setting, experimental comparison tests will be carried out using the solar panels produced in the same batch as in the previous subsection. In this study, we use the PID-simulation tester in order to test the comparison results [18]. When PID phenomenon occurs in solar cells, the parallel resistance shows a decreasing state. If we continuously observe and record the data related to PID testing, it is shown and known that parallel resistance tends to decrease with time. For the solar cell testing approach, we have the following four processes to address it:
- (1)
- First, when the parallel resistance is less than 100 ohms, it is determined to be a PID failure case.
- (2)
- Accordingly, this experiment uses the approach of several solar cells for PID testing [25], and the PID testing cells with each group of different RI values are divided into two groups: Group1 and Group2. In order to achieve the experimental target, we increase the number of sample tests for a single PID testing, and each set of testing samples for the different RI values are the numbers that Group1 and Group2 take slices continuously at different production time points. To improve testing accuracy, we take the same number of cells that the testing is performed on, in order to create the same conditions for a second test. In other words, in each group of RIs, single PID testing is divided into two groups, or Group1 and Group2. Doubling the test number ensures that the experimental planning aligns with the current situation, and data from Group1 and Group2 are continuously obtained at different production times for the two sets of data.
- (3)
- The number of solar cells in PID testing is called , and the percentage of the pass case of PID testing is called ; similarly, the number of mini-module tests is also called , and the percentage of mini modules in the pass of the PID testing is called . When , it is known as that the testing result of a solar cell is positively related to the mini-module testing result.
- (4)
- It is assumed that the solar cell and mini module for the PID testing results are positively correlated, and the solar cell can replace mini modules for PID testing, thereby reducing production costs.
3.3. A Settling Time
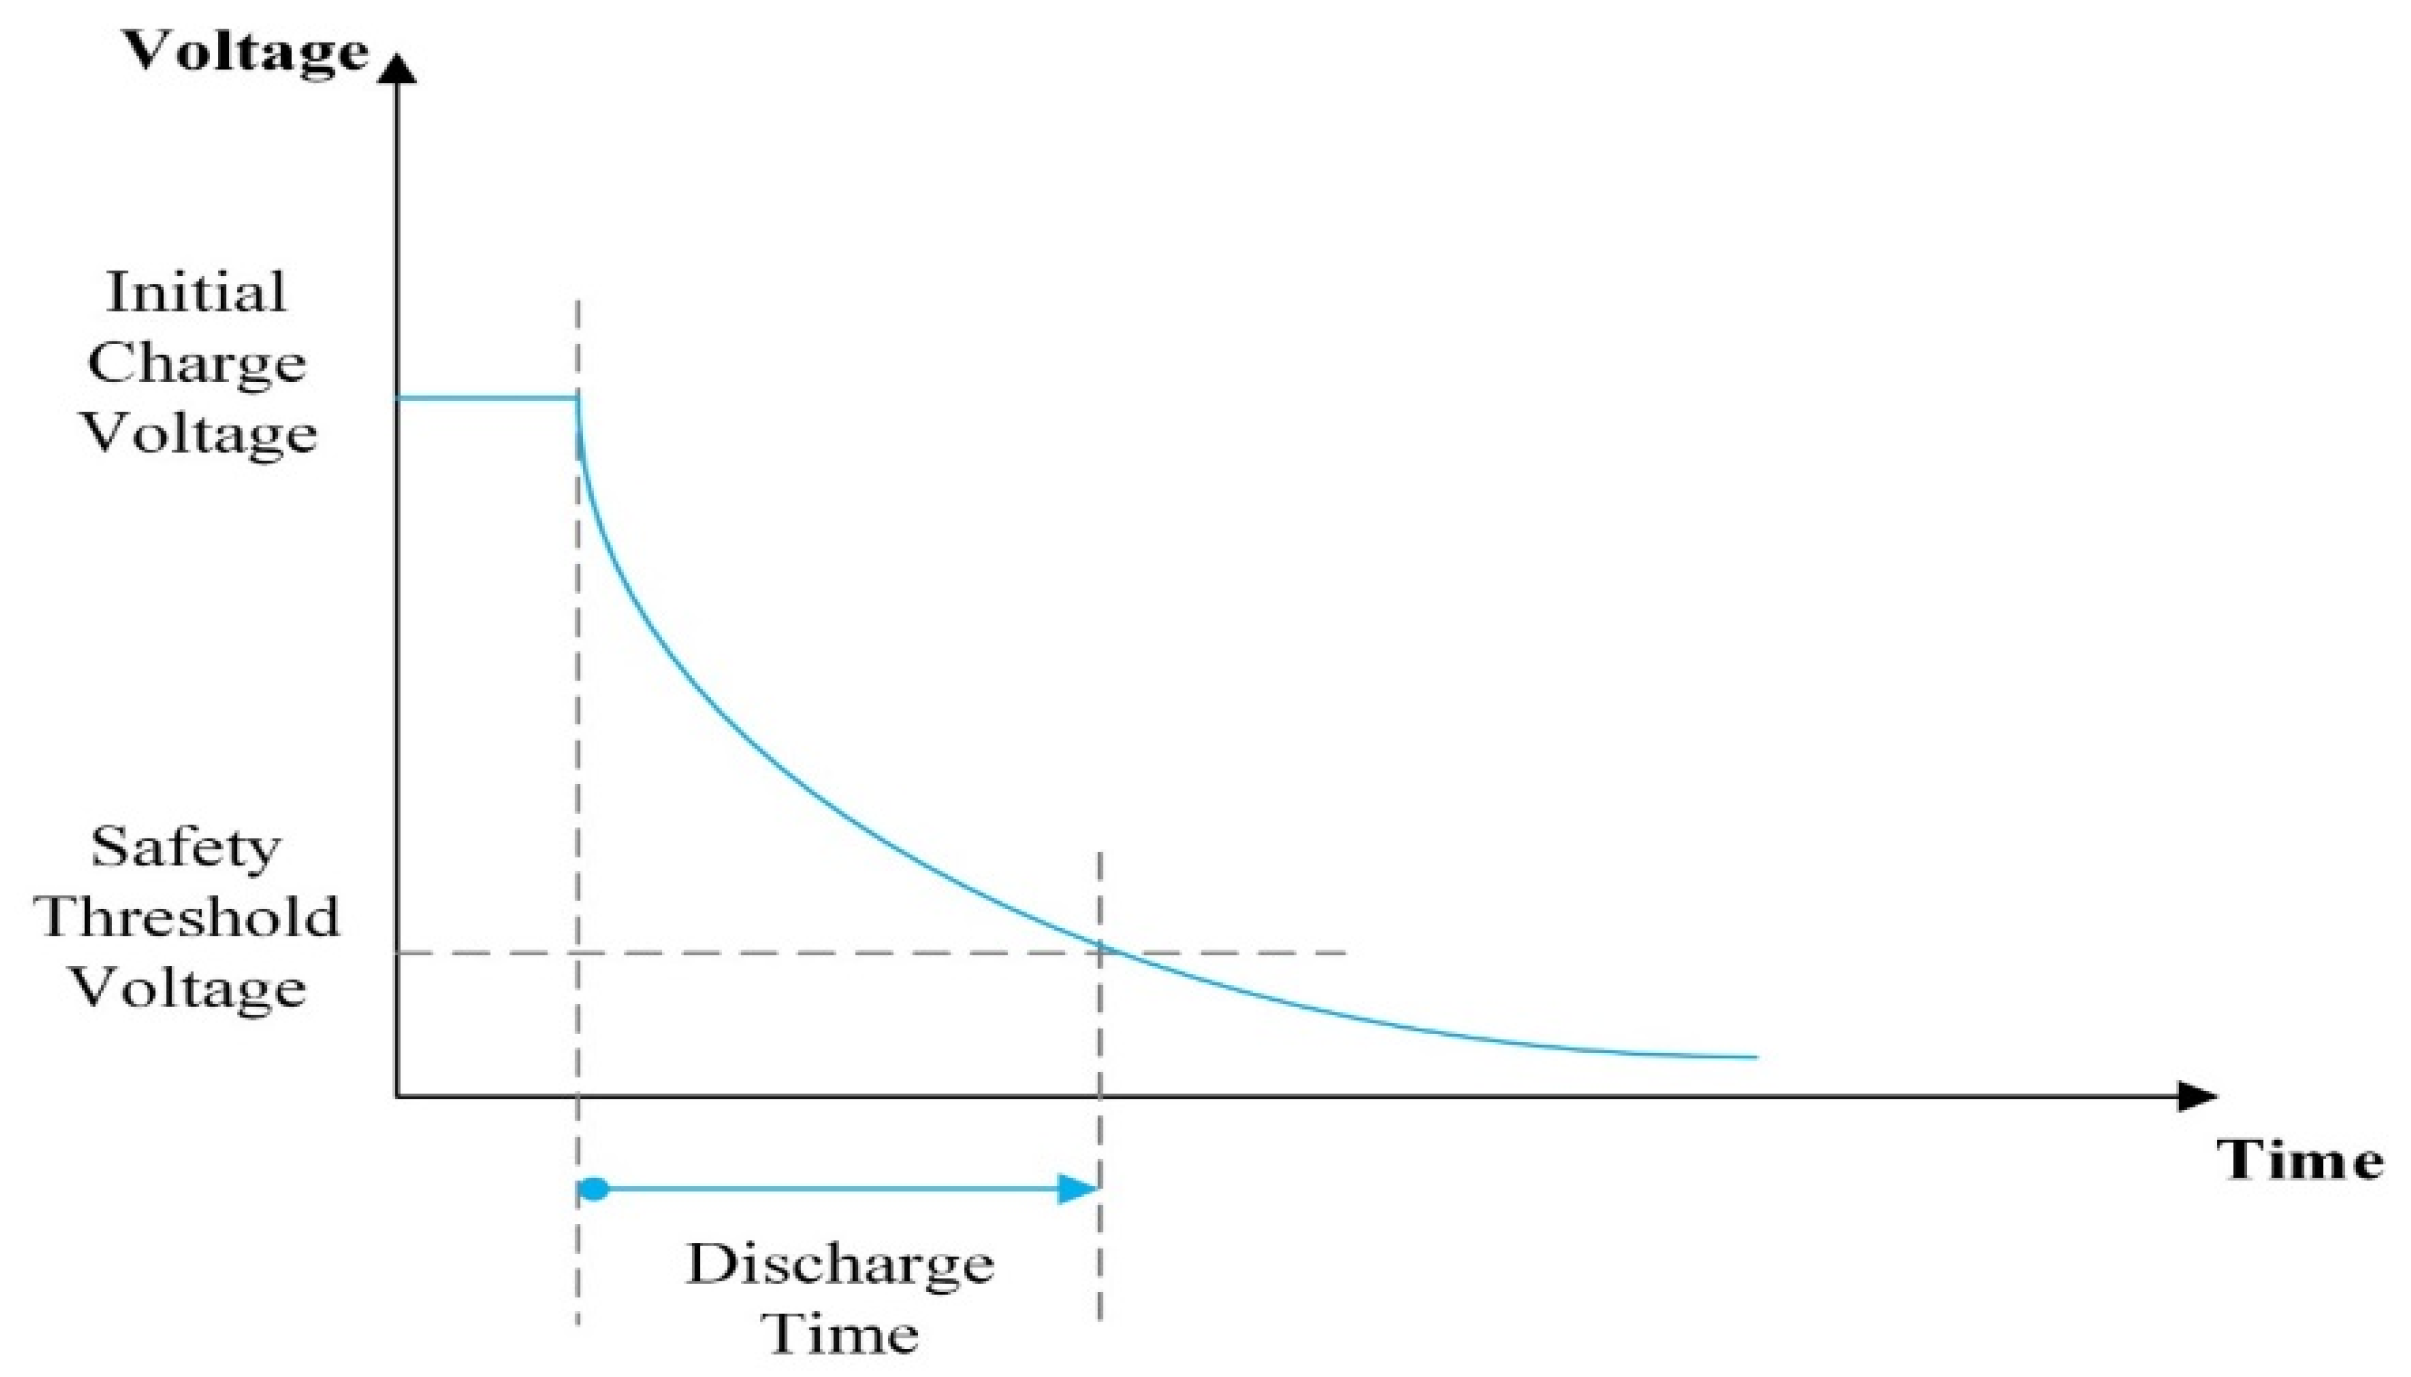
This subsection mainly discusses a simple settling time analysis method for detecting and calculating the average stable time in order to rapidly detect PID phenomena. First, Figure 2 shows a typical test curve of PID failure cases. Since the solar cells’ resistance attenuation decreases with time, the parallel resistance decreases rapidly at the beginning of the testing, and it becomes stable in the late stage. The falling process of parallel resistance is like the discharge process of a capacitor. The discharge process of the resistance capacitance (RC) circuit is shown in Figure 3. That is, the process of a solar cell’s parallel resistance changing with time is like the discharge process in the RC circuit [33]. Thus, when the discharge voltage reaches 95%, it is at the safe threshold voltage. Given the above reason, this study takes the discharge process of the RC circuit as reference and combines the resistance attenuation characteristic of the solar cells. Thus, this study accordingly defines a settling time analysis method for addressing the resistance attenuation of solar cells. Through the settling time analysis method, the solar cells with PID phenomenon can be effectively found [34]. More importantly, this method can shorten the testing time and improve the production efficiency for the factory by appropriately judging the phenomenon of PID problem earlier.
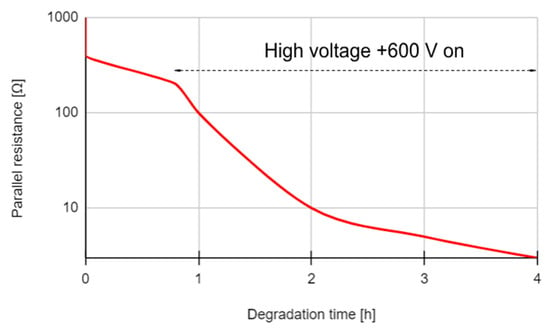
Figure 2.
Diagram of a PID failure case.
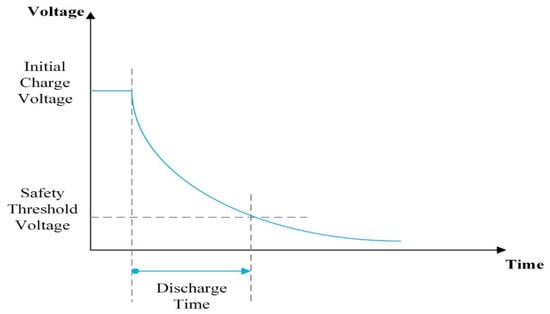
Figure 3.
Discharge process diagram of RC circuit.
According to the decline characteristics of solar panel resistance, if solar panel is good for PID resistance, the parallel resistance will not have a great decline after implementing the PID simulation tester; however, if it has the poorest resistance for PID, it is easy to produce PID phenomenon for a solar cell failure case. The solar cells that have the failure cases of PID phenomena will be in the PID simulation testing stage, and its parallel resistance will change dramatically with the test time; in the final stage, its resistance decline will be down to less than 100 ohms. Thus, in order to find out the settling time point of the solar cell, we employed the gaps of resistance change.
Accordingly, we use the following four key mathematical procedures to illustrate and highlight the importance of settling time model in order to effectively identify the PID test in detail:
- (1)
- First, assume that the measured solar sequential impedance database is defined as , resistance value is defined as and . is a natural number and is a time interval, is defined as sequential resistance data. The sequence database is cut, and the data of is obtained. The training data of solar cells with PID is defined as . The testing data of solar cells mixed with PID and without PID are defined as .
- (2)
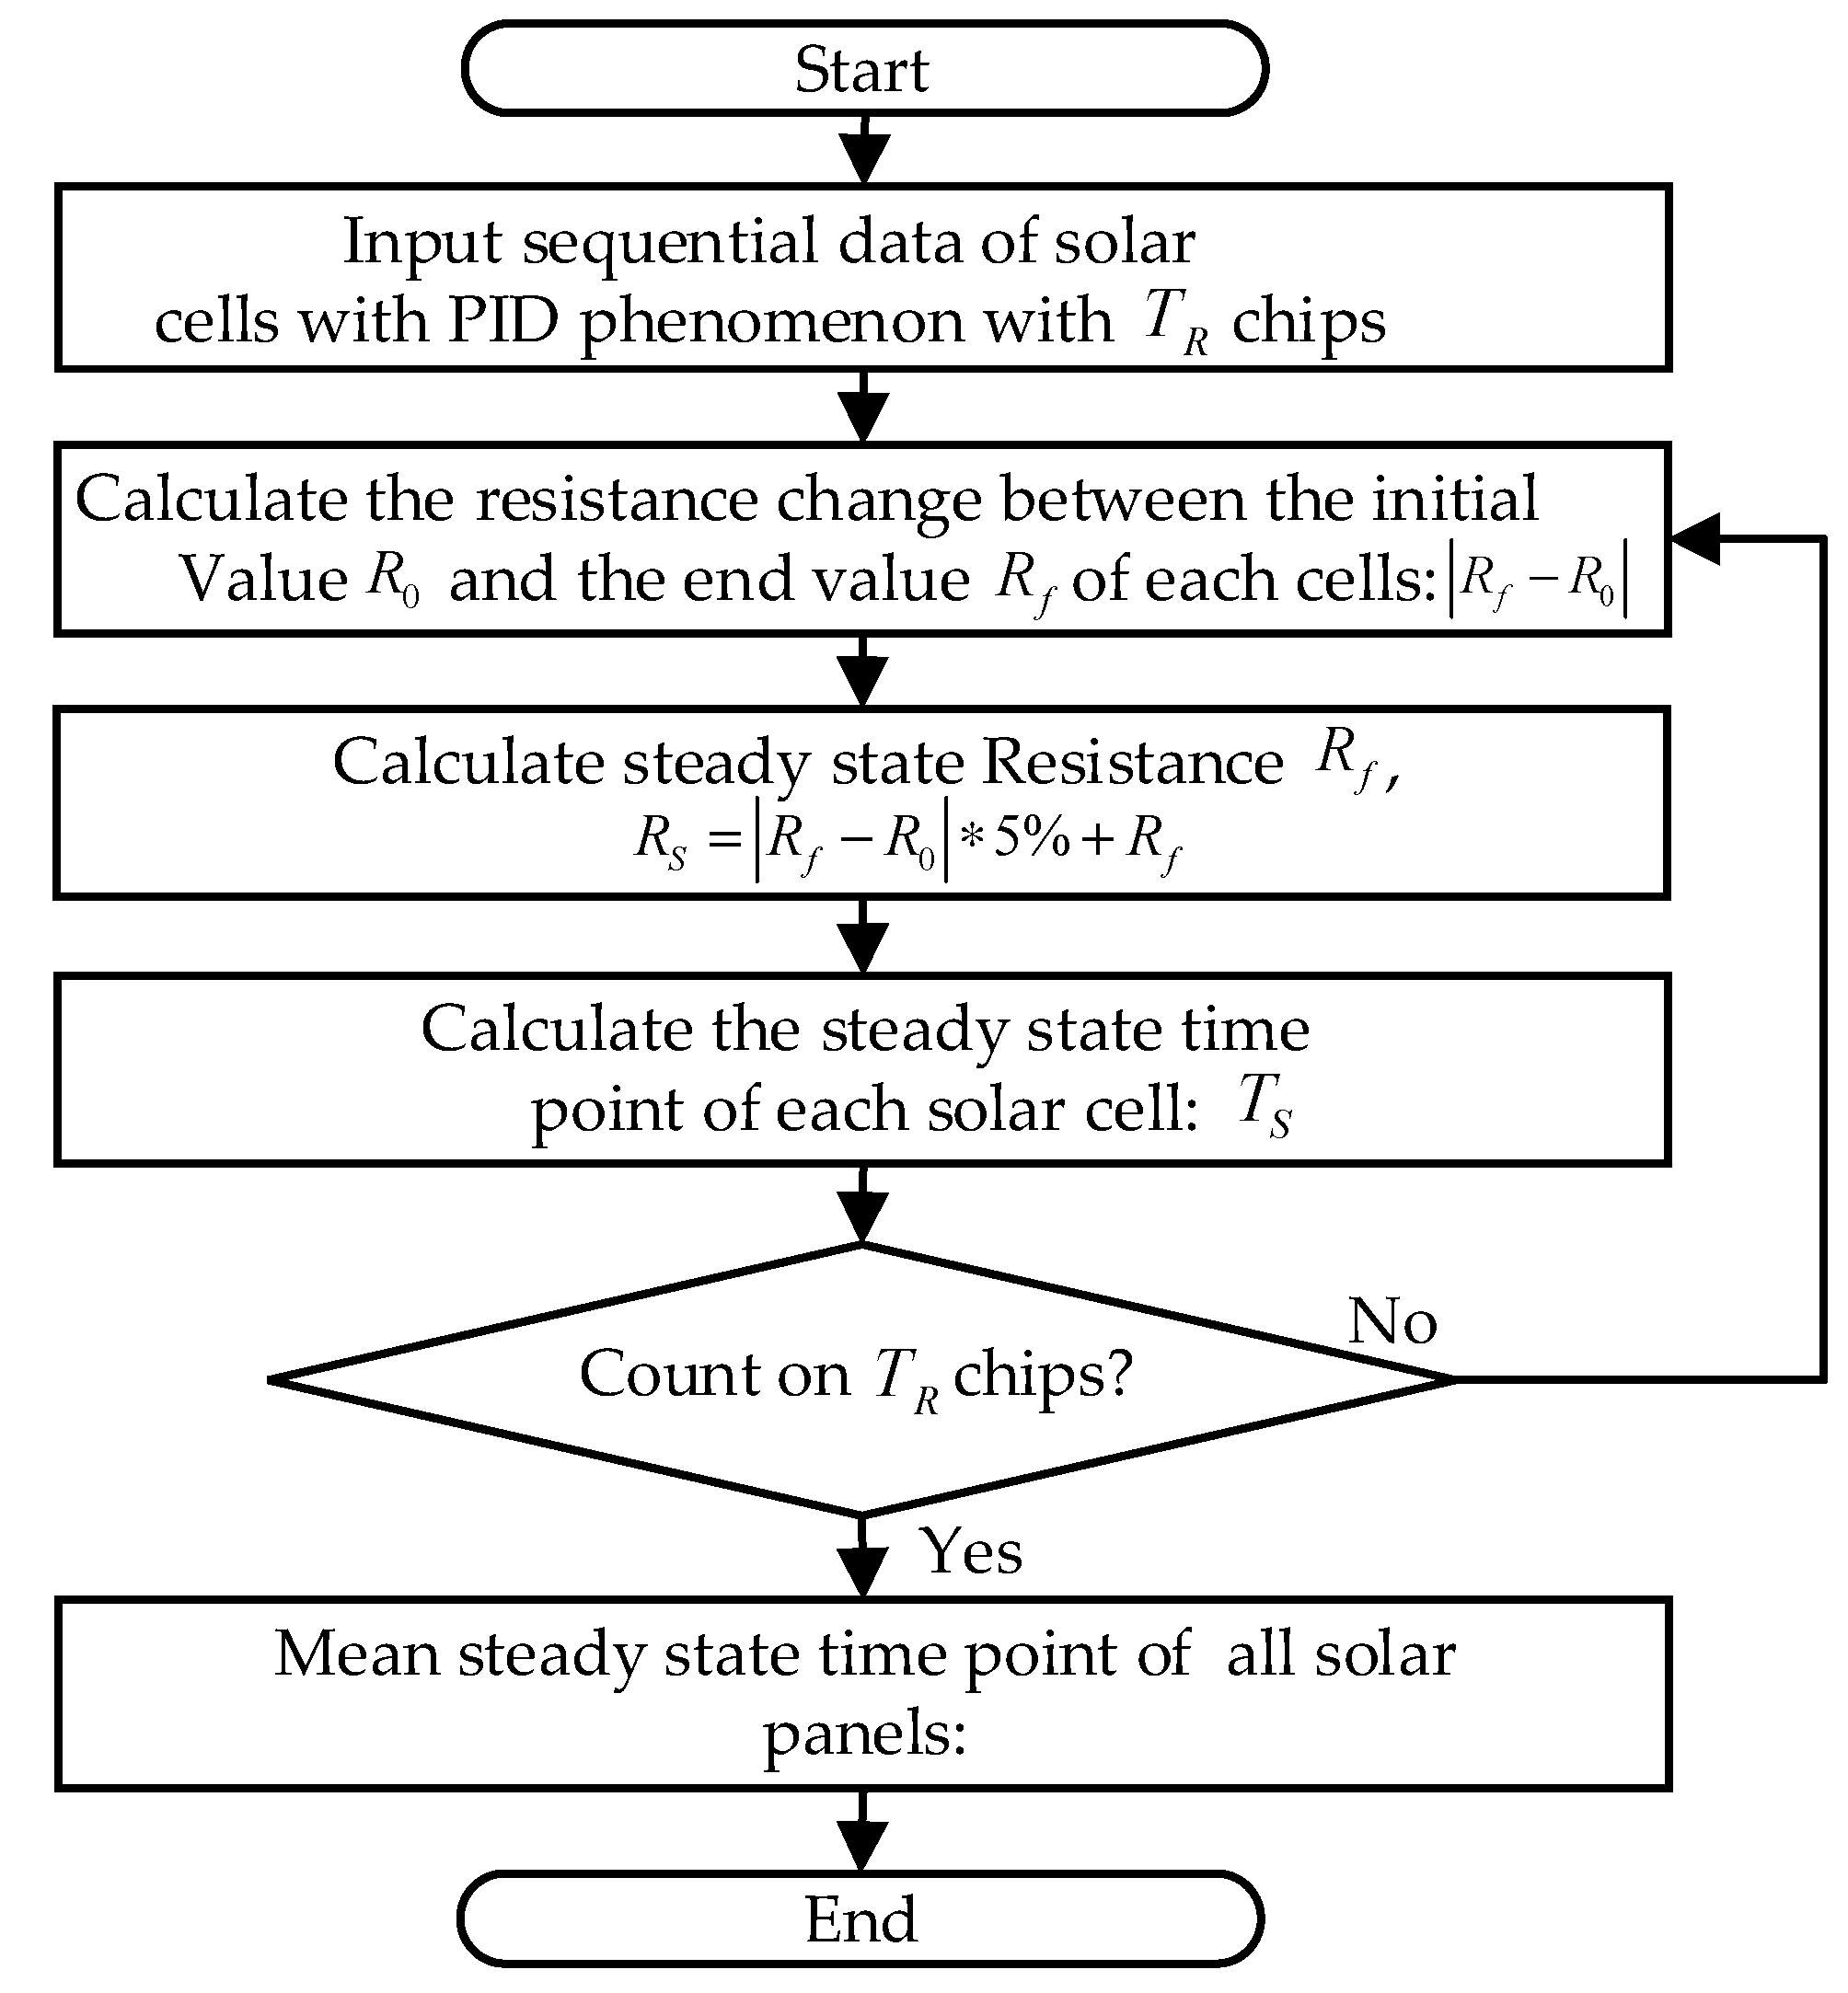
- Second, the starting time point of the parallel resistance measured by the PID simulation tester is defined as ; its initial value is defined as the end detection time point is defined as with a chips, and the final resistance value is defined as . In addition, assuming that is a steady-state time point, the corresponding measurement value is . and are calculated by the testing data of each solar cell. The average steady-state time value of the steady-state time point is defined as . The flow chart for calculating the settling time model is shown in Figure 4, and its training process is described as the following pseudo-codes example.
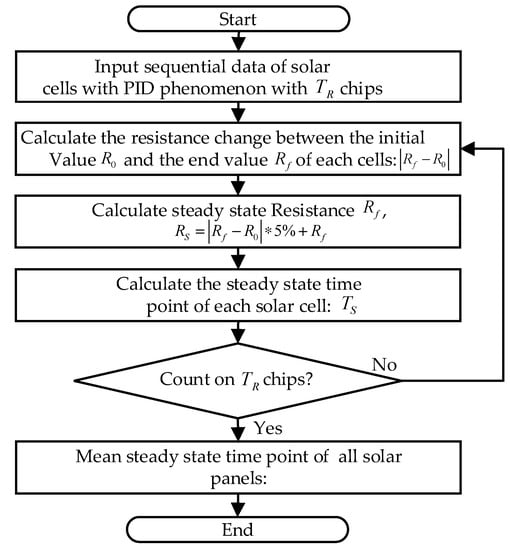 Figure 4. The training flow chart for calculating the settling time model of solar cells.
The training process is formatted with the following pseudo codes for setting the mathematic settling time model into Algorithm 1:
| Algorithm 1: Settling time model |
| 1. Input: Resistance sequence database S 2. Output: Settling time model with PID test 3. Method: 4. = find all seqeunces_PID(S) 5. for each { 6. ; 7. ; 8. ; 9. find from 10. add to ; 11. } 12. ; //Settling time of PID |
- (3)
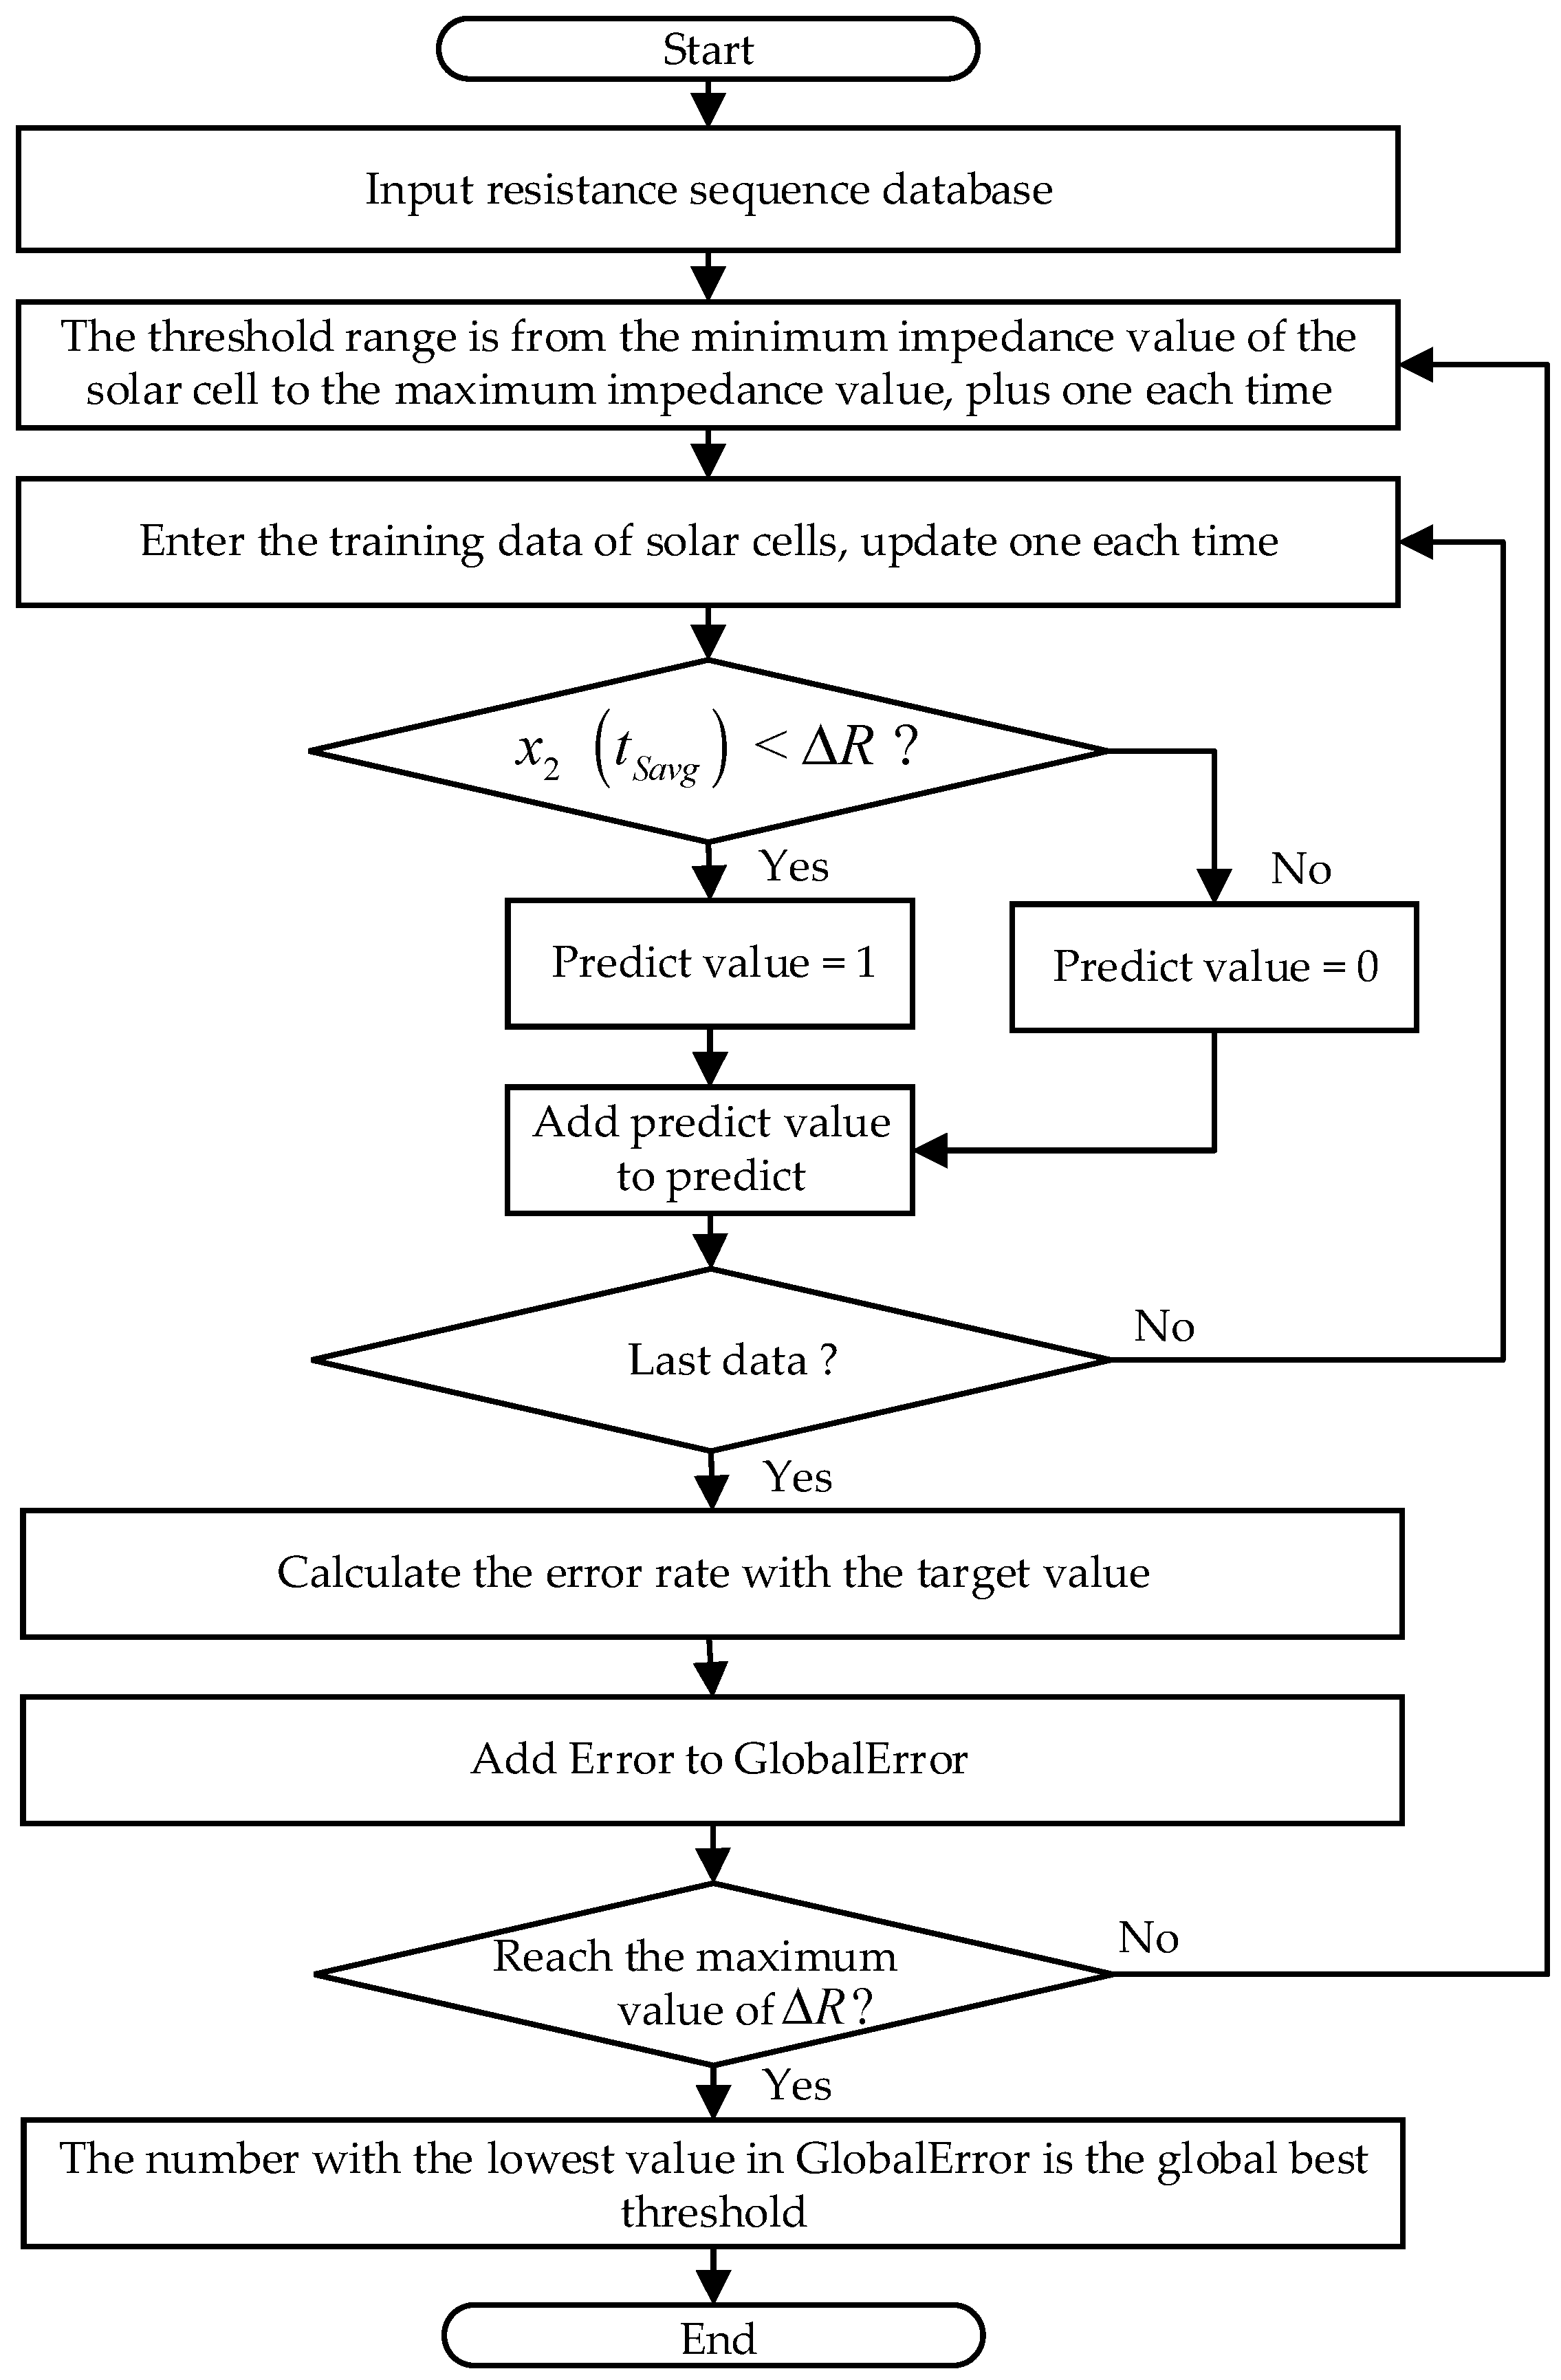
- Third, after receiving the average steady-state time value , it searches all the corresponding resistance values in the testing data and calculates the average resistance value. Then, it can be used to judge the threshold value. The mathematical formula is formatted as follows: , is a rational number. The flow chart for optimizing the steady-state time threshold of solar cells is shown in Figure 5.
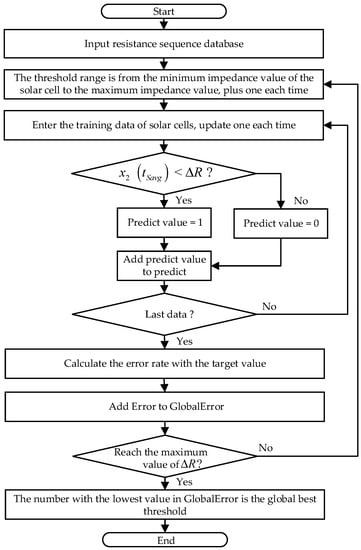 Figure 5. Flow chart for optimizing the steady-state time threshold of solar cells.
To further implement the global optimum threshold function of solar cells into Algorithm 2 in detail, its pseudo codes are formatted and described as follows:
| Algorithm 2: Global optimum threshold function of solar cells |
| 1. , target(S) 2. is a resistance value 3. Method: 4. for each { 5. for each { 6. if (){ 7. predictvalue=PID; 8. 9. predictvalue=NoPID;} 10. add predictvalue to predict; 11 } 12. 13. add Error to GlobalError; 14. } 15. Optimize //global optimize threshold value |
- (4)
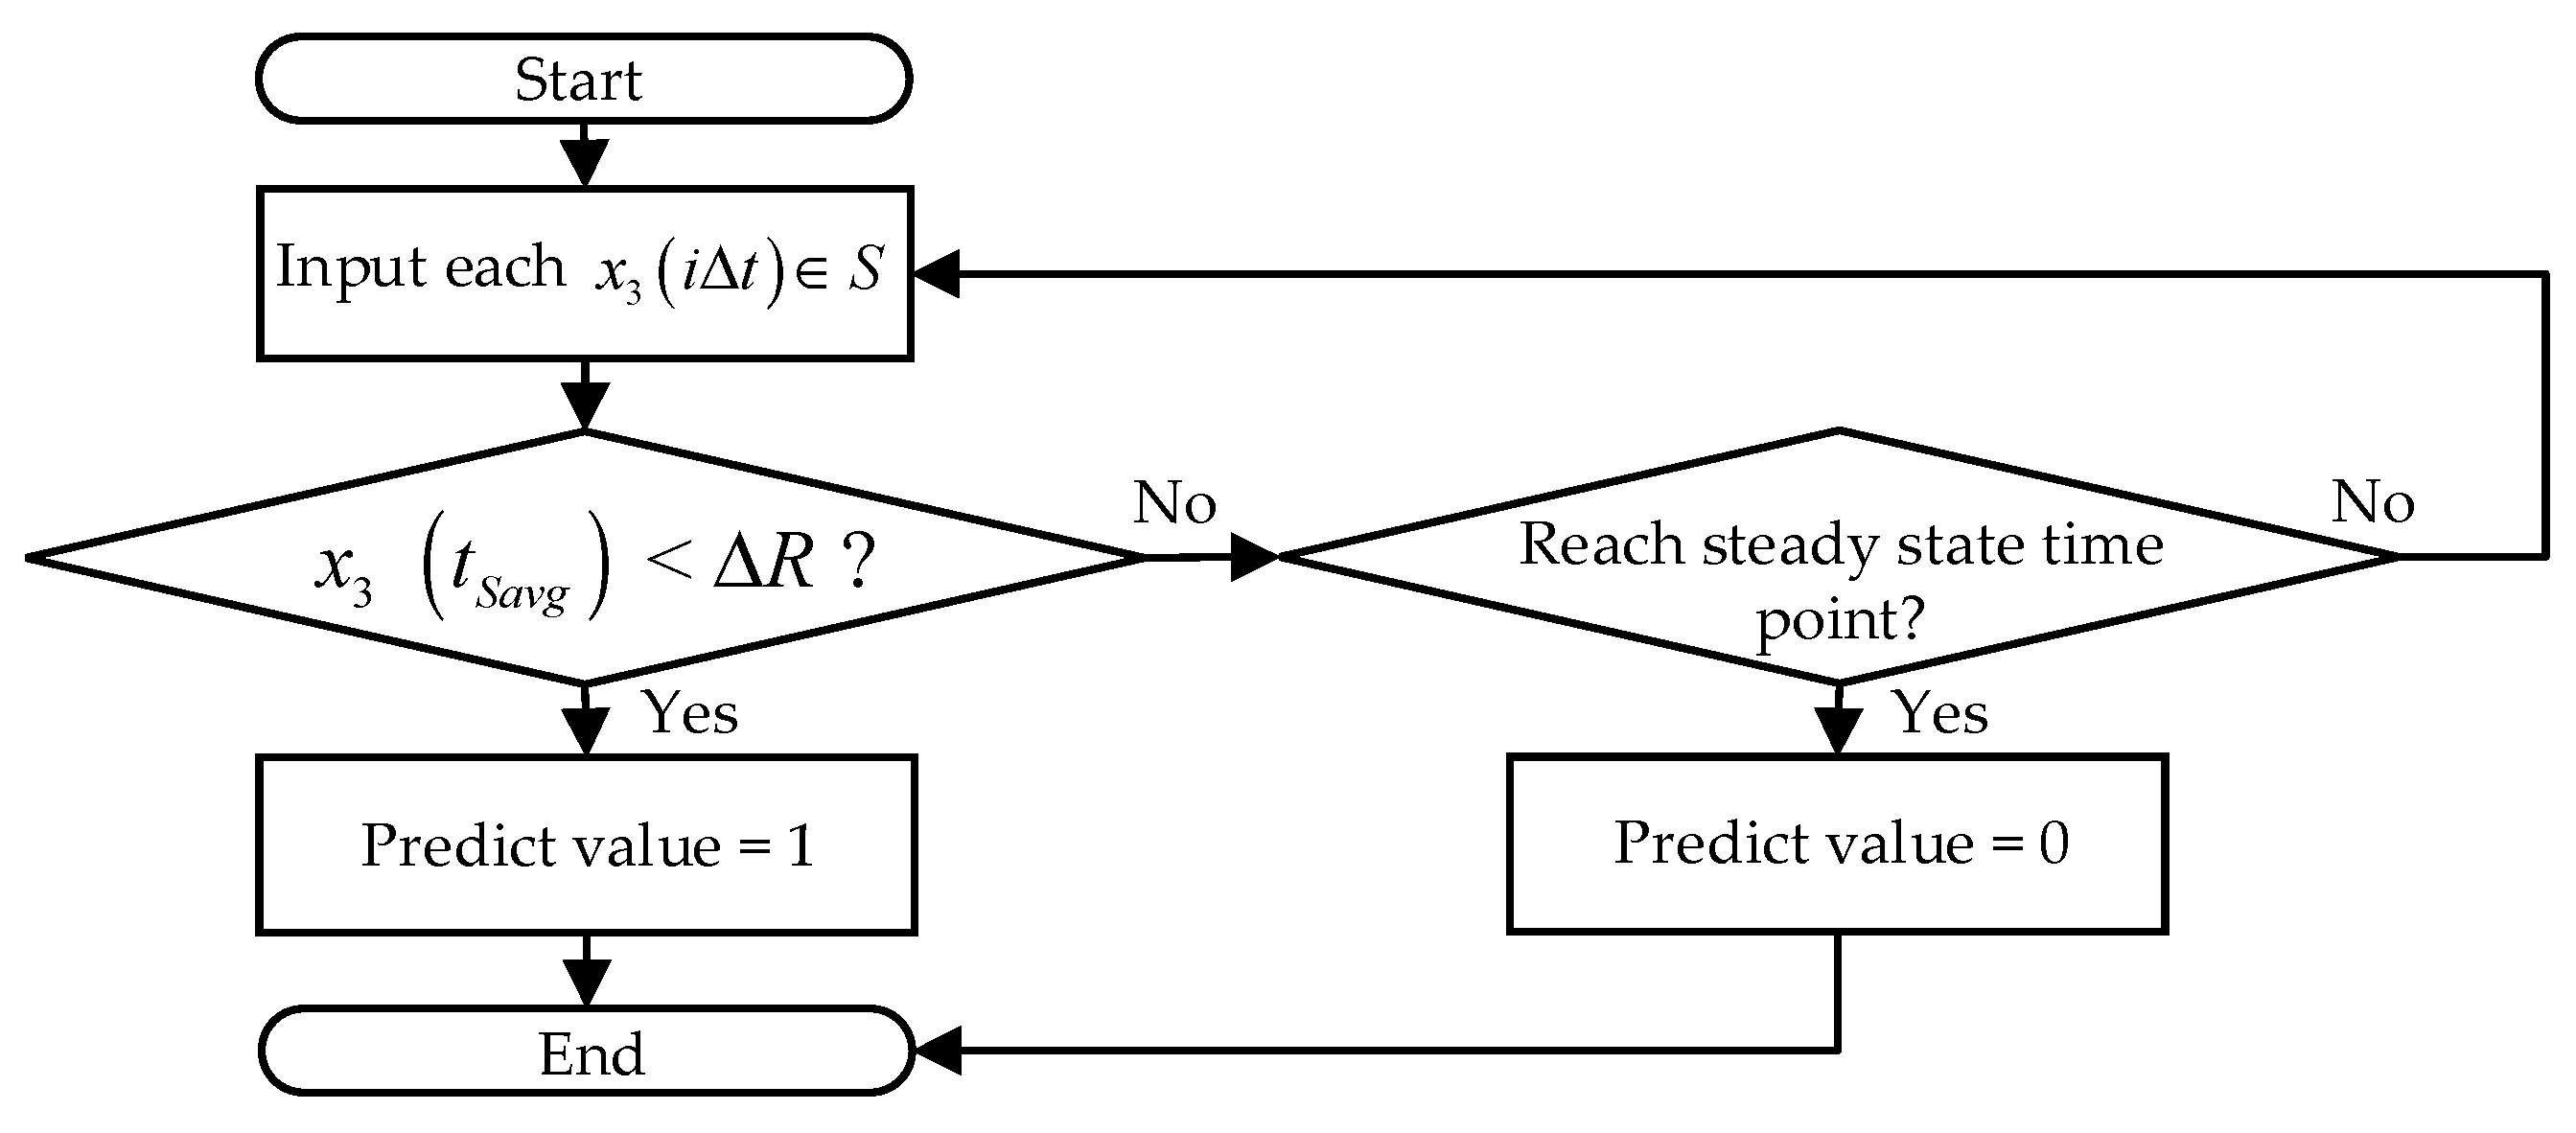
- Finally, the followed experiment uses the testing data. As long as the impedance in the average steady-state time is lower than the threshold of the , it is determined that the test on solar cells has the PID phenomenon. The flow chart for calculating the steady-state test of solar cells is shown in Figure 6 in detail.
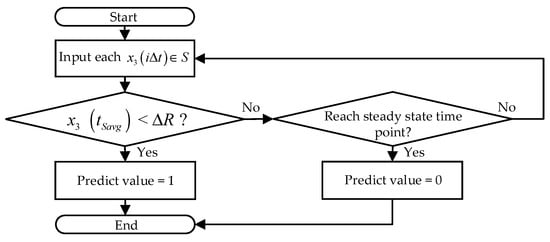 Figure 6. Flow chart for calculating the steady-state test of solar cells.
In the experiment of settling time model, the relationship between time and resistance can be deduced from the variations in impedance. However, the settling time method can only determine the time point after the resistance has changed; it cannot detect the PID phenomenon during the initial resistance change. It is a core gap that the time required to reach the settling time point often exceeds 10 h, which means along wait is needed for the decay of impedance in the measurement of solar cells. That is, the entire process of measuring solar cells is conducted in the latter part of the process, which results in a relatively high test-time cost. Furthermore, the settling time method demonstrates that the resistance variation characteristics of solar panels during testing can be used to identify solar cells with the PID phenomenon. In the above highlight, the purpose of this experiment is to use the settling time model to make full use of identifying the resistance to change characteristics on solar panels of PID attenuation and to detect solar cells with PID phenomenon in a shorter time.
3.4. A Mathematical Neural Network
Since shortening testing time can reduce costs of production and lead to cost savings, the best results can be achieved in considering multiple inputs of mapping processing capabilities for a single output and the ability to counter the error tolerance of input data, such as mathematical artificial neural network (ANN) models. Considering the priority capabilities of multiple inputs to one output and the resilience against input noise, this study thus employs a mathematical ANN approach to appropriately identify the occurrence of the PID phenomenon for solar cells industry.
Before training ANN works, it is necessary that the training example data, the size of the mathematical neural network model, the number of hidden layers, and the neuron in each layer, be determined in advance; however, the input layer and output layer should be determined according to the type of problems. In the setting of neurons in hidden layer, Kwok and Yeung’s network constructive algorithm is used [35]. This method sets the minimum number of hidden layer neurons and increases the neurons until the error reaches the tolerance range. The structure of the neural network is shown in Figure 7. Moreover, for the constructive algorithm [35] on the number of hidden neurons, its setting method is formatted by the following statements: (1) set the minimum number of hidden layer neurons, (2) increase the neurons, (3) train the networks, (4) stop only until the error reaches the tolerable range, (5) otherwise, increase the number of neurons gradually, and (6) determine the number of neurons.
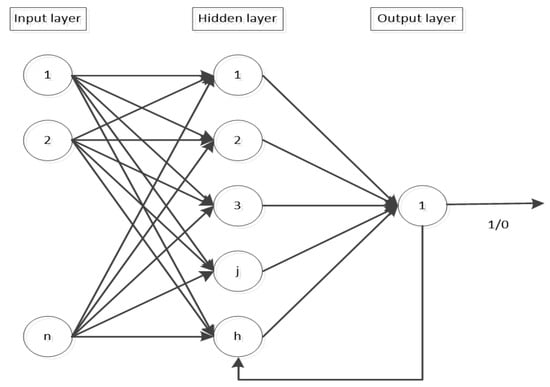
Figure 7.
A diagram of mathematical neural networks structure.
In the learning process of training a neural network algorithm, the neural network parameters are calculated by forward propagation and reverse backward propagation, respectively. The output is obtained by weighting the input items through the activation function . The input value of the calculation neuron is the output value of the previous neuron. The value of the l-th output layer of the neural class can be calculated using the following Equation (1):
In Equation (2), represents the accumulation of output value weights in the l − 1 layer of the network, and represents the weight of the output of the i-th neuron in the l − 1 layer for the input of the j-th neuron in the l layer. The back-transfer process of neural architecture in this article is a supervised learning method. The final output will have a target value d as the purpose of learning to reduce the error between the network input and the target output. The correction process that minimizes the error function E becomes the learning process of the network. The error function E can be expressed by the following equation:
In Equation (4), is the target output value of the neuron at position k, and is the output value of the neuron at position k. In the process of minimizing E, the network will be adjusted by changing the weight value for each training data by the following equations:
In Equation (5), is the adjusted weight, the degree of change is proportional to the weight differential of the error function, and is the learning rate. Finally, through continuous iteration of Equations (5) and (6), the weight values of the neural network can be trained to a robust neural network. In Equation (6), is the of the r-th iteration, and is the of the (r − 1)-th iteration.
In this study, the mathematical neural network is divided into the following three stages: training stage, validation stage, and testing stage. Training data is defined as , validation data is defined as , and testing data is defined as . The data types employed in all three stages are consistent and are composed of independent datasets, aiming to achieve fair and impartial detection purposes. If the training data is 2 or 3 times more than validation data, the experimental results will have a high accuracy [36,37]; if training data is 4 times more than testing data, the results can provide good accuracy [38]. Therefore, the ratio for the training data, validation data, and testing data is set in 4:2:1. Diagram of mathematical neural network data construction is shown in Figure 8. From Figure 8, the training data of this neural network includes datasets A, B, C, D, E, and F, the verification data includes G, H, I, and J, and the final testing data is K. Each piece of data is equal and can be randomly rearranged multiple times for experiments.

Figure 8.
A diagram of neural network data construction.
The ANN model has the properties of modifiable neural connectivity weight, so that when using the method of mathematical neural network calculation, it is possible to produce characteristics like human ability, giving specific data to train, allowing each group of input to have corresponding output. The ANN model has the following three stages with a detailed explanation for the solar power case.
- (1)
- (a) First, in the training stage with the study example, the parallel resistance data obtained from the solar cell through the PID simulation tester is used as input layer for input . For each sampling time in seconds, the number measuring impedance value is defined as , the resistance values from the first to n will be inputted to the nth neurons of input layer.(b) Under the premise of the initial weight value and the partial weight of the given network, the input value is led to the output layer. Each solar panel is given a set of input and output data.(c) Not every training stage can achieve the ideal network weight immediately, and it is necessary that the weight of each connection be constantly adjusted. Therefore, this study uses supervised learning to judge and correct the weight value. Then, we use back propagation neural network (BPNN) [39] to adjust the weight until it can get the result whether there is a PID phenomenon or not.
- (2)
- In the validation stage, part of the data defined as is provided to verify the appropriateness of the parameters and architecture of the training stage. We selected the most suitable neural network architecture as the testing stage of model.
- (3)
- During the testing stage, the trained and validated mathematical neural network is evaluated using the testing data to assess its suitability for real-world industry applications.
The 11 procedure steps of BPNN mathematical algorithms are described as the following: (1) Set the network parameters; (2) adjust the initial network weight and preference values by a random way; (3) gradually calculate the hidden layer and output layer output according to the front feed network; (4) calculate instant error function values; (5) calculate weight correction and preferential value correction; (6) adjust each layer’s weights and preferences values; (7) determine whether there are still training samples; (8) if not, go to verify the Stop principle of the network; if there are still training samples, go back to Step 3; (9) verify whether it is Stop principle; (10) if it does not comply with the Stop principle, go back to Step 3 and continue the calculation; (11) if it complies with the Stop principle, the network stops.
4. Empirical Results of Industry Data Analysis
This section describes a comprehensible experiment result from the four main perspectives (models) of the previous section after implementing a real case data analysis on solar power industry. Narrative discussions of the empirical mathematics results are also found in the following four subsections, respectively.
4.1. Results and Discussions on Mini-Module Testing
In the first subsection, we mainly show comparable results between the large module and the mini module to compare PID testing results based on the IEC62804 standard of testing.
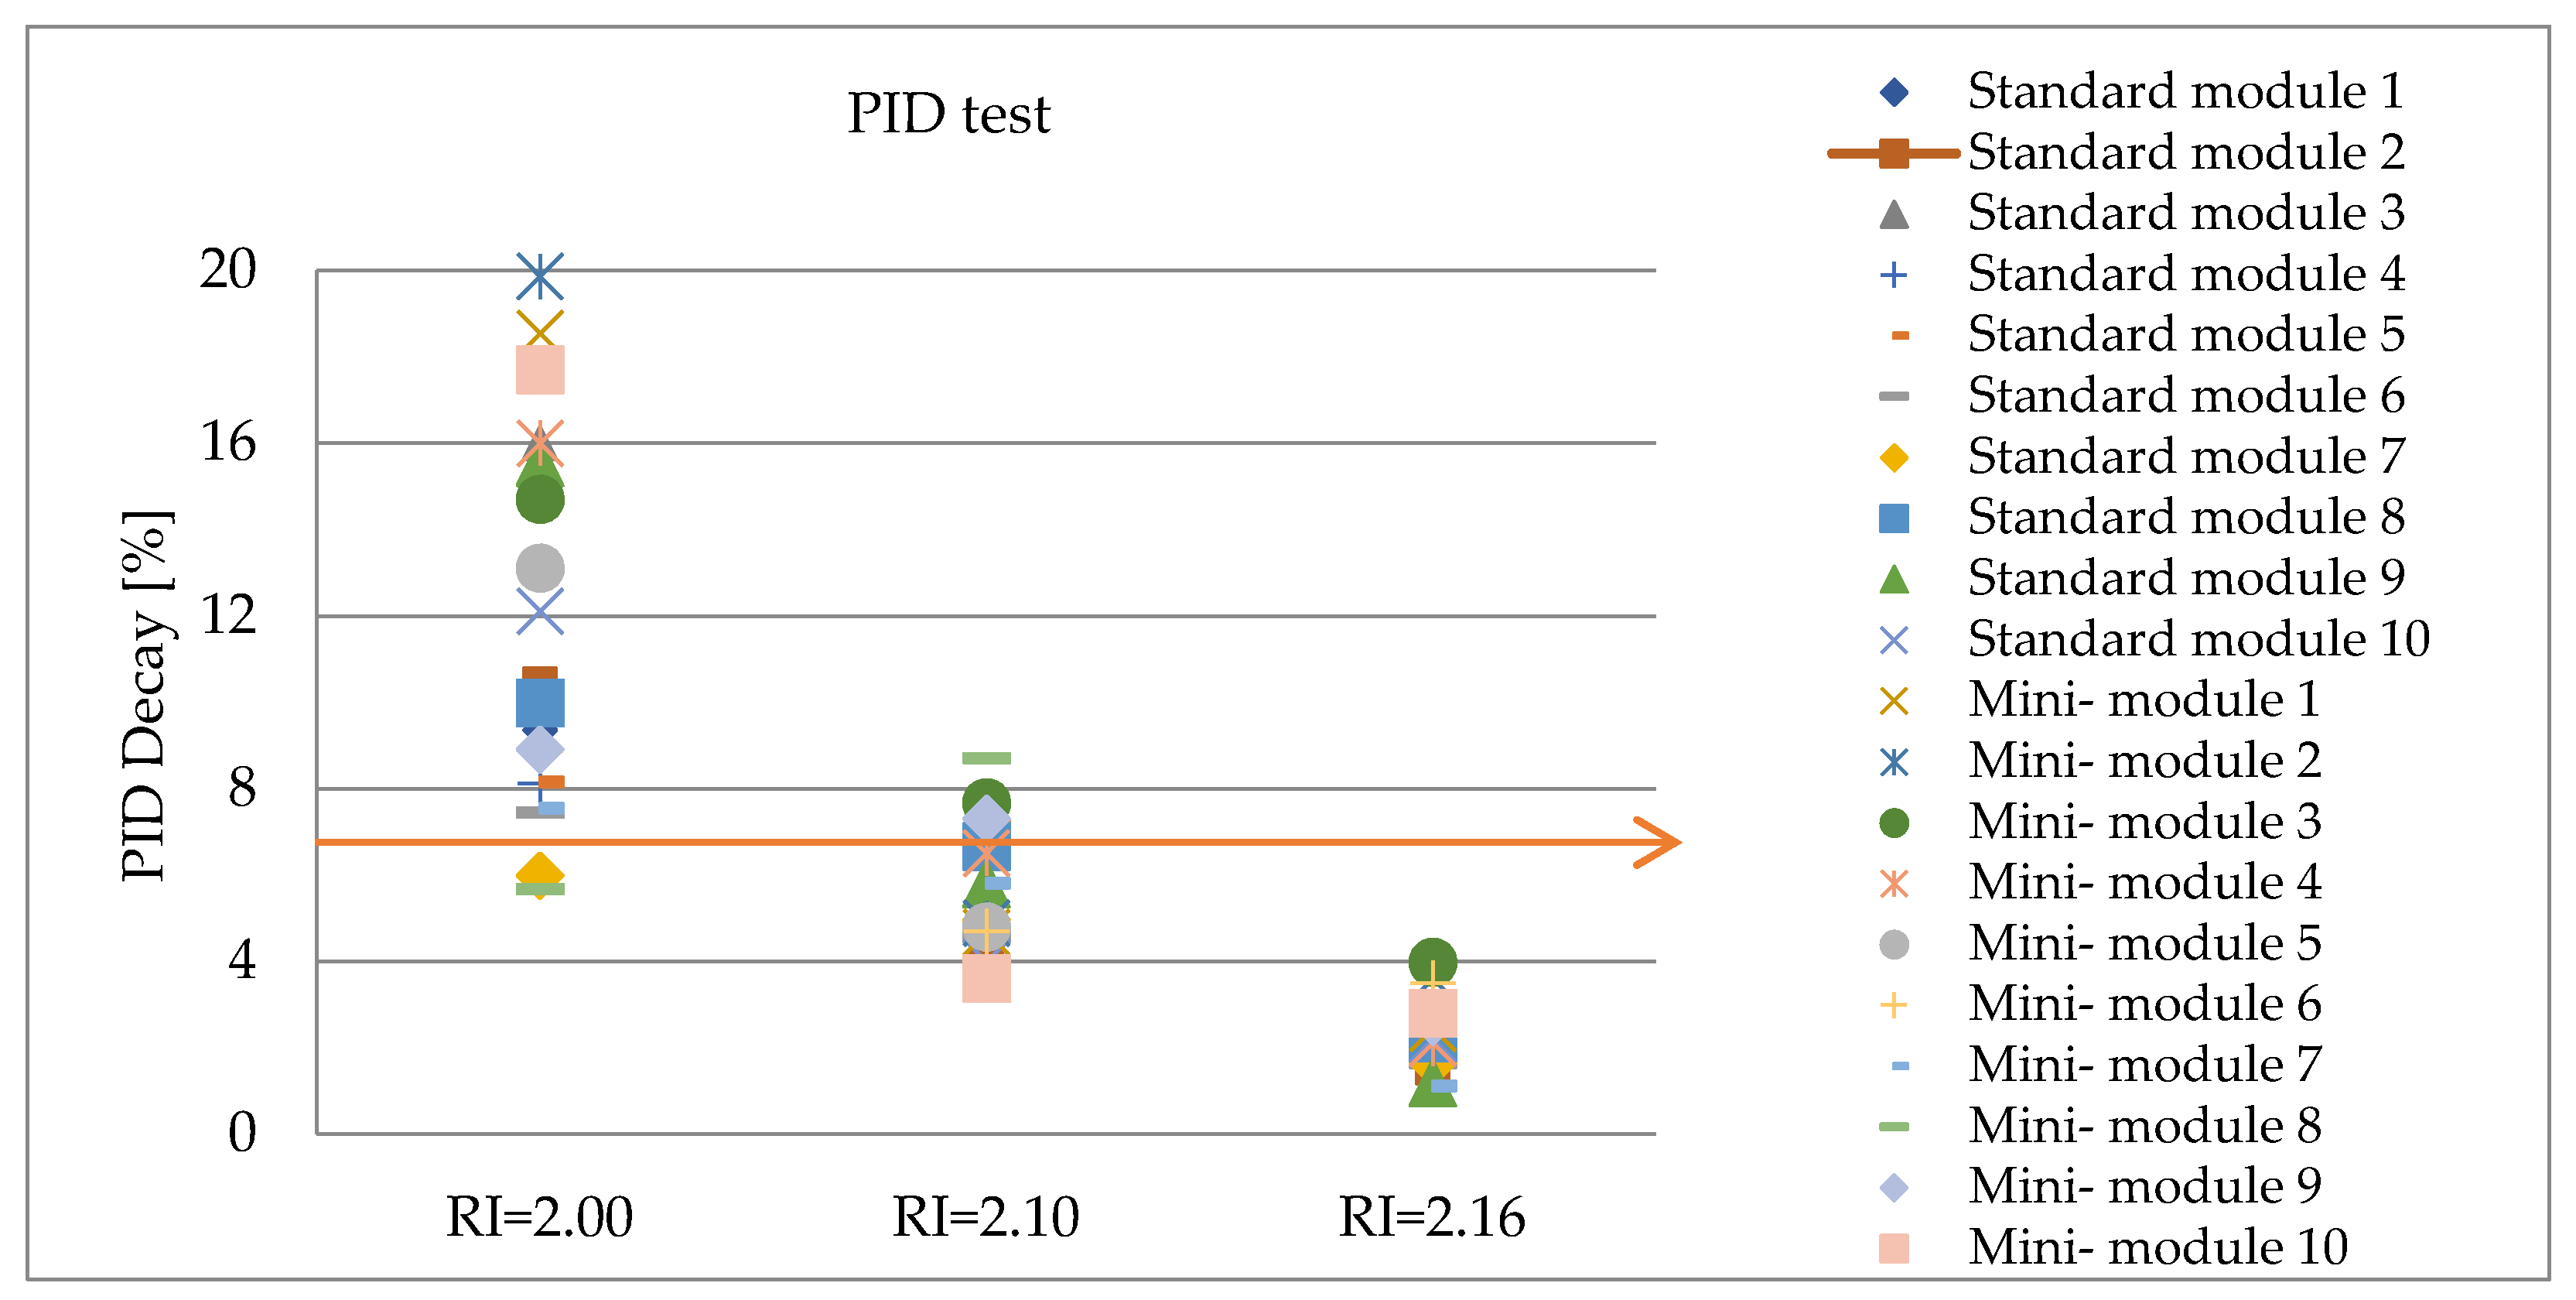
Figure 9 shows the three testing results of different RI values from the difference in the anti-reflective layer in the solar panel for α = β = 10; the anti-reflective layer is a type of optical coating used for reducing reflection. From Figure 9, the Y-axis represents the power decay rate caused by the PID test, the X-axis represents three different RI values, and the red line is the baseline for the test. The point beyond this line represents the module, and its power is decreased by more than 5% because of potential induced attenuation; thus, we can identify and judge that the module is a failure case in the PID test. According to the different RI values of solar cells, 10 large modules (also called standard module) of each group are compared with those of the mini module, and three empirical results are identified. Firstly, it shows that when RI is 2.16, both large modules and mini modules are a PID-pass case. Secondly, when RI is 2.10, five sets of test items is a PID pass case, and the other five groups are a PID failure case. Third, when RI is 2.00, this group is all failure cases in the PID test.
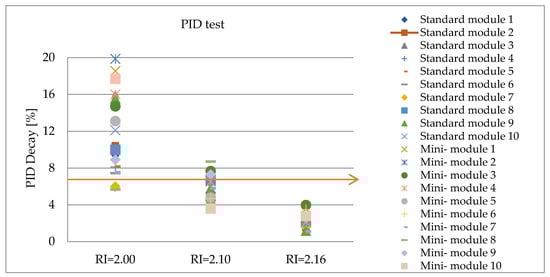
Figure 9.
Large-module and mini-module PID test result distribution diagram for α = β = 10.
The calculation results from judging whether the large module is positively related to the mini module are presented as follows:
- (1)
- When RI is 2.16, the number of tests for the large module is 10 and the number of tests passed by PID is 10, then = 100%. The number of tests for the mini module is 10, and the number of passed PID tests is also 10, = 100%, − = 0% < +10%. That is to say, the large module and the mini module are positively related to the PID test at RI = 2.16.
- (2)
- When RI is 2.10, the number of tests for the large module is 10, and the number of pass tests in the PID test is 5,= 50%. The number of tests for the mini module is also 10, and the number of pass tests in the PID test is 5, = 50%, = 0 < +10%. That is also to say, the large module and the mini module are positively related to the PID test at RI = 2.10.
- (3)
- When RI is 2.00, the number of tests for the large module is 10, and the number of pass tests in the PID test is 0, = 0. The number of tests for the mini module is 10, and the number of pass tests in the PID test is 0, = 0, and = 0 < +10%. That is to say, the large module and the mini module also have a positive relation to the PID test at RI = 2.00.
- (4)
- Moreover, in this study, 30 pieces of large modules and 30 pieces of mini modules are used for PID validation of three different RI values. In accordance with the IEC62804 standard specification, both sets of testing results are positively correlated. Therefore, the test cost can be initially recognized as successfully reducing material consumption. This has a cost saving effect on the PID test of solar cells.
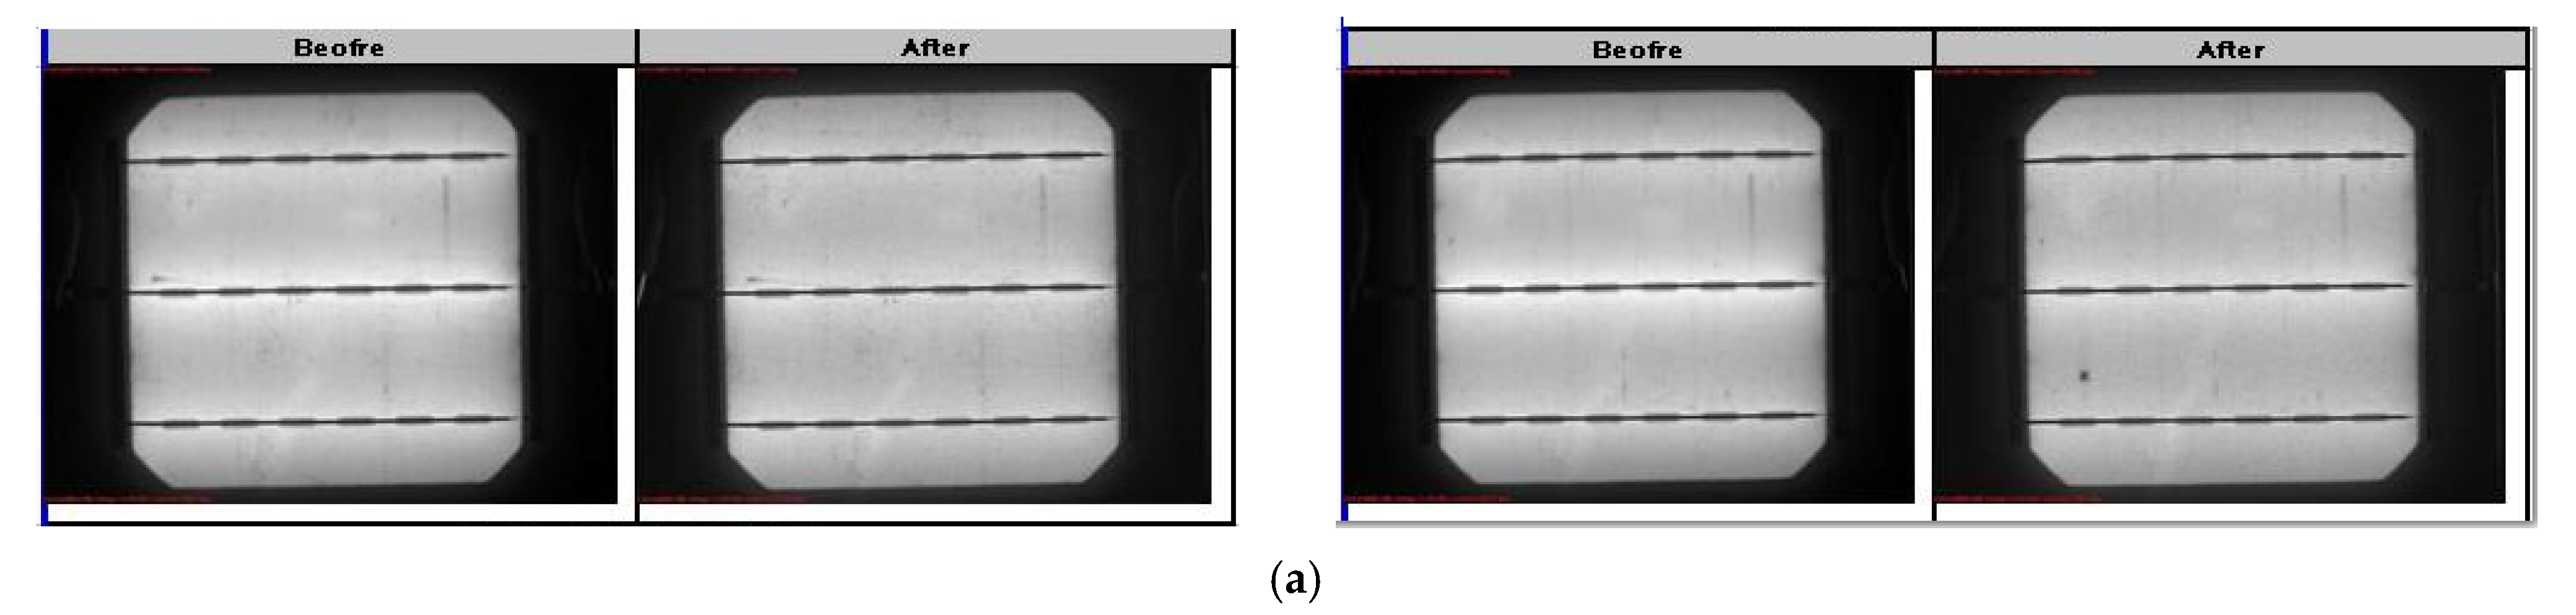
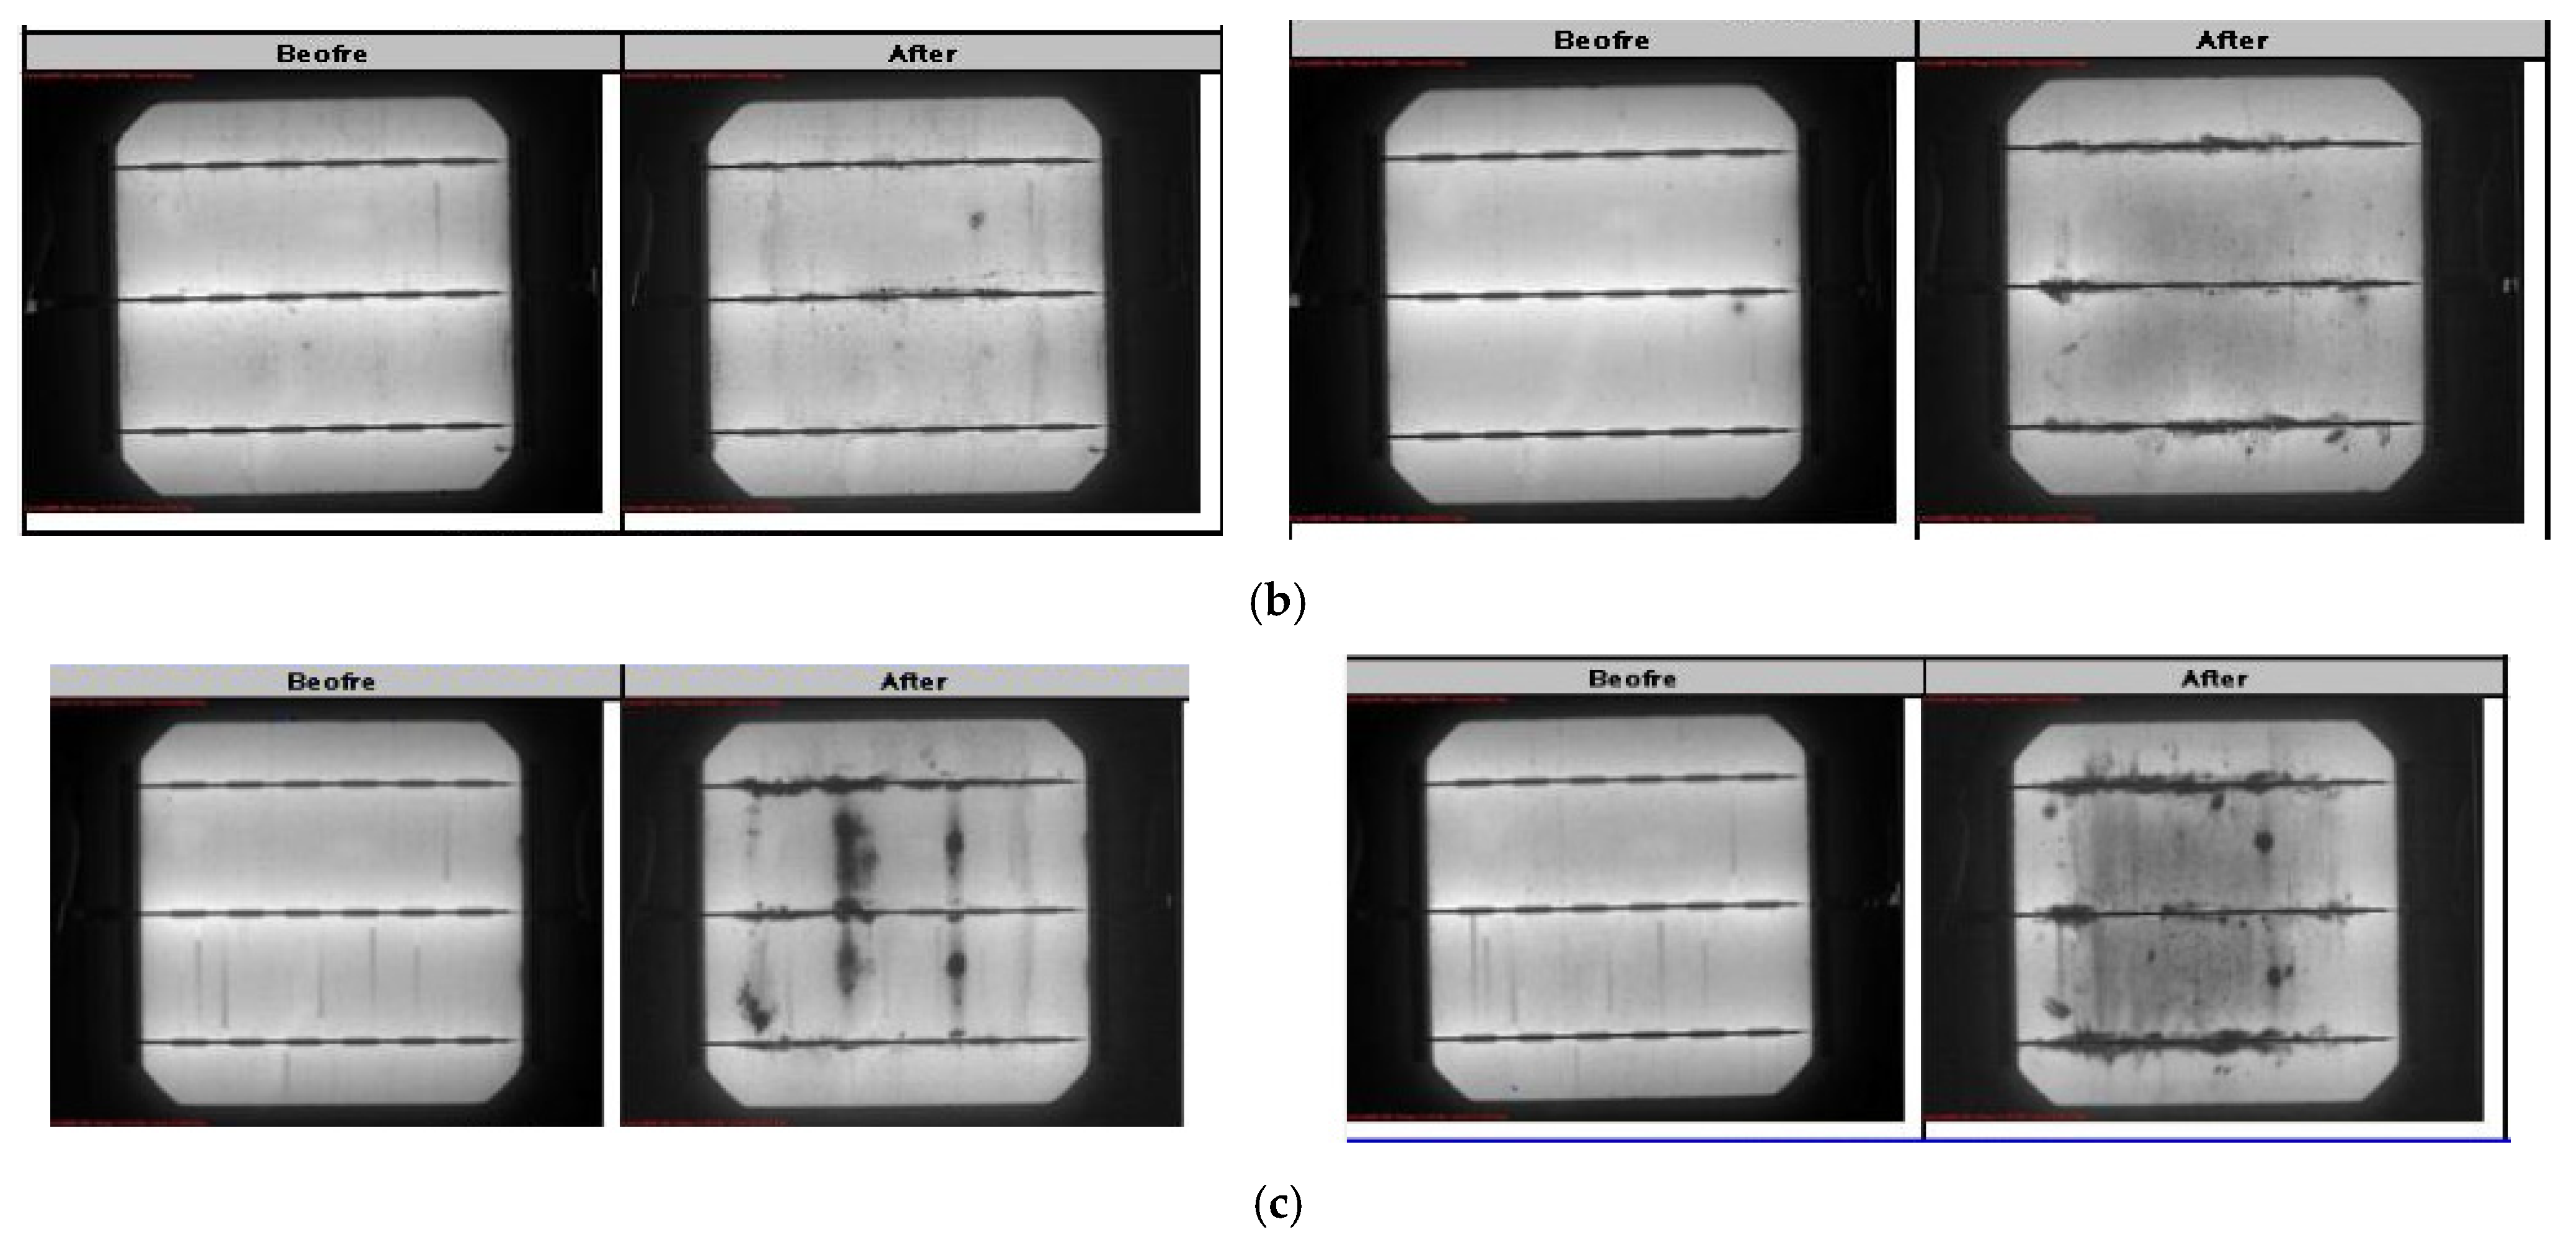
Furthermore, referring to the phenomenon in Section 2.1, when PID phenomena occurs in the solar cell, we can observe it from the EL image of the solar power, so we process the EL image measurements for all mini-module boards and find out the cases of PID pass or failure; thus, the EL image can be distinguished for the PID test in this study. Because the solar cells selected in the experiment differ in the RI values, the situation is different in the EL image after the PID test. Figure 10 shows the EL image results on the PID test for three different RI values. From Figure 10, there are four highlights identified:
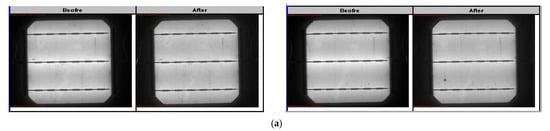
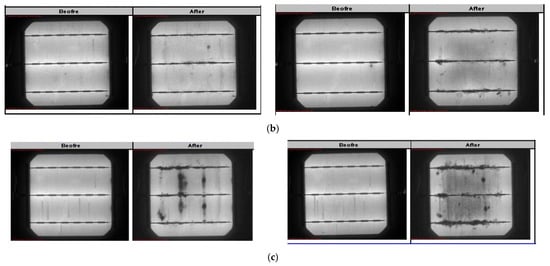
Figure 10.
The EL image results of the PID test for three different RI values. (a) Information on EL image for RI = 2.16, (b) Information on EL image for RI = 2.10, and (c) Information on EL image for RI = 2.00.
- (1)
- In the group of RI = 2.16 from Figure 10a, all the EL images show that there is no obvious difference in the images before and after the test.
- (2)
- In the group of RI = 2.10 from Figure 10b, it is found that when the module is passed through the PID test, some dark shadows appear on the EL image after the test; however, the image of PID failure cases can be clearly detected as black-shade blocks.
- (3)
- In the group of RI = 2.00 from Figure 10c, because this group is a failure case for the whole number on the testing of the PID, a clear black area is also found in the image of the EL. This image result matches with the previously referenced literature review.
- (4)
- Finally, with the help of experts, the large module and the mini module perform at different RI values for the PID test, and the testing results are positively related; thus, it is also found out that we can replace the large-module testing with the mini-module PID testing when using the EL image measurements.
4.2. Results and Discussions on Solar Cell Testing
To further verify that the mini module also has a positive relation to the solar cell, the testing time is set at 24 h, based on the recommendation given by reference [18]. Figure 11 shows the test results on the parallel resistance of 20 samples for different RI values. From Figure 11, there are three main benefits defined for comparison of PID test results between mini modules and solar cells. First, under the conditions of 24 h of negative voltage of 1000 V and potential-induced attenuation at a temperature of 60 degrees Celsius, since the parallel impedance is greater than 100 ohms, the 20 sets of solar cells have passed the PID test at RI is 2.16. Second, when RI is 2.10, the testing results for the measurement resistance of the 10 pieces of solar cells are greater than 100 ohms, but the other 10 pieces of solar cells are less than 100 ohms; thus, the testing results show that half of the PID tests have passed, while the others are failure cases. Finally, in a group of solar cells for RI value 2.00, its parallel resistance for 20 pieces of solar cells are less than 100 ohms, so this group of solar cells is a failure case for the PID test.
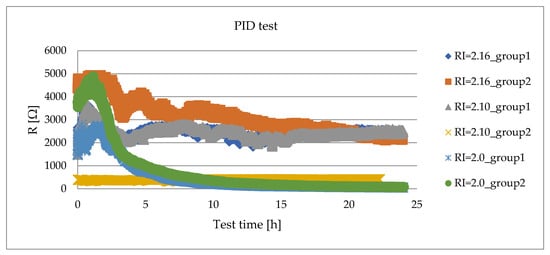
Figure 11.
The distribution diagram of PID test results at different RI values for the mini module and the solar cell.
Similarly, we use the judgment rules presented on Section 3.1 for judging the correlation between the solar cell and the mini module, and four key points are addressed, as follows:
- (1)
- When RI is 2.16, the number of tests for the solar cell is 20, and the number of passing the PID test is also 20, that is = 100%. The number of tests for the mini module is 10 and the number of passing the PID test is 10, = 100%, and −= 0% < 10%. That is, the solar cell and the mini module have a positive relation to the test at RI = 2.16.
- (2)
- When RI is 2.10, the number of tests for the solar cell is 20, and the number of passing the PID test is 10, = 50%. The number of tests for the mini module is 10, and the number of passing the PID test is 5, = 50%, −= 0% < 10%. That is to say, the solar cell and the mini module are positively related to the test at RI = 2.10.
- (3)
- When RI is 2.00, the number of tests for the solar cell is 20, and the number of passing the PID test is 0, = 0%. The number of tests for the mini module is 10, and the number of passing the PID test is 0, = 0%, −= 0% < 10%. That is to say, the solar cell and the mini module are positively related to the test at RI = 2.00.
- (4)
- By utilizing the simulated testing apparatus provided in the referenced materials and performing the PID verification on solar cells with the same RI value as the solar cell test, this method can successfully show that the solar cell simulation test and the mini module test have positive correlation. This result not only reduces the cost of the PID test but also eliminates testing errors caused by manual operations during the encapsulation of solar cell for solar modules.
4.3. Results and Discussions on the Settling Time
In this subsection, the comparison of test results is shown with the settling time model in order to shorten the PID test time.
First, from the previous data analysis, although the experimental results show that solar cells and mini modules have a positive correlation, a big drawback is that the experiment needs 24 h to obtain the result; it is undoubtedly a cost-ineffective burden. Therefore, this study uses the settling time method to further verify whether other prediction methods can get test results in advance to effectively reduce the cost of testing time.
According to the above conclusions, the PID phenomenon can be predicted by using the parallel resistance data obtained from the PID simulation tester in the PID test. Accordingly, in the 24 h test time, we collect a number of 8641 sample data and 118 pieces of solar cells to be tested. In the 118 pieces, 70 of them show a PID case, while 48 without a PID. Subsequently, the PID phenomenon of solar cells carried out in the settling time model is predicted, and the steps are described as follows:
- (1)
- 48 pieces of solar cells are randomly picked up from the 70 pieces with a PID case, and 30 pieces of solar cells are randomly selected from the 48 pieces as training data.
- (2)
- Accordingly, perform the above step to replace the testing data repeatedly 10 times, which can find out the average steady-state time point .
- (3)
- In order to find the threshold, 70 pieces of solar cells are selected randomly from 118 pieces, which have mixed with/without a PID problem. Then, 30 pieces are randomly selected from these 70 pieces to use and perform the threshold retrieval. Next, 30 of the remaining 40 pieces are selected at random to test and predict the given data.
- (4)
- Finally, the previous 3 steps are executed repeatedly 10 times to achieve better prediction accuracy.
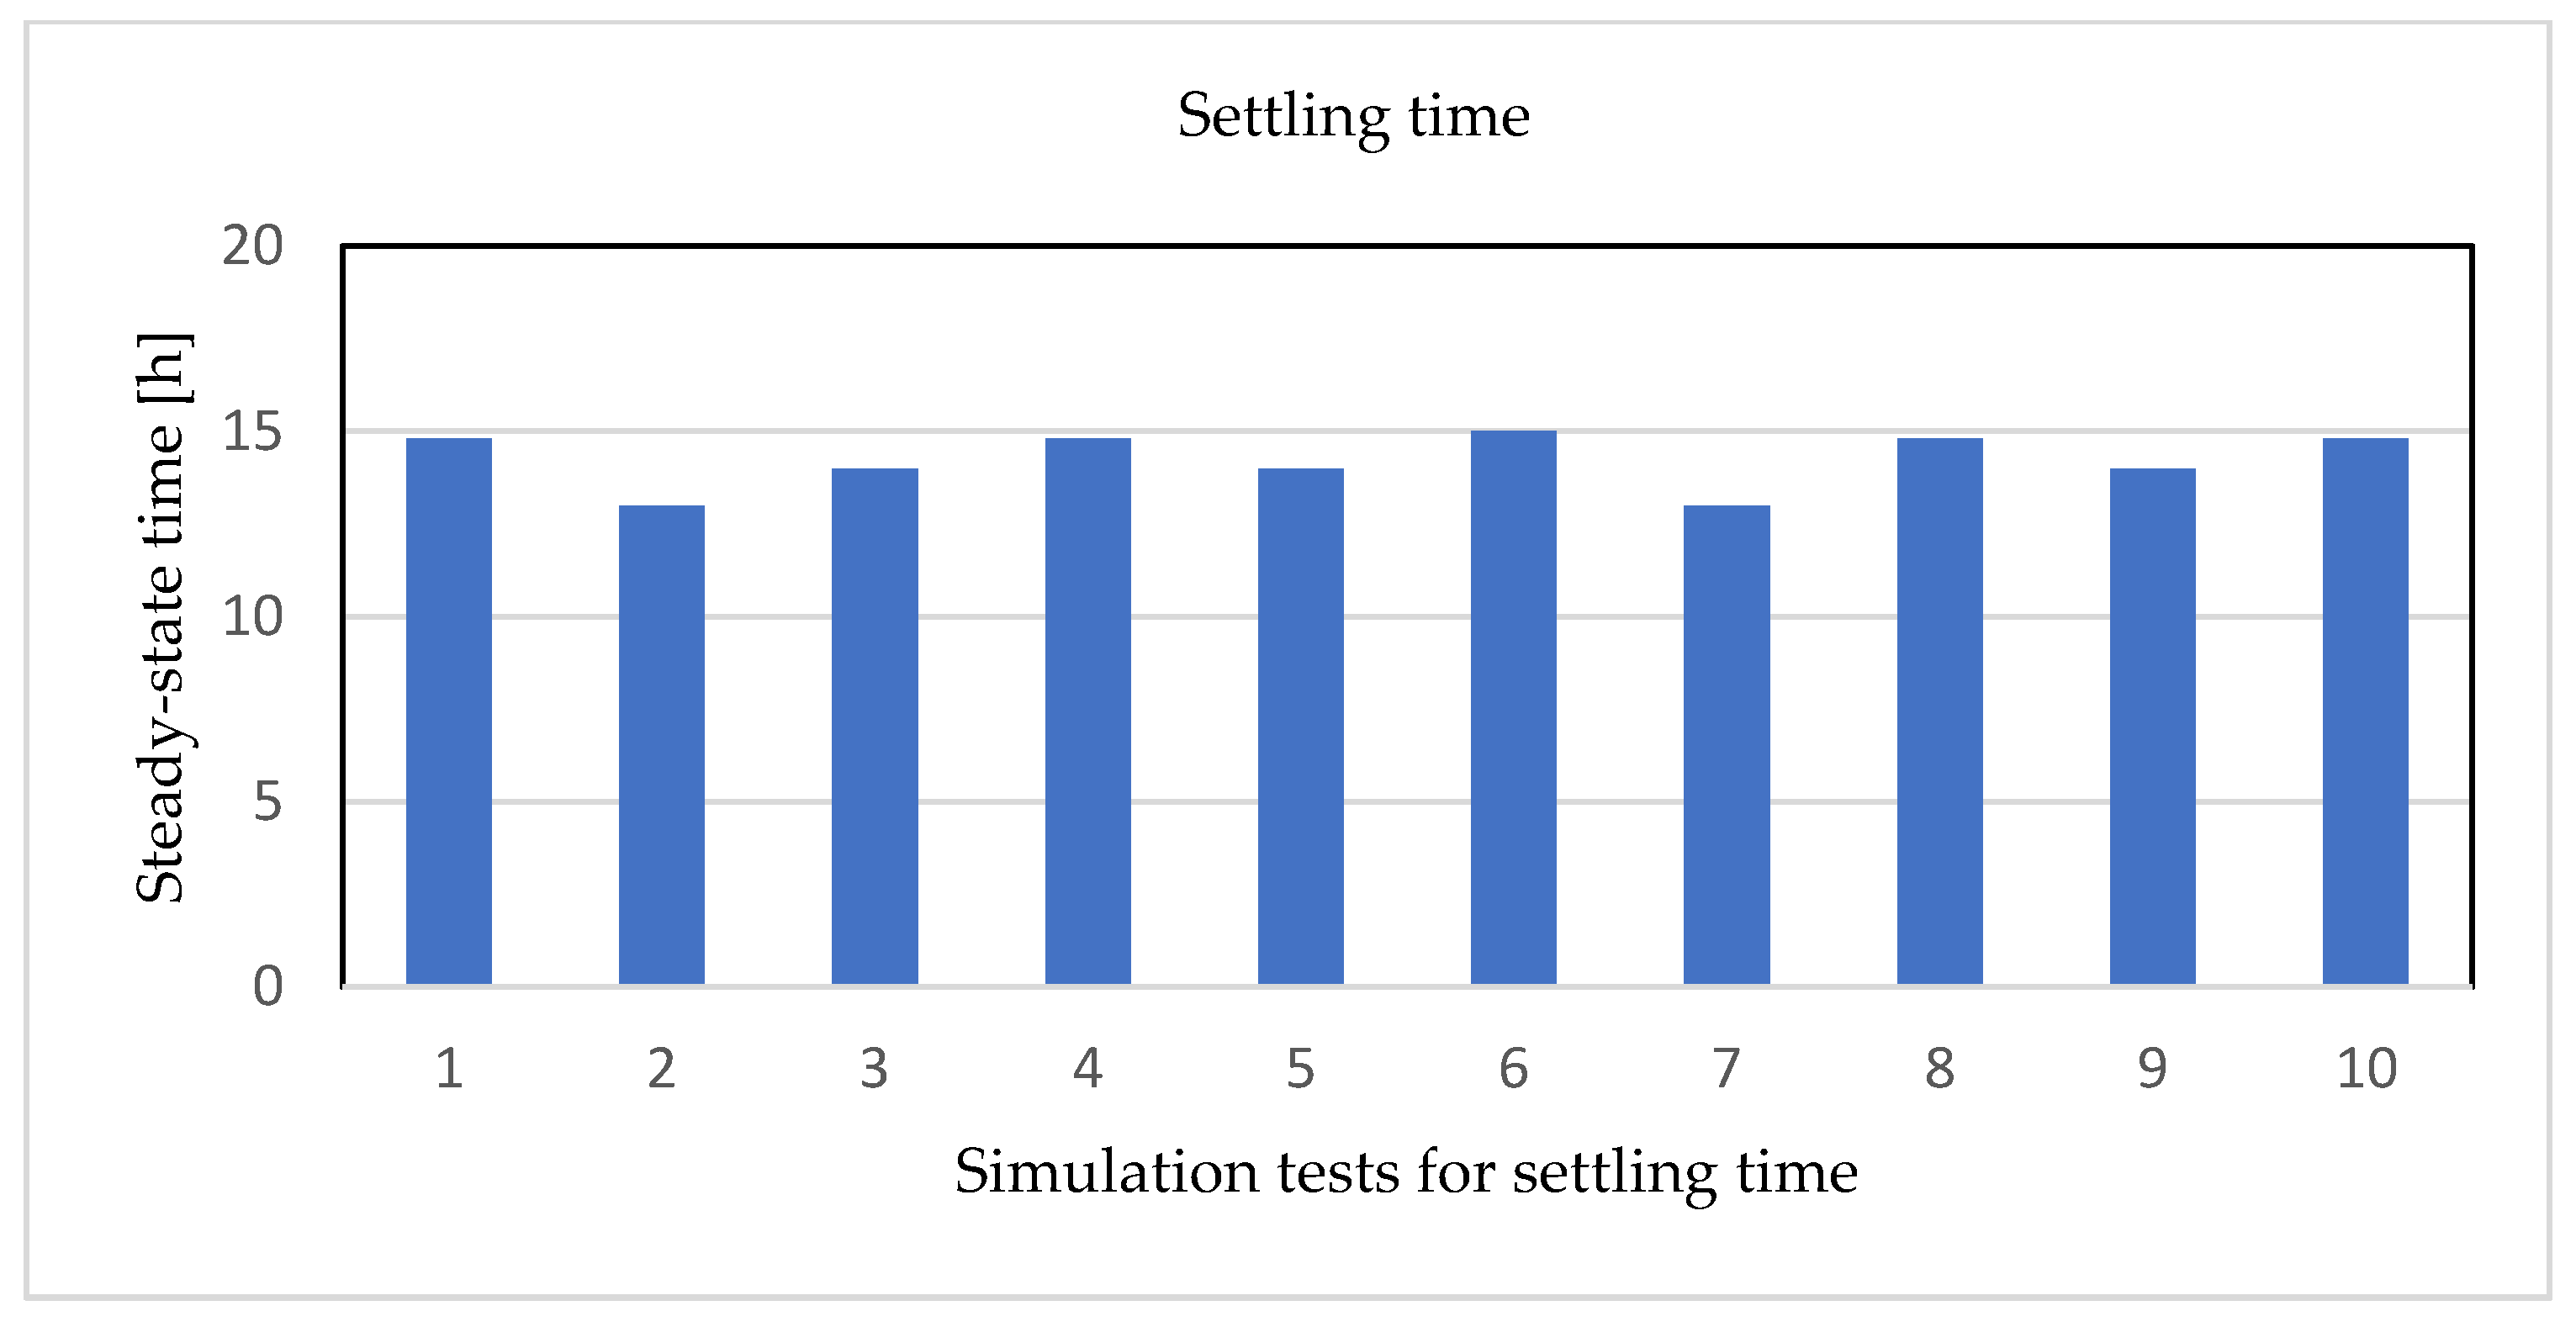
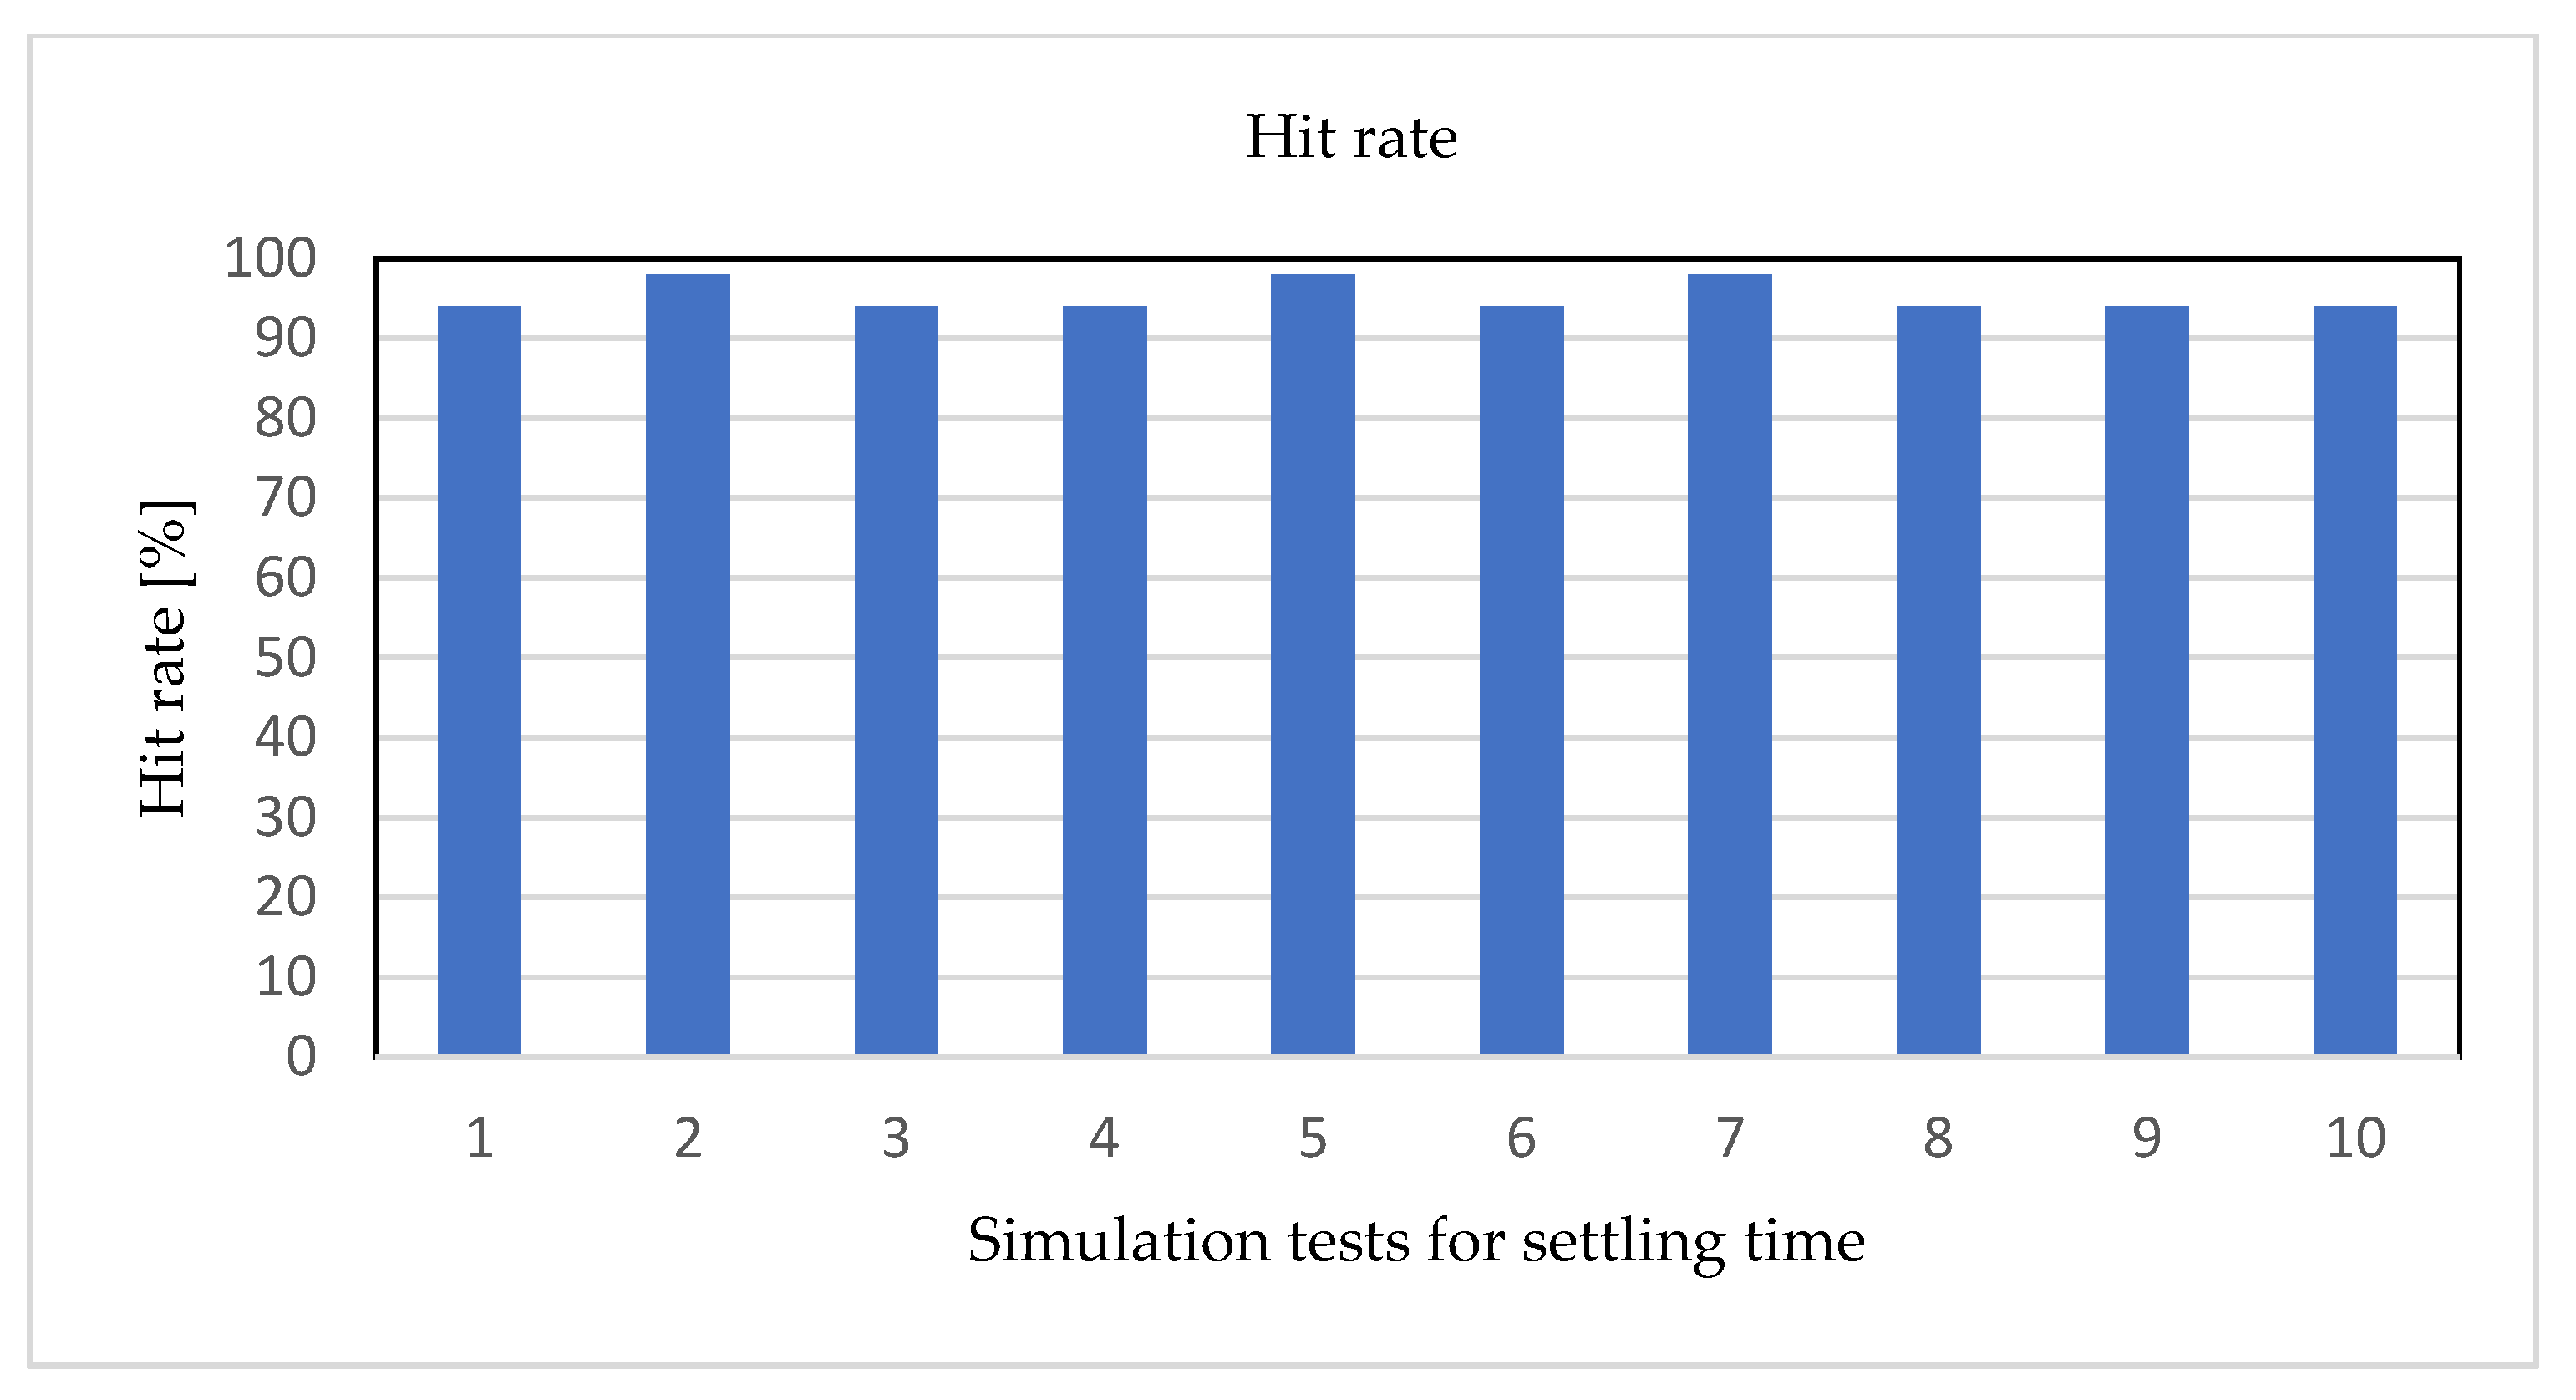
In the experimental results, Figure 12 and Figure 13 show the average steady-state time point and testing accuracy in a bar chart. In Figure 12, the X-axis represents the series number of simulation tests for settling time, and the Y-axis represents the steady-state time values (h) of each cell. After implementing the settling time analysis, the average steady-state time is about 14 h from Figure 12, and the hit rate (accuracy) is about 94% from Figure 13; as a result, it is a good outcome.
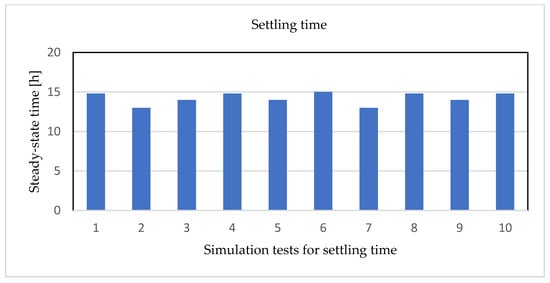
Figure 12.
The bar chart of the average steady-state time point.
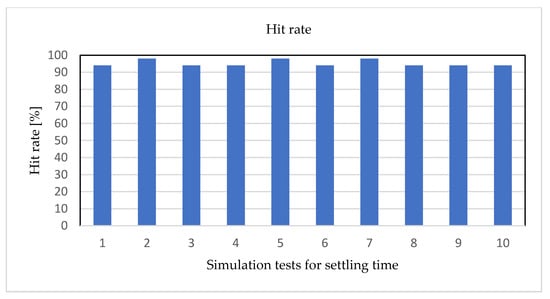
Figure 13.
The bar chart for the best accuracy (hit rate) of the settling time model.
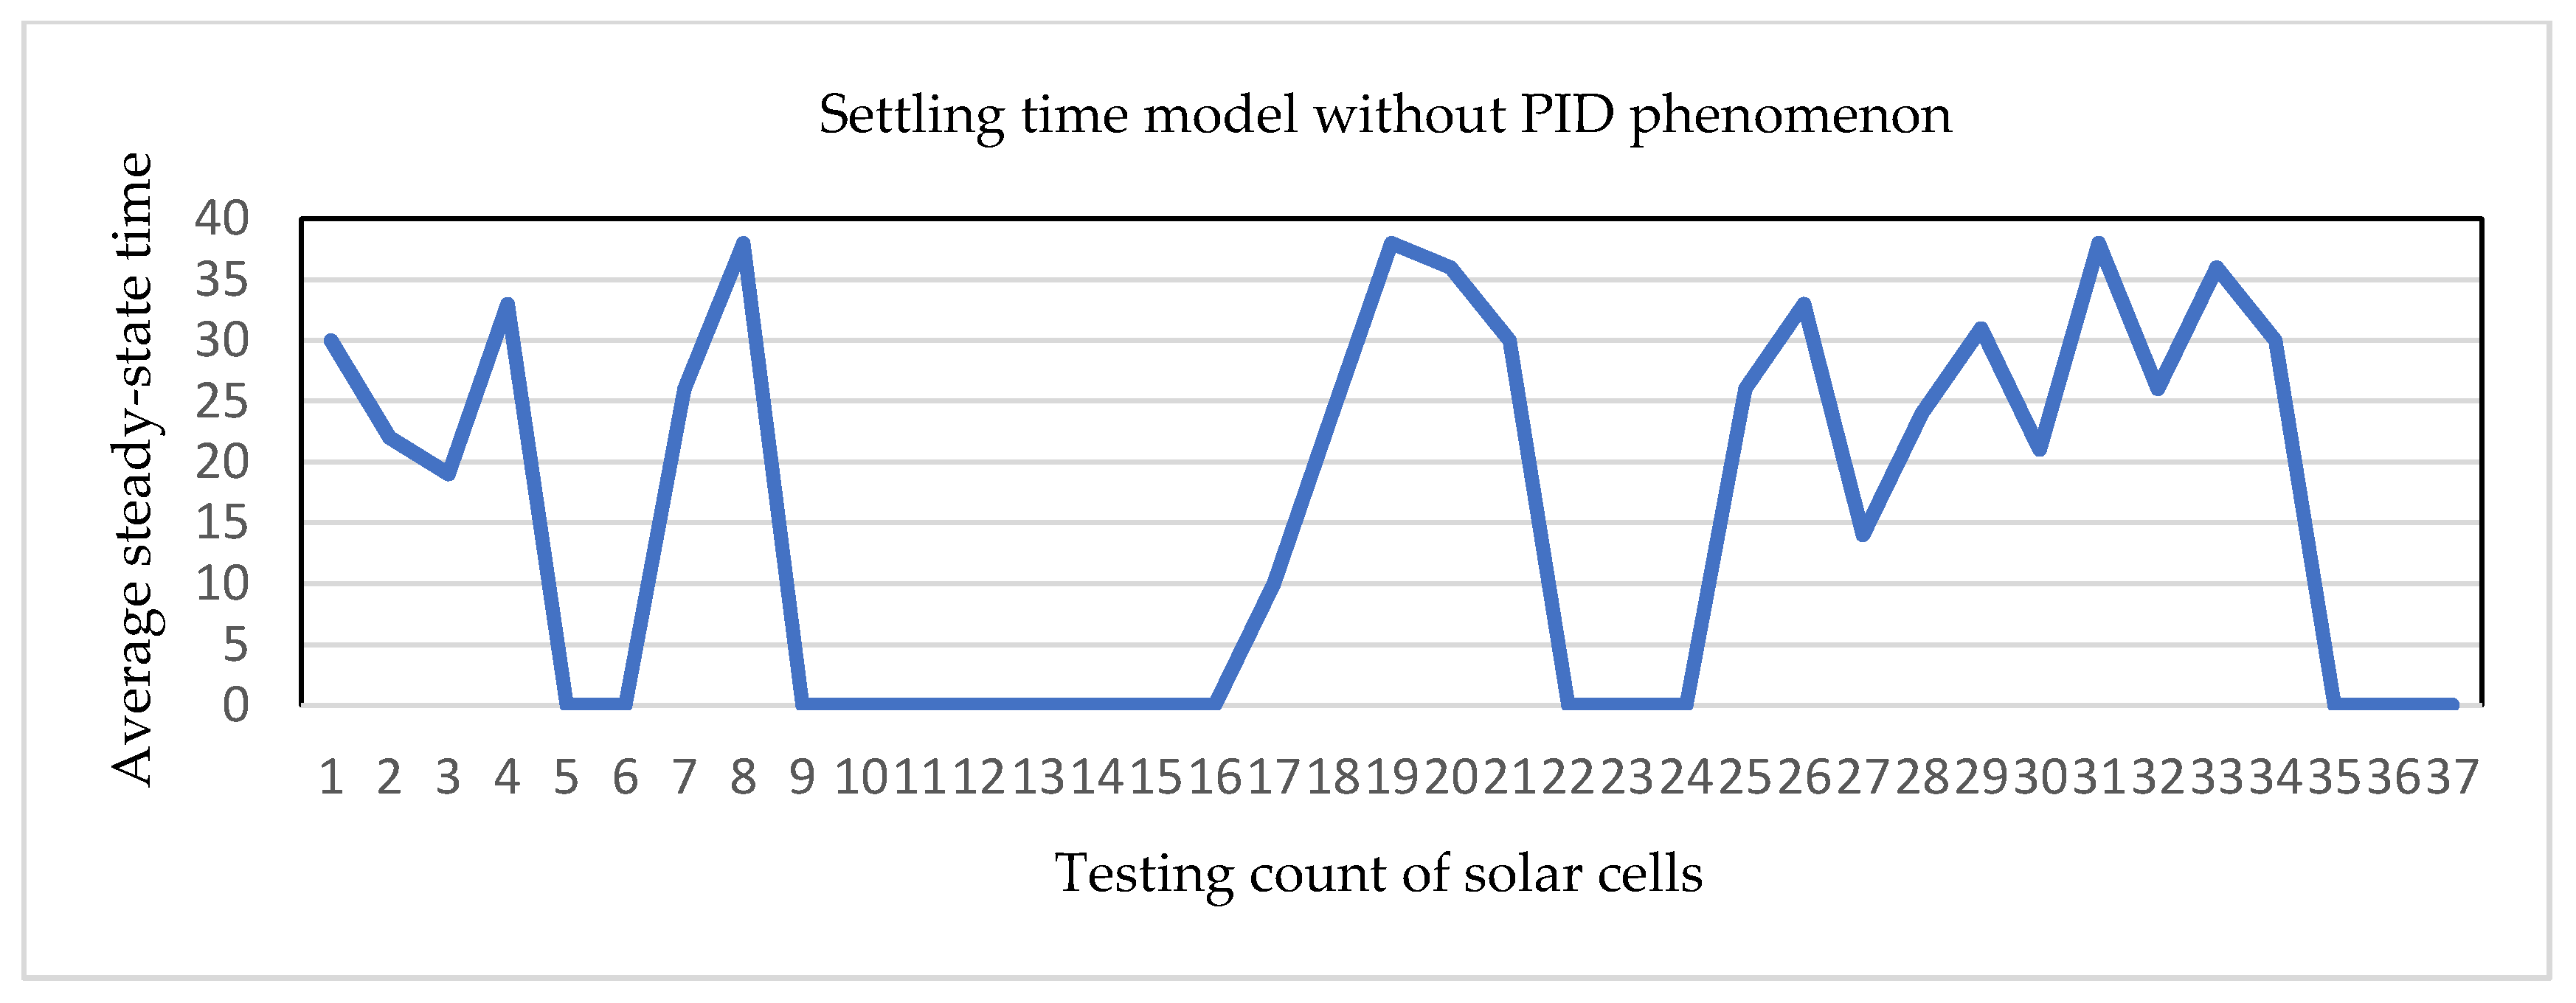
Finally, the samples with PID phenomenon and without PID phenomenon are tested separately to further verify the testing results of the settling time model. The X-axis represents the number of testing counts for solar cells, and the Y-axis represents the average steady-state time. Figure 14 and Figure 15 show the empirical results of with PID phenomenon and without PID phenomenon in the type of line graph, respectively.
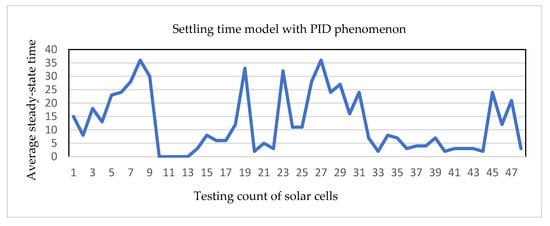
Figure 14.
The line graph for settling time model with PID phenomenon.
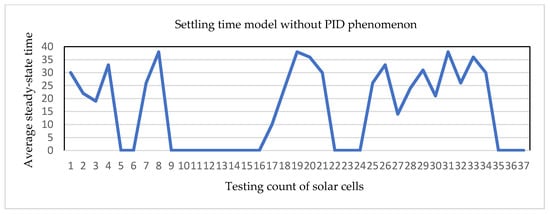
Figure 15.
The line graph for settling time model without PID phenomenon.
For the partly explained results, this study has confirmed that the solar cell for simulation tests can be positively correlated with the large module of solar testing method. In accordance with the standard test specification, 96 h of testing is still authentically consuming time cost. Therefore, the characteristics of parallel resistance are used to effectively make the settling time analysis. In addition, the test data of 118 pieces used in this study to verify the testing results can achieve on average about 14 h and an average accuracy of about 94%. This outstanding result is significantly less than the 96 h specified by the large module of the PID test.
4.4. Results and Discussions on the Mathematical Neural Network
Although we have used the settling time method to predict the PID phenomenon in shorter time than the practical testing process, it can be tracked that a predicted pattern, which is not presented in this paper due to the difficulty of comprehensive integrity and smoothness, shows a scattered situation when predicting PID phenomenon. Thus, this study further uses a mathematical neural network model to predict PID in order to solve this scattered problem.
In this experiment, we used the data, which is the same as the data used in the settling time model, for parallel resistance values. Testing time is set at 24 h, and the number of sampling data is 8641 (six data per minute, 360 data per hour, totally 24 h of testing data). The cells data of 118 pieces are divided into three groups: training data, validation data, and testing data. The parameters and environment setting are presented as follows: (1) Data range: , sequential data of parallel resistance for solar cells are sampled every 10 s. (2) Training data: , the parallel resistance sequential data of 60 solar cells are collected as the training data. (3) Validation data: , the sequential data of parallel resistance for 30 solar cells are collected as the validation data. (4) Testing data: , the sequential data of parallel resistance for 10 solar cells are collected as the testing data. (5) Finally, output one result to judge whether there is a PID case. Importantly, the simulations are performed in MATLAB R2011b by using the BPNN method.
Accordingly, when training the mathematical neural network, the accuracy of the neural network with different numbers of neurons in the hidden layer is measured. Figure 16 shows the experimental results of different numbers of neurons in a hidden layer in the type of bar chart. It is found that when the neural network has the highest hit rate, the number of hidden layers is five; therefore, the number of neurons in the hidden layer is determined to be five neurons.

Figure 16.
The bar chart for hit rate on different number of neurons in the hidden layer.
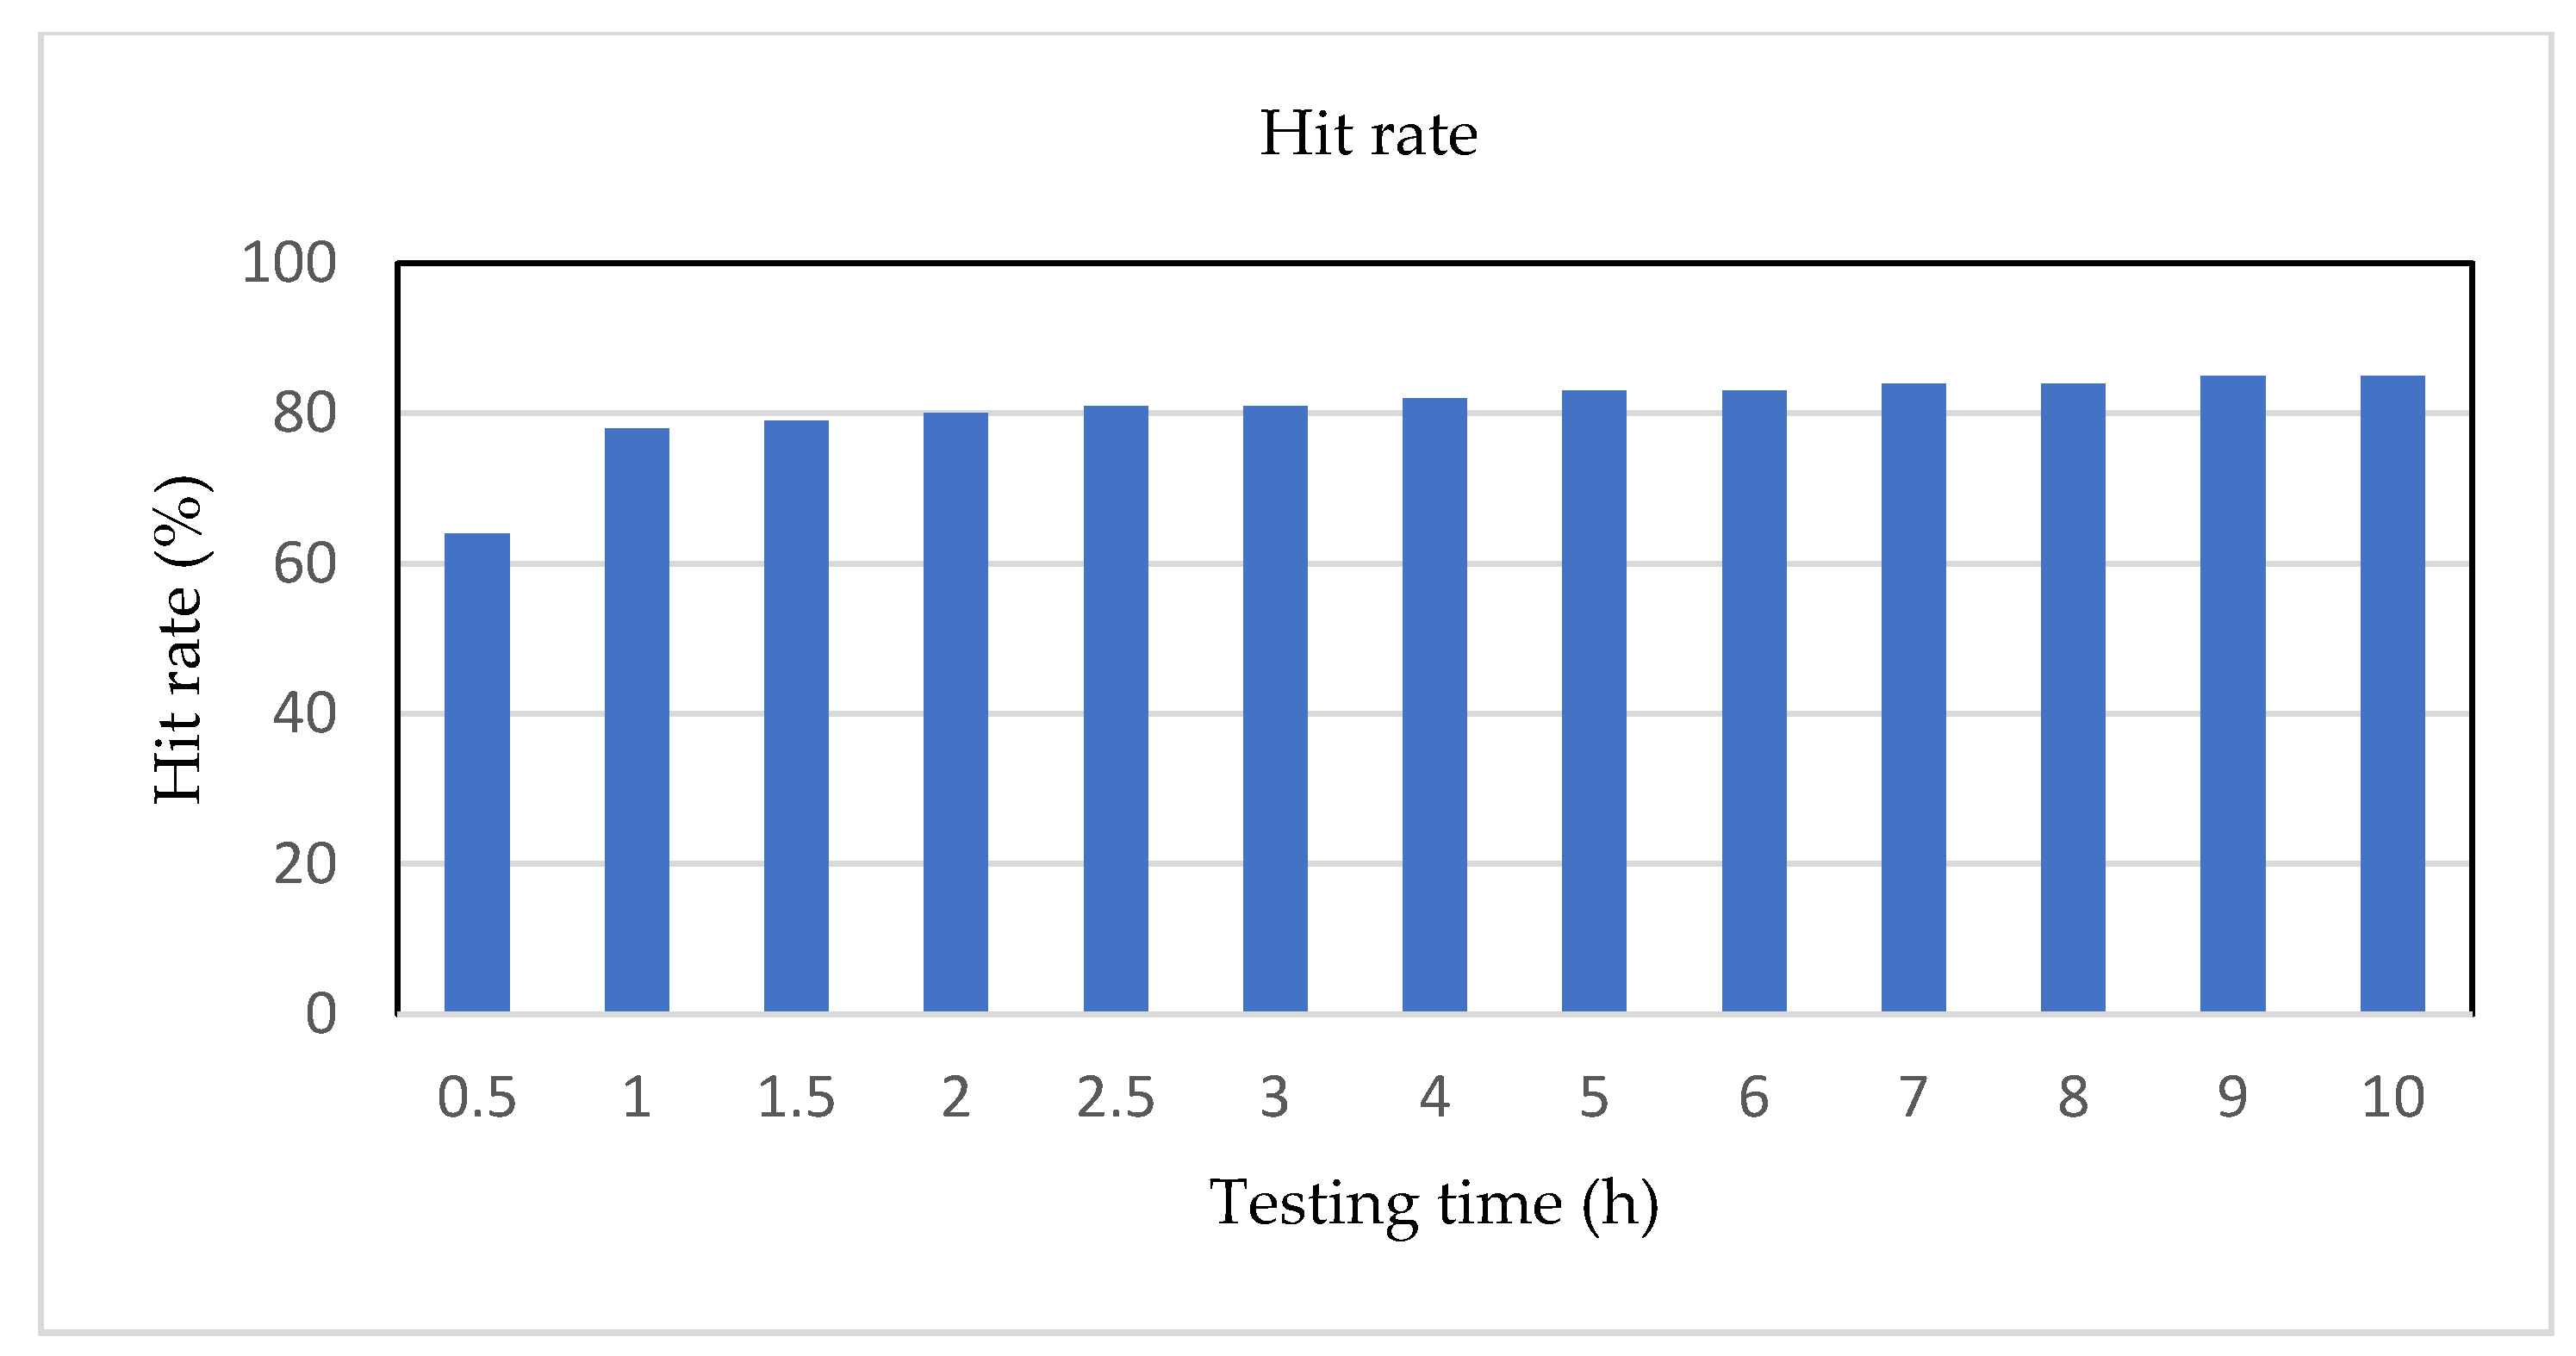
Next, to further compare the accuracy of the inputting time data, the experiment uses 60 training data, 30 validation data, and 10 testing data of the solar cells. The whole training process is repeated 10 times to compare the output accuracy of the mathematical neural network in using different inputting sequential data. When comparing the accuracy between the unvalidated process (without using validation data) and the validated process (with using validation data), Figure 17 and Figure 18 show results of accuracy, respectively. From Figure 17 and Figure 18, it is found that the accuracy of unvalidated process has about 5–10% less than the accuracy with validated process. In Figure 17, accuracies in 0.5 h to 10 h are ranked as the following: 58.76, 67.95, 69.72, 72.08, 72.95, 73.32, 73.78, 74.41, 74.73, 75.16, 75.59, 75.94, and 76.36, respectively; from Figure 18, they are in the order of 65.29, 75.50, 77.47, 80.09, 81.06, 81.47, 81.98, 82.68, 83.04, 83.52, 83.99, 84.38, and 84.84. From the above testing results, it is found that when testing time is prolonged, the accuracy rate of increasing tends to slow down, and the more testing time, the more the accuracy. This situation means that it cannot obtain higher accuracy even if the simulation time is extended. In addition, in the research and development process of solar cells, the testing and verification processes take most of the development time. Therefore, if the accuracy of identifying the PID problem is obtained in a shorter time, it is clear to shorten the testing time of solar cells. When this study uses the mathematical neural network model, it is seen from Figure 18 that the accuracy for testing achieves over 80% within two hours, which is very effective in shortening the PID test time.
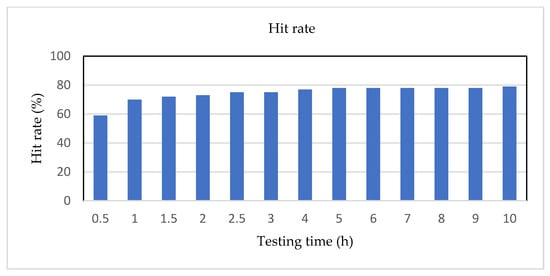
Figure 17.
The bar chart for hit rate without using validation data.

Figure 18.
The bar chart for hit rate using validation data.
Finally, we offer a valuable discussion on the advantages of neural network model. Since the interconnected resistance will decrease with the testing time, how to determine the testing time and accurately predict the test results of PID phenomenon are the focus for experiments in this study. Therefore, we utilize the characteristics and advantages of an artificial neural network for a black box system that only requires input and output data, without the need for the architecture of a well-defined mathematical model to train entire neural networks for identifying the PID phenomenon of solar panels [40]. The neural networks technique is a principal focal point in this study.
5. Conclusions and Future Research
We have proposed a hybrid procedure of implementing four approaches to, respectively, identify the PID problem in order to test and measure their costs of time and materials used for solar power industry. As a whole, there are five main directions addressed to conclusively summarize the study for managerial purposes, as follows:
- (1)
- For solving the existing shortcomings of previous studies: In order to effectively reduce energy costs, the continuous development of various alternative energies is focused, particularly for solar energy as the most readily available alternative. To provide stable and continuously effective solar energy under the drawbacks of the increasing cost of electricity, it is the first lesson to avoid solar cells with PID phenomenon. Early studies have focused on improving the structure of general modules and the production conditions of solar cells during the manufacturing process. The costly solar cell modules still require verification of the PID phenomenon, which is a heavy cost burden for both solar-cell manufacturers and solar-module manufacturers. Interestingly, most of the methods used to solve PID were to change the material, material size, or thickness to reduce the PID phenomenon; there were no scholars using effective testing methods to reduce material costs and time costs for testing PID. This study has solved these existing gaps in previous studies.
- (2)
- For showing the numerical results of empirical studies: For the empirical results of real cases, there are five key outcomes achieved. Table 1 lists the empirical results, including time, rank of cost, accuracy, and limitations of the four methods. (a) This study further used 30 large modules and 30 mini modules for PID authentication under three different RI values. In accordance with the IEC62804 standard normative test, the two sets are positively correlated from the testing results; thus, we can replace the large module with a time-consuming test with the mini module with a time-saving test, thereby simultaneously reducing the consumption of material and time in the PID test cost initially. (b) In addition, by referring to the data provided by the PID simulation tester, it is found that mini modules and solar cells test also have a positive correlation in a IEC62804 standard test, and they use the same RI values and successfully performed the PID authentication. This not only reduces of the cost of the PID testing but also avoids the error in the test caused by manual operation of the single solar module packaging. (c) In accordance with the standard test specification, the 96-h test is still a time-consuming cost, so we use the settling time analysis model for the solar cell in the PID test with a change of time and parallel resistance; we used the testing data of 118 solar cells to make further verification. As a result, we obtained an average of about 14 h for testing results with an accuracy rate of 94%, which is far less than the time of the standard PID testing regulation 96 h. (d) We then use the mathematical neural network model to make a PID prediction. According to the results of the experiment, it is shown that under the architecture of the five neurons of mathematical neural networks in hidden layers, about 80% of the prediction accuracy can be achieved within two hours. More importantly, for solar power plant and for the developer, the early testing of product design will save more than 90% of the testing time. (e) From Table 1, in the testing time of numerical results, Method-4 (96 h) → Method-3 (24 h) → Method-2 (14 h) → Method-1 (2 h). Method-1 is best for using testing time less. In the rank of cost of numerical results, Method-4 → Method-3 → Method-2 → Method-1. Method-1 is also best for spending material cost less. In the accuracy of numerical results, Method-4 (100%) → Method-3 (100%) → Method-2 (94%) → Method-1 80%). Method-3 and Method-4 are best for achieving the most accuracy. As for the limitations of the four methods used, the four descriptions are “Test in the high-cost equipment with complicated environment”, “Simpler equipment for a solar cell”, “The equipment with timely data record collected”, and “The equipment with a shorter time data record collected”, for Method-1–Method-4, respectively.Thus, this method can facilitate development and production of solar cells method based on the above empirical results.
- (3)
- For reaching a novel technical contribution: This study proposes a hybrid model to integrate a four-method testing of the PID problem. This hybrid model has not yet been proposed for the solar power industry. Moreover, since the proposed Method-3 and used Method-4 are not seen in reviewing the limited literature to effectively identifying the PID problem, this study thus has a valuable contribution for benefiting a technological application innovation.
- (4)
- For reaching an industrial application contribution: From the study results, these four methods highlight the key components for cost reduction of materials and testing time during the manufacturing process of solar panels in practice. Given the real industrial values, the study has achieved an industrial application contribution of green energy technology with some advanced advantages.
- (5)
- For doing the future research: Although the empirical results with remarkable advantages of the study have identified many research benefits, it is still necessary to further make more rooms to improve the proposed hybrid method in the near future. Thus, the research direction in the future can be focused on collecting more data or applying other classification methods of artificial intelligence (AI) to analyze the PID phenomenon on solar cells. Then, searching for better algorithms or models, we can achieve better prediction accuracy and shorter test time to reduce PID testing time and increase test accuracy for exceeding 94% accuracy within 14 h or 80% accuracy within 2 h in the future. It is expected that the improvements offer useful references to subsequent researchers and practitioners for pacing a small stone for solar power industry.

Table 1.
The empirical results of the four methods used.
Table 1.
The empirical results of the four methods used.
| Evaluation Item | Method-1 | Method-2 | Method-3 | Method-4 |
|---|---|---|---|---|
| Time | 96 h | 24 h | 14 h | 2 h |
| Rank of cost | 4 * | 3 | 2 | 1 |
| Accuracy | 100% | 100% | 94% | 80% |
| Limitation | Test in the high-cost equipment with complicated environment | Simpler equipment for a solar cell | The equipment with timely data record collected | The equipment with a shorter time data record collected |
Note: * For the rank of cost, 4 indicates most costly and 1 refers to least cost.
Author Contributions
Conceptualization, J.-R.C., C.-H.L. and H.-K.Y.; Methodology, J.-R.C. and C.-H.L.; Software, H.-K.Y. and Y.-H.H.; Visualization, J.-R.C., Y.-S.C., Y.-S.L. and Y.-H.H.; Writing—original draft, H.-K.Y., J.-R.C. and Y.-S.C.; Writing—review and editing, Y.-S.C., Y.-H.H. and Y.-S.L. All authors have read and agreed to the published version of the manuscript.
Funding
This research was partially supported by the National Science and Technology Council of Taiwan, for grant numbers 111-2221-E-167-036-MY2.
Data Availability Statement
Not applicable.
Conflicts of Interest
The authors declare no conflict of interest.
References
- Sopori, B.; Basnyat, P.; Devayajanam, S.; Shet, S.; Mehta, V.; Binns, J.; Appel, J. Understanding light-induced degradation of c-Si solar cells. In Proceedings of the 2012 38th IEEE Photovoltaic Specialists Conference, Austin, TX, USA, 3–8 June 2012; pp. 1115–1120. Available online: https://ieeexplore.ieee.org/document/6317798 (accessed on 6 April 2023).
- Ounadjela, K.; Sidelkheir, O.; Jiang, C.S.; Al-Jassim, M.M. Light-induced degradation in upgraded metallurgical-grade silicon solar cells. In Proceedings of the 2012 38th IEEE Photovoltaic Specialists Conference, Austin, TX, USA, 3–8 June 2012; pp. 2739–2743. Available online: https://ieeexplore.ieee.org/document/6318160 (accessed on 6 April 2023).
- Kim, N.Y.; Ropp, M. Study of the initial light-induced degradation of PV modules using N-type dendritic web silicon cells. In Proceedings of the 2006 IEEE 4th World Conference on Photovoltaic Energy Conference, Waikoloa, HI, USA, 7–12 May 2006; pp. 2112–2115. Available online: https://ieeexplore.ieee.org/document/4060087 (accessed on 6 April 2023).
- Schütze, M.; Junghänel, M.; Koentopp, M.B.; Cwikla, S.; Friedrich, S.; Müller, J.W.; Wawer, P. Laboratory study of potential induced degradation of silicon photovoltaic modules. In Proceedings of the 2011 37th IEEE Photovoltaic Specialists Conference, Seattle, WA, USA, 19–24 June 2011; pp. 821–826. Available online: https://ieeexplore.ieee.org/document/6186080 (accessed on 6 April 2023).
- Hacke, P.; Smith, R.; Terwilliger, K.; Glick, S.; Jordan, D.; Johnston, S.; Kempe, M.; Kurtz, S. Acceleration factor determination for potential-induced degradation in crystalline silicon PV modules. In Proceedings of the 2013 IEEE International Reliability Physics Symposium (IRPS), Monterey, CA, USA, 14–18 April 2013; pp. 4B.1.1–4B.1.5. Available online: https://ieeexplore.ieee.org/document/6532009 (accessed on 6 April 2023).
- Hacke, P.; Spataru, S.; Terwilliger, K.; Perrin, G.; Glick, S.; Kurtz, S.; Wohlgemuth, J. Accelerated testing and modeling of potential-induced degradation as a function of temperature and relative humidity. IEEE J. Photovolt. 2015, 5, 1549–1553. [Google Scholar] [CrossRef]
- Martínez-Moreno, F.; Figueiredo, G.; Lorenzo, E. In-the-field PID related experiences. Sol. Energy Mater. Sol. Cells 2018, 174, 485–493. [Google Scholar] [CrossRef]
- Xu, L.; Liu, J.; Luo, W.; Wehbe, N.; Seitkhan, A.; Babics, M.; Kang, J.; De Bastiani, M.; Aydin, E.; Allen, T.G.; et al. Potential-induced degradation in perovskite/silicon tandem photovoltaic modules. Cell Rep. Phys. Sci. 2022, 3, 101026. [Google Scholar] [CrossRef]
- Nakka, L.; Luo, W.; Aberle, A.G.; Lin, F. Study of potential-induced degradation in glass-encapsulated perovskite solar cells under different stress conditions. Sol. RRL 2023, 7, 2300100. [Google Scholar] [CrossRef]
- Molto, C.; Oh, J.; Mahmood, F.I.; Li, M.; Hacke, P.; Li, F.; Smith, R.; Colvin, D.; Matam, M.; DiRubio, C.; et al. Review of potential-induced degradation in bifacial photovoltaic modules. Energy Technol. 2023, 11, 2200943. [Google Scholar] [CrossRef]
- Miranda, H.F.B.; da Costa, L.P.; Soares, S.O.; da Silva, J.V. Potential induced degradation (PID). In Proceedings of the 2020 IEEE PES Transmission & Distribution Conference and Exhibition-Latin America (T&D LA), Montevideo, Uruguay, 28 September–2 October 2020; pp. 1–6. Available online: https://ieeexplore.ieee.org/document/9326184 (accessed on 7 April 2023).
- Hacke, P.; Terwilliger, K.; Glick, S.; Tamizhmani, G.; Tatapudi, S.; Stark, C.; Koch, S.; Weber, T.; Berghold, J.; Hoffmann, S.; et al. Interlaboratory study to determine repeatability of the damp-heat test method for potential-induced degradation and polarization in crystalline silicon photovoltaic modules. IEEE J. Photovolt. 2014, 5, 94–101. [Google Scholar] [CrossRef]
- Yamaguchi, S.; Van Aken, B.B.; Masuda, A.; Ohdaira, K. Potential-induced degradation in high-efficiency n-type crystalline-silicon photovoltaic modules: A literature review. Sol. RRL 2021, 5, 2100708. [Google Scholar] [CrossRef]
- Pingel, S.; Frank, O.; Winkler, M.; Daryan, S.; Geipel, T.; Hoehne, H.; Berghold, J. Potential induced degradation of solar cells and panels. In Proceedings of the 2010 35th IEEE Photovoltaic Specialists Conference, Honolulu, HI, USA, 20–25 June 2010; pp. 2817–2822. Available online: https://ieeexplore.ieee.org/document/5616823 (accessed on 7 April 2023).
- Tatapudi, S.; Ebneali, F.; Kuitche, J.; Tamizhmani, G. Potential induced degradation of pre-stressed photovoltaic modules: Effect of glass surface conductivity disruption. In Proceedings of the 2013 IEEE 39th Photovoltaic Specialists Conference (PVSC), Tampa, FL, USA, 16–21 June 2013; pp. 1604–1609. Available online: https://ieeexplore.ieee.org/document/6744452 (accessed on 7 April 2023).
- Kambe, M.; Hara, K.; Mitarai, K.; Takeda, S.; Fukawa, M.; Ishimaru, N.; Kondo, M. Chemically strengthened cover glass for preventing potential induced degradation of crystalline silicon solar cells. In Proceedings of the 2013 IEEE 39th Photovoltaic Specialists Conference (PVSC), Tampa, FL, USA, 16–21 June 2013; pp. 3500–3503. Available online: https://ieeexplore.ieee.org/document/6744441 (accessed on 7 April 2023).
- Kapur, J.; Stika, K.M.; Westphal, C.S.; Norwood, J.L.; Hamzavytehrany, B. Prevention of potential-induced degradation with thin ionomer film. IEEE J. Photovolt. 2014, 5, 219–223. [Google Scholar] [CrossRef]
- Lausch, D.; Naumann, V.; Breitenstein, O.; Bauer, J.; Graff, A.; Bagdahn, J.; Hagendorf, C. Potential-induced degradation (PID): Introduction of a novel test approach and explanation of increased depletion region recombination. IEEE J. Photovolt. 2014, 4, 834–840. [Google Scholar] [CrossRef]
- Eyoh, I.; John, R.; De Maere, G. Interval type-2 intuitionistic fuzzy logic system for non-linear system prediction. In Proceedings of the 2016 IEEE International Conference on Systems, Man, and Cybernetics (SMC), Budapest, Hungary, 9–12 October 2016; pp. 1063–1068. Available online: https://ieeexplore.ieee.org/document/7844383 (accessed on 8 April 2023).
- Zhao, J.; Han, Z.; Pedrycz, W.; Wang, W. Granular model of long-term prediction for energy system in steel industry. IEEE Trans. Cybern. 2015, 46, 388–400. [Google Scholar] [CrossRef]
- Han, Z.; Jian, M.; Wang, G.G. ConvUNeXt: An efficient convolution neural network for medical image segmentation. Knowl.-Based Syst. 2022, 253, 109512. [Google Scholar] [CrossRef]
- Haar, L.V.; Elvira, T.; Ochoa, O. An analysis of explainability methods for convolutional neural networks. Eng. Appl. Artif. Intell. 2023, 117, 105606. [Google Scholar] [CrossRef]
- Sun, B.; Xu, Z.D.; Zhou, H. A multiple back propagation neural network fusion algorithm for ceiling temperature prediction in tunnel fires. Eng. Struct. 2023, 280, 115601. [Google Scholar] [CrossRef]
- Zimmermann, C.G. Electroluminescence imaging of III–V multijunction solar cells. In Proceedings of the 2010 35th IEEE Photovoltaic Specialists Conference, Honolulu, HI, USA, 20–25 June 2010; pp. 1783–1787. Available online: https://ieeexplore.ieee.org/document/5615896 (accessed on 8 April 2023).
- Ma, S.; Tong, R.; Wu, X.Y.; Li, Z.P.; Kong, X.Y.; Shen, W.Z. Effective way to reduce rear-side potential-induced degradation of bifacial perc solar cells. Sol. Energy Mater. Sol. Cells 2022, 239, 111687. [Google Scholar] [CrossRef]
- Wang, X.; Tian, X.; Chen, X.; Ren, L.; Geng, C. A review of end-of-life crystalline silicon solar photovoltaic panel recycling technology. Sol. Energy Mater. Sol. Cells 2022, 248, 111976. [Google Scholar] [CrossRef]
- Aghaei, M.; Fairbrother, A.; Gok, A.; Ahmad, S.; Kazim, S.; Lobato, K.; Oreski, G.; Reinders, A.; Schmitz, J.; Theelen, M.; et al. Review of degradation and failure phenomena in photovoltaic modules. Renew. Sustain. Energy Rev. 2022, 159, 112160. [Google Scholar] [CrossRef]
- Tsuda, I.; Igari, S.; Nakahara, K.; Takahisa, K.; Morita, K.; Kato, H. Long term reliability evaluation of PV module. In Proceedings of the 3rd World Conference on Photovoltaic Energy Conversion, Osaka, Japan, 11–18 May 2003; Volume 2, pp. 1960–1963. [Google Scholar]
- Daher, D.H.; Gaillard, L.; Ménézo, C. Experimental assessment of long-term performance degradation for a PV power plant operating in a desert maritime climate. Renew. Energy 2022, 187, 44–55. [Google Scholar] [CrossRef]
- Pescetelli, S.; Agresti, A.; Viskadouros, G.; Razza, S.; Rogdakis, K.; Kalogerakis, I.; Di Carlo, A. Integration of two-dimensional materials-based perovskite solar panels into a stand-alone solar farm. Nat. Energy 2022, 7, 597–607. [Google Scholar] [CrossRef]
- Yilmaz, P.; Aninat, R.; Cruz, G.O.; Weber, T.; Schmitz, J.; Theelen, M. Post-mortem analysis of a commercial Copper Indium Gallium Diselenide (CIGS) photovoltaic module after potential induced degradation. Prog. Photovolt. Res. Appl. 2022, 30, 640–647. [Google Scholar] [CrossRef]
- ibne Mahmood, F.; TamizhMani, G. Impact of different backsheets and encapsulant types on potential induced degradation (PID) of silicon PV modules. Sol. Energy 2023, 252, 20–28. [Google Scholar] [CrossRef]
- Sheng, H.; Wang, Z.; Yang, S.; Ye, S. Measurement of the effect of parasitic capacitance in minimum ignition energy spark generation circuits. J. Electrost. 2022, 119, 103752. [Google Scholar] [CrossRef]
- Chang, J.R.; Lin, Y.M.; Lo, C.H. A settling time model for testing potential induced degradation of solar cells. In Frontier Computing. Frontier Computing: Theory, Technologies and Applications (FC 2016); Yen, N., Hung, J., Eds.; Lecture Notes in Electrical Engineering; Springer: Singapore, 2018; Volume 422, pp. 79–85. [Google Scholar] [CrossRef]
- Kwok, T.Y.; Yeung, D.Y. Constructive algorithms for structure learning in feedforward neural networks for regression problems. IEEE Trans. Neural Netw. 1997, 8, 630–645. [Google Scholar] [CrossRef] [PubMed]
- Kohavi, R. A study of cross-validation and bootstrap for accuracy estimation and model selection. In Proceedings of the International Joint Conference on Artificial Intelligence (IJCAI), Montreal, QC, Canada, 20–25 August 1995; Volume 14, No. 2. pp. 1137–1145. [Google Scholar]
- Petitjean, F.; Webb, G.I.; Nicholson, A.E. Scaling log-linear analysis to high-dimensional data. In Proceedings of the 2013 IEEE 13th International Conference on Data Mining, Dallas, TX, USA, 7–10 December 2013; pp. 597–606. Available online: https://ieeexplore.ieee.org/document/6729544 (accessed on 8 April 2023).
- Mertik, M.; Lenic, M.; Stiglic, G.; Kokol, P. Estimating software quality with advanced data mining techniques. In Proceedings of the 2006 International Conference on Software Engineering Advances (ICSEA’06), Papeete, Tahiti, 29 October–3 November 2006; p. 19. Available online: https://ieeexplore.ieee.org/document/4031804 (accessed on 8 April 2023).
- Zhang, L.; Gao, T.; Cai, G.; Hai, K.L. Research on electric vehicle charging safety warning model based on back propagation neural network optimized by improved gray wolf algorithm. J. Energy Storage 2022, 49, 104092. [Google Scholar] [CrossRef]
- Bouaichi, A.; Merrouni, A.A.; El Amrani, A.; Jaeckel, B.; Hajjaj, C.; Naimi, Z.; Messaoudi, C. Long-term experiment on p-type crystalline PV module with potential induced degradation: Impact on power performance and evaluation of recovery mode. Renew. Energy 2022, 183, 472–479. [Google Scholar] [CrossRef]


Disclaimer/Publisher’s Note: The statements, opinions and data contained in all publications are solely those of the individual author(s) and contributor(s) and not of MDPI and/or the editor(s). MDPI and/or the editor(s) disclaim responsibility for any injury to people or property resulting from any ideas, methods, instructions or products referred to in the content. |
© 2023 by the authors. Licensee MDPI, Basel, Switzerland. This article is an open access article distributed under the terms and conditions of the Creative Commons Attribution (CC BY) license (https://creativecommons.org/licenses/by/4.0/).