Abstract
We explore the dynamics and determinants of volatility spillover between financial technology (FinTech) and the traditional financial industry (TFI). The total, directional, and net spillover indices are measured, and we further decompose volatility spillovers in a time–frequency framework. Economic fundamentals, risk contagion, and market attention are examined as potential determinants of volatility spillovers. We reveal that the total spillover index is time-varying and exhibits an inverse U-shape between 2017 and 2021. FinTech is a net volatility receiver in most cases, and exported volatility to the TFI during the COVID-19 pandemic. The long-term components are the main driving force of volatility spillovers based on the frequency domain decomposition. Meanwhile, the economic fundamental determinants are the main contributing factors of volatility spillovers, explaining over 60% of total spillover between FinTech and the TFI. The findings remain robust under different settings of forecasting horizons, lag lengths, and proxy of the risk contagion determinant.
Keywords:
FinTech; financial industry; volatility spillover; variance decomposition; economic fundamental variables; COVID-19 MSC:
91G45
1. Introduction
The spectacular growth of financial technology (FinTech), which describes the advances in technology that have the potential to transform the provision of financial services [1,2,3,4], has been altering the economic and financial landscape in recent years. Some well-known sectoral FinTech innovations include crowdfunding, mobile banks, digital currencies, and robo-advice [5,6,7]. Despite the COVID-19 pandemic, global FinTech investment reached USD 105.3 billion in 2020, nearly doubling the amount of investments in 2018 [8].
FinTech has shown great potential in financial inclusion [9,10] and production efficiency [11,12], but it may also amplify contagion and volatility in the market, which could threaten financial stability [13]. Abundant evidence has been found for contagion within the FinTech industry. For example, Cheng, et al. (2022) [14] confirmed the information contagion effect among crowdfunding platforms in China and revealed that all participants in crowdfunding are worse off due to the contagion. Caporale, et al. (2021) [15] found a significant dynamic linkage between three mainstream cryptocurrencies and asserted that cyber-attacks affected the contagion mechanism between cryptocurrency returns and volatilities.
It is not strange to witness FinTech companies expanding into traditional financial services. For instance, the micropayment market in China is dominated by several FinTech companies. The intermarket linkages between FinTech and the traditional financial industry (TFI) have also been investigated in several recent studies [16,17,18,19], which can be explained by the following reasons: (I) FinTech can compete with the TFI because they conduct similar business [20,21]. (II) An increasing number of traditional financial institutions employ FinTech innovations in the operational process [22,23]. (III) A growing trend in the merger and acquisitions between traditional financial and FinTech sectors has been observed [8,24]. Consequently, because of the interconnections, the risk inherent to the FinTech industry is likely to transmit to the TFI, possibly entailing systemic risk or even threatening financial stability [25], which has become an international phenomenon because of globalization resulting in increasingly close connections between financial markets in different countries, amplifying global systematic risks and calling for international cooperation on regulation. That means the intermarket linkages are worthy of the attention of regulators, which has been pointed out in previous studies. For instance, Li et al. (2020) [26] examined the risk spillovers between FinTech firms and traditional financial institutions and proposed to enhance the supervision and regulation of FinTech companies in order to maintain financial stability. Haddad, C. and Hornuf, L. (2022) [27] suggested that legislators and financial supervisory authorities should closely monitor the development of FinTech start-ups, because FinTech not only has a positive effect on the financial sector’s performance but also can improve financial stability.
FinTech is a complex and systematic project involving the participation of governments, markets, intermediary institutions, and other parties. It is necessary to understand the law of FinTech development from an ecological perspective, which calls for the construction of the FinTech ecosystem. According to Soloviev (2018a, 2018b) [28,29], the FinTech ecosystem is a collaboration among governments, financial institutions, and entrepreneurs. Lee et al. (2018) [30] highlighted that the basic elements of the FinTech ecosystem include FinTech startups, technology developers, government organizations, clients, and traditional financial institutions. Although the FinTech ecosystem is characterized as being transformative [31], the pattern of FinTech is still dependent on sudden shocks. The COVID-19 pandemic has affected the financial system dramatically and reshaped the landscape of finance [32,33,34,35,36]. Ji, et al. (2022) [37] proved the existence of contagion effects across financial markets in crisis. Bao and Huang (2021) [38] revealed that the delinquency rate of FinTech loans tripled after the pandemic, whereas no obvious delinquency rate surges were observed for commercial banks. Lucey, et al. (2021) [39] established a new cryptocurrency uncertainty index that reflects the uncertainty of cryptocurrency prices. They further revealed that the uncertainty of cryptocurrency policy and the index exhibited distinct movements around the outbreak of COVID-19. Some scholars examined the implications of COVID-19 on hedge and portfolio diversification for some FinTech products. Concretely, Diniz-Maganini, et al. (2021) [40], Belhassine and Karamti (2021) [41], and Kamran, et al. (2022) [42] found that FinTech products such as Bitcoin can offer safe haven and hedging benefits in certain circumstances. Such studies indicate that the COVID-19 pandemic provided the discussion on the safe-haven property of FinTech assets with a new context and framework.
Similar research on this topic has been conducted, such as Chen, et al. (2022) [43], who explored the volatility spillover dynamics between a FinTech ETF and the ETFs of the TFI with an empirical network model, and Li, et al. (2020) [26], who estimated pairwise volatility spillover between FinTech firms and traditional financial institutions in the U.S. However, both employed a sample of the U.S. market and ignored China’s financial market, even though China is emerging as a leading FinTech market globally [44]. In terms of the overall ranking of FinTech Development Index released by Sinan Institute of Academy of Internet Finance in Zhejiang University, China, with its huge advantage in application dimension, surpassed the United States, taking the first place in the world, which shows a strong growing trend of China’s FinTech industry globally [45]. In addition, a study of British think tank New Financial reveals that China is the third largest financial center in the world in 2021 [46], indicating that China’s financial system has become an important part of the global financial system. As China’s FinTech industry and financial system occupy important places worldwide, volatility spillover dynamics and determinants between FinTech and traditional financial industry in China is worthy of further exploration. Moreover, the existing literature failed to cover the period of the COVID-19 pandemic, during which FinTech has developed rapidly and the landscape of traditional finance has been reshaped, possibly influencing the spillover patterns between them. In addition, previous studies hardly discussed the underlying determinants of volatility spillovers, making it difficult to distinguish the potentially different spillover patterns between FinTech and TFI. To bridge these research gaps, our study contributes to the existing literature in three aspects: first, we analyze the volatility spillover effect between FinTech and the TFI in China during the COVID-19 crisis. This study complements prior studies by covering a different set of assets and times. Second, instead of solely providing the total volatility spillover index [43], this study integrates two variance–decomposition-based spillover measurement frameworks, namely Diebold and Yilmaz (2012) (DY) [47] and Baruník and Křehlík (2018) (BK) [48] to present a comprehensive measurement of volatility spillover, which is a methodological innovation. Finally, we examine the determinants of the total and decomposed dynamic volatility spillover. Specifically, we consider three types of determinants, namely economic fundamentals, risk contagion, and market attention, from theoretical and empirical perspectives.
To summarize what has been discussed above, we aim to explore two research questions in this paper: (I) What are the spillover patterns between FinTech and the TFI? That is to say, we want to figure out whether FinTech is a volatility exporter or receiver to TFI and the frequency-based spillover dynamics between FinTech and TFI; (II) what are the potential determinants of volatility spillover? To answer these questions, we initially employ DY and BK frameworks to explore the effects of volatility spillover between FinTech and TFI based on stock returns of a sample of financial institutions and FinTech firms in China’s A-Shares market, which is the largest and the most representative stock market of China. The research period is from June 2017 to October 2021, covering the fast growth of FinTech and the COVID-19 crisis. We then employ regression models to examine the role of possible underlying determinants in volatility spillover between FinTech and the TFI.
The remainder of this paper is organized as follows: Section 2 introduces the methodology. Section 3 describes the data with some preliminary analysis. Section 4 presents the empirical findings. Finally, Section 5 concludes the paper and presents some implications for market participants and policymakers.
2. Literature Review
2.1. The Interconnectedness of FinTech
FinTech has offered new opportunities and challenges to many other industries as an emerging industry. As a result, the interconnectedness of FinTech has been examined from cross-region, cross-market, or cross-industry perspectives.
Alshater et al. (2022) [49] investigated the connectedness among four regional FinTech indices in a cross-region view. The empirical results revealed the role of FinTech in Asia-Pacific as a spillover receiver. In the era of connectedness, the connectedness between FinTech and other markets, such as green assets [18,50], cryptocurrency [18], energy [51], and ESG [52], has also been explored in several recent studies. Most of the counterparty markets are emerging and expected to gain support from the development of FinTech. However, the conclusions in these studies cannot agree on whether FinTech is a spillover receiver or exporter. From a cross-industry perspective, there is connectedness between FinTech and the artificial intelligence industry. The rationale behind this is the ongoing fourth industrial revolution (FIR). Both FinTech and the artificial intelligence industry are representative innovates in FIR. For example, Abakah et al. (2023) [53] analyzed the connectedness between FinTech and the artificial intelligence industry and confirmed their potential safety-haven properties. The connectedness of FinTech and TFI has also been examined in several recent studies. Pacelli et al. (2022) [54] examined the extreme connectedness between FinTech and TFI (or, more specifically, the banking sector) in the case of Europe and assured the extreme risk spillover within the financial system. Bhatnagar et al. (2022) [55] examined the interconnectedness of FinTech industry in a firm-level. In study of Chen et al. (2022) [43], the effect of return and volatility spillovers between FinTech and TFI are uncovered via a DY approach. However, the previous studies did not perform in the context of China, regardless of the rapid development of China’s FinTech industry in recent years.
Interestingly, the interconnectedness of FinTech during extreme periods has been paid special attention. Researchers either conducted a robustness check [18] or a subsample analysis [49,51] of major events, such as the COVID-19 pandemic and the Russia–Ukraine conflict. This is reasonable since high uncertainty may boost the volatility of financial assets and, thus, fuels intense connectedness across assets [18]. Most of these studies demonstrated a clearly different pattern of connectedness during extreme periods, which encourages us to consider the major events as potential drivers of volatility connectedness between FinTech and TFI in this study.
2.2. The Measurement Approaches of Connectedness
A bundle of measurement approaches has been proposed to evaluate the connectedness quantitively, including the wavelet coherence analysis (WCA), Generalized AutoRegressive Conditional Heteroskedasticity (GARCH)-based methods, and the Vector Auto-Regression (VAR)-based approaches.
WCA can be employed to analyze the coherence relationship between two time series regardless of stationarity. The merit of handling non-stationary data enriches the application field of WCA. Moreover, WCA can simultaneously perform time- and frequency-domain analysis. Although WCA has been applied in Urom (2023) [50] to analyze the connectedness between FinTech and green assets, it can seldom provide insight into directional or pairwise connectedness.
GARCH-based methods are a family of parameterized models that explain the connectedness between assets via the dynamic structure of the conditional covariance. The straightforward interpretation of the results explains why GARCH-based methods have been extensively applied in measuring the interconnectedness of FinTech [49,52]. However, one of the main disadvantages of GARCH-based methods is similar to WCA: it cannot reflect the directional spillover from one asset to another.
Diebold and Yilmaz (2012) [47] initially proposed the VAR-based approaches (DY approach). The basic idea of VAR-based approaches is to measure the connectedness according to the contribution of spillovers to the total forecast error variance. Baruník and Křehlík (2018) [48] extended the DY approach by simultaneously capturing the time and frequency dynamics of connectedness (BK approach). Moreover, the VAR-based approaches can also provide directional spillovers via the sliding window estimation. The superiority of VAR-based approaches attracts researchers to adopt them in measuring the interconnectedness of FinTech [18,49,51]. We will elaborate on the technical details of DY and BK approaches in the next section.
3. Research Methodology
3.1. DY Spillover Measurement Framework
We initially employ the DY spillover measurement model to start our analysis and measure the spillover effect between FinTech and the TFI. DY framework introduces a variance decomposition method into the vector autoregression (VAR) model that focuses on computing the forecast error variance decomposition (FEVD) from a generalized VAR that eliminates possible dependence of the results on ordering. The advantage of the spillover model in DY is that it allows the net pairwise spillovers to conduct analyses of their effects on FinTech and the traditional financial industry [43]. An N-variable VAR(p) system is depicted as follows:
where is assumed to be independently and identically distributed. indicates the variance matrix for . The moving average representation of Equation (1) is , where is a coefficient matrix that obeys the recursion , with being an identity and for . Diebold and Yilmaz (2012) [47] used FEVD within the generalized VAR framework to examine the degree to which each variable contributes to other variables in explaining the variation across the variables (i.e., spillovers). Formally, H-step-ahead FEVD can be denoted as follows:
where is the standard deviation of the error term for the j-th equation and is the selection vector assigned one as the i-th element and zeros otherwise. To ensure that the sum of elements in each row of the variance decomposition matrix equals to 1, Diebold and Yilmaz (2012) [47] normalized the elements by
Therefore, the total spillover index (TSI) can be computed as
which measures the contribution of spillover shocks across the major markets or assets to total forecast error variance. We can further extend TSI to derive the directional spillovers, which measure the direction of spillover across markets or assets. Concretely, the directional spillovers index (DSI) received by market (asset) i from all other markets (assets) j is computed as
The DSI transmitted by market (asset) i from all other markets (assets) j is represented as
The DSI can be further used to derive the net spillover index (NSI), which measures the net spillover of a single market to other markets [47,56,57,58,59] from the market (asset) i to all other markets (assets) by the difference between gross shock transmitted to and received from all other markets (assets), namely
Equation (6) provides only the summary information on the contribution of each market (asset) to the other markets (assets) in terms of forecast error variance. Diebold and Yilmaz (2012) [47] proposed a net pairwise spillovers index (NPSI) to examine the spillover effect between two markets or assets. The NPSI, which is defined as the difference between gross shocks transmitted from market i to j and those transmitted from j to i, is calculated as follows:
3.2. BK Frequency Domain Spillover Measurement Framework
Baruník and Křehlík (2018) [48] extended the DY framework by decomposing the original DY spillover index at multiple frequencies via a spectral representation. Specifically, we consider a frequency response function , which can be obtained as a Fourier transformation of the impulse response , and i is an imaginary unit. With the spectral representation, the generalized causation spectrum over frequencies is defined as follows:
where can be interpreted as the portion of the spectrum of the j-th market (asset) at frequency band as a result of shock in the k-th market (asset). We employ a weighting function to weight by the frequency share of the variance to further derive a natural decomposition of variance decompositions to frequencies. The weighting function is formulated as follows:
Equation (10) denotes the power of the j-th market (asset) at a given frequency. Formally, let us define the frequency band as ; the generalized variance decomposition under is
In an analogy to Equation (3), the previous equation can be normalized as follows:
where . Similar to Equations (4)–(8), we can calculate the TSI, DSI, NSI, and NPSI on frequency band .
3.3. Determinants of Volatility Spillover between FinTech and Traditional Financial Industry: Conceptual Framework and Empirical Analysis
We aim to establish a conceptual framework that will serve as the theoretical explanation of volatility spillover between FinTech and the TFI. To summarize, there are three types of potential determinants, including economic fundamental, risk contagion, and market attention determinants.
The role of economic fundamental determinants in explaining spillover can be described as follows. First, the rapid development of information technology not only accelerated the progress of FinTech, but also tightened the ties of economic and financial markets around the world and enhanced their interdependence, resulting in economic globalization and financial integration, which possibly promoted the connectedness between FinTech and traditional financial industry. Second, according to the Theory of Economic Man [60] and Portfolio Theory [61], the business cycle and exogenous shocks can affect investors’ belief in uncertainty and risk aversion, which will finally affect stock volatility. To be more specific, when an economy is in deep recession, companies will face higher risks of profit decline or even loss. The stock index may fall sharply and under the influence of investors’ pessimism, the volatility spillover between stock markets may increase. Corradi, et al. (2013) [62] and Engle, et al. (2013) [63] found that stock volatility is largely dependent on the macroeconomic determinants. The effects of the business cycle and exogenous shocks can even propagate across sectors. When uncertainty increases, investors may rebalance their portfolios by increasing exposures to low-risk traditional financial sectors and decreasing the holdings of high-risk FinTech stocks. Furthermore, major political [64,65], financial [66], and natural events [17,67,68] are found to increase volatility in the stock market and FinTech market, probably resulting in volatility spillover between the two markets.
Risk contagion causes developed by King and Wadhwani (1990) [69] originate from the Efficient Markets Hypothesis. In an efficient market, all information is transmitted perfectly, and the stock price reflects all available information. However, when the market is not fully efficient, rational investors can observe price changes, but they cannot obtain all the information that leads to these changes, so they have to collect and infer information from other markets when making investment decisions. Consequently, price changes in one market can have an impact on another market in the absence of changes in economic fundamentals, and idiosyncratic changes may be contagious across markets. The market contagion model constructed by King and Wadhwani (1990) [69] provides a channel through which a “mistake” in one market can be transmitted to other markets, providing explanation for the intermarket volatility spillover. Owing to increased interconnectivity with the digital revolution, global investments in FinTech are growing rapidly year by year, forming competitive and cooperation relationships between FinTech and traditional financial institutions [70,71,72]. FinTech is expansive, engulfing a plethora of innovative applications in various services including payments, financing, asset management, insurance, etc. [73]. Therefore, the connection between FinTech markets and traditional financial markets can be quite close, creating a precondition for risk contagion across markets.
Traditional models usually assume that when information emerges, stock prices instantly absorb the latest one. This happens only when market participants pay sufficient attention to the information. But as a matter of fact, market participants may only pay limited attention to the markets, which affects asset prices in a certain way [74,75,76]. Investors’ attention can cause changes in investors’ sentiment [77], which has been found to be related to stock return volatility in research of behavioral finance [78,79,80]. Andrei and Hasler (2015) [81] proposed a theoretical framework to show that investor’s attention and market uncertainty are crucial determinants of asset prices. They revealed a lead–lag relation between investors’ attention and uncertainty, and the relation spurred panic states, during which asset price is sensitive to news. Concretely, they found that when investors’ attention is emphasized to news, information is easily inferred and quickly incorporated into asset price, leading to a high fluctuation in price. On contrary, when a certain asset hardly grasps investors’ attention, the information is slowly incorporated into the asset price, resulting in low volatility of asset price. The relationship between investor attention and stock market volatility has drawn widespread attention [82,83,84,85]. Market attention determinants have also been confirmed empirically in various markets, such as the bond market [86], the currency market [87], and cryptocurrency market [88,89,90], which is related to FinTech. The volatility caused by participants’ attention in different markets may spill over into each other.
To confirm the validity of the proposed conceptual framework, we regress the estimated TSI between FinTech and the TFI described in Section 2.1 on three types of potential determinants. If the determinants can predict current and future volatility spillovers, we regard them as drivers of volatility spillovers in the view of Granger causality. We follow Yang and Zhou (2017) [66] to specify the regression models as follows:
where , , and denote the economic fundamental, risk contagion, and market attention determinants on day t, respectively. and imply the total spillover index and net spillover index on day t, respectively.
We subsequently consider the following regression models to explore the determinants of volatility spillover under different frequencies:
where the subscripts S, M, and L indicate the short-, medium-, and long-term TSI, respectively. Please note that because the following equation holds based on the frequency decomposition model described in Section 2.2: , the following relation between the OLS estimate on a certain type of determinant in Equation (14) and those of Equations (15)–(17) can be depicted as follows:
where . The estimated slope coefficients in Equations (15)–(17) may ascertain the potential heterogeneous effects of determinants on volatility spillover between FinTech and the TFI in China, which is expected to provide a deeper understanding of the driving forces of volatility spillover.
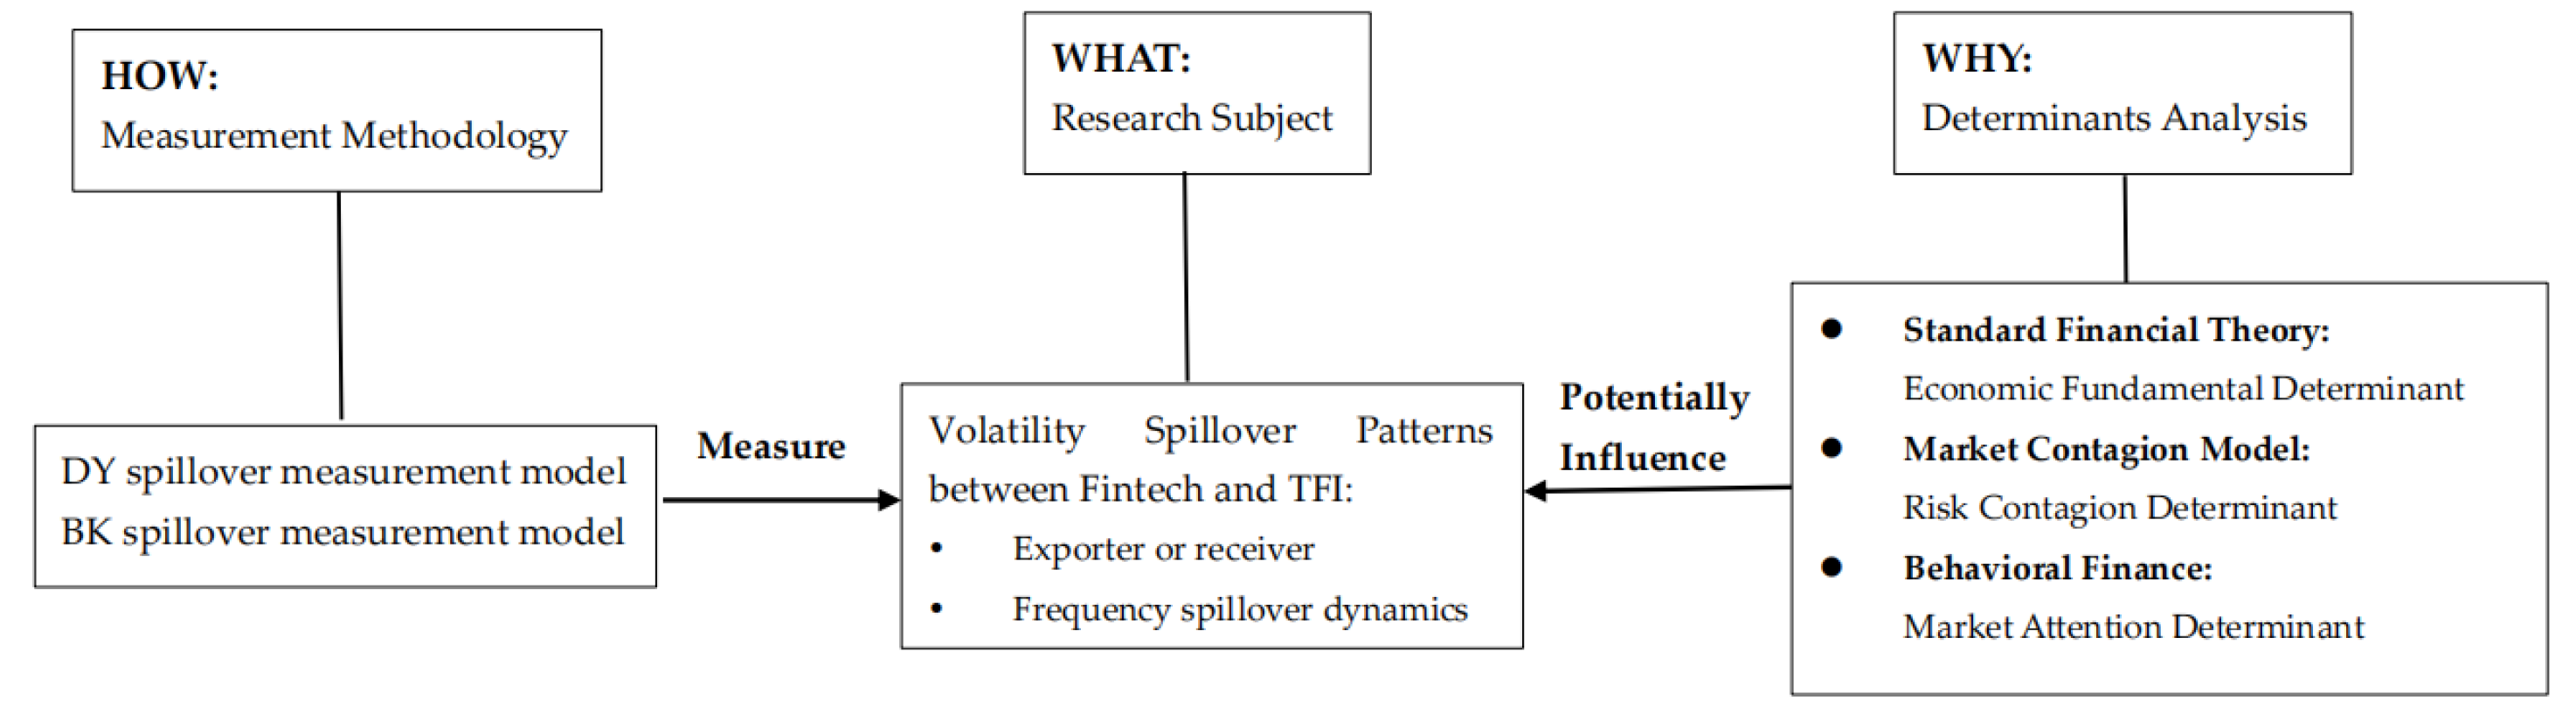
The theoretical framework of this study has been shown in Figure 1.
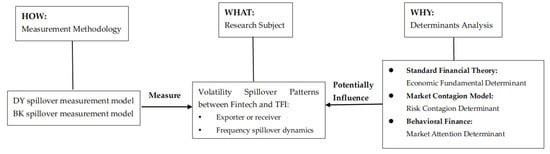
Figure 1.
Theoretical framework.
4. Data
We use daily data from 9 June 2017 to 30 October 2021 to examine the spillover effect between FinTech and the TFI in China. As for FinTech parameters, we employ the CNI Xiangmi Lake FinTech Index (399699, abbreviated as FinTech) as FinTech parameters, which is the first publicly released and representative stock index that reflects the development of China’s FinTech industry. It takes FinTech enterprises whose stocks traded on the Shanghai and Shenzhen Stock Exchange that meet the criteria to constitute the index samples, and mainly selects listed companies whose business fields are in the FinTech industry and subsectors such as distributed technology, Internet technology, financial safety, and Internet finance. In terms of the industry distribution of constituent stocks of the CNI Xiangmi Lake FinTech Index, the information technology industry covers the largest proportion, accounting for 77.44% by the end of June 2023. Of all the constituent stocks, only four relate to finance, whose companies’ main business domains include information technology, digital finance, and software service, different from traditional finance.
We also need to define the scope of the TFI and classify it into sub-sectors to perform a comprehensive analysis. According to official statistics of the People’s Bank of China, traditional financial industry mainly consists of banking industry, insurance industry, and security industry [91]. Diversified finance is a mixed system of multiple different forms and types of financial products, services, and institutions, experiencing rapid growth in recent years. Therefore, we select four indices referring to the second-level SWS index, namely SWS Banking Subsector Index (801192, abbreviated as Banking), SWS Insurance Subsector Index (801194, abbreviated as Insurance), SWS Securities Subsector Index (801193, abbreviated as Security) and SWS Diversified Financials Subsector Index (801191, abbreviated as Diversified) to track the performance of the TFI. There is hardly any overlap between the constituents of the indices representing TFI and the CNI Xiangmi Lake FinTech Index, separating FinTech from traditional finance. All these daily data on these indices are collected from Wind Financial Terminal.
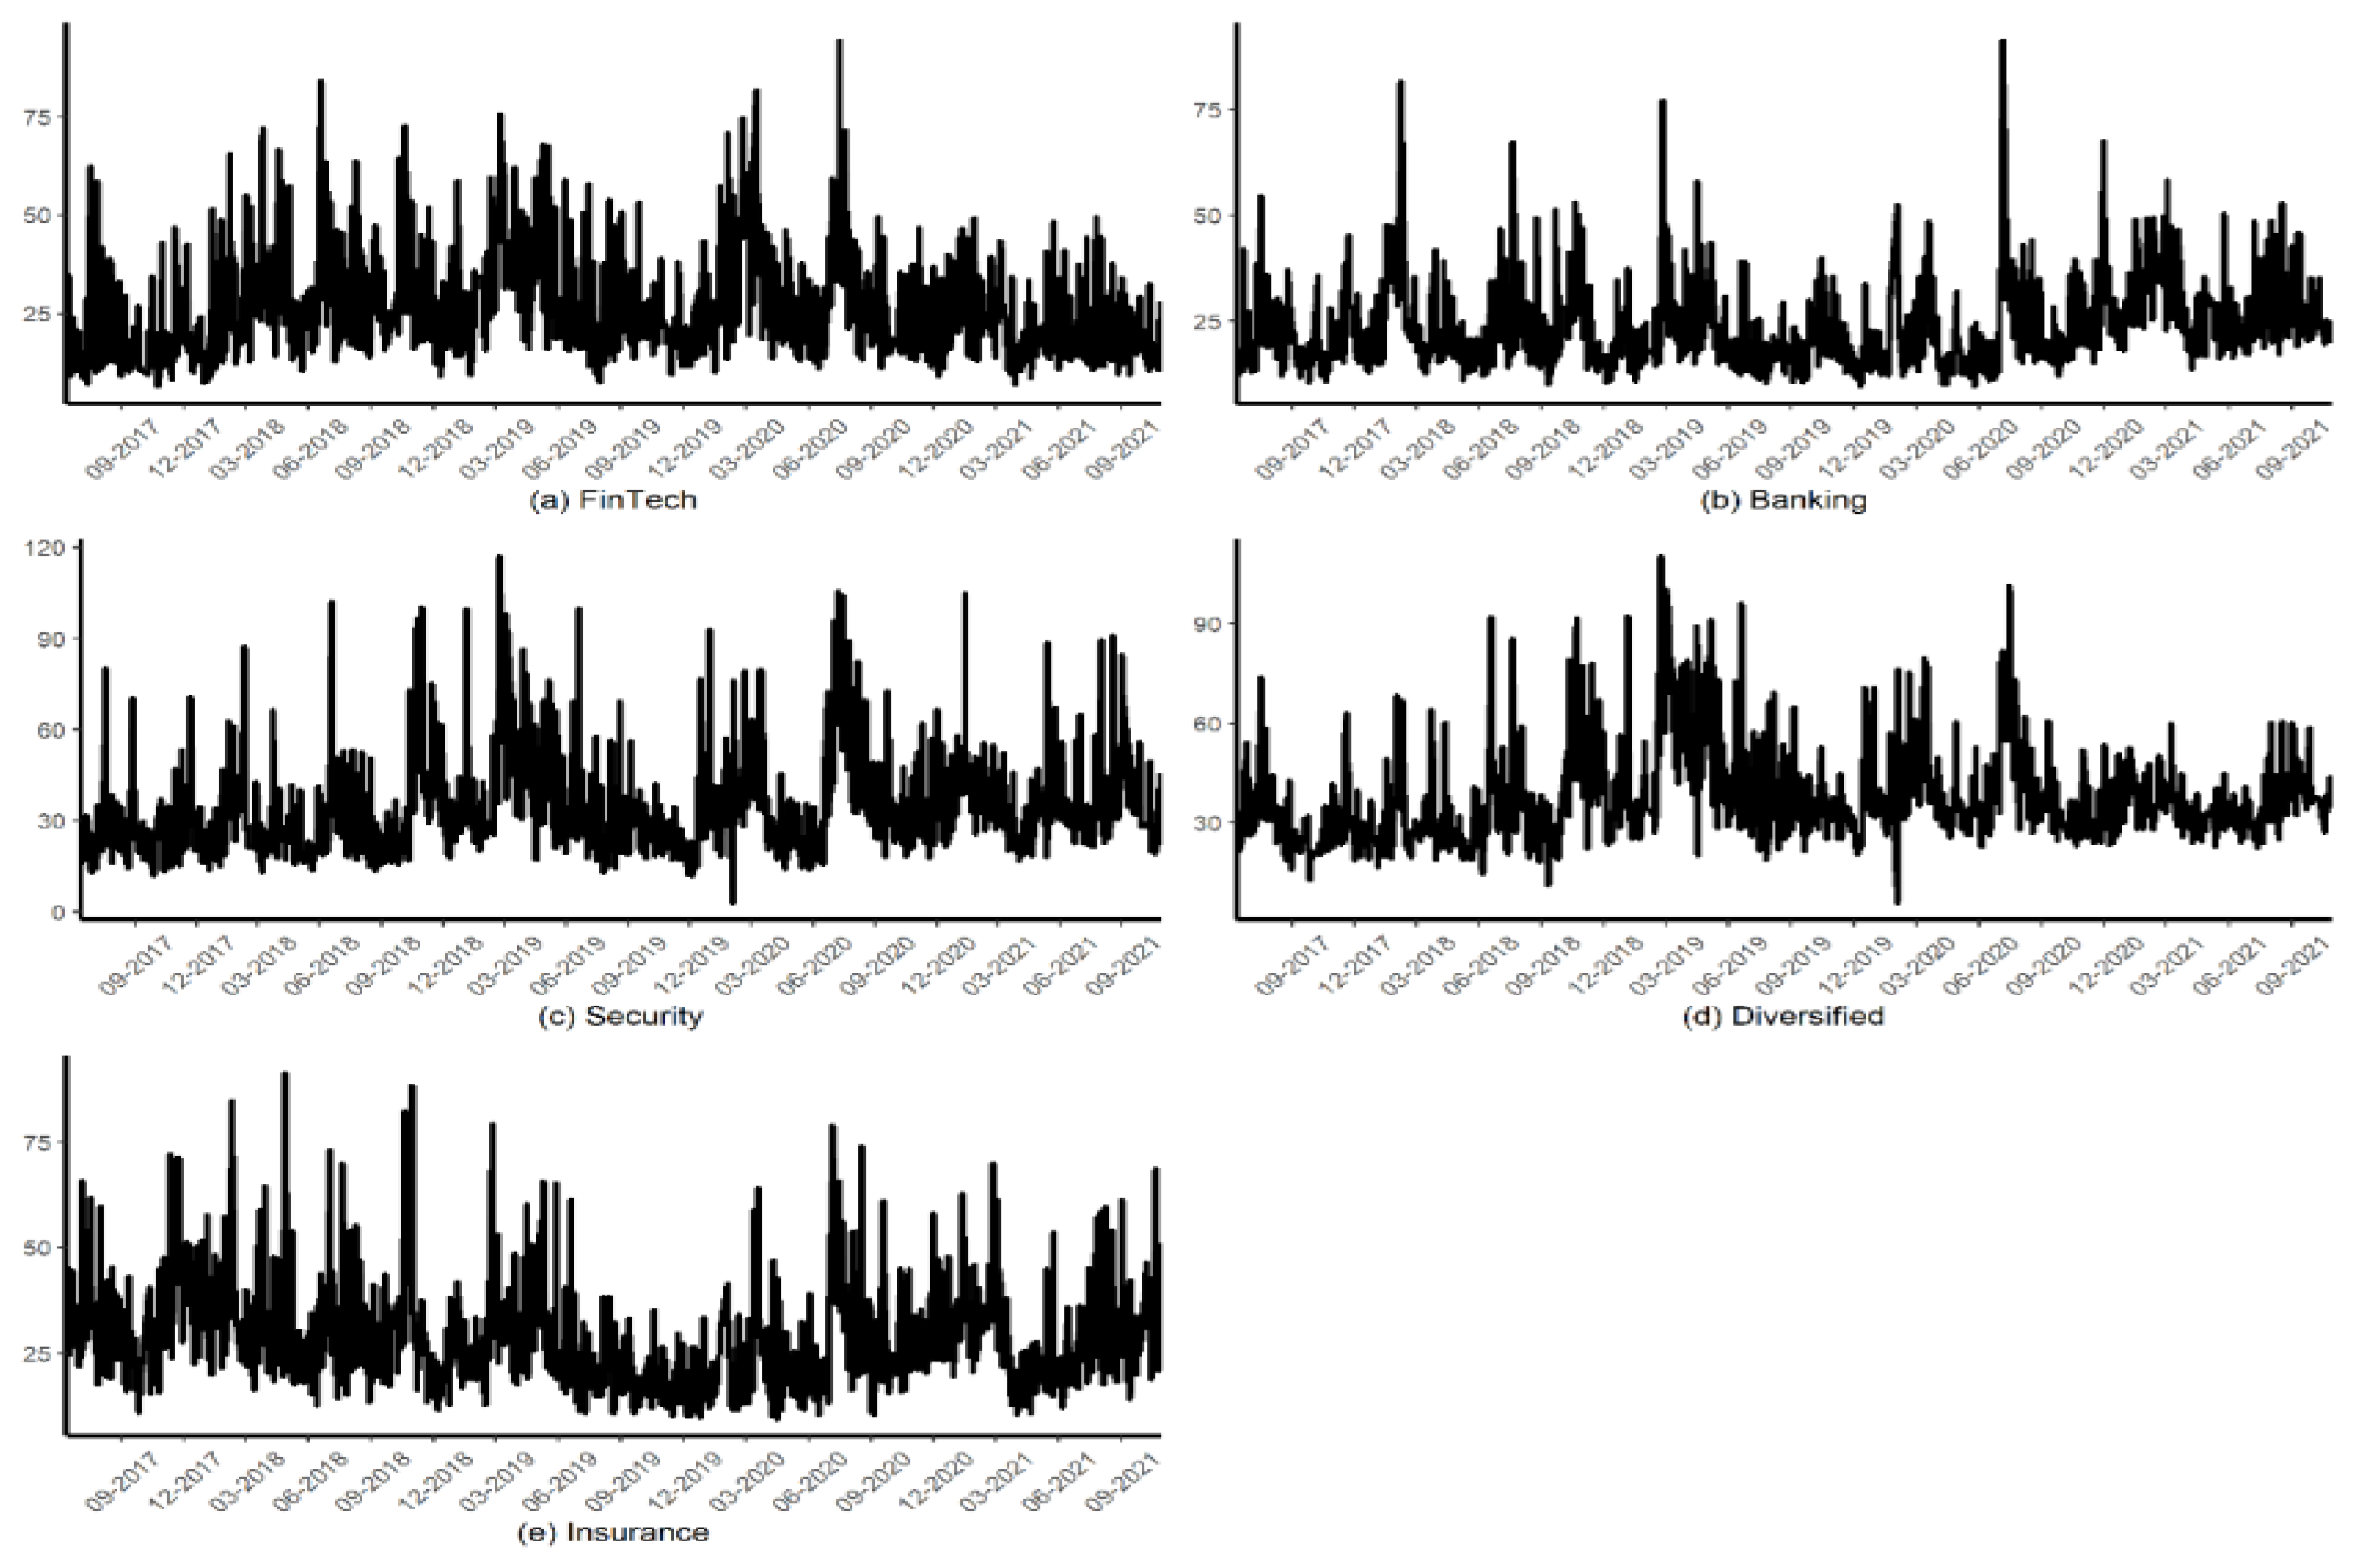
Following Diebold and Yilmaz (2012) [47] and Le, et al. (2021) [18], we use daily variance as a proxy of daily volatility. For asset on day , the daily variance is formulated as follows:
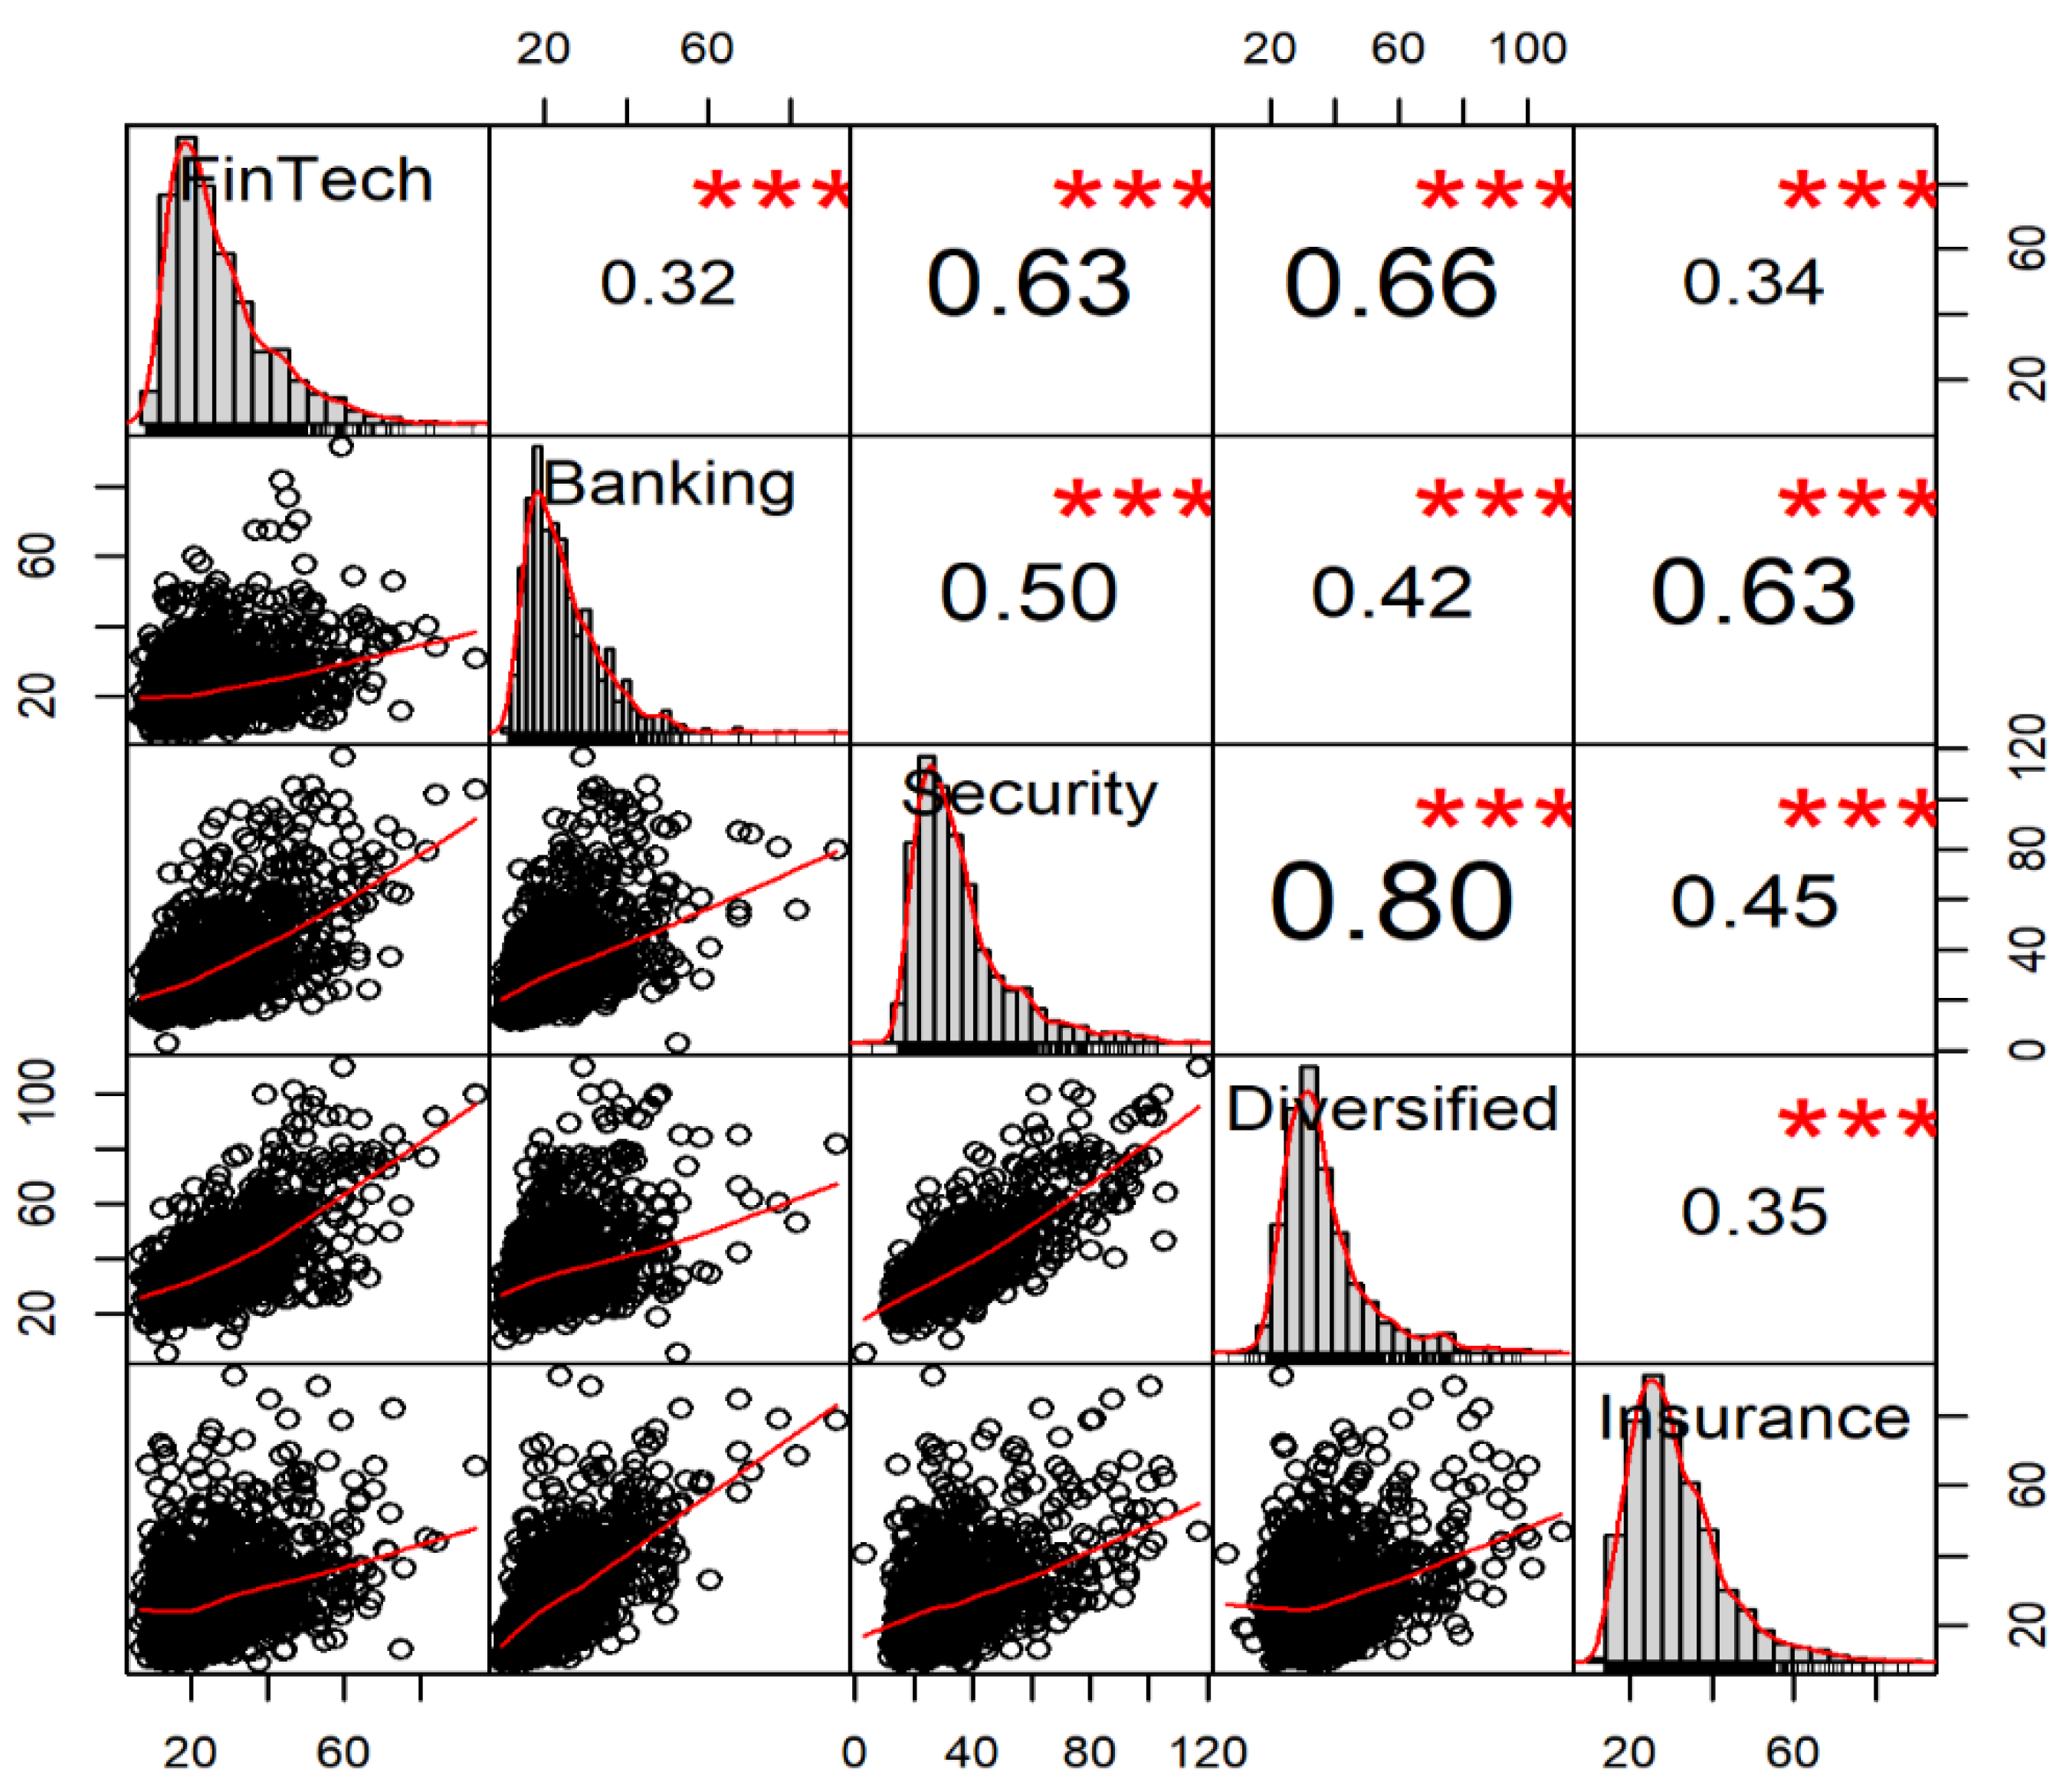
where and indicate the highest and lowest prices in asset on trading day , respectively. can be transformed to annualized daily percent standard deviation (volatility) by . The volatilities of FinTech, Banking, Insurance, Security, and Diversified are plotted in Figure 2, and Figure 3 displays the overall distribution together with the pairwise correlation between the volatilities under examination. We also present descriptive statistics for volatilities under examination in Table 1. Because the spillover index is computed within a VAR framework, the augmented Dickey–Fuller (ADF) test is performed to examine the stationarity for the data. We can summarize several interesting facts, including (1) each index exhibits great variability during the sample period, especially facing a crisis (e.g., COVID-19 pandemic); (2) volatility persistence is observed, which is consistent with recent studies, such as Abakah, et al. (2022) [92]; (3) the Security and Diversified indices are the most volatile, and FinTech index is less volatile. This finding is in line with the finding revealed in Le, et al. (2021) that KBW NASDAQ financial technology index is less volatile than the US dollar and oil [11]; (4) volatilities under examination do not follow Gaussian distribution as shown in Figure 3 and Table 1; (5) the highest correlation between FinTech and other indices is the pair of FinTech and diversified financials, achieving 0.66 followed by the pair of FinTech and Security index; and (6) the results shown in the last row of Table 1 imply that all volatility series are stationary.
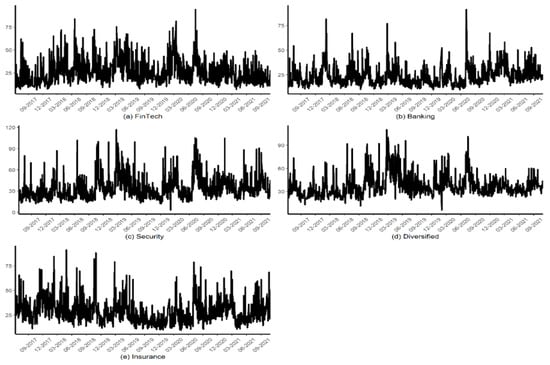
Figure 2.
Volatility dynamics of (a) FinTech, (b) Banking, (c) Security, (d) Diversified, and (e) Insurance indices from 9 June 2017 to 30 October 2021.
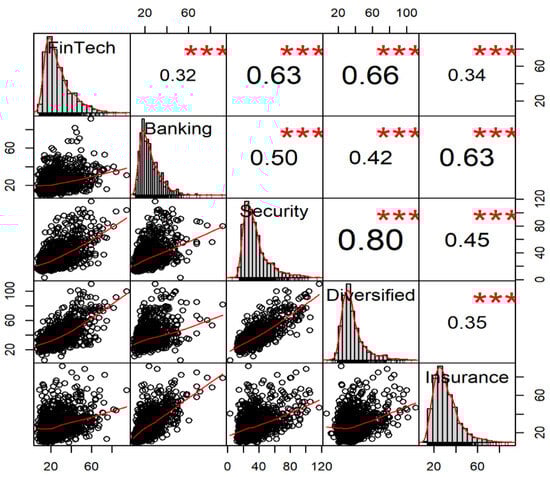
Figure 3.
Plot of distribution and pairwise correlation among FinTech, Banking, Security, Diversified, and Insurance indices. The circles present the data of volatility, and the red lines nearby are fitted with the data. The red lines in the histograms show the Kernel density estimation. Symbol *** denotes the significance at 1% level.

Table 1.
Descriptive statistics for volatilities of FinTech, Banking, Security, Diversified, and Insurance indices.
We collect a variety of proxy variables of three types of potential determinants from the perspective of economic fundamentals, risk contagion, and market attention determinants to identify the determinants of volatility spillover between FinTech and the TFI. It is noteworthy that the economic fundamental used in some prior studies are typically collected at a monthly or even lower frequency [56,93]. We consider daily variables to better reflect the dynamics of volatility spillover and meet the requirement of daily NSI. The determinants are as follows:
- (I)
- Economic fundamental determinants. The first type of economic fundamental determinant is the macroeconomic variable, which captures the status of the economic and financial environment. The following variables are selected after considering the limited number of macroeconomic variables available in China.
- USD to CNY exchange rate (ER). Theoretically, changes in exchange rates tend to influence a firm’s foreign operation and profit, which will finally affect its stock price. The dynamic relationship between the exchange rate and the stock market has also been confirmed in emerging countries [94,95].
- China financial condition index (CFCI). CFCI reflects the financial condition, financing accessibility, and measures that the monetary policy is either expansionary or contractionary. A high CFCI indicates a contractionary monetary policy, whereas a low CFCI implies the opposite case. Abundant evidence has shown that monetary policy is a critical driver of volatility spillover across markets [96,97]. We use the daily CFCI developed by CBN Research Institute.
- The second type of economic fundamental determinant is related to major events (ME). The COVID-19 pandemic is a very major event between 2017 and 2021 and was found to cause an increase stock market volatility dramatically [67]. We use a dummy variable to represent the COVID-19 pandemic. Concretely, China’s COVID-19 outbreak period (1 December 2019 to 28 April 2020, defined by Fighting COVID-19: China in Action) is denoted as 1, and the remaining observations are labeled as 0.
- (II)
- Risk contagion determinant. Risk contagion determinant is valid when increments and decrements in the same direction are observed in markets volatility and volatility spillovers. Inspired by Jiang, et al. (2022) [98], we employ weighted average volatility (WAV) of FinTech, Banking, Security, Diversified, and Insurance indices as a proxy of risk contagion.
- (III)
- Market attention determinant. The growing literature has built theoretical framework and empirical models to demonstrate market attention, which is uncorrelated with fundamentals and has a great effect on the volatility spillover of a financial asset [81,87]. Market attention is typically measured by the Google search volume index (GSVI) in previous studies, which was proposed by Da et al. (2011) [99], who argued that search activity is a revealed attention measure. For instance, if an individual searches for a certain stock in Google, she is interested in the stock and pays attention on it. However, because local retail investors account for a major part of trading volume in China’s stock market, we employ the Baidu index, a type of search volume index similar to GSVI, which is powered by the most used search engine in China. The Baidu index shows the search volumes for certain keywords over a given period. Because we focus mainly on the volatility spillover between the TFI and FinTech in China, we search keywords of “banking” , “security” , “insurance”, “diversified financials” and “FinTech” in Chinese and sum up the daily search volumes (DSV) of the keywords as a proxy of market attention.
Table 2 shows the daily correlation matrix for regression variables. Some highlights of the correlation between TSI and determinants can be found. Consistent with the theoretical analysis, the three types of determinants are correlated with TSI at a 5% significance level.
Table 2.
Daily correlations among TSI and potential determinants.
5. Empirical Analysis
In this section, we first investigate the TSI among FinTech, Banking, Security, Diversified, and Insurance indices to capture the dynamics of spillover between FinTech and the TFI. Therefore, we analyze the spillover between pairwise industries with DSI and NSI measures, which is expected to clarify which subsector is the most significant volatility spillover exporter or receiver. We then decompose the volatility indices in the frequency domain to explore the potential heterogeneity of spillover in the short, medium, and long run. It is noteworthy that we employ a fixed lag length of 5 for the VAR model. Moreover, we follow Su (2020) [56] to adopt a 100-day ahead horizon for FEVD computing and 200-day rolling windows to estimate the spillover index (to examine the robustness of the results, we try other settings for lag length (3 and 4) and rolling window (20 and 50). No significant difference is observed for the comparison with the original setting, as suggested by Diebold and Yilmaz (2012) [47] and Su (2020) [56]. The results are discussed in Section 5.5). Finally, we analyze the determinants of spillover dynamics.
5.1. TSI Dynamics
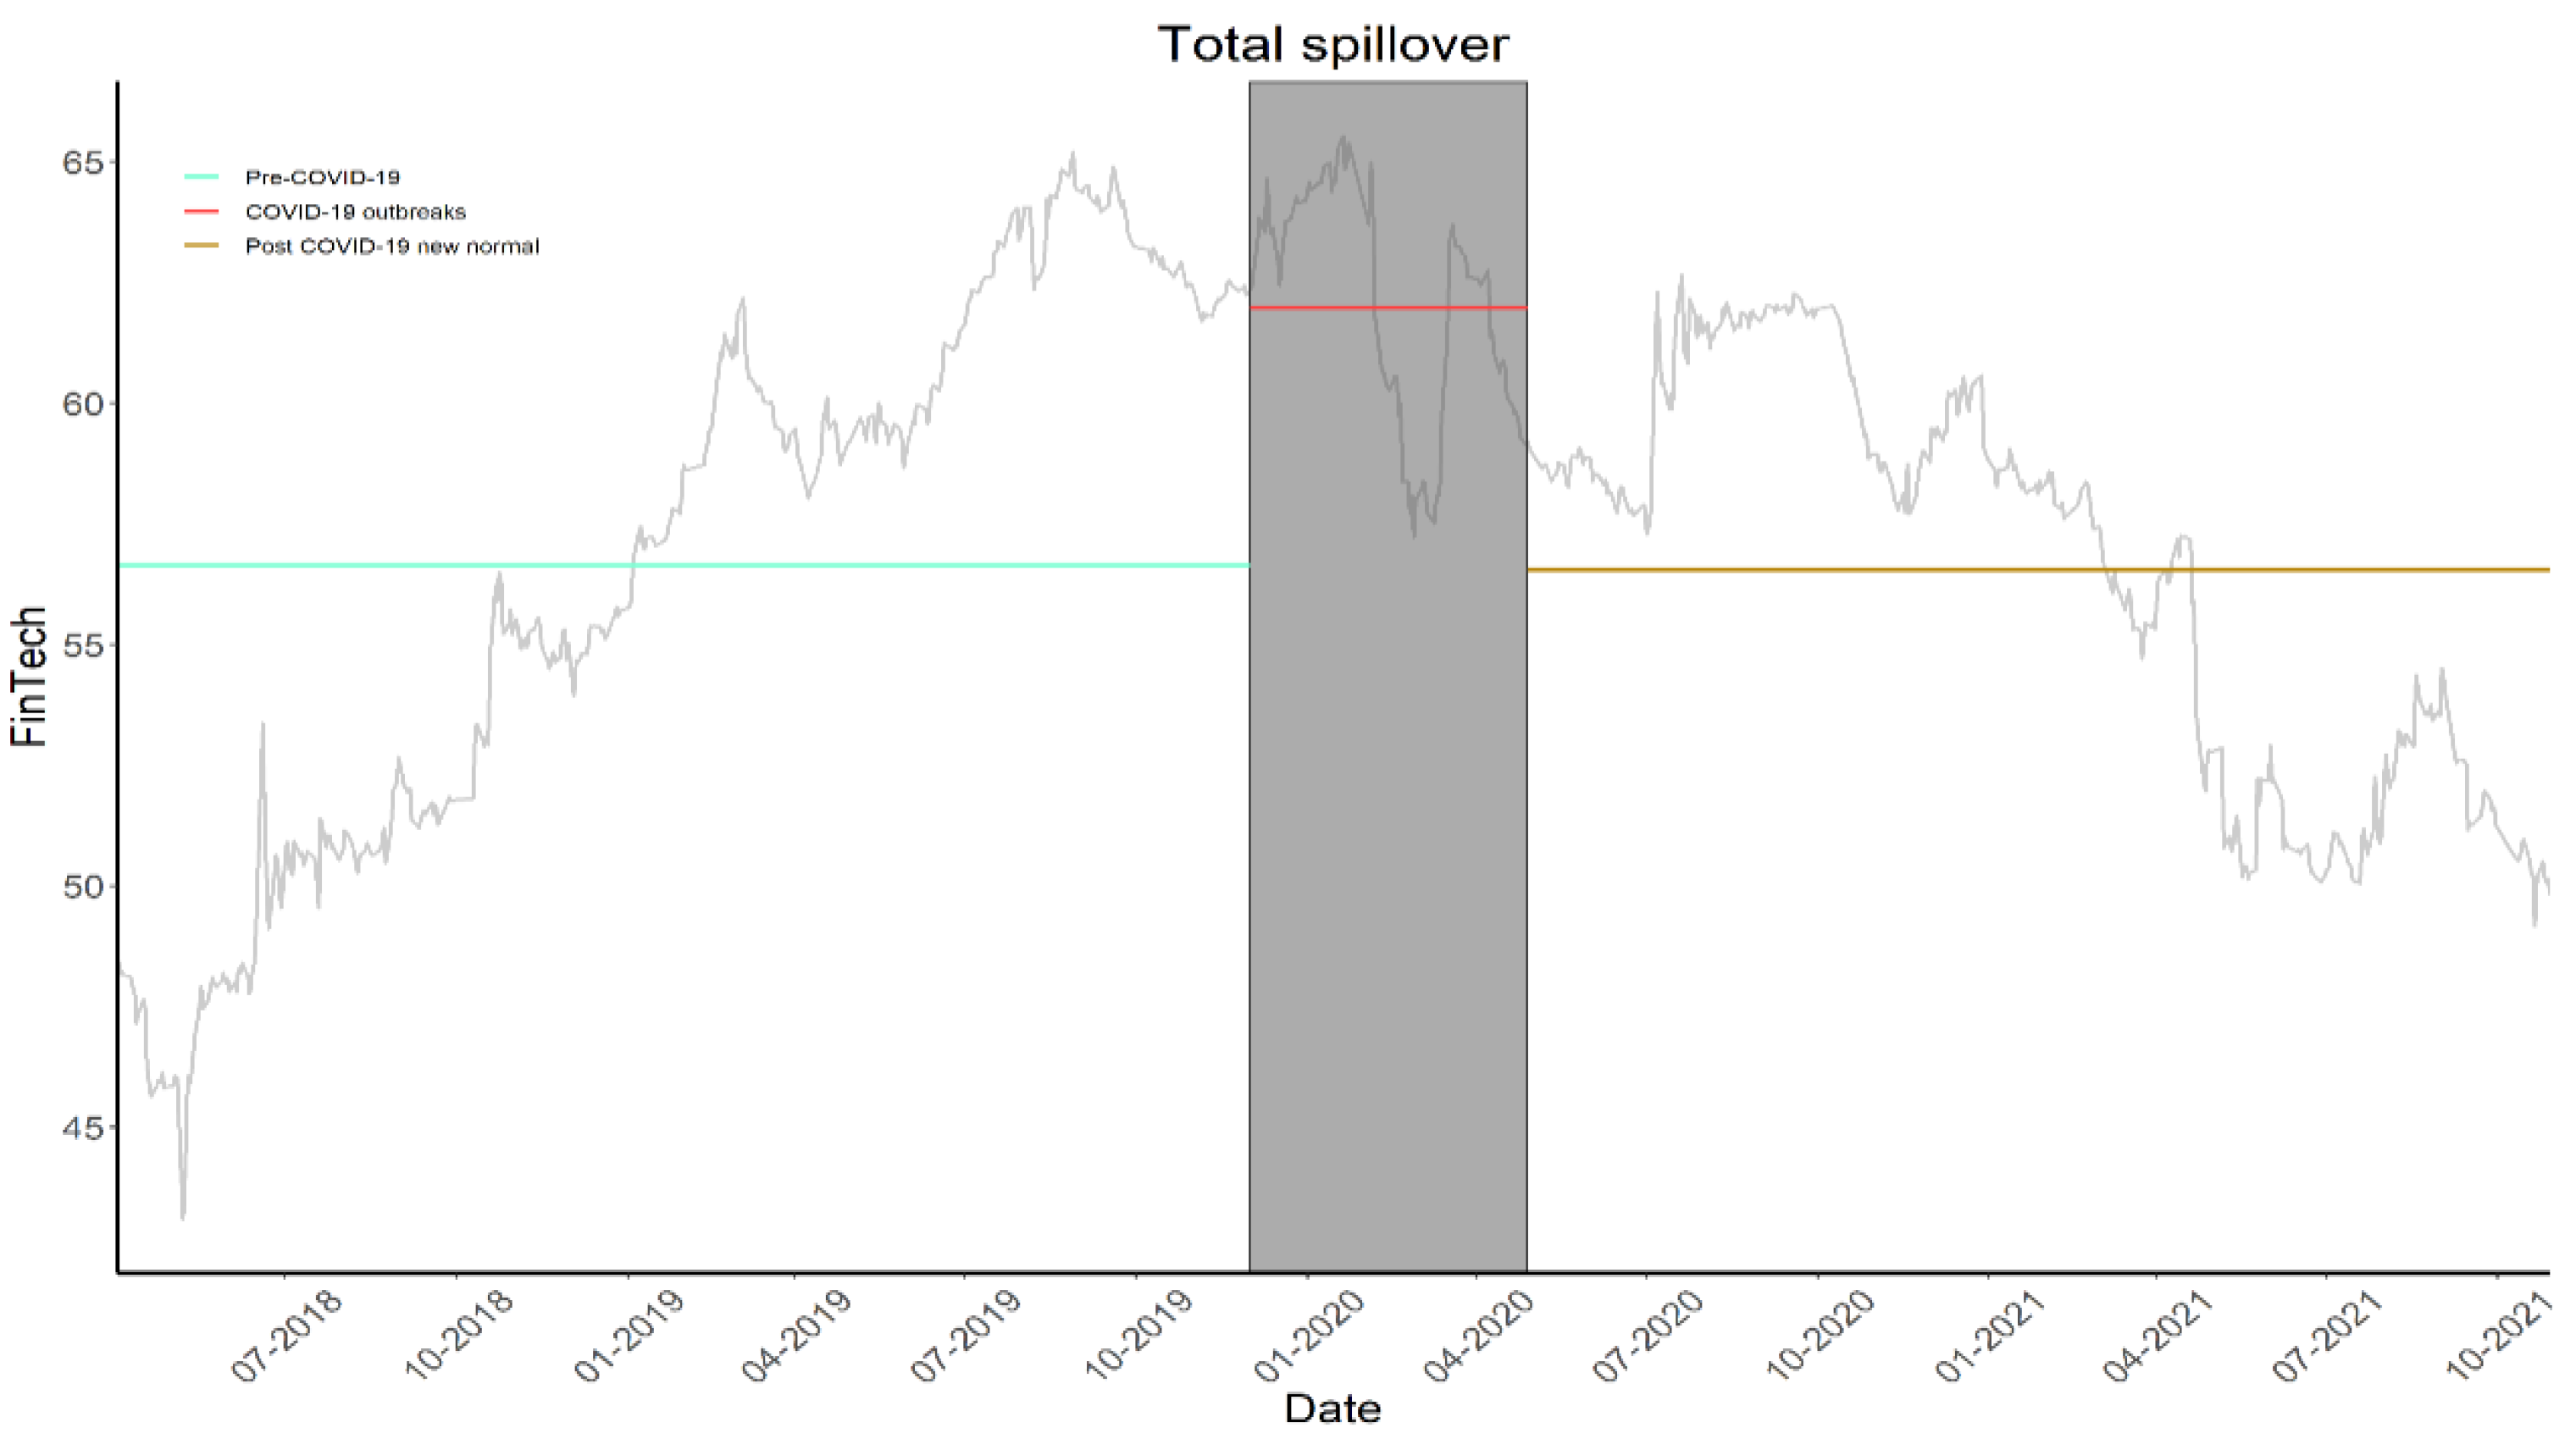
Figure 4 shows the TSI dynamics between FinTech and the TFI. Following Fighting COVID-19: China in Action, we divide the timeline into three parts: pre-COVID-19 period (from the start to 1 December 2019, the first reported COVID-19 case in China), COVID-19 outbreak period (1 December 2019 to 28 April 2020, marked in shadow), and Post COVID-19 new normal period (since 28 April 2020). The three vertical lines imply the average TSI during the corresponding period, respectively. The TSI ranges between 43.10% and 65.53%, representing an inverse-U shape. Concretely, an increasing trend of TSI is observed in the pre-COVID-19 period. In Wang, et al. (2021) [100], we noticed a similar pattern of volatility period during this period. A potential explanation is the fast growth of FinTech [100] and the steady development of financial liberalization in China [101]. However, during the COVID-19 outbreak period, the TSI reached the highest point and experienced huge fluctuations, which is in line with the findings revealed in Le et al. (2021) [17] and Corbet, et al. (2021) [102]. This finding is possible because it incurs economic lock-down [103] and social security, which tend to bring negative expectations on economic performance. In the post-COVID-19 period, we can identify a clear decreasing trend of TSI, which is due in part to the low COVID-19 infection number in China and investors’ better understanding about the real effects of COVID-19 and its ramifications on economy. As evidence, the indices of FinTech and TFI are less volatile than those before and during COVID-19 pandemic periods as shown in Figure 2.
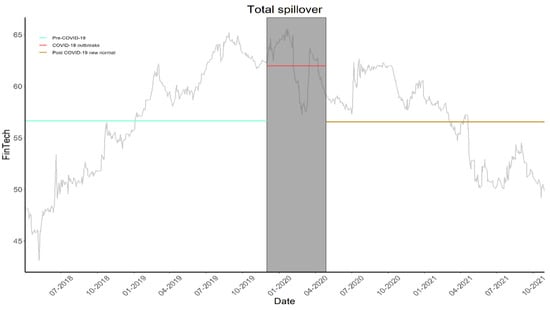
Figure 4.
TSI between FinTech and TFI.
5.2. DSI and NSI Dynamics
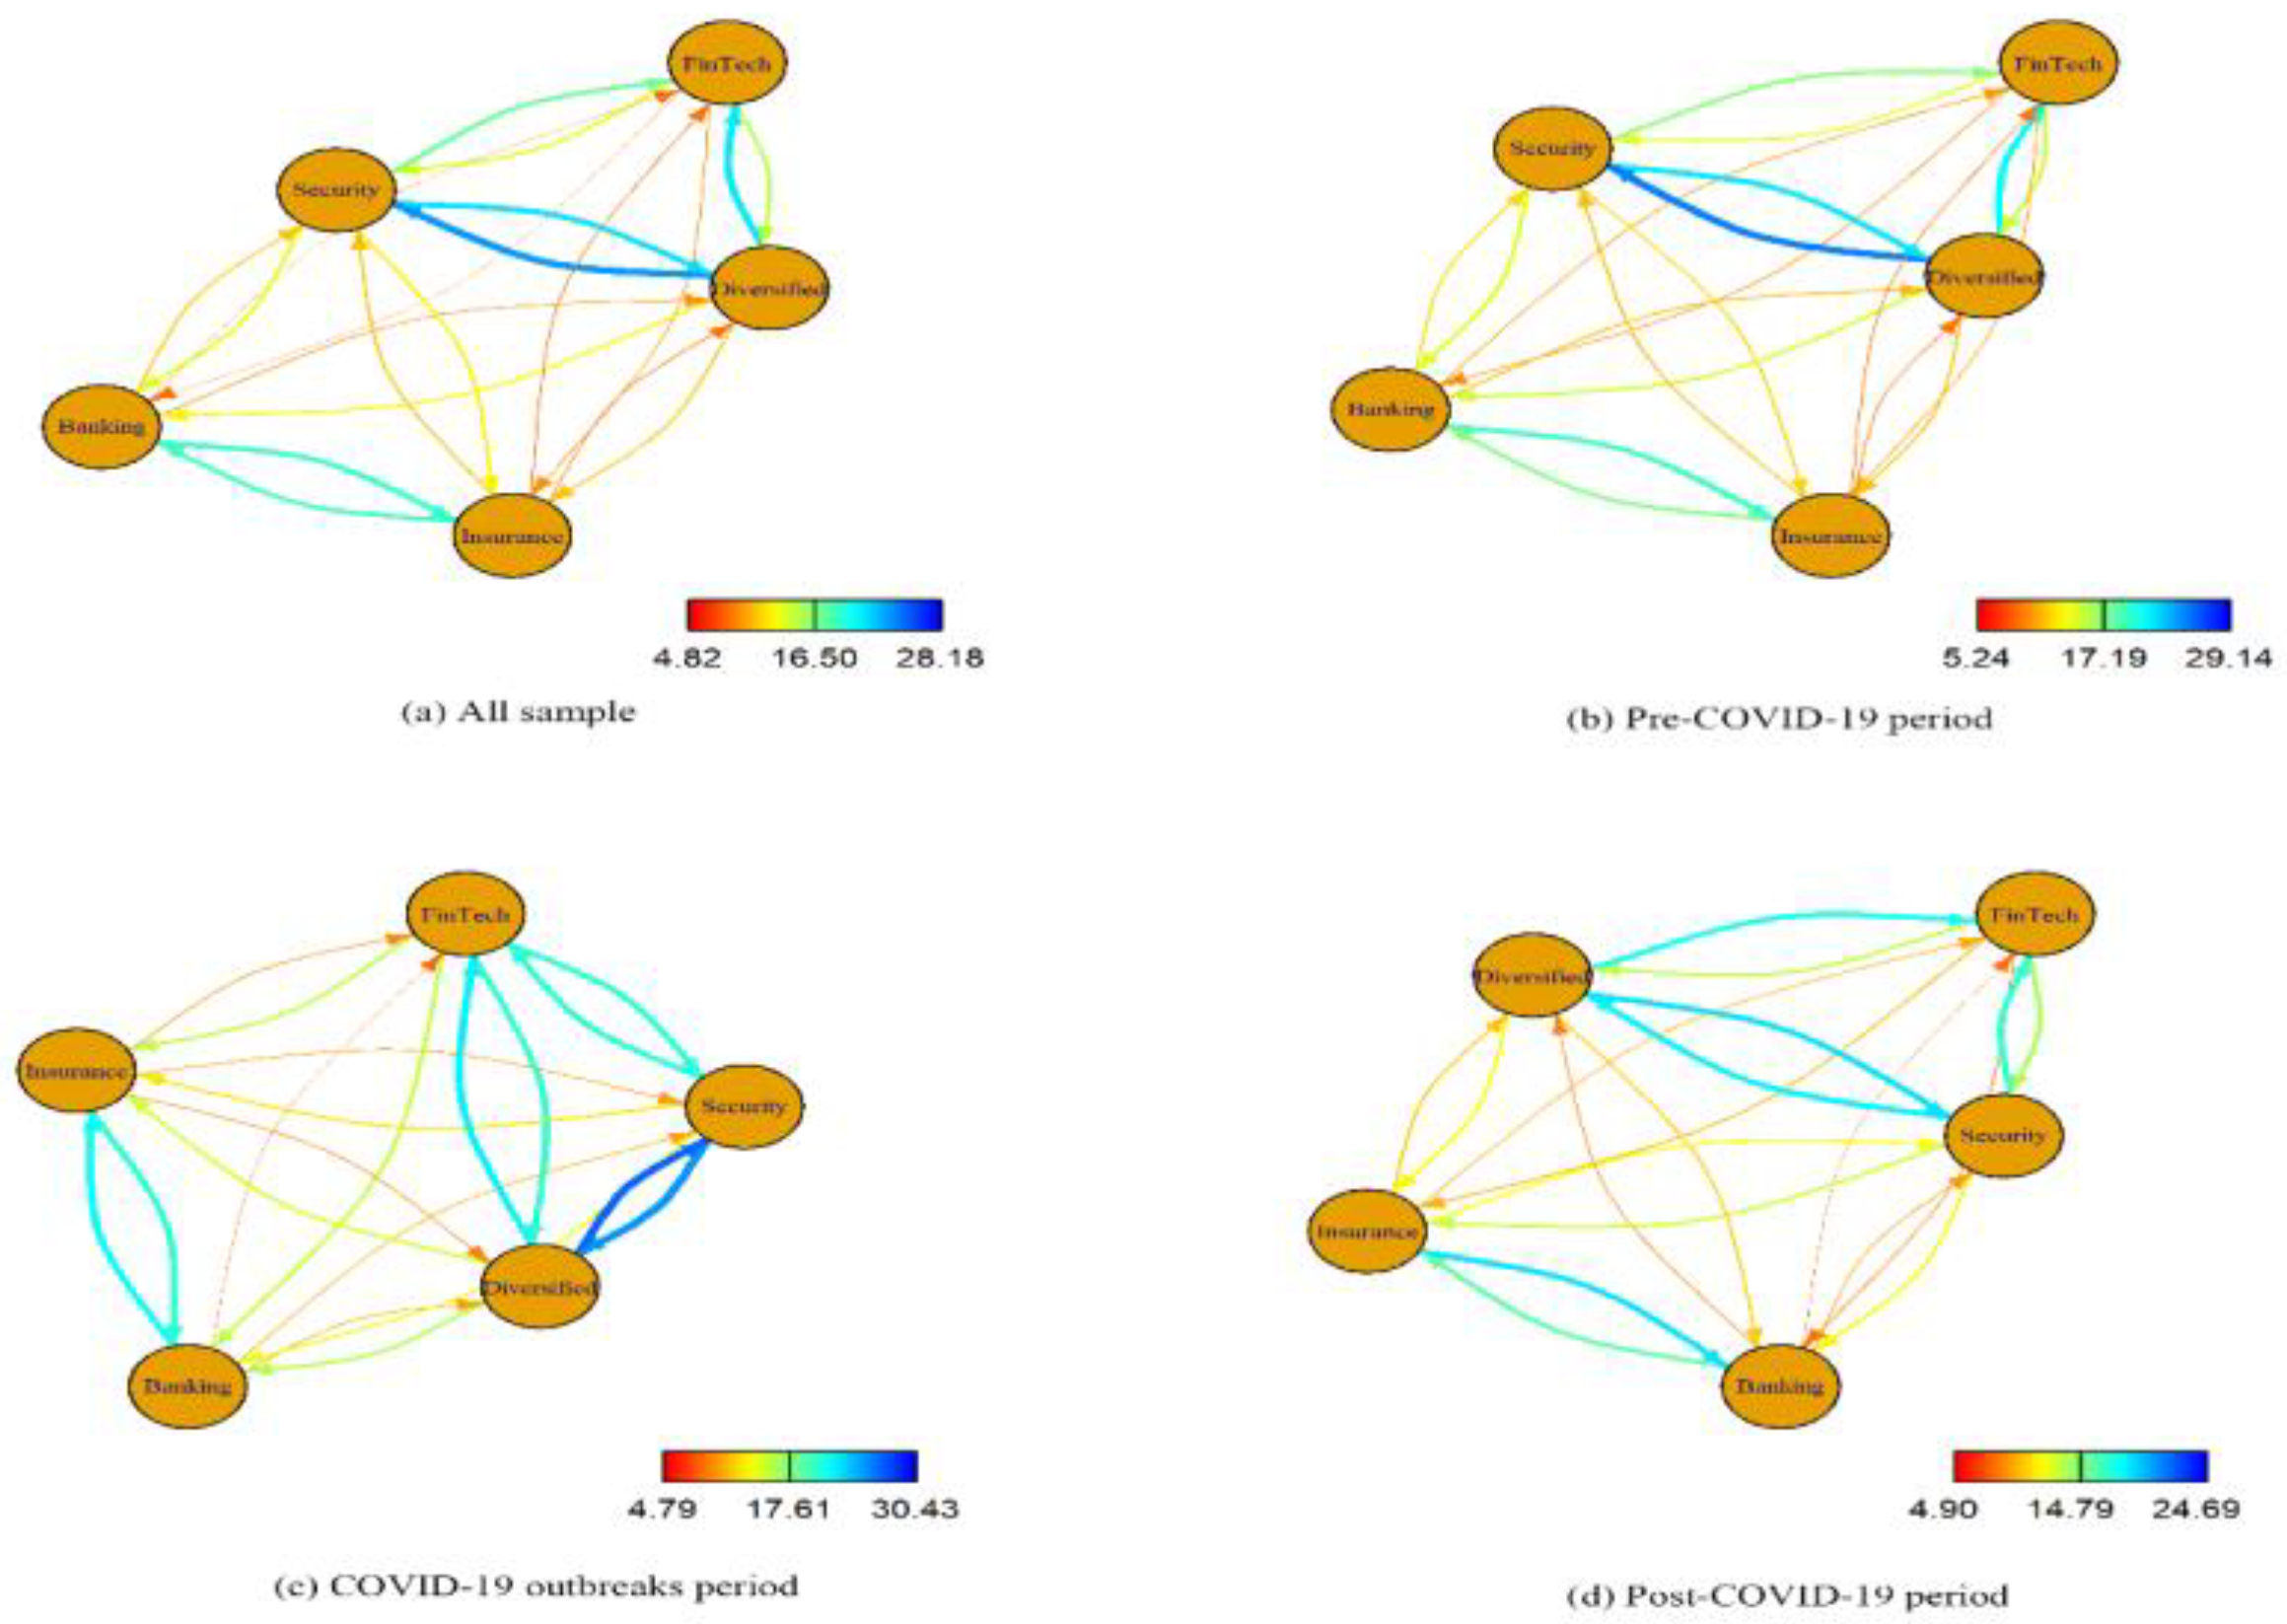
The previous subsection reports only the overall spillover dynamic over the period under examination, whereas it provides limited information on the directional spillover pattern. One may be curious as to the time-varying characteristics of pairwise spillover, or more specifically, if FinTech is a spillover receiver or exporter. To answer these questions, we calculated the directional Spillover and plotted them in Figure 5. The circles denote the subsectors of FinTech and the TFI, namely FinTech, Banking, Insurance, Security, and Diversified. The arrows in Figure 5 indicate the direction of the spillover. The thickness and color represent the degree of spillover. A thick line close to the spectrum blue implies a comparatively high DSI. On the contrary, thin lines with the color spectrum red mean that the DSI is low.
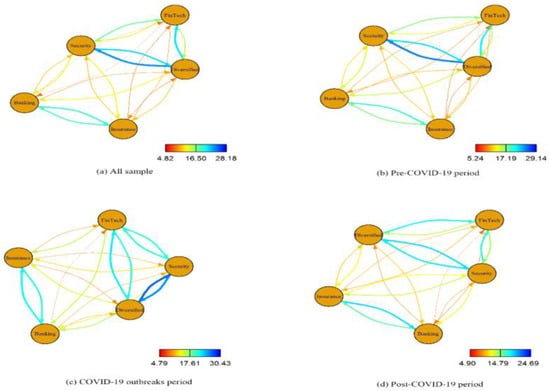
Figure 5.
DSI dynamics between FinTech and the TFI. (a) All sample result (b) Pre-COVID-19 result (c) COVID-19 outbreaks result (d) Post-COVID-19 result.
Figure 5 shows four subplots, indicating the DSI in the whole sample, pre-, outbreaking, and post-COVID-19 period, respectively. It can be inferred from Figure 5 that the directional spillover index between FinTech and traditional financial subsectors approximately ranges from 4% to 28%. The spillover between the security industry and diversified financials achieves the highest level and FinTech has a close connection with the security industry and diversified financials. However, the connectedness between FinTech and banking and insurance is relatively low. A clear time-varying pattern is observed after we divide the period according to the situation of the COVID-19 pandemic. Concretely, a comparatively high DSI is witnessed during the outbreak of COVID-19 as shown in Figure 5c. This result is consistent with TSI illustrated in Figure 4 and can be explained by the huge shock of the pandemic on the economy and investors’ panic. The DSI patterns in the pre- and post-COVID-19 periods are similar but differ in that the post-COVID-19 period exhibits a low DSI, which may have resulted from the low volatility during the post-pandemic period.
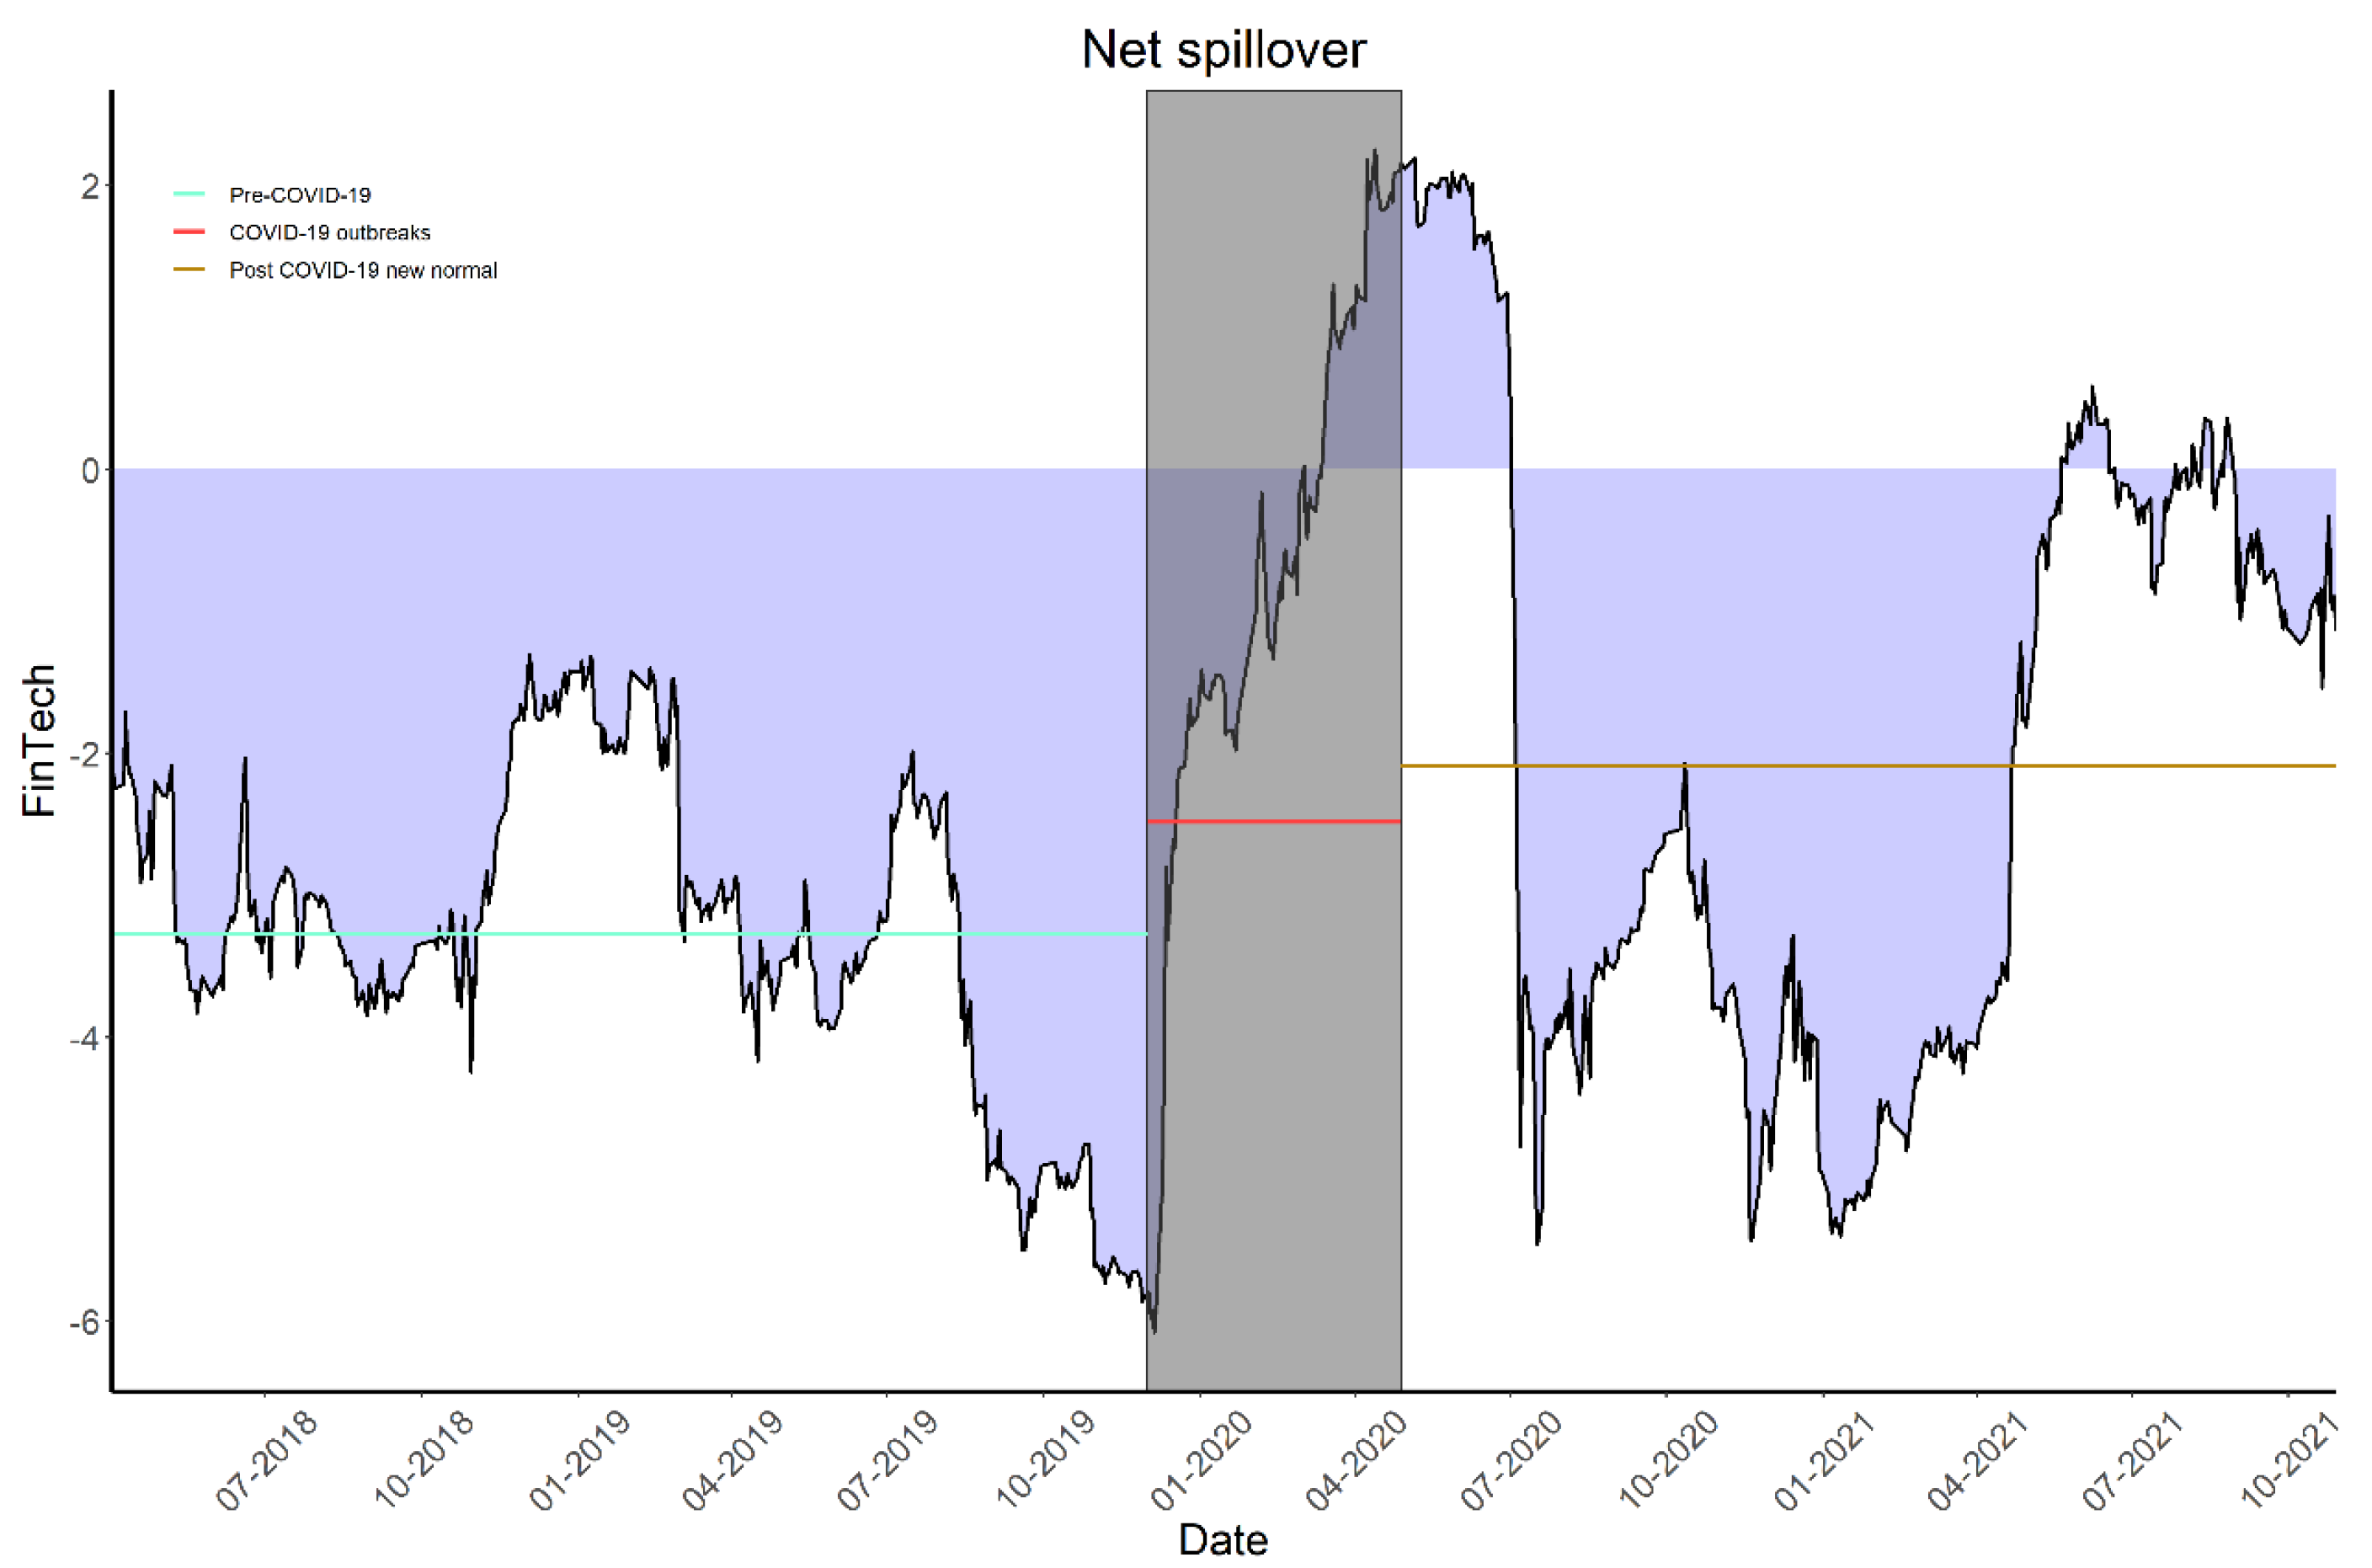
TSI and DSI can provide only the information on the gross spillover, which hardly answers whether a market is a net receiver and exporter directly. Because the spillover pattern of FinTech is our main focus, we calculate the NSI of FinTech and plot it in Figure 6. Similar to Figure 4, we divide the whole timeline into three parts and plot the average NSI with different colored lines. Specifically, the period of COVID-19 outbreaking is marked in shadow. From Figure 6, we can summarize several interesting findings.

Figure 6.
NSI between FinTech and the TFI.
First, FinTech is a net spillover receiver in most cases, indicating that the volatility of the FinTech index is easily influenced by the fluctuations of indices of the TFI. This finding is consistent with those made by Chen et al. (2022) [16] and Le et al. (2021) [17]. This finding may be because despite the fast growth of FinTech, the TFI still maintains the dominating role in China’s financial system.
Second, a time-varying characteristic is clearly shown in Figure 6. Specifically, during the pre-pandemic period, the net spillover of the TFI on FinTech exhibits an upward trend. As a result, the NSI has decreased since 2018 and reached the lowest point by the end of 2019. Similar findings were also observed by Chen et al. (2020) [104]: that internet finance was a volatility spillover receiver in the early stage because of the unmatured market. The source of volatility spillover lies mainly in the security and diversified financials. The security industry in China has actively engaged in digitization: the whole industry invested 55 billion RMB in technology innovation from 2017 to 2019, the data of which were sourced from the Securities Association of China. The diversified business items in diversified financials may also link closely with FinTech. Interestingly, the NSI of FinTech increased rapidly during the outbreak period of COVID-19 and even became a net volatility spillover exporter. We assume two possible reasons for this phenomenon. On the one hand, the stock market experienced a great fluctuation during this period, which is explicitly shown in Figure 2 and is expected to enhance the overall spillover. On the other hand, FinTech innovations, such as mobile payment and digital banking, played important roles in supporting wide-reaching policy promptly and without physical contact, which challenged the dominant TFI to some extent [105]. During the post-COVID-19 period, the NSI of FinTech reached the level of the pre-COVID-19 period, which can be explained by the rigorous measures that the Chinese government has taken to fight against the COVID-19 epidemic. We can also observe some pluses of NSI during this period. We assume that these pluses could be due to the resurgence of COVID-19. For example, the NSI of FinTech increased from April 2021 to June 2021, and meanwhile, the COVID-19 pandemic has undergone twists and turns in some provinces in China, such as Anhui and Liaoning. Hence, further investigation is required to confirm this assumption.
5.3. Frequency Spillover Dynamics
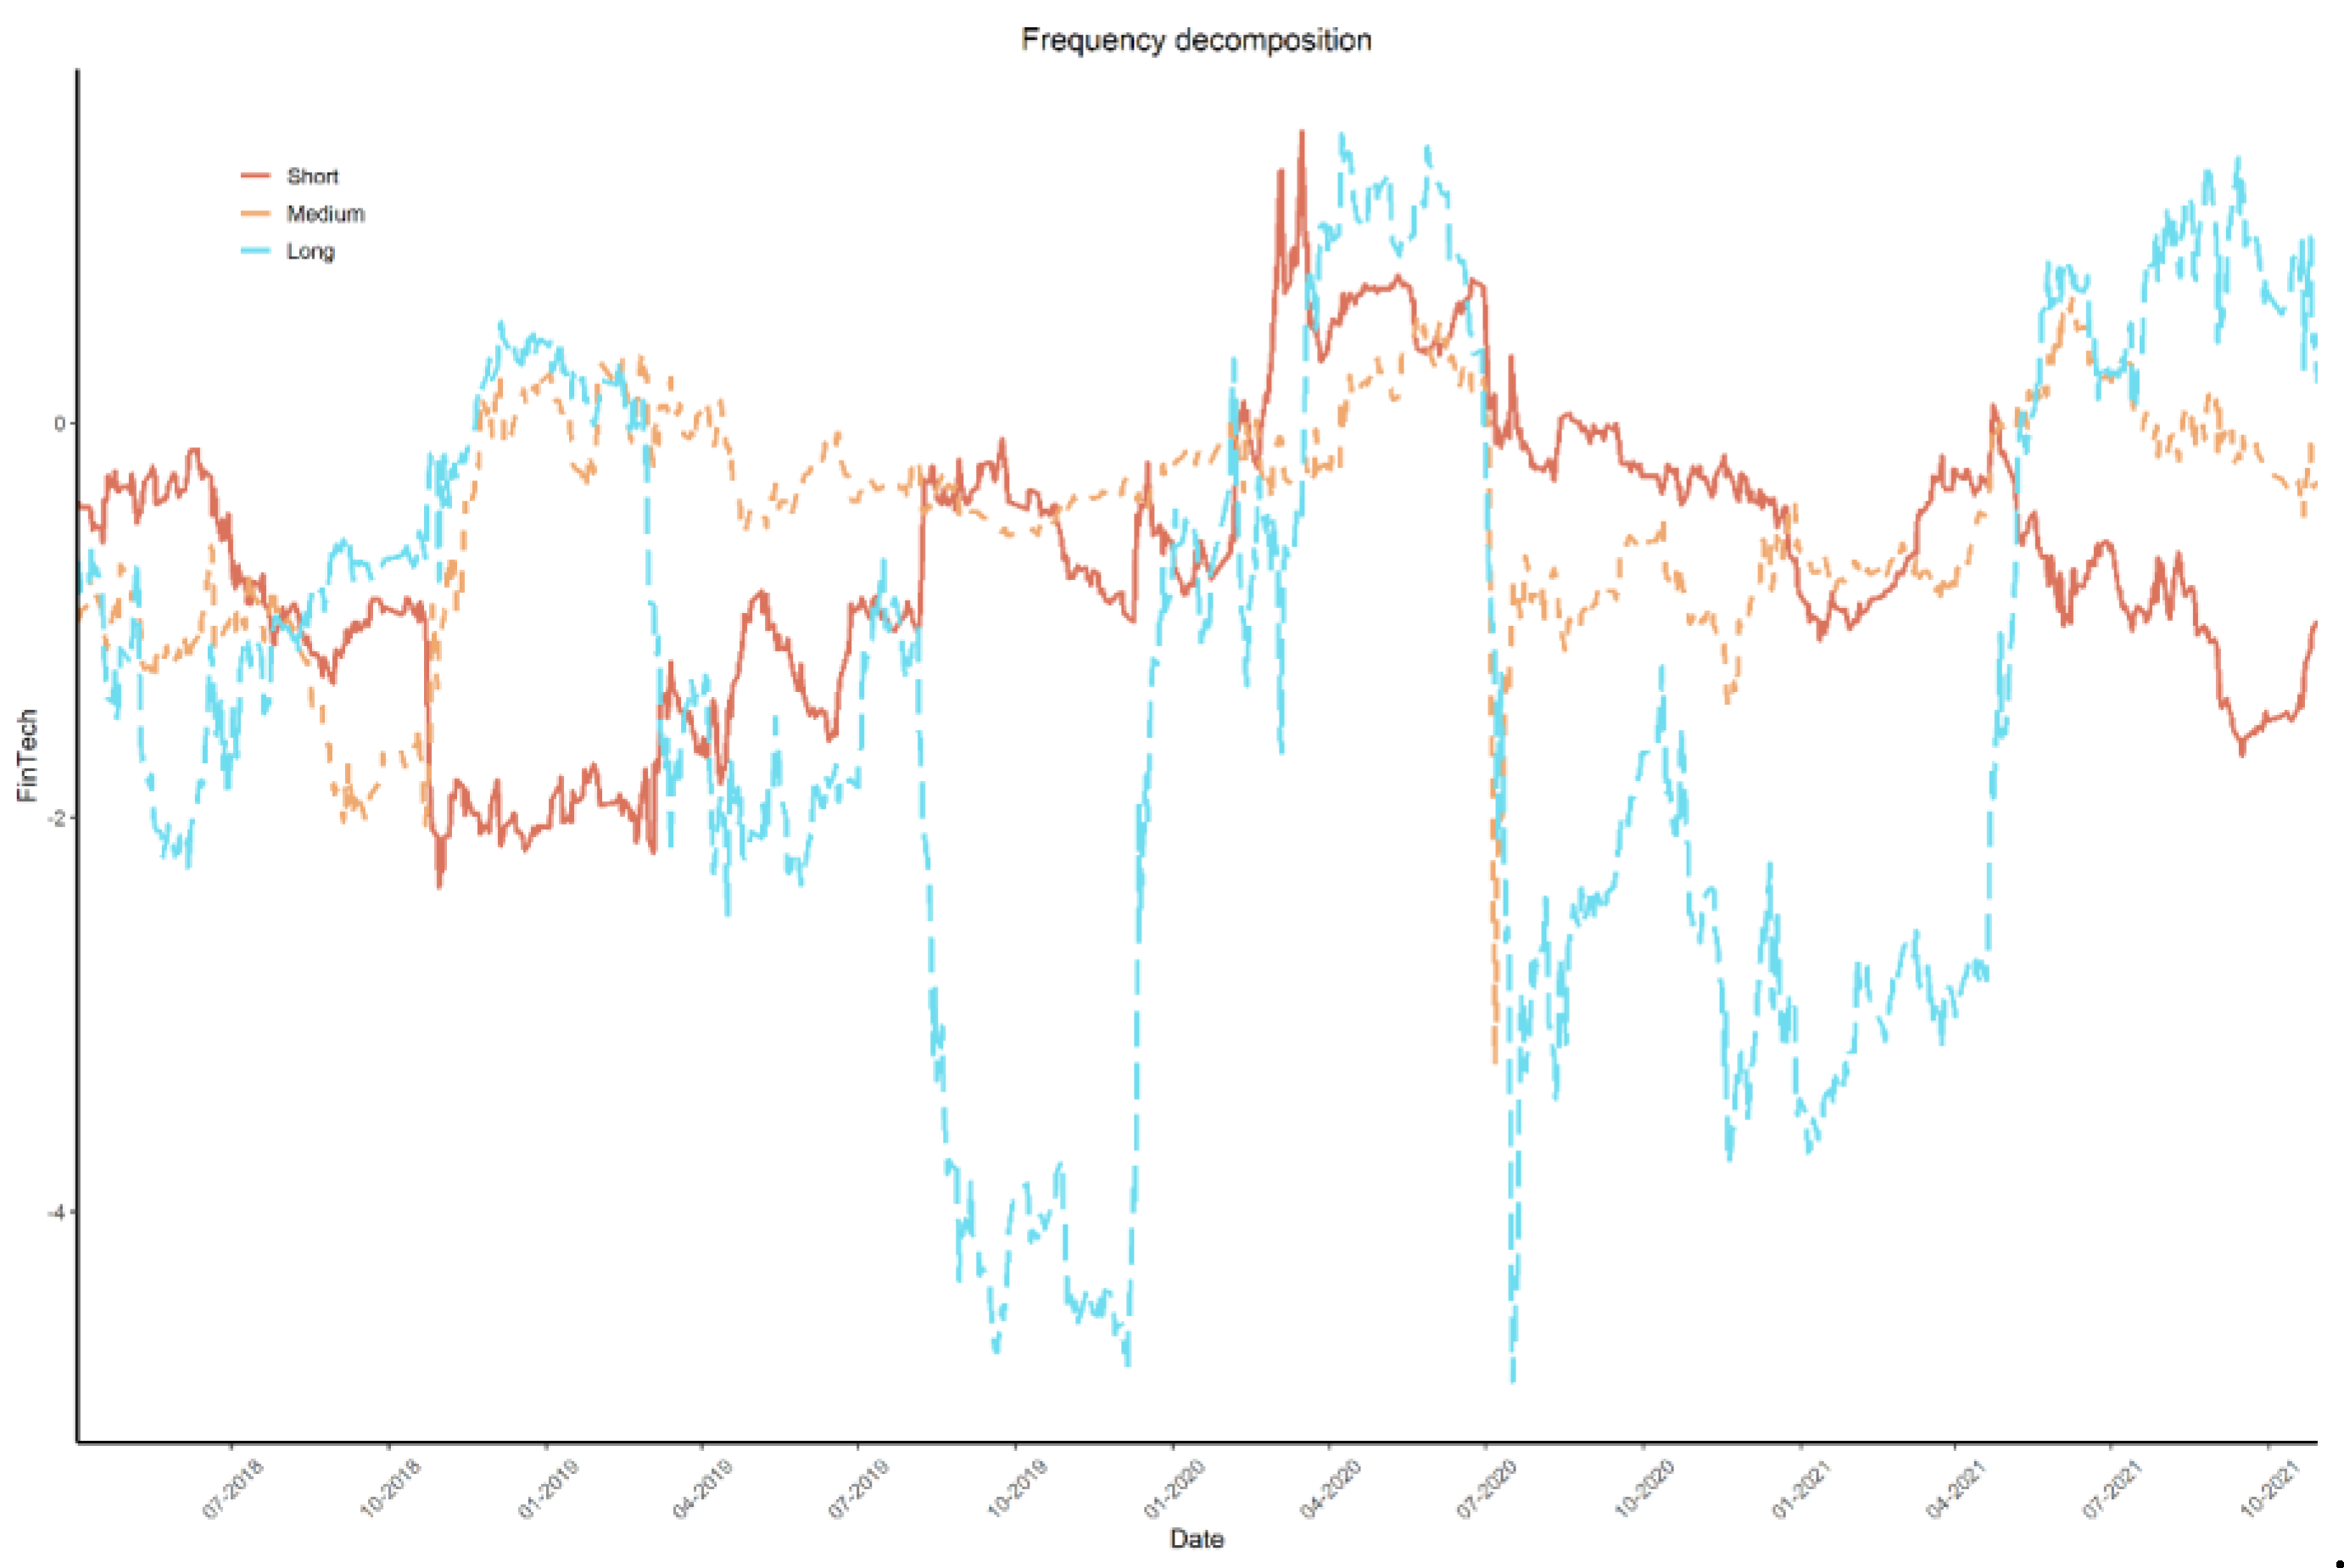
The TSI, DSI, and NSI discussed above can provide only information on the aggregate, pairwise, and net spillover, respectively; they can hardly reveal the frequency source of spillover. In other words, they seldom reveal whether shocks created by a certain market affect the other components in the short term or the long term. To remedy this, we perform a frequency domain decomposition based on the BK framework. Frequency decomposition is reasonable because financial assets usually have different maturity, and thus, investors may value these assets with different persistence levels [106]. As a result, cyclical components tend to create shocks with heterogeneous responses and different frequency sources (i.e., short-, medium-, and long-term sources) of spillover [48]. The decomposed NSI is shown in Figure 7 and the frequency band is determined as one week (short term, 1–5 days), one week to one month (medium term, 6–22 days), and one month to one year (long term, 23 days to infinity).
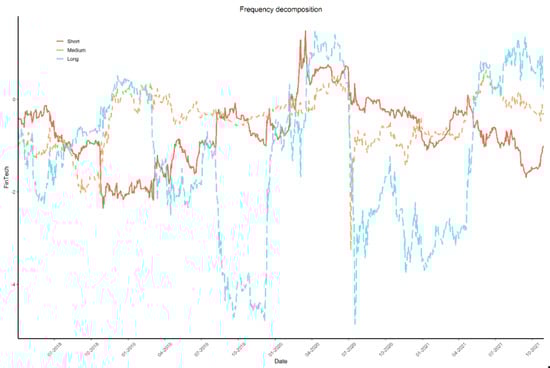
Figure 7.
NSI decomposition between FinTech and the TFI on frequency bands without cross-sectional correlations.
Figure 7 shows the rich time–frequency dynamics of spillover. One interesting observation from Figure 7 is that the fluctuations of spillover are mostly driven by low-frequency components (long-term spillover) when encountering shocks, whereas the contributions of short and medium term are relatively stable. It can be inferred that shocks fundamentally change the expectations of investors and create uncertainty in the long term. For example, the outbreak of COVID-19 from December 2019 to April 2020, the post-COVID-19 from April 2020 to July 2020, and the resurgence of COVID-19 from April 2021 to June 2021 experienced a fast increase (decrease) of long-term decomposed NSI of FinTech. The stabilization of short- and medium-term NSI can be attributed in part to the comparatively narrow frequency band and low information processing efficiency in China’s stock market [107].
The time–frequency structures of FinTech’s NSI also exhibited dramatic changes during the post-shock periods and in these periods, short- and medium-term components became the main driving forces of volatility spillover. The periods of January 2020 to March 2020 and August 2020 to October 2020 witness this phenomenon. A possible explanation is described as follows: after the market experiences high uncertainty, the asset price starts to stabilize, and the emotion of investors becomes rational. The decreasing uncertainty in a stable or steadily growing market will lead to fast and impulsive future uncertainty, which eventually creates short- or medium-term spillover.
5.4. Determinants of Volatility Spillovers
5.4.1. Determinants of Total Spillover Index
Table 3 presents the estimation results of Equation (13). In Table 3, the robust t-statistics are reported in parentheses. We employ a stepwise regression method to investigate the explanatory power of the three types of determinants. In the column of Model 1, only the economic fundamental determinants are considered. It is clearly shown that all economic fundamental determinants are statistically significant at the 10% level, which suggests the critical role of macroeconomic variables in explaining TSI. For example, the coefficient of CFCI is significantly negative, implying that the looser the financial condition, the larger the volatility spillover is in the system. Moreover, economic fundamental determinants can explain a big part of TSI, with an adjusted R2 of 62.5%. Such a finding agrees with some existing literature, such as Karali and Ramirez (2014) [108] and Wang (2020) [109], and provides some evidence for debate on the monetary policy and risk spillover [110]. Based on our findings, the central bank should consider financial stability when developing a monetary policy. The COVID-19 pandemic is positively associated with TSI, which partially supports the arguments developed in Section 5.1. A possible explanation for this phenomenon lies in the fact that the sudden outbreak of COVID-19 generates uncertainty and undermines investors’ confidence.
Table 3.
Regression estimates of TSI.
The coefficient estimates of WAV in Model 2 is significantly positive, with a minor 0.5% increase in adjusted R2. This result suggests that the risk contagion determinant has explanatory power on the TSI during the sample period. This finding provides direct evidence of the transmission of idiosyncratic risk. It is interesting to observe that the coefficient of WAV becomes insignificant after adding the market attention variable (DSV). This finding may be due to the multicollinearity caused by the high correlation between WAV and DSV as shown in Table 2. The incorporation of DSV slightly improves the explanatory power (approximately 1.8% in terms of adjusted R2), which is consistent with some recent studies, such as Jiang, et al. (2022) [98].
5.4.2. Determinants of Net Spillover Index
The above subsection examines the determinants of volatility spillover in the system. Because the directional spillover is also our focus, we analyze the determinants of NSI between FinTech and the TFI in this subsection. The regression results of Equation (14) are displayed in the column of Model 4 in Table 4. The results indicate that economic fundamental determinants remain sizable effects on NSI, very similar to the results revealed in Table 3. However, it is surprising to notice that the coefficient of COVID-19 is insignificant during the sample period. A further investigation of the determinants of frequency decomposed NSI may provide a helpful explanation.
Table 4.
Regression estimates of NSI.
Interestingly, the estimation results on the coefficient of WAV and DSV have different signs from those in Table 3. A possible explanation for this lies in the fact that FinTech is a relatively new industry with much lower trading volume and searching index than those of the TFI. The changes in volatility pattern and market attention measured by WAV and DSV, respectively, can be largely explained by the TFI. As a result, directional volatility spillover from the TFI to the FinTech industry may increase as the WAV and DSV become higher, which finally leads to a decrease in terms of NSI between FinTech and the TFI. To verify this argument, we consider two additional variables, namely the difference between the average volatility of the TFI and FinTech (DAV) and the difference between the daily Baidu index of the TFI and FinTech (DDSV), as proxies of risk contagion and market attention, respectively. The regression results are shown in the column of Model 5 in Table 4. The adjusted R2 of Model 5 is higher than that of Model 4, implying that the addition of variables enhances the explanatory power of the regression model. Importantly, the coefficients of DAV and DDSV are significantly negative, which supports the argument that the dominating role of the TFI confuses the proxy of risk contagion and market attention.
We then analyze the determinants of NSI under different frequency components. The regression results are displayed in columns of Models 6–8 in Table 4. We can observe that the coefficients of all economic fundamental variables are significant under different frequency components, whereas ER accounts for the largest magnitude in long-term NSI, and CFCI exhibits considerable effects on short-term NSI. The finding is reasonable because the volatility transmission path of the exchange rate on the stock market is relatively longer than that of financial condition theoretically. It is also surprising to witness the heterogeneous effect of the COVID-19 pandemic on different frequency components. Concretely, the COVID-19 pandemic has a significantly positive effect on NSI in the short and medium term, whereas its long-term effect is significantly negative as shown in the column of Model 8. The aggregation effect leads to the insignificant coefficient estimate as shown in columns of Models 4–5. Two potential explanations can be summarized as follows. On the one hand, investors fall into a panic when the COVID-19 pandemic occurs, which leads to an increase in overall volatility. On the other hand, FinTech played important roles in supporting wide-reaching policy promptly and without physical contact, which challenged the dominating role of the TFI to some degree. The effects of risk contagion and market attention determinants exhibit different patterns under frequency components and the magnitude of coefficients are comparatively larger for medium- and long-term NSI. Fortunately, the signs of these coefficients remain stable, which partially shows the robustness of the empirical results.
5.5. Robustness Checks
We initially consider alternative forecasting horizons to examine the robustness of empirical results. We consider 20-day and 50-day forecasting horizons, and the results are shown in Table 5. The regression estimation results remain robust to alternative forecast horizons.
Table 5.
Robustness check with different forecasting horizons.
Moreover, to check whether the lags of the VAR model will significantly affect the measurement of TSI and NSI, which finally leads to a considerable effect on the analysis of the determinants, we consider different lag lengths (3 and 4). The results are summarized in Table 6. The coefficients of variables remain similar to those revealed in Table 3 and Table 4.
Table 6.
Robustness check with different lag lengths in the VAR model and alternative proxy of risk cognation determinant.
Finally, one may be concerned as to whether the volatility outside the system of FinTech and the TFI leads to the insignificant coefficient of risk contagion determinant when TSI is employed as a dependent variable and variables WAV and DAV consider only the volatility within the system. To address the concern, we calculate the volatility of CSI 300, a popular index that reflects the condition of China’s A-share stock, and employ it as a proxy of a risk contagion determinant. The regression results are presented in Table 6. It can be observed that the regression coefficient of the volatility of CSI 300 remains insignificant when TSI is employed as the dependent variable.
6. Conclusions and Implications
This paper explores the dynamics and determinants of volatility spillover between FinTech and the TFI. We initially measure the volatility spillover indices using the methods proposed by Diebold and Yilmaz (2012) [47] and Baruník and Křehlík (2018) [48]. Subsequently, three potential types of determinants, namely economic fundamentals, risk contagion, and market attention variables, are considered from theoretical and empirical perspectives. The key findings are presented as follows. First, the total spillover between FinTech and the TFI is time-varying and exhibits an inverse U-shape between 2017 and 2021. Second, FinTech is a net volatility spillover receiver in most cases, and exports volatility to the TFI during the outbreak of the COVID-19 pandemic. Third, the long-term components are the main driving force of volatility spillovers based on the frequency domain spillover decomposition. Fourth, the economic fundamental determinants are the main contributing factors of volatility spillovers, explaining over 60% of total spillover between FinTech and the TFI.
In light of the above findings, this study has meaningful implications for market participants and policymakers. For investors, stocks in financial sectors have long been regarded as risk aversion choices because of their stable return and high liquidity. However, we witness a volatility spillover from FinTech to the TFI, especially encountering major exogenous shocks. This finding may challenge the stereotype of holding stocks in financial stocks when building risk-aversion portfolios. Investors can adjust their investment strategies in time accordingly.
These results also have important policy implications, as we underscore the importance of enhancing the supervision and regulation of financial markets and FinTech companies to maintain financial stability since volatility spillover has been found to be bidirectional. We should maintain and reasonably promote the level of financial openness, and gradually improve the exchange rate system, as exchange rate was proved to be a significant determinant of volatility spillover. Our findings also highlight the necessity of considering financial stability when performing monetary policy. Concretely, during the economic resurgence in the post-COVID-19 period, expansionary monetary or fiscal policy is routinely employed by policymakers. However, expansionary monetary or fiscal policy may also lead to a loose financial condition, which increases the volatility spillover between FinTech and the TFI based on our empirical analysis. Consequently, policymakers must strike a balance between financial stability and economic recovery in the post-pandemic period. Since China has become the second largest economy in the world, with its FinTech industry advancing rapidly, the case study of China can provide referential experience for other countries.
This study has some shortcomings that could be addressed in further studies. To begin with, we conducted the research by using macro-level data instead of corporate-level data. It is predictable that corporate-level data can have better variability and further studies can use them to analyze corporate-level earnings or volatility connectedness. Second, the methodology can be improved. Concretely, the VAR-based model can be extended to the quantile VAR-based model to explore the characteristics of the returns or volatility connectedness under different decimal places in further research. Moreover, we only focused on China’s market and further studies can go beyond the case of China since this is a hot topic globally.
Author Contributions
Conceptualization, Z.W. and Y.F.; methodology, Y.X.; software, Y.X.; formal analysis, Y.X. and Y.L.; resources, Z.W.; data curation, Y.X., Z.W. and Y.F.; writing—original draft, Y.X., Z.W. and Y.L.; writing—review and editing, Z.W. and Y.X.; project administration, Z.W.; funding acquisition, Y.X.; Investigation, Z.W.; Supervision, Y.X.; Validation, Y.F. All authors have read and agreed to the published version of the manuscript.
Funding
This research was funded by the National Natural Science Foundation of China, grant number 72103082, and Project of Philosophy and Social Science Research in Colleges and Universities in Jiangsu Province, grant number 2020SJA1018.
Data Availability Statement
The data presented in this study are available on request from the corresponding author.
Conflicts of Interest
The authors declare no conflict of interest. The funders had no role in the design of the study; in the collection, analyses, or interpretation of data; in the writing of the manuscript; or in the decision to publish the results.
References
- FSB. Financial Stability Implications from FinTech: Supervisory and Regulatory Issues that Merit Authorities’ Attention, 27 June 2017. Available online: https://www.fsb.org/wp-content/uploads/R270617.pdf (accessed on 6 September 2018).
- Varga, D. Fintech, the new era of financial services. Vez.-Bp. Manag. Rev. 2017, 2, 22–32. [Google Scholar] [CrossRef]
- Muthukannan, P.; Tan, B.; Tan, F.T.C.; Leong, C. Novel mechanisms of scalability of financial services in an emerging market context: Insights from Indonesian Fintech Ecosystem. Int. J. Inf. Manag. 2021, 61, 102403. [Google Scholar] [CrossRef]
- Ding, N.; Gu, L.; Peng, Y. Fintech, financial constraints and innovation: Evidence from China. J. Corp. Financ. 2022, 73, 102194. [Google Scholar] [CrossRef]
- Gomber, P.; Kauffman, R.J.; Parker, C.; Weber, B.W. On the fintech revolution: Interpreting the forces of innovation, disruption, and transformation in financial services. J. Manag. Inf. Syst. 2018, 2, 220–265. [Google Scholar] [CrossRef]
- Palmié, M.; Wincent, J.; Parida, V.; Caglar, U. The evolution of the financial technology ecosystem: An introduction and agenda for future research on disruptive innovations in ecosystems. Technol. Forecast. Soc. Chang. 2020, 151, 119779. [Google Scholar] [CrossRef]
- Basdekis, C.; Christopoulos, A.; Katsampoxakis, I.; Vlachou, A. FinTech’s rapid growth and its effect on the banking sector. J. Bank. Financ. Technol. 2022, 2, 159–176. [Google Scholar] [CrossRef]
- KMPG. The Pulse of Fintech H2 2020. 2021. Available online: https://assets.kpmg.com/content/dam/kpmg/xx/pdf/2021/02/pulse-of-fintech-h2-2020.pdf (accessed on 25 March 2021).
- Gabor, D.; Brooks, S. The digital revolution in financial inclusion: International development in the fintech era. New Political Econ. 2017, 22, 423–436. [Google Scholar] [CrossRef]
- Senyo, P.K.; Osabutey, E.L. Unearthing antecedents to financial inclusion through FinTech innovations. Technovation 2020, 98, 102155. [Google Scholar] [CrossRef]
- Abbasi, K.; Alam, A.; Du, M.A.; Huynh, T.L.D. FinTech, SME efficiency and national culture: Evidence from OECD countries. Technol. Forecast. Soc. Chang. 2021, 163, 120454. [Google Scholar] [CrossRef]
- Wang, Y.; Xiuping, S.; Zhang, Q. Can fintech improve the efficiency of commercial banks?—An analysis based on big data. Res. Int. Bus. Financ. 2021, 55, 101338. [Google Scholar] [CrossRef]
- Fung, D.W.; Lee, W.Y.; Yeh, J.J.; Yuen, F.L. Friend or foe: The divergent effects of FinTech on financial stability. Emerg. Mark. Rev. 2020, 45, 100727. [Google Scholar] [CrossRef]
- Cheng, W.G.; de Oliveira Leite, R.; Caldieraro, F. Financial contagion in internet lending platforms: Who pays the price? Financ. Res. Lett. 2022, 45, 102187. [Google Scholar] [CrossRef]
- Caporale, G.M.; Kang, W.Y.; Spagnolo, F.; Spagnolo, N. Cyber-attacks, spillovers and contagion in the cryptocurrency markets. J. Int. Financ. Mark. Inst. Money 2021, 74, 101298. [Google Scholar] [CrossRef]
- Chen, Z.; Zheng, C.; Hao, X. Volatility spillover effect between internet finance and banks. J. Bus. Res. 2022, 141, 512–519. [Google Scholar] [CrossRef]
- Le, L.T.N.; Yarovaya, L.; Nasir, M.A. Did COVID-19 change spillover patterns between Fintech and other asset classes? Res. Int. Bus. Financ. 2021, 58, 101441. [Google Scholar] [CrossRef]
- Le, T.L.; Abakah, E.J.A.; Tiwari, A.K. Time and frequency domain connectedness and spillover among fintech, green bonds and cryptocurrencies in the age of the fourth industrial revolution. Technol. Forecast. Soc. Chang. 2021, 162, 120382. [Google Scholar] [CrossRef]
- Wu, G.; Luo, J.; Tao, K. Research on the influence of FinTech development on credit supply of commercial banks: The case of China. Appl. Econ. 2023, 1–17. [Google Scholar] [CrossRef]
- Tseng, P.L.; Guo, W.C. Fintech, credit market competition, and bank asset quality. J. Financ. Serv. Res. 2022, 2, 285–318. [Google Scholar] [CrossRef]
- Van Loo, R. Making innovation more competitive: The case of fintech. UCLA Law Rev. 2022, 65, 232. [Google Scholar]
- Cheng, M.; Qu, Y. Does bank FinTech reduce credit risk? Evidence from China. Pac.-Basin Financ. J. 2020, 63, 101398. [Google Scholar] [CrossRef]
- Rafay, A. FinTech as a Disruptive Technology for Financial Institutions; IGI Global: Hershey, PA, USA, 2019. [Google Scholar]
- Dranev, Y.; Frolova, K.; Ochirova, E. The impact of fintech M&A on stock returns. Res. Int. Bus. Financ. 2019, 48, 353–364. [Google Scholar]
- Pi, T.; Hu, H.; Lu, J.; Chen, X. The analysis of Fintech risks in China: Based on fuzzy models. Mathematics 2022, 2, 1395. [Google Scholar] [CrossRef]
- Li, J.; Li, J.; Zhu, X.; Yao, Y.; Casu, B. Risk spillovers between FinTech and traditional financial institutions: Evidence from the US. Int. Rev. Financ. Anal. 2020, 71, 101544. [Google Scholar] [CrossRef]
- Haddad, C.; Hornuf, L. How do fintech start-ups affect financial institutions’ performance and default risk? Eur. J. Financ. 2022, 29, 1761–1792. [Google Scholar] [CrossRef]
- Soloviev, V.I. Fintech ecosystem and landscape in Russia. J. Rev. Glob. Econ. 2018, 7, 377–390. [Google Scholar] [CrossRef]
- Soloviev, V. Fintech ecosystem in Russia. In Proceedings of the 2018 Eleventh International Conference “Management of Large-Scale System Development” (MLSD), Moscow, Russia, 1–3 October 2018; pp. 1–5. [Google Scholar]
- Lee, I.; Shin, Y.J. Fintech: Ecosystem, business models, investment decisions, and challenges. Bus. Horiz. 2018, 2, 35–46. [Google Scholar] [CrossRef]
- Mills, K.G. The Fintech Innovation Cycle. Fintech, Small Business & the American Dream; Springer: Berlin/Heidelberg, Germany, 2018; pp. 67–81. [Google Scholar]
- Goodell, J.W. COVID-19 and finance: Agendas for future research. Financ. Res. Lett. 2020, 35, 101512. [Google Scholar] [CrossRef] [PubMed]
- Giese, J.; Haldane, A. COVID-19 and the financial system: A tale of two crises. Oxf. Rev. Econ. Policy 2020, 36 (Suppl. S1), S200–S214. [Google Scholar] [CrossRef]
- Chevallier, J. COVID-19 pandemic and financial contagion. J. Risk Financ. Manag. 2020, 2, 309. [Google Scholar] [CrossRef]
- Marcu, M.R. The impact of the COVID-19 pandemic on the banking sector. Manag. Dyn. Knowl. Econ. 2021, 9, 205–223. [Google Scholar]
- Li, S.; Yan, Y. DATA-driven shock impact of COVID-19 on the market financial system. Inf. Process. Manag. 2022, 2, 102768. [Google Scholar] [CrossRef]
- Ji, X.; Wang, S.; Xiao, H.; Bu, N.; Lin, X. Contagion effect of financial markets in crisis: An analysis based on the DCC–MGARCH model. Mathematics 2022, 2, 1819. [Google Scholar] [CrossRef]
- Bao, Z.; Huang, D. Shadow banking in a crisis: Evidence from FinTech during COVID-19. J. Financ. Quant. Anal. 2021, 2, 2320–2355. [Google Scholar] [CrossRef]
- Lucey, B.M.; Vigne, S.A.; Yarovaya, L.; Wang, Y. The cryptocurrency uncertainty index. Financ. Res. Lett. 2021, 45, 102147. [Google Scholar] [CrossRef]
- Diniz-Maganini, N.; Diniz, E.H.; Rasheed, A.A. Bitcoin’s price efficiency and safe haven properties during the COVID-19 pandemic: A comparison. Res. Int. Bus. Financ. 2021, 58, 101472. [Google Scholar] [CrossRef] [PubMed]
- Belhassine, O.; Karamti, C. Contagion and portfolio management in times of COVID-19. Econ. Anal. Policy 2021, 72, 73–86. [Google Scholar] [CrossRef]
- Kamran, M.; Butt, P.; Abdel-Razzaq, A.; Djajadikerta, H.G. Is Bitcoin a safe haven? Application of FinTech to safeguard Australian stock markets. Stud. Econ. Financ. 2022, 2, 386–402. [Google Scholar] [CrossRef]
- Chen, Y.; Chiu, J.; Chung, H. Givers or Receivers? Return and volatility spillovers between Fintech and the Traditional Financial Industry. Financ. Res. Lett. 2022, 46, 102458. [Google Scholar] [CrossRef]
- Wang, R.; Liu, J.; Luo, H. Fintech development and bank risk taking in China. Eur. J. Financ. 2021, 27, 397–418. [Google Scholar] [CrossRef]
- Global Fintech Development Report 2020. Available online: http://www.aif.zju.edu.cn/index.php/news/detail/1721.html (accessed on 29 September 2020).
- America Comes First in the Ranking of Global Financial Centers, with China Ranking Third. Available online: http://gb.mofcom.gov.cn/article/jmxw/202106/20210603079385.shtml (accessed on 16 June 2021).
- Diebold, F.X.; Yilmaz, K. Better to give than to receive: Predictive directional measurement of volatility spillovers. Int. J. Forecast. 2012, 2, 57–66. [Google Scholar] [CrossRef]
- Baruník, J.; Křehlík, T. Measuring the frequency dynamics of financial connectedness and systemic risk. J. Financ. Econom. 2018, 2, 271–296. [Google Scholar] [CrossRef]
- Alshater, M.M.; Polat, O.; El Khoury, R.; Yoon, S.-M. Dynamic connectedness among regional FinTech indices in times of turbulences. Appl. Econ. Lett. 2022, 1–6. [Google Scholar] [CrossRef]
- Urom, C. Time–frequency dependence and connectedness between financial technology and green assets. Int. Econ. 2023, 175, 139–157. [Google Scholar] [CrossRef]
- Ha, L.T. Dynamic connectedness between FinTech innovation and energy volatility during the war in time of pandemic. Environ. Sci. Pollut. Res. 2023, 30, 83530–83544. [Google Scholar] [CrossRef] [PubMed]
- El Khoury, R.; Nasrallah, N.; Hussainey, K.; Assaf, R. Spillover analysis across FinTech, ESG, and renewable energy indices before and during the Russia–Ukraine war: International evidence. J. Int. Financ. Manag. Account. 2023, 2, 279–317. [Google Scholar] [CrossRef]
- Abakah, E.J.A.; Tiwari, A.K.; Lee, C.C.; Ntow-Gyamfi, M. Quantile price convergence and spillover effects among Bitcoin, Fintech, and artificial intelligence stocks. Int. Rev. Financ. 2023, 2, 187–205. [Google Scholar] [CrossRef]
- Pacelli, V.; Miglietta, F.; Foglia, M. The extreme risk connectedness of the new financial system: European evidence. Int. Rev. Financ. Anal. 2022, 84, 102408. [Google Scholar] [CrossRef]
- Bhatnagar, M.; Özen, E.; Taneja, S.; Grima, S.; Rupeika-Apoga, R. The Dynamic Connectedness between Risk and Return in the Fintech Market of India: Evidence Using the GARCH-M Approach. Risks 2022, 2, 209. [Google Scholar] [CrossRef]
- Su, X. Dynamic behaviors and contributing factors of volatility spillovers across G7 stock markets. N. Am. J. Econ. Financ. 2020, 53, 101218. [Google Scholar] [CrossRef]
- Khalfaoui, R.; Mefteh-Wali, S.; Viviani, J.L.; Jabeur, S.B.; Abedin, M.Z.; Lucey, B.M. How do climate risk and clean energy spillovers, and uncertainty affect US stock markets? Technol. Forecast. Soc. Chang. 2022, 185, 122083. [Google Scholar] [CrossRef]
- Papież, M.; Rubaszek, M.; Szafranek, K.; Śmiech, S. Are European natural gas markets connected? A time-varying spillovers analysis. Resour. Policy 2022, 79, 103029. [Google Scholar] [CrossRef]
- Golitsis, P.; Gkasis, P.; Bellos, S.K. Dynamic spillovers and linkages between gold, crude oil, S&P 500, and other economic and financial variables. Evidence from the USA. N. Am. J. Econ. Financ. 2022, 63, 101785. [Google Scholar]
- Grampp, W.D. Adam Smith and the economic man. J. Political Econ. 1948, 56, 315–336. [Google Scholar] [CrossRef]
- Markowiz, H. Portfolio selection. J. Financ. 1952, 7, 77–91. [Google Scholar]
- Corradi, V.; Distaso, W.; Mele, A. Macroeconomic determinants of stock volatility and volatility premiums. J. Monet. Econ. 2013, 60, 203–220. [Google Scholar] [CrossRef]
- Engle, R.F.; Ghysels, E.; Sohn, B. Stock market volatility and macroeconomic fundamentals. Rev. Econ. Stat. 2013, 95, 776–797. [Google Scholar] [CrossRef]
- Zhang, P.; Sha, Y.; Xu, Y. Stock market volatility spillovers in G7 and BRIC. Emerg. Mark. Financ. Trade 2021, 57, 2107–2119. [Google Scholar] [CrossRef]
- Hasan, F.; Al-Okaily, M.; Choudhury, T.; Kayani, U. A comparative analysis between FinTech and traditional stock markets: Using Russia and Ukraine war data. Electron. Commer. Res. 2023, 1–26. [Google Scholar] [CrossRef]
- Yang, Z.; Zhou, Y. Quantitative easing and volatility spillovers across countries and asset classes. Manag. Sci. 2017, 63, 333–354. [Google Scholar] [CrossRef]
- Engelhardt, N.; Krause, M.; Neukirchen, D.; Posch, P.N. Trust and stock market volatility during the COVID-19 crisis. Financ. Res. Lett. 2021, 38, 101873. [Google Scholar] [CrossRef]
- Gharbi, O.; Trichili, Y.; Abbes, M.B. Impact of the COVID-19 pandemic on the relationship between uncertainty factors, investor’s behavioral biases and the stock market reaction of US Fintech companies. J. Acad. Financ. 2022, 13, 101–122. [Google Scholar] [CrossRef]
- King, M.A.; Wadhwani, S. Transmission of volatility between stock markets. Rev. Financ. Stud. 1990, 3, 5–33. [Google Scholar] [CrossRef]
- Harasim, J. FinTechs, BigTechs and Banks—When Cooperation and When Competition? J. Risk Financ. Manag. 2021, 14, 614. [Google Scholar] [CrossRef]
- Temelkov, Z. Fintech firms opportunity or threat for banks? Int. J. Inf. Bus. Manag. 2018, 2, 137–143. [Google Scholar]
- Wang, Y.; Nor, E. The Competition and Cooperation Relationship between Financial Technology and Commercial Banks. Glob. Bus. Manag. Res. 2022, 14, 1105–1117. [Google Scholar]
- Anifa, M.; Ramakrishnan, S.; Joghee, S.; Kabiraj, S.; Bishnoi, M.M. Fintech Innovations in the Financial Service Industry. J. Risk Financ. Manag. 2022, 15, 287. [Google Scholar] [CrossRef]
- Peng, L.; Xiong, W. Investor attention, overconfidence and category learning. J. Financ. Econ. 2006, 2, 563–602. [Google Scholar] [CrossRef]
- Zhang, W.; Shen, D.; Zhang, Y.; Xiong, X. Open source information, investor attention, and asset pricing. Econ. Model. 2013, 33, 613–619. [Google Scholar] [CrossRef]
- Hendershott, T.; Menkveld, A.J.; Praz, R.; Seasholes, M. Asset price dynamics with limited attention. Rev. Financ. Stud. 2022, 2, 962–1008. [Google Scholar] [CrossRef]
- Mbanga, C.; Darrat, A.F.; Park, J.C. Investor sentiment and aggregate stock returns: The role of investor attention. Rev. Quant. Financ. Account. 2019, 53, 397–428. [Google Scholar] [CrossRef]
- Lee, W.Y.; Jiang, C.X.; Indro, D.C. Stock market volatility, excess returns, and the role of investor sentiment. J. Bank. Financ. 2002, 26, 2277–2299. [Google Scholar] [CrossRef]
- Kumari, J.; Mahakud, J. Does investor sentiment predict the asset volatility? Evidence from emerging stock market India. J. Behav. Exp. Financ. 2015, 8, 25–39. [Google Scholar] [CrossRef]
- Rupande, L.; Muguto, H.T.; Muzindutsi, P.F. Investor sentiment and stock return volatility: Evidence from the Johannesburg Stock Exchange. Cogent Econ. Financ. 2019, 2, 1600233. [Google Scholar] [CrossRef]
- Andrei, D.; Hasler, M. Investor attention and stock market volatility. Rev. Financ. Stud. 2015, 2, 33–72. [Google Scholar] [CrossRef]
- Joseph, K.; Wintoki, M.B.; Zhang, Z. Forecasting abnormal stock returns and trading volume using investor sentiment: Evidence from online search. Int. J. Forecast. 2011, 2, 1116–1127. [Google Scholar] [CrossRef]
- Huang, T.L.; Chen, M.L.; Kuo, H.J.; Lai, K.L. How do web search activity and financial media coverage affect asset pricing? J. Financ. Stud. 2016, 2, 25–53. [Google Scholar]
- Chen, H.Y.; Lo, T.C. Online search activities and investor attention on financial markets. Asia Pac. Manag. Rev. 2019, 2, 21–26. [Google Scholar] [CrossRef]
- Audrino, F.; Sigrist, F.; Ballinari, D. The impact of sentiment and attention measures on stock market volatility. Int. J. Forecast. 2020, 2, 334–357. [Google Scholar] [CrossRef]
- Pham, L.; Huynh, T.L.D. How does investor attention influence the green bond market? Financ. Res. Lett. 2020, 35, 101533. [Google Scholar] [CrossRef]
- Wu, Y.; Han, L.; Yin, L. Our currency, your attention: Contagion spillovers of investor attention on currency returns. Econ. Model. 2019, 80, 49–61. [Google Scholar] [CrossRef]
- Ibikunle, G.; McGroarty, F.; Rzayev, K. More heat than light: Investor attention and bitcoin price discovery. Int. Rev. Financ. Anal. 2020, 69, 101459. [Google Scholar] [CrossRef]
- Al Guindy, M. Cryptocurrency price volatility and investor attention. Int. Rev. Econ. Financ. 2021, 76, 556–570. [Google Scholar] [CrossRef]
- Smales, L.A. Investor attention in cryptocurrency markets. Int. Rev. Financ. Anal. 2022, 79, 101972. [Google Scholar] [CrossRef]
- The Total Assets of Financial Institutions Reached 419.64 Trillion Yuan by the End of 2022. Available online: http://www.pbc.gov.cn/goutongjiaoliu/113456/113469/4820197/index.html (accessed on 15 March 2023).
- Abakah, E.J.A.; Gil-Alana, L.A.; Arthur, E.K.; Tiwari, A.K. Measuring volatility persistence in leveraged loan markets in the presence of structural breaks. Int. Rev. Econ. Financ. 2022, 78, 141–152. [Google Scholar] [CrossRef]
- Yarovaya, L.; Elsayed, A.H.; Hammoudeh, S. Determinants of Spillovers between Islamic and Conventional Financial Markets: Exploring the Safe Haven Assets during the COVID-19 Pandemic. Financ. Res. Lett. 2021, 43, 101979. [Google Scholar] [CrossRef]
- Hajilee, M.; Al Nasser, O.M. Exchange rate volatility and stock market development in emerging economies. J. Post Keynes. Econ. 2014, 37, 163–180. [Google Scholar] [CrossRef]
- Zhao, H. Dynamic relationship between exchange rate and stock price: Evidence from China. Res. Int. Bus. Financ. 2010, 24, 103–112. [Google Scholar] [CrossRef]
- Demirer, R.; Gabauer, D.; Gupta, R.; Ji, Q. Monetary policy and speculative spillovers in financial markets. Res. Int. Bus. Financ. 2021, 56, 101373. [Google Scholar] [CrossRef]
- Nazlioglu, S.; Erdem, C.; Soytas, U. Volatility spillover between oil and agricultural commodity markets. Energy Econ. 2013, 36, 658–665. [Google Scholar] [CrossRef]
- Jiang, S.; Li, Y.; Lu, Q.; Wang, S.; Wei, Y. Volatility communicator or receiver? Investigating volatility spillover mechanisms among Bitcoin and other financial markets. Res. Int. Bus. Financ. 2022, 59, 101543. [Google Scholar] [CrossRef]
- Da, Z.; Engelberg, J.; Gao, P. In search of attention. J. Financ. 2011, 66, 1461–1499. [Google Scholar] [CrossRef]
- Wang, G.J.; Chen, Y.Y.; Si, H.B.; Xie, C.; Chevallier, J. Multilayer information spillover networks analysis of China’s financial institutions based on variance decompositions. Int. Rev. Econ. Financ. 2021, 73, 325–347. [Google Scholar] [CrossRef]
- Yao, S.; He, H.; Chen, S.; Ou, J. Financial liberalization and cross-border market integration: Evidence from China’s stock market. Int. Rev. Econ. Financ. 2018, 58, 220–245. [Google Scholar] [CrossRef]
- Corbet, S.; Hou, Y.G.; Hu, Y.; Oxley, L.; Xu, D. Pandemic-related financial market volatility spillovers: Evidence from the Chinese COVID-19 epicentre. Int. Rev. Econ. Financ. 2021, 71, 55–81. [Google Scholar] [CrossRef]
- Alvarez, F.; Argente, D.; Lippi, F. A simple planning problem for COVID-19 lock-down, testing, and tracing. Am. Econ. Rev. Insights 2021, 3, 367–382. [Google Scholar] [CrossRef]
- Chen, R.; Chen, H.; Jin, C.; Wei, B.; Yu, L. Linkages and spillovers between internet finance and traditional finance: Evidence from China. Emerg. Mark. Financ. Trade 2020, 2, 1196–1210. [Google Scholar] [CrossRef]
- Sahay, M.R.; von Allmen, M.U.E.; Lahreche, M.A.; Khera, P.; Ogawa, M.S.; Bazarbash, M.; Beaton, M.K. The Promise of Fintech: Financial Inclusion in the Post COVID-19 Era; International Monetary Fund: Washington, DC, USA, 2020. [Google Scholar]
- Dew-Becker, I.; Giglio, S. Asset pricing in the frequency domain: Theory and empirics. Rev. Financ. Stud. 2016, 29, 2029–2068. [Google Scholar] [CrossRef]
- Liu, B.; Xia, X.; Xiao, W. Public information content and market information efficiency: A comparison between China and the US. China Econ. Rev. 2020, 60, 101405. [Google Scholar] [CrossRef]
- Karali, B.; Ramirez, O.A. Macro determinants of volatility and volatility spillover in energy markets. Energy Econ. 2014, 46, 413–421. [Google Scholar] [CrossRef]
- Wang, X. Frequency dynamics of volatility spillovers among crude oil and international stock markets: The role of the interest rate. Energy Econ. 2020, 91, 104900. [Google Scholar] [CrossRef]
- Apostolou, A.; Beirne, J. Volatility spillovers of unconventional monetary policy to emerging market economies. Econ. Model. 2019, 79, 118–129. [Google Scholar] [CrossRef]
Disclaimer/Publisher’s Note: The statements, opinions and data contained in all publications are solely those of the individual author(s) and contributor(s) and not of MDPI and/or the editor(s). MDPI and/or the editor(s) disclaim responsibility for any injury to people or property resulting from any ideas, methods, instructions or products referred to in the content. |
© 2023 by the authors. Licensee MDPI, Basel, Switzerland. This article is an open access article distributed under the terms and conditions of the Creative Commons Attribution (CC BY) license (https://creativecommons.org/licenses/by/4.0/).