Article

A Projection Pursuit Dynamic Cluster Model for Tourism Safety Early Warning and Its Implications for Sustainable Tourism

1
School of Physical Education and Health, Shanghai Business School, Shanghai 200235, China
2
School of Information Management, Shanghai Lixin University of Accounting and Finance, Shanghai 201209, China
3
Department of Mathematics, Wilfrid Laurier University, Waterloo, ON N2L 3C5, Canada
*
Author to whom correspondence should be addressed.
Mathematics 2023, 11(24), 4919; https://doi.org/10.3390/math11244919
Submission received: 26 October 2023 / Revised: 2 December 2023 / Accepted: 8 December 2023 / Published: 11 December 2023

Abstract

:
According to the United Nations World Tourism Organization, tourism promotes sustainable economic development. Ensuring tourism safety is an essential prerequisite for its sustainable development. In this paper, based on the three evaluation index systems for tourism safety early warning and the collected sample data, we establish three projection pursuit dynamic cluster (PPDC) models by applying group search optimization, a type of swarm intelligence algorithm. Based on case studies, it is confirmed that the results derived from the PPDC models are consistent with the expert judgments. The importance of the evaluation indicators can be sorted and classified according to the obtained optimal projection pursuit vector coefficients, and the tourism risks of the destinations can be ranked according to the sample projection values. Among the three aspects influencing tourism safety in case one, the stability of the tourism destination has the most significant impact, followed by the frequency of disasters. Of the ten evaluation indicators, the frequency of epidemic disease affects tourism safety the most, and the unemployment ratio affects it the second most. Overall, the PPDC model can be adopted for tourism safety early warning with high-dimensional non-linear and non-normal distribution data modeling, as it overcomes the “curse of dimensionality” and the limitations associated with small sample sizes.

1. Introduction

Tourism, as an essential part of the modern service industry, has developed rapidly and promoted economic growth. It has become a critical driving force for achieving sustainable development in recent years [1,2,3,4,5]. Also confirmed by the UNWTO (United Nations World Tourism Organization), the tourism industry plays a pivotal role in promoting sustainable development [6,7,8]. The UNWTO clearly states the following: (1) Tourism has the potential to contribute, directly or indirectly, to all of the 17 sustainable development goals in the 2030 Agenda for Sustainable Development; (2) Tourism has mainly been included as targets in Goals 8, 12, and 14 on inclusive and sustainable economic growth, sustainable consumption and production, and the sustainable use of oceans and marine resources, respectively; (3) Sustainable tourism is firmly positioned in the 2030 Agenda for Sustainable Development [7]. As one of the world’s most significant and fastest-growing economic sectors, tourism is well-positioned to foster economic growth and development at all levels and provide income through job creation. Currently, the tourism industry offers one out of every 11 jobs worldwide. Sustainable tourism development relies on good public and privately supplied infrastructure and an innovative environment. The tourism industry can also incentivize national governments to upgrade their infrastructure and retrofit their initiatives, making them more sustainable, resource-efficient, and clean, as a means to attract tourists and other sources of foreign investment. Tourism should also facilitate further sustainable industrialization, which is necessary for economic growth, development, and innovation. Tourism can be a powerful tool for community development and reducing inequalities if it engages local populations and all critical stakeholders. It is also an effective means for developing countries to participate in the global economy. Tourism contributes to and is affected by climate change, and can help tackle one of the most pressing challenges of our time by lowering energy consumption and shifting to renewable energy sources, especially in the transport and accommodation sector. As tourism revolves around billions of encounters between people of diverse cultural backgrounds, the industry can foster multicultural and inter-faith tolerance and understanding, laying the foundation for more peaceful societies. Sustainable tourism, which benefits and engages local communities, can also provide a source of livelihood, strengthen cultural identities, and spur entrepreneurial activities, thereby helping to prevent violence and conflict from taking root and consolidate peace in post-conflict societies. Therefore, sustainable tourism development has become a research hotspot in both academia and industry [9,10,11,12,13,14,15,16,17].
However, the tourism industry development will, to some extent, cause damage to the ecological environment, tourism facilities, transport systems, landscapes, and historical sites. Due to differences in culture, religion, and beliefs, conflicts between tourists and residents and between the tourists are prone to occur. The political stability, such as war and terrorism, crime, and epidemics, of the host country will all affect tourism security and thus interrupt the growth of tourism, as well as cause a downturn in the local travel and tourism economy [18,19,20,21,22,23,24,25,26]. In short, tourism safety threats and heavy casualties that happen to tourists have caused great harm and economic losses to the local government, travel organizers, tourists, and their families, directly threatening the healthy development of the tourism industry. Ensuring tourism safety is thus an important guarantee and prerequisite for developing the tourism industry. Till now, many studies [19,21,23,26,27] paid more attention to tourism safety evaluation and early warning at home and abroad. Several studies [28,29,30,31,32] have further reviewed the advantages, applicability, and shortcomings of the analytic hierarchy process (fuzzy) comprehensive evaluation method, error back-propagation neural network (BPNN) model, and the models combining these methods with BPNN in detail, and have mainly discussed and analyzed the problems existing in the BPNN-combined models from both theoretical and empirical perspectives. Due to length limitations, this article will not provide unnecessary details. The main problem in the literature involving the establishment of a BPNN-combined model is the small size of the training samples, which disqualifies the data sets from building a BPNN model, as the essential requirement is that the number of training samples must be more than, in general, 3 to 5 times the number of network connection weights. Second, validation samples were not used to monitor the training process in real-time to avoid “over-training”, which is highly possible in these cases and would lead to the model’s lack of generalization and practical value. The number of training samples in some literature is even less than that of the input variables (evaluation indicators), yet it is not allowed. Ref. [29] used the TOPSIS method based on information entropy weighing for research on tourism safety early warning and achieved good results. Later, some scholars used the (set pair analysis-) variable fuzzy set method [33,34], the weighted undefined set method [35], and catastrophe theory [36] to explore tourism safety warnings. The literature findings [33,34,35] are consistent with the conclusion of [29]. Still, the methodologies also require the use of the information entropy method to determine the weight of each evaluation indicator in advance. Choosing the relative membership function suggests certain ambiguity, which is both the advantage and disadvantage of the fuzzy methodologies. Ref. [32] believes that the set-pair analysis method simplifies the precise quantitative comparison to the rough result of “different, similar, and opposite” accompanied by the loss of evaluation information. The catastrophe theory adopted by Ref. [36] does not require a prior determination of indicator weights. Still, it involves ranking the indicators according to their importance, and it is not easy to sort them reasonably without determining the consequences.
Moreover, these non-linear methodologies and models are complicated in the modeling process. Under the premise of satisfying the modeling conditions and correctly determining the relative membership functions and evaluation indicator weights, is there a model that is simpler in form and less complicated in the modeling process, meets the accuracy requirements, and is convenient for subsequent application? In theory, the projection pursuit cluster (PPC) model is an emerging comprehensive evaluation model [30,31,37,38] characterized by the linear relationship between the sample project value (score) and each evaluation indicator, the simple structure, the moderate difficulty in the modeling process, and convenient subsequent application. Empirical research has suggested that the PPC model can meet the accuracy requirements raised in exploring tourism safety early warning. Therefore, this paper applies the PPC model to study tourism safety early warning research, hoping to obtain more reliable and reasonable results and provide a new methodology.

2. Establishment of Tourism Safety Early Warning Evaluation Index System and Collection of Sample Data

2.1. Establishment of Tourism Safety Early Warning Evaluation Index System

Four main types of threats or risk may affect tourism safety, which relate to (1) nature, (2) civil conflicts, (3) epidemics, or (4) technology failures. Generally speaking, Tourism safety early warning is a complex systematic project involving many aspects, such as the political stability of a destination, natural disasters (meteorology, geology, and hydrology), diseases, traffic conditions, and cultural conflicts [17,20,21,22,26,29,39,40]. Scholars often establish different evaluation index systems based on their experience, knowledge, and experience, and no consensus has been reached. Since this paper focuses on introducing the PPDC model [41,42] into the research on tourism safety early warning and evaluation and carrying out reliable and correct modeling, no discussion will be made on establishing a scientific and comprehensive index system. To compare and analyze the reliability and validity of different methodologies (models), we directly selected the three evaluation index systems and sample data from Refs. [43,44,45] as the cases for the empirical research. The evaluation index system of Yang et al. [43], which has been used in many studies [29,33,34,35,44], consists of three aspects (the frequency of destination disasters, the safety of tourism facilities, and the stability of the destination area) and ten indicators, specifically as follows.
(1)
The frequency of disasters at a destination: the frequency of hydrometeorological disasters ( x 1 ), the frequency of earthquakes and geological disasters ( x 2 ), and the frequency of epidemic diseases ( x 3 ).
(2)
The safety degree of tourism facilities: the service saturation of tourism facilities ( x 4 ) and the degree of traffic safety ( x 5 ).
(4)
The regional stability of a destination: the political stability ( x 6 ), the social unemployment rate ( x 7 ), the social safety stability ( x 8 ), the rate of consumer price index increase ( x 9 ), and the potential index of host–guest cultural conflict ( x 10 ).
Therefore, based on the investigation and statistics of the indicators of tourist destinations mentioned above, tourism safety early warning is intended to, by using reliable and effective modeling methodologies, objectively, accurately, and scientifically evaluate the degree of tourism safety, determine the risk level, issue warnings to relevant parties, and urge the relevant authorities to take measures to avoid hazards.

2.2. Criteria for Judging Individual Indicators of Tourism Safety Early Warning and the Collection of Sample Data

The tourism safety warning hierarchy is divided into four levels—green (excellent), blue (good), orange (fair), and red (poor). Yang et al. [43] established the criteria for judging the four levels of individual indicators in tourism safety early warning according to China’s actual situation. Refs. [29,33,34,35,44] adopted the index system and judgment criteria, as shown in Table 1.

3. Introduction to the Principle of the Projection Pursuit Classification Model

In 1974, Ref. [37] first proposed the PPC model, which projects high-dimensional, non-linear, and non-normally distributed (small-sized) sample data points into one-to-three-dimensional subspaces in different projection directions (spatial angles) to find the optimal projection direction (an interesting direction) that best reflects the structural characteristics and laws of the original high-dimensional sample data, to obtain the one-dimensional projected value (evaluation value) of the high-dimensional sample data [30,31,37,38]. Its basic idea of modeling is to form all the sample projection points (values) into several classes (clusters), which are dispersed as much as possible in the global scope. In contrast, the sample points within a category are locally as dense as possible to obtain the optimal projection direction and then realize the samples’ comprehensive evaluation, ranking, and classification. It can be seen that the basic modeling idea of PPC is consistent with human thinking of comprehensive assessment, sorting, and classification—it is best to divide all samples into several classes. The class differences are as significant as possible (for easy to classify). In contrast, the models in one category are as similar as possible so that they can be substituted.
According to the basic modeling idea of PPC, Refs. [41,42] proposed and constructed the projection pursuit dynamic cluster (PPDC) model with the following modeling principle.
To initialize a a ( 1 ) , a ( 2 ) , . . . , a ( p ) and set a ( j )   ( j = 1,2 , . . . . . . , p ) to be the projection vector coefficient or weight, we can obtain the projected value of the i th sample,
z i = j = 1 p a ( j ) x ( i , j )
where x ( i , j ) is the normalized value of the i th sample and the j th indicator.
To make the samples’ projection points z ( i ) constitute the set Φ = { z ( 1 ) , z ( 2 ) , . . . . . . , z ( n ) } , and according to the prior knowledge or experience, z ( i ) is dynamically clustered (classified) into K ( K < n ) categories. Then, the dynamic clustering process of the sample points is as follows [41,46,47,48]:
(1)
Setting t i = K 1 z i z m i n z m a x z m i n + 1 ( z m a x and z m i n are the maximum and minimum values of z ( i ) ). If t i is closest to the positive integer k , then z ( i ) is classified as the category k ( 1 k K ). In this way, we classify all sample points z ( i ) into categories K , record them as Ψ 0 = ( ψ 1 0 , ψ 2 0 , . . . , ψ k 0 ) , and record the cluster kernels as M 0 = ( A 1 0 , A 2 0 , . . . . . . , A K 0 ) .
(2)
Iteratively calculate the weights a ( j ) and thus obtain the projected value of the i th sample z ( i ) . We classify all the sample points in Φ into the K categories according to the principle of proximity (the shortest absolute distance between the point i and the K kernels) and record them as
Ψ 1 = ( ψ 1 1 , ψ 2 1 , . . . . . . ψ K 1 )
where ψ k 1 = z i Φ | r ( A k 0 z i ) r ( A q 0 z i ) , q = 1,2 , . . . , K ; q k , r ( A k 0 z i ) , and r ( A q 0 z i ) are the absolute distances between the sample point z i and the A k 0 and A q 0 cluster kernels, respectively.
(2)
Form new K cluster kernels M 1 = ( A 1 1 , A 2 1 , . . . . . . , A K 1 ) , where A 1 = 1 n k i k = 1 n k z ( i k ) , z ( i k ) ψ k 1 , n k is the number of sample points in ψ k 1 .
(4)
Repeat above steps (2)~(3) to obtain the dynamic clustering result sequence Τ l = ( M l , Ψ l ) , l = 1,2 , . . . . To set L ( A k l , Φ k l ) = z ( i ) ψ k l z ( i ) A k l , we obtain the sum of absolute distances between the intra-category sample points of each category after the l th iteration as follows:
μ l = k = 1 K L ( A k l , Φ k l )
It has been theoretically proved that the above iterative process is convergent [41,46,47,48], and the convergence condition for terminating the iteration is
μ l μ l 1 μ l ε
where ε is a sufficiently small allowable value (or a user-specified threshold).
The sum of absolute distances between all two sample points after the iteration is
s ( a ) = z ( i ) , z ( g ) Φ z ( i ) z ( g )
The sum of absolute distances between intra-category two sample points is
d ( a ) = k = 1 K z ( i ) , z ( g ) ψ k z ( i ) z ( g )
The denser the intra-category sample points are, the smaller the value of d ( a ) is.
The sum of absolute distances between samples of different categories is
s d a = [ s ( a ) d ( a ) ]
The larger the s d ( a ) is, the more scattered the sample points on the whole are. The above s ( a ) , d ( a ) , and s d ( a ) are only relevant to the projection vector, coefficients, and sample data.
Friedman’s initial idea of proposing the PPC model is that the sample points are divided into several categories, with each category separated as much as possible, and the sample points within each category are as dense as possible. According to the initial idea, Ref. [42] put forward the objective function of the PPDC model:
Q a = max s a d a d a s . t . 1 a ( j ) 1 , j = 1 p a 2 ( j ) = 1
Optimizing Equation (8), we can obtain the optimal projection vector; the value of [ s ( a ) d ( a ) ] is as large as possible and, at the same time, the value of d a is as small as possible. That is to say, the PPDC model theoretically achieves the goal of “the sample points are as scattered as possible as a whole and form several categories, which are separated from each other as much as possible, while the sample points within a category are as dense as possible”. Ref. [41] set up the PPDC objective function as max [ s ( a ) d ( a ) ] , which only achieves the goal of dispersing the sample points as much as possible on the whole, which is inaccurate and cannot realize Friedman’s initial idea. From the perspective of the PPDC modeling process, the core problem is to determine a reasonable number of categories K and select suitable initial clustering kernels. The number of categories or the initial clustering kernels is different, which may lead to changes in the results.
Equation (8) is a high-dimensional and non-linear optimization problem containing equality and inequality constraints and is challenging to solve. To this end, the authors compile a MATLAB program based on group search optimization (GSO) [48,49] with better global convergence performance and faster convergence speed to solve the optimal projection vector a . Because the parameters in Equations (1)–(8) are composed of absolute distances between different sample points, the theorem proposed by Lou and Qiao [38] to judge whether the optimization process has obtained the proper globally optimal solution is applicable in the PPDC model.

4. Empirical Research on Tourism Safety Early Warning

4.1. Empirical Research by Yang et al. [43]

Yang et al. [43] denote all 48 samples as T1~T48, of which T1~T10, T11~T20, T21~T30, and T31~T40 are respectively excellent, good, fair, and poor, and T41~T48 are validation samples. The indicators x 1 , x 2 , x 3 , x 7 , x 9 , and x 10 are negative, and must be positively transformed. For indicators x 1 , x 2 , x 3 , x 9 , and x 10 , we adopt (1 − x ) to be positively transformed, and for indicator x 7 , we take (0.30 − x 7 ) (Referred to Table 2). The positively transformed data of all 48 samples are shown in Table 2.
We linearly normalize the data of two indicators ( x 4 , x 7 ) into values in [0, 1]. Of all 48 samples, we selected 40 samples (T1–T40) that were used to optimize the projection vector and establish the PPDC model. The other eight samples were used to verify the PPDC model. First, we input the 40 samples’ data into the PPDC program compiled by the authors, take the number of classifications K = 4 , obtain the optimal projection vector and its coefficients a = a ( 1 ) , a ( 2 ) , . . . , a ( 10 ) T = [0.2104, 0.1947, 0.3847, 0.2427, 0.3404, 0.3414, 0.3669, 0.3633, 0.3450, 0.3047)]T, the optimal objective function value Q a =237.02, s ( a ) =256.777, d ( a ) =9.8793, s d ( a ) =246.8977, and z m a x z m i n = 0.9661, and obtain the projected value of samples T1~T40 to be z 1 , z 2 , , z 40 = (2.6296, 2.5712, 2.6079, 2.5771, …, 1.7359, 1.6635, 1.7822).
The studied results show that (1) indicator x 3 is the most important one and has the most impact on tourism safety, indicator x 7 is the second, and then x 8 , x 9 , etc. The indicator x 2 is the least important one. The ratio of the maximum coefficient to the minimum coefficient is 1.88, which shows that all indicators are essential; (2) the projected values of samples through the PPDC model of the three cut-off samples between adjacent safety levels are 2.4694, 2.2207, and 1.9425, respectively. The PPDC model’s output values of samples with excellent, good, fair, and poor tourism safety modes are within the range of 2.4694, 2.2207 to 2.4693, 1.9425 to 2.2206, and <1.9424, respectively. The model output value ranges of excellent samples T1~T10, good samples T11~T20, fair samples T21~T30, and poor samples T31~T40 are 2.5169~2.6296, 2.2773~2.3963, 2.0906~2.1802, and 1.6635~1.8971, respectively. Therefore, the safety levels of the 40 samples are all correctly identified.
We input the normalized data of samples T41~T48 into the above-established PPDC model and obtain the output values 2.6062, 2.4215, 2.4102, 2.2951, 2.0826, 1.9954, 1.8514, and 1.6421, respectively. It is convenient to determine their tourism safety levels as excellent, good, good, good, fair, fair, poor, and poor. The results are consistent with Lou et al. [29] using the TOPSIS method based on information entropy weighing and Yang et al. [36] using the expert method as well as the established BPNN model. The sketch diagram of the output values of T1–T48 and the cut-off values between the adjacent classes are shown in Figure 1.

4.2. Empirical Study with Sample Data by Wang and Li [44]

Ref. [44] established the evaluation index system consisting of ten indicators, namely the service saturation of tourism facilities ( x 1 ), the administration’s ability ( x 2 ), the safety degree of hydrometeorological at a destination ( x 3 ), the frequency of geological disasters ( x 4 ), the social unemployment rate ( x 5 ), the social safety stability ( x 6 ), the safety degree of traffic ( x 7 ), the frequency of epidemic diseases ( x 8 ), the rate of consumer price index increase ( x 9 ), and the potential index of host–guest cultural conflict ( x 10 ). Ref. [44] collected all 13 samples denoted as W1~W13, in which samples W1, W5, and W9 are no-alarm, W2, W3, and W8 are light-alarm, W4, W7, and W10 are medium-alarm, W6 is serious-alarm, and W11~W13 are the verification samples, as shown in Table 3.
The negative indicators x 3 ~ x 5 , x 8 ~ x 10 are first positively preprocessed according to (100 − x ) and then linearly normalized. We input the first ten samples’ data into the PPDC model program compiled by the authors, take the number of classifications K = 4 , and obtain the optimal projection vector and the coefficients a a ( 1 ) , a ( 2 ) , . . . , a ( 10 ) = (0.5441, 0.3036, 0.2394, 0.2554, 0.2577, 0.3174, 0.3583, 0.2829, 0.0410, 0.3348), the objective function value Q a = 16.9141, and s ( a ) = 17.6463, d ( a ) = 0.3661, s d ( a ) = 17.2802, and z m a x z m i n = 1.0296. The model’s output values of samples W1~W10 are 2.7196, 2.4092, 2.3347, 2.1449, 2.7232, 1.6936, 2.0765, 2.3923, 2.6831, and 2.0775, respectively. The clustering results of the ten samples are three no-alarm samples (W1, W5, and W9), three light-alarm samples (W2, W3, and W8), three medium-alarm samples (W4, W7, and W10), and one serious-alarm sample (W6). Therefore, the tourism safety levels judged through the PPDC model for the ten samples are all correct. The output value ranges of no-alarm, light-alarm, and medium-alarm samples are 2.6831~2.7232, 2.3347–2.4092, and 2.0765–2.1419, respectively, and the output value of the serious-alarm selection is 1.6936. The PPDC model output values of samples W11~W13 are 2.4073, 1.6703, and 2.6412, respectively. It is easy to judge the samples W11~W13 as light-alarm, serious-alarm, and no-alarm. The judged results are entirely consistent with the expert opinion as well as the results using the BPNN model in Ref. [44].
The studied result shows that the indicator ( x 1 ) (the service saturation of tourism facilities) is the most important one, followed by the second is the indicator ( x 7 ) (the safety degree of traffic), and the least important is the indicator ( x 9 ) (the rate of consumer price index increase).

4.3. The Empirical Study with Sample Data by Zhu et al. [45]

Zhu et al. [45] established a different evaluation index system than Refs. [43,44]. The system consists of 19 indicators, namely administration ability ( x 1 ), political stability ( x 2 ), social unemployment rate ( x 3 ), the rate of consumer price index increase ( x 4 ), the potential index of host–guest cultural conflict ( x 5 ), social safety stability ( x 6 ), the safety degree of land transportation ( x 7 ), the safety degree of waterborne transportation ( x 8 ), the safety degree of aviation ( x 9 ), the safety degree of tourism facilities ( x 10 ), the occurrence frequency of fire ( x 11 ), food hygiene qualification rate ( x 12 ), the utilization rate of scenic spot facilities ( x 13 ), hotel occupancy rate ( x 14 ), the safety degree of hydrology ( x 15 ), the safety degree of meteorology ( x 16 ), the safety degree of seismology ( x 17 ), the safety degree of geology ( x 18 ), and the frequency of epidemic diseases ( x 19 ), respectively.
Zhu et al. [44] collected 12 samples represented by Z1~Z12, of which samples Z1~Z11 are modeling samples used to optimize the PPDC model, and Z12 is a verification sample. Since Zhu et al. [44] did not specify the nature of the evaluation indicators, in this paper, we judged their natures according to Ref. [43] and indicator characteristics. The indicators x 3 , x 4 , x 5 , x 12 , x 15 , x 16 , x 17 , x 18 , and x 19 are negative; the maximum values of indicators x 3 , x 4 , and x 5 are 0.30, 0.30, and 0.50, and that of the other negative indicators is 1.0. The positively transformed data of the collected samples is shown in Table 4.
The positively transformed data is directly input into the PPDC program compiled by the authors. We take the number of classifications K = 4 , obtain the optimal projection vector and its coefficients (or weights) a a ( 1 ) , a ( 2 ) , . . . , a ( 19 ) = (0.2171, 0.2138, −0.0618, −0.0817, −0.1860, 0.2237, 0.2373, 0.1853, 0.2199, 0.2222, 0.3124, −0.2238, 0.3185, 0.4977, −0.1114, −0.1371, −0.1079, −0.1251, −0.2614), and the objective function value Q a = 25.4097, as well as s ( a ) = 29.1331, d ( a ) = 1.2859, s d ( a ) = 27.8472, and z m a x z m i n = 1.3078.
The output values of samples Z1~Z11, according to the established PPDC model, are 2.0869, 1.9932, 1.8932, 1.6993, 1.5498, 1.4716, 1.3077, 1.2168, 1.1276, 0.8622, and 0.7791, respectively. It can be seen that the rank of the 11 samples is consistent with that of the expert opinion and that obtained through the established BPNN model in Zhu et al. [44]. The PPDC model dynamically clusters the above 11 samples into no-alarm (samples Z1–Z3), light-alarm (samples Z4–Z6), medium-alarm (samples Z7–Z9), and serious-alarm (samples Z10–Z11). We input the linearly normalized data of Z12 into the above-established PPDC model and obtain the output value 1.8349. Comparing the above output values of different safety levels, we can judge that the risk of sample Z12 is greater than Z3 and smaller than Z4. Comparing the model output value ranges of the above four risk levels, we can quickly determine that sample Z12 is no-alarm according to the proximity principle. This result is entirely consistent with that of the expert opinion in Zhu et al. [44]. From the weights of x 3 ~ x 5 , x 12 , x 15 ~ x 19 being less than 0, we can conclude that these indicators are either negative indicators (e.g., the indicator x 3 ~ x 5 ) or have a significant negative correlation with other positive indicator data, but these indicators themselves (e.g., the indicator x 12 , x 15 ~ x 19 ) are undoubtedly positive. At the same time, the indicator x 11 (the occurrence frequency of fire) should be a negative indicator, but due to its significant positive correlation with other positive indicators (such as the administration’s ability and social safety stability) (the authors are surprised by the results and wonder if there are some mistakes in the samples’ data?), its weight is greater than 0.
The sketch diagram of the weights is shown in Figure 2. The absolute value of the weight determines the indicators’ importance, and the greater the absolute value is, the more critical the indicator is.
From Figure 2, we can conclude that the indicator of the hotel occupancy rate ( x 14 ) is the most important one, then the utilization rate of scenic spot facilities ( x 13 ) and the occurrence frequency of fire ( x 11 ). The social unemployment rate ( x 3 ) is the least important indicator.

5. Result and Discussion

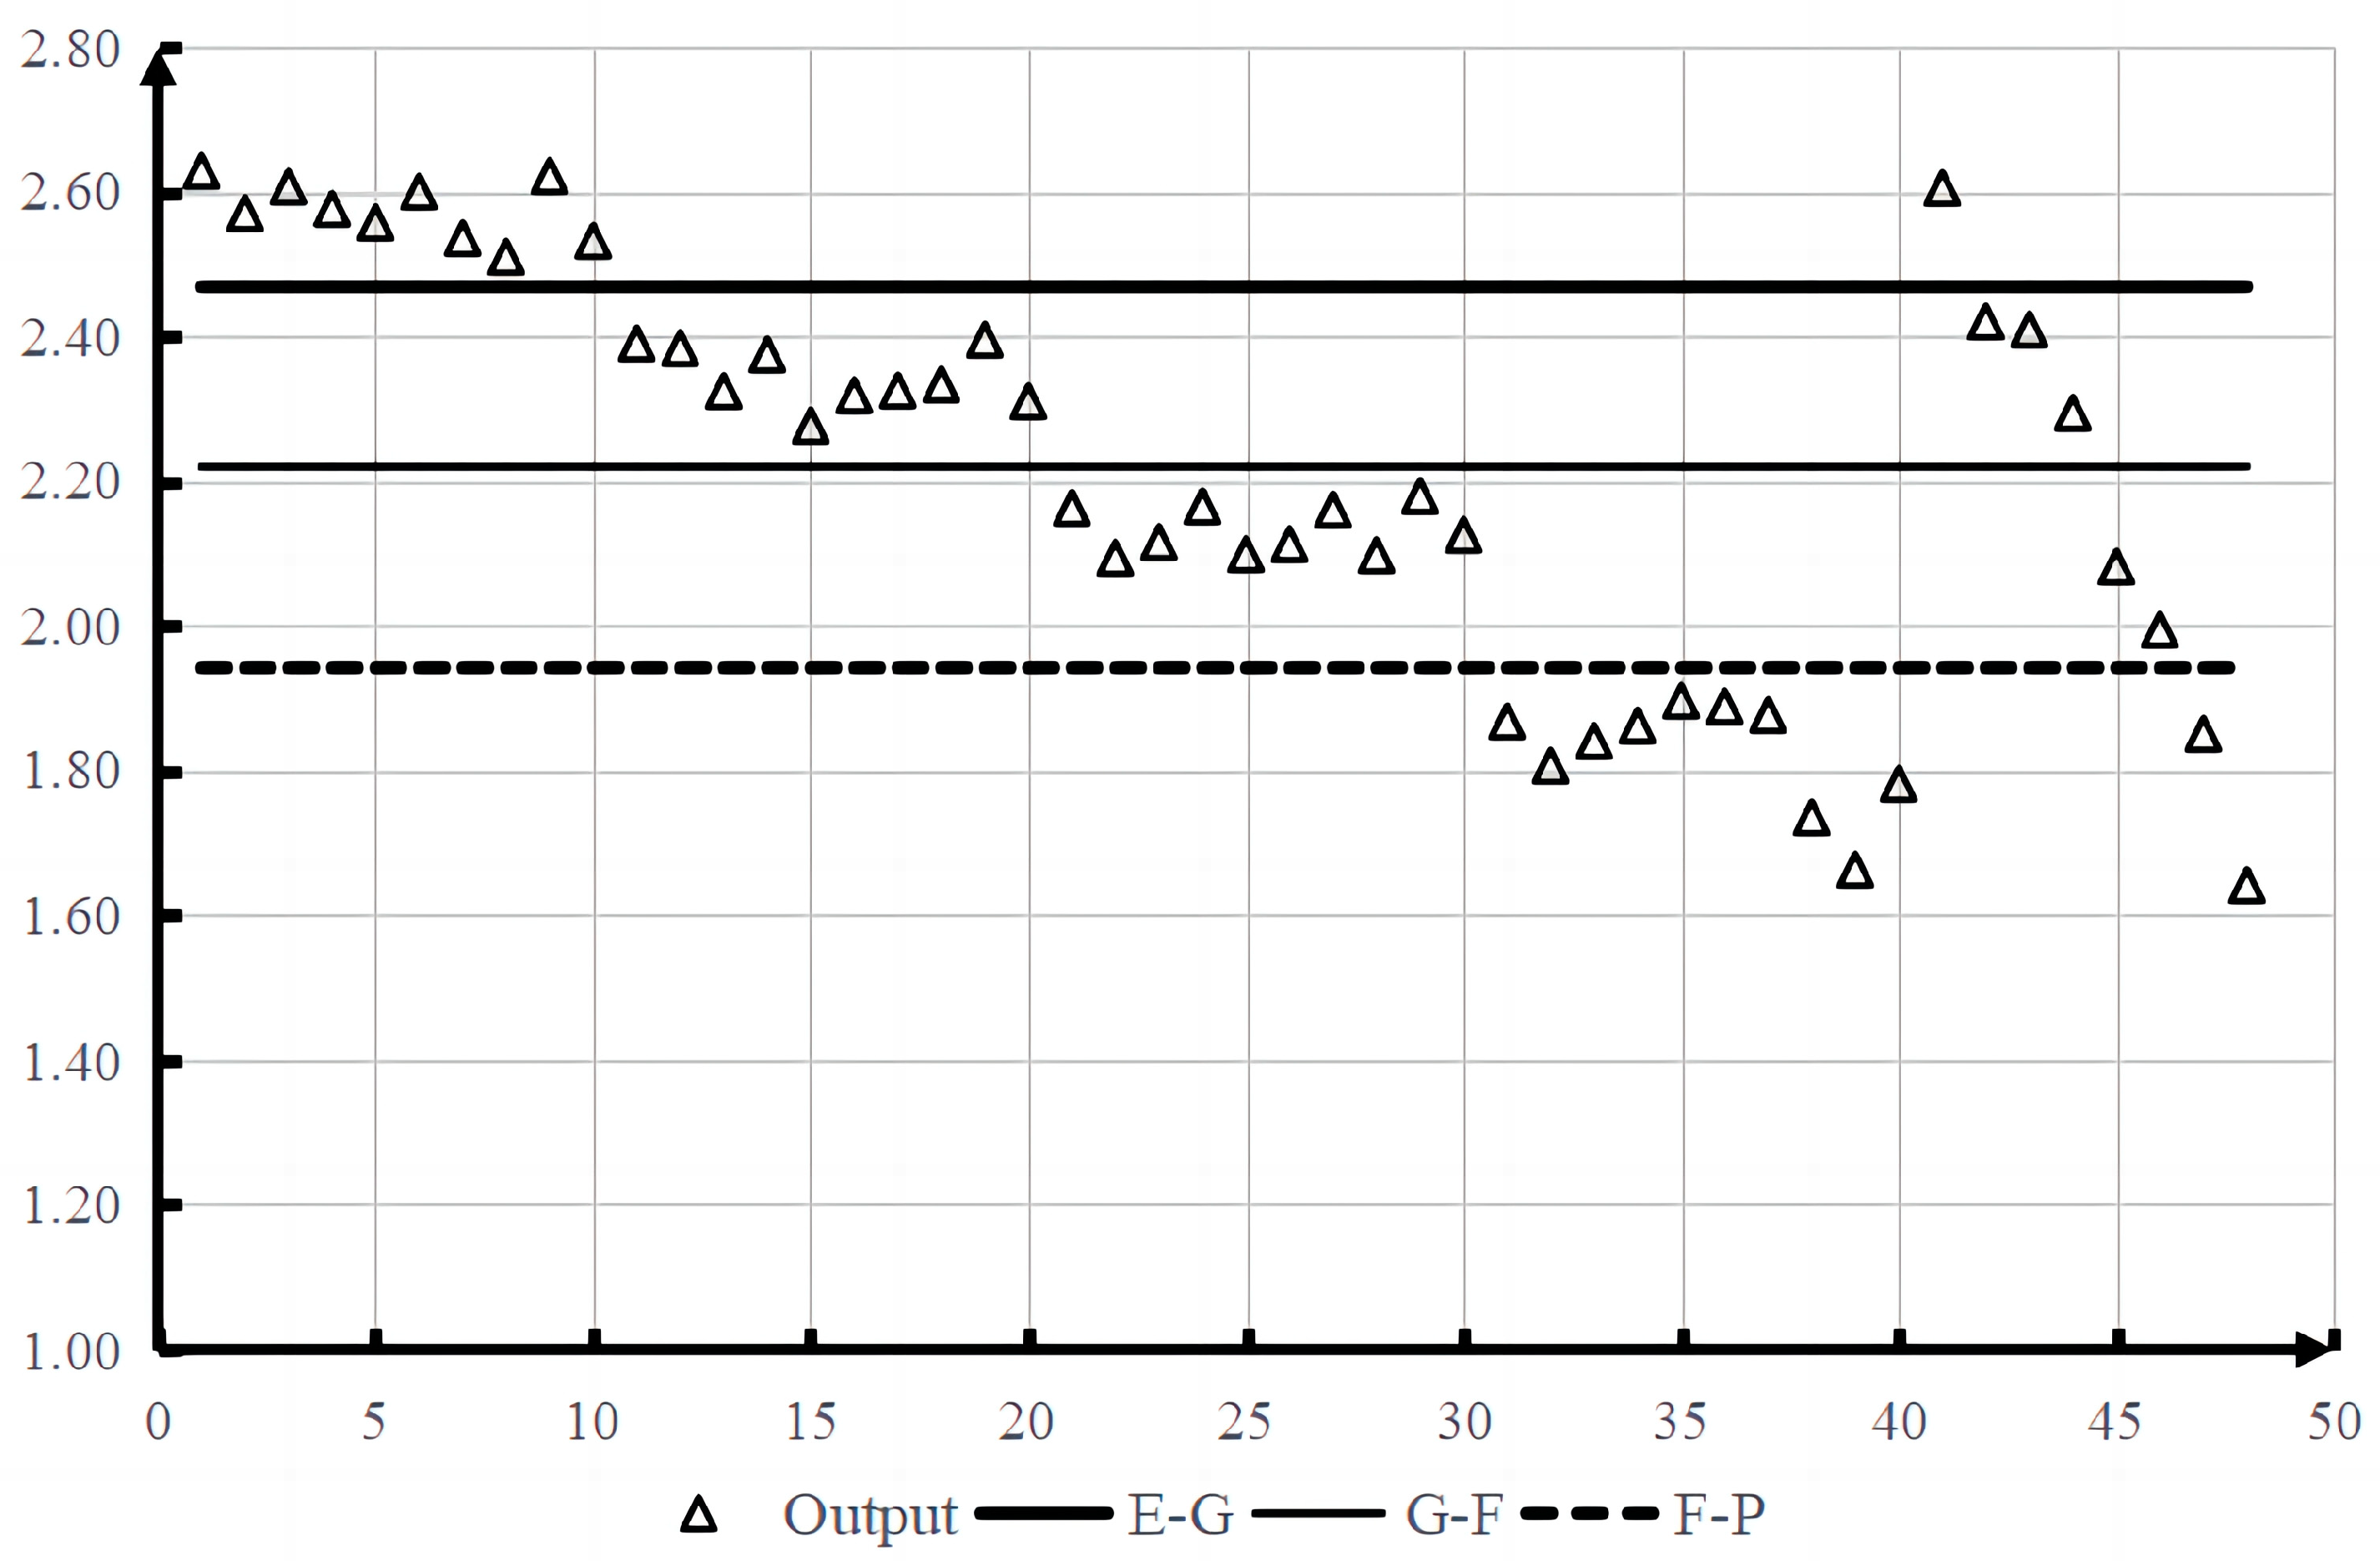
5.1. Analysis of the PPDC Modeling Results of the Data [43,44,45]

Refs. [43,44,45] have 10, 10, and 19 evaluation indicators and 48, 13, and 12 samples, respectively. So, the three cases all belong to the evaluation problem with a small sample and cannot be modeled by PCA, FA, and BPNN [28,50,51,52,53], etc. Still, non-linear methods, such as TOPSIS, GRA, etc., can evaluate them based on information entropy and variation coefficient weighing. The verification results of the PPDC models established in this paper show that (1) the results judged by the PPDC models are entirely consistent with that of the expert judgment-based studies [43,44,45] and those obtained with the TOPSIS method based on the information entropy weighing [29]; (2) the results judged for the eight verification samples in Yang et al. [43] are entirely consistent with the results of Lou et al. [29] and Luo [33,34,35], except that sample T42 differs by one level (the result drawn in this paper is more reasonable, and please refer to Lou et al. [29] for specific analysis); the results of other samples are the same as those of expert-judgment-based Yang et al. [43]. The judgment results of Wang and Li [44] and Zhu et al. [45] are consistent with those obtained through the expert method. The judgment results of Zhu et al. [45] are consistent with those of [29]; (3) the ranking of the 11 modeled samples for the tourism risks is consistent between Zhu et al. [45] and the expert opinions.

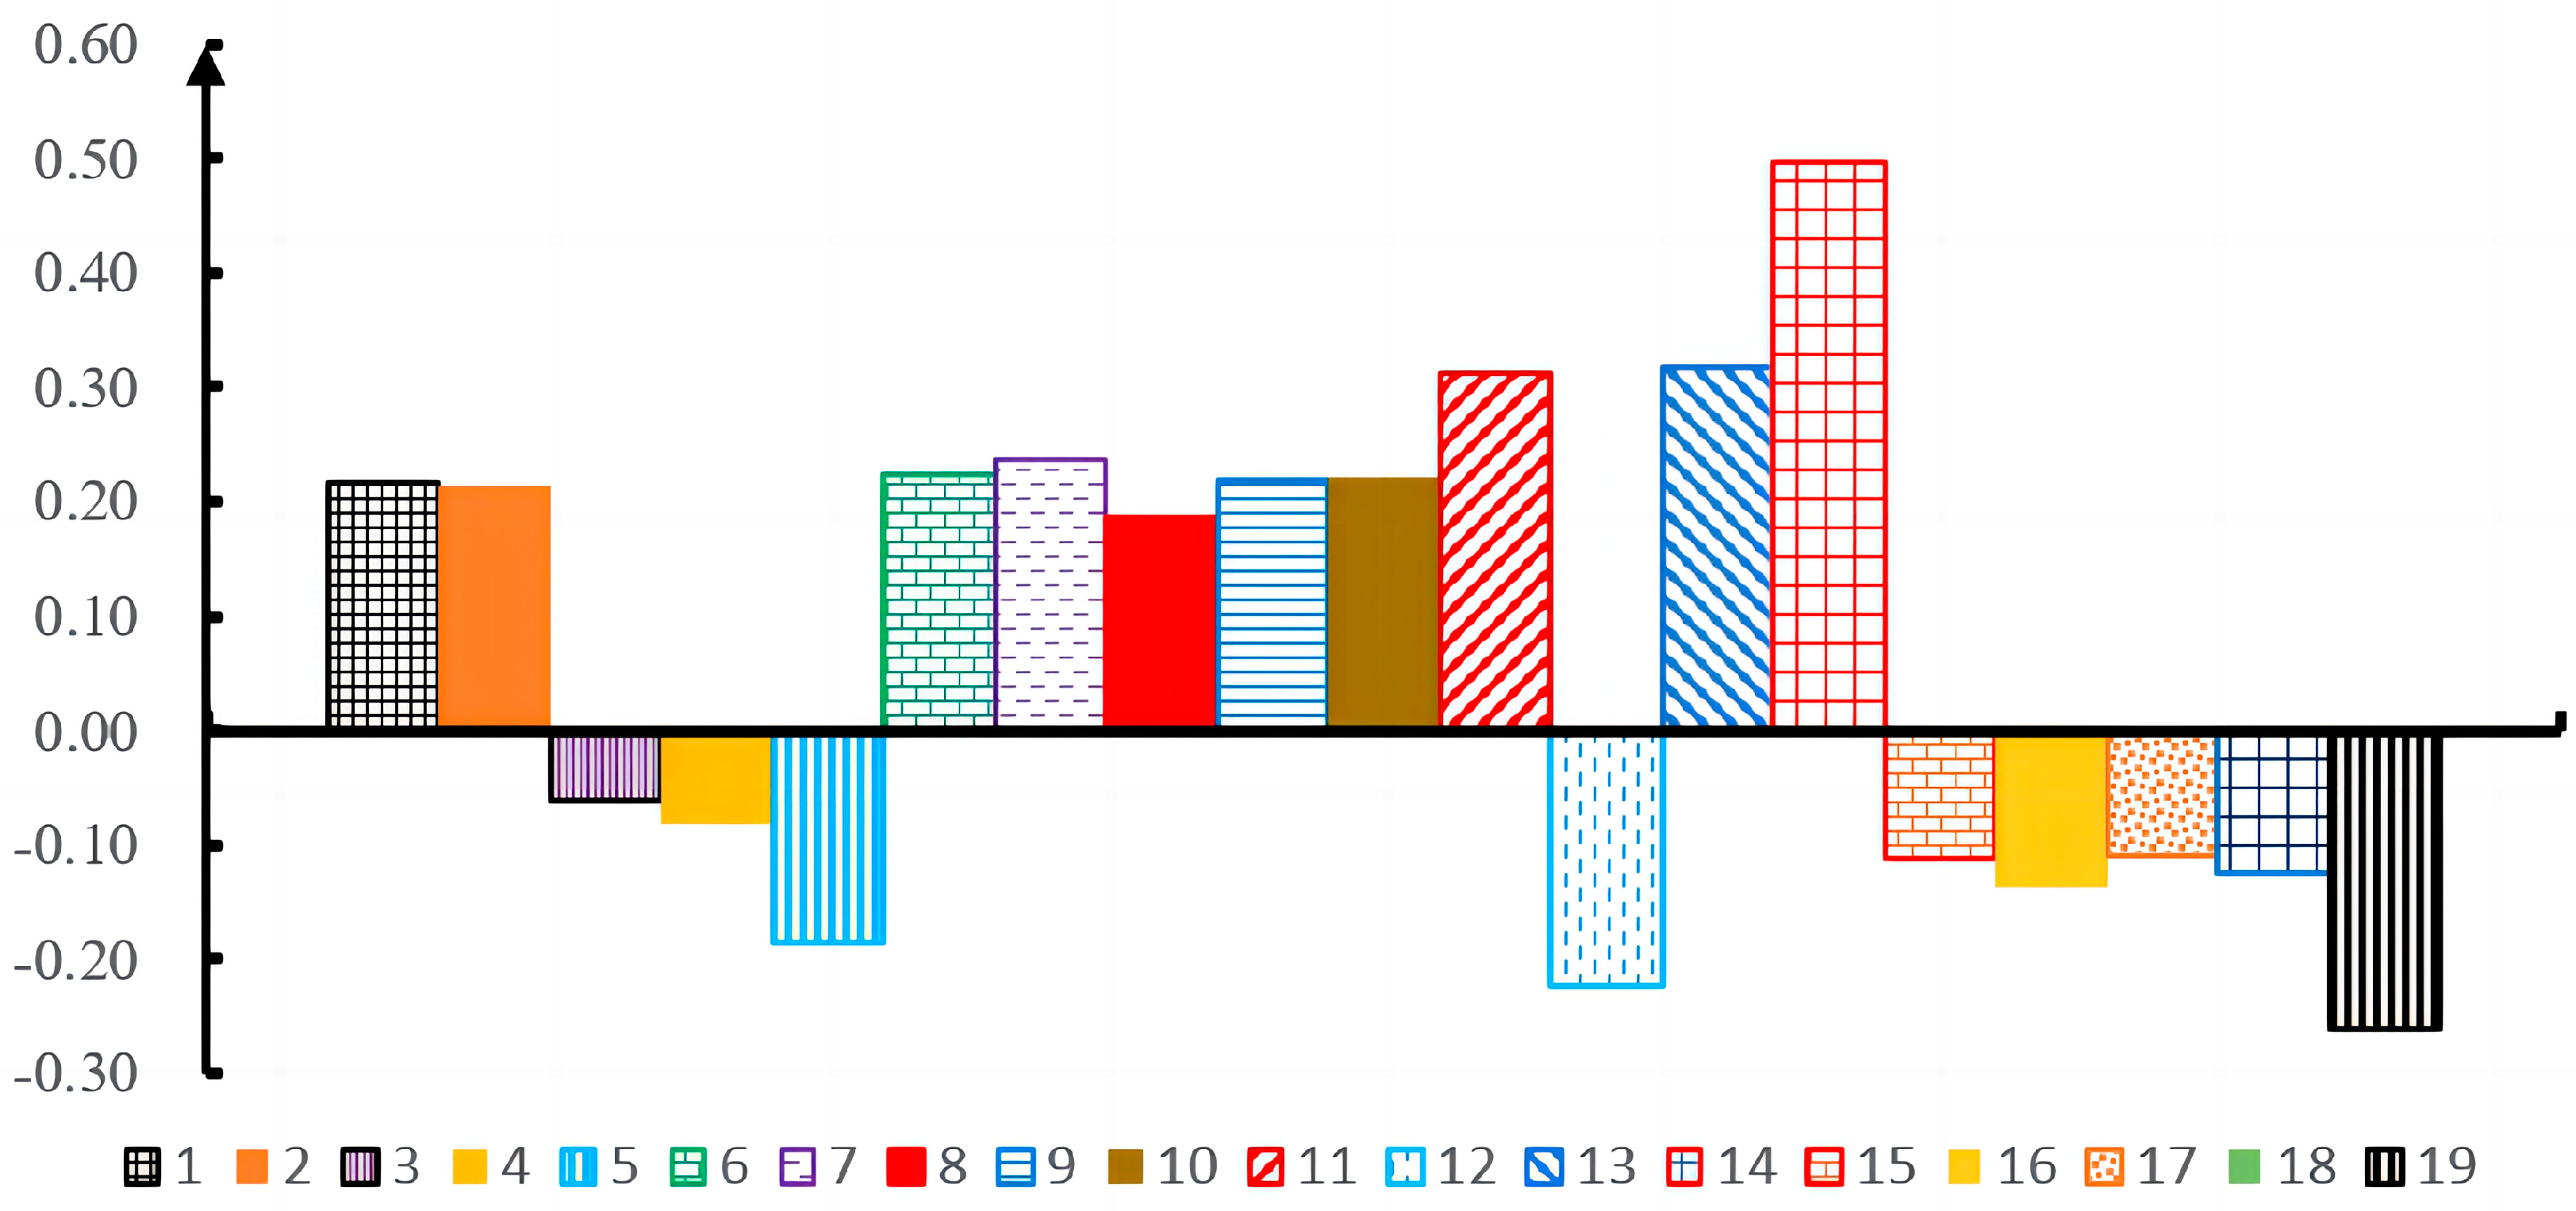
5.2. The Evaluation Indicators Affecting the Levels of Tourism Safety Risk and the Importance of the Three Major Aspects

We take the modeling results of Yang et al. [43] as an example. Among the ten evaluation indicators in Ref. [43], the indicator x 3 (the frequency of epidemic diseases) has the most significant impact on tourism safety, followed by the unemployment rate ( x 7 ), and then, in sequence, social safety stability ( x 8 ), the rate of CPI increase ( x 9 ), political stability ( x 6 ), traffic safety ( x 5 ), a potential indicator of host–guest cultural conflict ( x 10 ), service saturation of tourism facilities ( x 4 ), frequency of hydrometeorological disasters ( x 1 ), and the frequency of earthquakes and geological disasters ( x 2 ). Of the indicators, the first three are significantly more important than the others, while the last three are considerably less critical. Of the three major aspects, the safety degree of a destination is the most important, accounting for 55.6% of the total weight, followed by the frequency of destination disasters (25.5%) and the safety of tourism facilities (18.9%). Therefore, for studying a destination’s tourism safety and early warning, it is necessary to firstly examine the frequency of epidemic outbreaks such as plague in the destination and to secondly examine factors affecting residents’ lives and political stability, such as unemployment rate, social safety stability, and the rate of CPI increase. In contrast, the safety of tourism facilities is relatively less critical.

5.3. Measures and Suggestions to Reduce Tourism Safety Risks

There is a linear relationship between the sample’s projected value (the destination tourism safety score) z i = j = 1 p a ( j ) x ( i , j ) and each evaluation indicator. Therefore, on the whole (highly intuitively), improving the indicator with a larger weight has a more obvious effect on reducing tourism safety risks, usually yielding twice the result with half the effort; otherwise, it would obtain half the result with twice the effort. However, as far as a specific tourist destination is concerned, specific problems should be analyzed accordingly. Specifically, we should analyze the situation of the indicators with the larger weights, confirm the weaker indicators with lower scores, and take targeted measures to improve them. It is an effective measure to reduce the risk of tourism. If measures are blindly taken to improve those indicators with good performance, and it is challenging to improve them further, then, in practice, a large investment would lead to only minor improvement.

5.4. Characteristics of the PPDC Model, Comparison with the other Conventional Evaluation Methods, and the Applicability Analysis

We concluded that the following features characterize the PPDC model for tourism safety evaluation and early warning: (1) Clear mathematical meaning of Equation (8), which clearly shows that the samples are divided into K classes, and the samples in different classes are separated as much as possible. In contrast, samples in a class are as dense as possible. No other clustering methods can achieve this goal; (2) The PPDC model is as simple as possible with not too complicated of a modeling process and is convenient for subsequent applications; (3) It has sufficient accuracy; (4) For the given sample data, we can establish a unique deterministic model, without ambiguity; (5) The PPDC model is particularly suitable for tourism safety evaluation and early warning with a high-dimensional, non-linear, non-normal distribution and small sample data; (6) According to the results of the PPDC model, we can directly judge the importance of each evaluation indicator and thus put forward suggestions and measures to reduce the tourism safety risks. The advantages and disadvantages of various comprehensive evaluation methods are discussed and analyzed as below.
(1)
PPDC model. From a methodological point of view, the idea of a PPDC model is entirely consistent with the way of thinking of human beings for a comprehensive evaluation. Hence, a PPDC model is very suitable for the evaluation, classification, and ranking of tourism safety evaluation and early warning. First, the PPDC model can be applied to the modeling with a high-dimensional, non-linear, non-normal distribution sample data, particularly small samples. In contrast, PCA and FA are only suitable for cases with a strong linear correlation between evaluation indicators (or KMO is greater than 0.60) and obeying normal distribution. It overcomes the defect of the “curse of dimensionality” of PCA, FA, and BPNN models, which are mainly suitable for large sample data [28,48,51,53,54]. Second, according to the theorem proposed by Lou and Qiao [31], it is easy to judge whether the optimization process has obtained the proper, globally optimal solution, and the modeling difficulty is moderate. Third, the PPDC model is characterized by clear mathematical meaning, a linear relationship between the sample projected value (tourism safety score) and the evaluation indicators, and being highly convenient for subsequent applications, facilitating the direct determination of the importance and ranking of each evaluation indicator. Fourth, in the optimization process of the PPDC model, the weights of the evaluation indicator and the projected values of the sample are obtained simultaneously. There is no need to use other methods to determine the indicator weight and the sample’s expectation in advance, like the BPNN model, avoiding the influence of human factors to the greatest extent. Fifth, the empirical research shows that the results of the PPDC model are in good agreement with expert opinions, indicating sufficient accuracy of the PPDC model. Sixth, the PPDC model can integrate expert knowledge or decision-maker preference into its constraints to establish a PPDC model based on decision-maker preference. In contrast, all other comprehensive evaluation methods do not have this trait. Of course, when we build a PPDC model, we should determine a suitable number of classifications and reasonable initial clustering kernels.
(2)
BPNN model. Artificial neural networks are the most popular machine learning algorithm chosen to perform a risk assessment and safety early warning [55,56,57,58,59,60], particularly the BPNN model. Establishing a BPNN model with generalization ability and practical value must follow the required principles and steps [28,51,53,54,61]. First, the BPNN model is only suitable for modeling with large sample data, and it faces the defect of the “curse of dimensionality”. Second, it is necessary to use the “trial-and-error” method to manually determine the reasonable number of hidden layer nodes and other parameters and to judge whether there is “over-training” and other phenomena in the training process, and this method is highly subjective. For the given sample data, it is impossible to obtain exactly the same two models by establishing BPNN models twice before and after, suggesting the existence of ambiguity. Third, the BPNN model, as a non-linear model, cannot be directly used to judge the relationship between the model results and evaluation indicators, to judge the importance of indicators, and to propose measures and suggestions to reduce tourism safety risks, which greatly reduces the theoretical and practical significance of tourism safety evaluation and early warning. Therefore, the BPNN model is only used when other methods cannot achieve or face difficulty achieving satisfactory results and the conditions for BPNN modeling are met. Ref. [51] put forward a rule of thumb: you should aim to have at least five times as many cases (training samples) as connection weights in the network and preferably ten times as many for establishing a reliable and effective BPNN model [61]. The number of data in [43,44,45] is 48, 10, and 10, and the network topology used is 19-14-1 (the connection weights are 295), 10-5-4 (the connection weights 79), and 10-5-4, respectively. There are no validation samples used to monitor the training process; it is impossible to judge whether over-training has occurred. In the case of over-training occurring, even if the error of the training dataset is minimal, and even if the RMSE of the test dataset is casually small, the established model has no generalization ability and practical value. Scholars should pay more attention to this problem. The number of connection weights is obviously greater than the number of the samples in Refs. [43,44,45]. The rule of thumb is not obeyed, and the established BPNN models in Refs. [43,44,45] cannot have generalization ability and practice value [51,53,54,61]. The possible results in establishing a BPNN model with the data used by Yang et al. [46] are detailed given and discussed by Lou et al. [29]. Although Refs. [43,44,45] all described that they obtained the correct results, the established BPNN models still have no generalization ability, and their results are not reliable and accurate.
(3)
TOPSIS and GRA models based on Information Entropy (Lou et al., [29]), variation coefficient [62], and other weighing methods. The rationality of the results of these models directly depends on the rationality of the weighing, which is one of the critical contents of the comprehensive evaluation. This notwithstanding, the TOPSIS and the GRA methods are non-linear evaluation models and cannot be used to judge the relative importance of evaluation indicator and its ranking directly. Furthermore, TOPSIS and GRA models cannot be directly applied to clustering research, and other methods must be used to classify the results. The ranking of the verification samples T41-T48 through the PPDC model is entirely in agreement with that of TOPSIS [29].
(4)
Variable fuzzy set (VFS) method [26,27,28]. The VFS method requires the determination of the weights and relative membership function of each evaluation indicator in advance. Accompanied by the ambiguity feature, it is a non-linear evaluation method that cannot be used to judge the importance and ranking of the evaluation indicator directly. The rankings of sample T42 in Luo [33,34] are inconsistent.
Therefore, PCA, FA, and BPNN cannot be used to model the tourism safety evaluation and early warning problem with small samples. The PPDC model has better characteristics than the TOPSIS and the GRA models based on information entropy or variation coefficient weighing and should be used preferentially in the research on early warning and tourism safety evaluation.

6. Conclusions

Tourism has become a pillar industry in China and its provinces and cities, such as Beijing, Shanghai, Guizhou, Yunnan, etc. The sustainable development of the tourism industry is one of the critical signs for a country or region to achieve sustainable and high-quality economic and social development. It can not only drive employment and protect the ecological environment and historical sites, but also inherit and develop excellent traditional culture, strengthen exchanges and mutual learning between different cultures, and build a community with a shared future for humanity. The development of the tourism industry is influenced by various factors such as the natural environment, transportation, weather, etc. Tourism safety evaluation and early warning are the prerequisites and foundation for implementing sustainable development strategies and formulating policies in the tourism industry. They significantly impact the sustainable development of the local tourism industry.
The modeling idea of the PPDC model is in agreement with the way human beings think for a comprehensive evaluation. The PPDC model realizes the following goal: the sample points are as scattered as possible as a whole and form several clusters (classes), which are as scattered as possible, while the samples within a class are as dense as possible. It is characterized by clear mathematical meaning, a linear relationship between the destination tourism safety degree and evaluation indicator, and is highly convenient for subsequent applications. The PPDC model can be used for modeling with high-dimensional, non-linear, and non-normally distributed data and can overcome the defect of the “curse of dimensionality”. It has unique advantages in comprehensive evaluation, ranking, and classification research in small samples, such as tourism safety evaluation and early warning. It has better objectivity and versatility than other models. The results of the cases show that the results judged through the PPDC model are entirely consistent with those judged through expert opinion and those obtained through the TOPSIS method based on information entropy weighing.
The BPNN model is mainly suitable for large samples, and only by following the required principles and steps could it establish a model with good generalization ability and practical value. Establishing a BPNN model with good generalization ability is impossible using small- and medium-sized samples such as tourism safety evaluation and early warning. Although the TOPSIS, GRA, and VFS models can achieve reasonably good results, they are characterized by the shortcomings of non-linearity, inconvenience for subsequent application, and the need for information entropy or variation coefficient weighing. They cannot be used to determine the importance and ranking of indicators. Therefore, with a small sample, such as tourism safety early warning research, the PPDC model should be preferably used.

Author Contributions

Conceptualization, W.L. and C.Z.; methodology, W.L. and Y.L.; software, W.L.; validation, W.L. and Y.L.; formal analysis, W.L.; investigation, C.Z.; resources, C.Z.; data curation, W.L. and C.Z.; writing—original draft preparation, W.L.; writing—review and editing, W.L. and Y.L.; supervision, C.Z.; project administration, C.Z. All authors have read and agreed to the published version of the manuscript.

Funding

This research received no external funding.

Data Availability Statement

The original data and results are available as required.

Conflicts of Interest

The authors declare no conflict of interest.

References

  1. Parte, L.; Alberca, P. Business performance and sustainability in cultural and rural tourism destinations. Mathematics 2021, 9, 892. [Google Scholar] [CrossRef]
  2. Perez-Rodrıguez, J.V.; Rachinger, H.; Santana-Gallego, M. Does tourism promote economic growth? A fractionally integrated heterogeneous panel data analysis. Tour. Econ. 2022, 28, 1355–1376. [Google Scholar] [CrossRef]
  3. Wang, Y.; Tziamalis, A. International tourism and income inequality: The role of economic and financial development. Tour. Econ. 2023, 29, 1–29. [Google Scholar] [CrossRef]
  4. Vukovic, D.B.; Maiti, M.; Petrovic, M.D. Tourism employment and economic growth: Dynamic panel threshold analysis. Mathematics 2023, 11, 1112. [Google Scholar] [CrossRef]
  5. Jaisinghani, D.; Kaur, M.; Joshi, M.; Sharma, S.; Ahmed, A.D. Impact of political risk and economic growth on the tourism industry: Evidence from a dynamic threshold panel model. Tour. Econ. 2023. [Google Scholar] [CrossRef]
  6. Boluk, K.A.; Rasoolimanesh, S.M. Introduction to the Special Issue on “Deepening Our Understandings of the Roles and Responsibilities of the Tourism Industry towards the United Nations Sustainable Development Goals (SDGs)”. Tour. Manag. Perspect. 2022, 41, 100944. [Google Scholar] [CrossRef]
  7. UNWTO. UNWTO Discussion Paper on Sustainable Tourism for Development. 2015. Available online: http://media.unwto.org/content/unwto-news-1-special-international-year-sustainable-tourism-development-edition (accessed on 9 September 2023).
  8. Wang, X.; Zhang, M.; Jie, S.; Zhang, M.; Zhang, Z. Exploring the coordinated evolution mechanism of regional sustainable development and tourism in China’s “Beautiful China” initiative. Land 2023, 12, 1003. [Google Scholar] [CrossRef]
  9. Destek, M.A.; Aydin, S. An empirical note on tourism and sustainable development nexus. Environ. Sci. Pollut. Res. 2022, 29, 34515–34527. [Google Scholar] [CrossRef] [PubMed]
  10. Dwyer, L. Tourism development to enhance resident well-being: A strong sustainability perspective. Sustainability 2023, 15, 3321. [Google Scholar] [CrossRef]
  11. Farrukh, B.; Younis, I.; Cheng, L.S. The impact of natural resource management, innovation, and tourism development on environmental sustainability in low-income countries. Resour. Policy 2023, 86, 104088. [Google Scholar] [CrossRef]
  12. Kronenberg, K.; Fuchs, M. Aligning tourism’s socio-economic impact with the United Nations’ sustainable development goals. Tour. Manag. Perspect. 2021, 39, 100831. [Google Scholar] [CrossRef]
  13. León-Gómez, A.; Ruiz-Palomo, D.; Fernández-Gámez, M.A.; García-Revilla, M.R. Sustainable tourism development and economic growth: Bibliometric review and analysis. Sustainability 2021, 13, 2270. [Google Scholar] [CrossRef]
  14. Nagendrakumar, N.; Alwis, K.N.N.; Eshani, U.A.K.; Kaushalya, S.B.U. The impact of sustainability practices on the going concern of the travel and tourism industry: Evidence from developed and developing countries. Sustainability 2022, 14, 17046. [Google Scholar] [CrossRef]
  15. Umurzakov, U.; Tosheva, S.; Salahodjaev, R. Tourism and Sustainable Economic Development: Evidence from Belt and Road Countries. J. Knowl. Econ. 2023, 14, 503–516. [Google Scholar] [CrossRef]
  16. Vrana, V. Sustainable tourism development and innovation: Recent advances and challenges. Sustainability 2023, 15, 7224. [Google Scholar] [CrossRef]
  17. Herrera, M.R.G. Tourism Safety and Security with a Sustainability Vision, Ciudad Juarez (Mexico). In Advances in Tourism, Technology and Systems; Abreu, A., Carvalho, J.V., Liberato, D., Galdames, I.S., Eds.; Springer Nature Singapore Pte Ltd.: Singapore, 2023. [Google Scholar]
  18. Buhalis, D.; Costa, C. Tourism Management Dynamics: Trends, Management and Tools; Elsevier Butterworth-Heinemann: Oxford, UK, 2006. [Google Scholar]
  19. Mansfeld, Y.; Pizam, A. Tourism, Security and Safety—From Theory to Practice; Elsevier Inc.: Amsterdam, The Netherlands, 2006. [Google Scholar]
  20. Steene, A.N. Tourism safety and security. Tour. Econ. 2000, 6, 105–108. [Google Scholar] [CrossRef]
  21. Timothy, D.J. Safety and Security Issues in Tourism. In Tourism Management Dynamics: Trends, Management and Tools; Buhalis, D., Costa, C., Eds.; Elsevier: Oxford, UK, 2006. [Google Scholar]
  22. Santana-Gallego, M.; Fourie, J. Tourism falls apart: How insecurity affects African tourism. Tour. Econ. 2022, 28, 995–1008. [Google Scholar] [CrossRef]
  23. Caldeira, A.M.; Seabra, C.; AlAshry, M.S. Contrasting the COVID-19 effects on tourism safety perceptions and coping behavior among young people during two pandemic waves: Evidence from Egypt. Sustainability 2022, 14, 7492. [Google Scholar] [CrossRef]
  24. Agarwal, S.; Page, S.J.; Rob Mawby, R. Tourist security, terrorism risk management and tourist safety. Ann. Tour. Res. 2021, 89, 103207. [Google Scholar] [CrossRef]
  25. Beirman, D. Tourism crisis and safety management. In The SAGE Hanagement; Cooper, C., Volo, S., Gartner, W.C., Scott, N., Eds.; SAGE Publications Ltd.: London, UK, 2018. [Google Scholar]
  26. Xia, J.C.; Sun, P.P. A research on the construction of tourism industry security evaluation index system. J. Urban Stud. 2022, 43, 1–9. [Google Scholar]
  27. Xie, C.W. Study on the construction of tourism security pre-warning system in China. China Saf. Sci. J. 2010, 20, 170–176. [Google Scholar]
  28. Lou, W.G.; Qiao, L. A neural network-based financial risk early warning model and it’s empirical research. Financ. Forum 2011, 16, 52–61. [Google Scholar]
  29. Lou, W.G.; Wang, G.L.; Feng, G.Z. Evaluation of travel security early warnings by applying TOPSIS with information entropy weighting and positive research. Tour. Trib. 2013, 28, 66–74. [Google Scholar]
  30. Yu, Y.H.; Lou, W.G. Comprehensive evaluation and empirical research on the academic quality of physical education and sports journals. J. Beijing Sport Univ. 2015, 38, 46–54. [Google Scholar]
  31. Yu, X.H.; Lou, W.G.; Yu, X.R. The Comprehensive Evaluation and Empirical Research on the Development of China’s Provincial Inclusive Finance. Financ. Forum 2016, 21, 18–32. [Google Scholar]
  32. Su, W.H. Review and recognition on the research of multi-indicators comprehensive evaluation in China. Stat. Res. 2012, 29, 98–107. [Google Scholar]
  33. Luo, J.F. Application of variable fuzzy method in early warning of tourism safety. J. Saf. Sci. Technol. 2014, 10, 181–186. [Google Scholar]
  34. Luo, J.F. Set pair analysis-variable fuzzy method for tourism safety early warning. China Saf. Sci. J. 2015, 25, 151–156. [Google Scholar]
  35. Luo, J.F. Weighted variable fuzzy method of the tourism safety early warning. J. Wuhan Univ. Technol. Inf. Manag. Eng. 2017, 39, 510–513, 518. [Google Scholar]
  36. Zou, Y.G.; Zheng, X.M. Tourism destination safety evaluation based on the catastrophe theory. J. Saf. Sci. Technol. 2014, 10, 175–181. [Google Scholar]
  37. Friedman, J.H.; Tukey, J.W. A projection pursuit algorithm for exploratory data analysis. IEEE Trans. Comput. 1974, C-23, 881–890. [Google Scholar] [CrossRef]
  38. Lou, W.G.; Qiao, L. New theory exploration of projection pursuit clustering model and its positive research. J. Appl. Stat. Manag. 2015, 34, 47–58. [Google Scholar]
  39. Hamm, D.; Su, C.H. Managing tourism safety and risk: Using the Delphi expert consensus method in developing the event tourism security self-beliefs scale. J. Hosp. Tour. Manag. 2021, 49, 364–374. [Google Scholar] [CrossRef]
  40. Rauf, A.; Abbas, A.M.A.; Rafiq, A.; Shakir, S.; Abid, S. The Impact of political instability, food prices, and crime rate on tourism: A way toward sustainable tourism in Pakistan. Sustainability 2022, 14, 16993. [Google Scholar] [CrossRef]
  41. Ni, C.J.; Wang, S.J.; Cui, P. Projection pursuit dynamic cluster model and its application in groundwater classification. J. Sichuan Univ. Eng. Sci. Ed. 2006, 38, 29–33. [Google Scholar]
  42. Yu, X.H.; Luo, W.G.; Kang, H.Y. Dynamic clustering projection pursuit modeling for credit risk assessment of the corporates on supply chain and its positive research. Math. Pract. Theory 2018, 48, 32–40. [Google Scholar]
  43. Yang, J.B.; Huang, Y.L.; Li, F.; Chen, Y. Application of BP neural network in travel security early warning information system. Resour. Dev. Mark. 2007, 23, 108–111. [Google Scholar]
  44. Wang, H.B.; Li, X.F. Application of BP neural network in tourism crisis early warning system. Sci. Technol. Manag. Res. 2012, 32, 209–213. [Google Scholar]
  45. Zhu, X.; Wang, J.; Wu, G.Q. Research on the construction and application of indicators for early warning of tourism security. Tech-Econ. Manag. 2010, S1, 133–136. [Google Scholar]
  46. Ren, R.E.; Wang, H.W. Multivariate Statistical Data Analysis—Theory, Methods, Examples; National Defense Industry Press: Beijing, China, 1999. [Google Scholar]
  47. Tang, Q.Y. Data Processing System (DPS): Experimental Design, Statistical Analysis and Data Mining; Science Press: Beijing, China, 2010. [Google Scholar]
  48. Lou, W.G. Projection Pursuit Theory Based on Swarm Intelligence Optimization Algorithm: New Progress, Application and Software; Fudan University Press: Shanghai, China, 2021. [Google Scholar]
  49. Zhang, W.F.; Liu, H.Y. MATLAB implementation of the improved group search optimizer algorithm. Comput. Inf. Technol. 2010, 18, 44–46. [Google Scholar]
  50. Lee, E.K.; Cook, D. A projection pursuit index for large p small n data. Stat. Comput. 2010, 20, 381–392. [Google Scholar] [CrossRef]
  51. STATSOFT Inc. Electronic Statistics Textbook. Tulsa. 2011. Available online: http://www.statsoft.com/textbook (accessed on 8 June 2023).
  52. Tabachnick, B.G.; Fidell, L.S. Using Multivariate Statistics; Pearson Education, Inc.: London, UK, 2013. [Google Scholar]
  53. Zhang, G.; Patuwo, E.; Hu, M. Forecasting with artificial neural networks: The state of the art. Int. J. Forecast. 1998, 14, 35–62. [Google Scholar] [CrossRef]
  54. Yu, X.H.; Xu, H.Y.; Lou, W.G.; Xu, X.; Shi, V. Examining energy eco-efficiency in China’s logistics industry. Int. J. Prod. Econ. 2023, 258, 108797. [Google Scholar] [CrossRef]
  55. Feng, L.; Hao, Y.K. Optimization algorithm of tourism security early warning information system based on long short-term memory (LSTM). Comput. Intell. Neurosci. 2021, 2021, 9984003. [Google Scholar] [CrossRef] [PubMed]
  56. Guo, W. Safety risk assessment of tourism management system based on PSO-BP neural network. Comput. Intell. Neurosci. 2021, 2021, 1980037. [Google Scholar] [CrossRef]
  57. Hegde, J.; Rokseth, B. Applications of machine learning methods for engineering risk assessment—A review. Saf. Sci. 2020, 122, 104492. [Google Scholar] [CrossRef]
  58. Niu, T.T. Smart safety early warning model of landslide geological hazard based on BP neural network. Saf. Sci. 2020, 123, 104572. [Google Scholar] [CrossRef]
  59. Zhang, H.; Li, Y.; Zhang, H. Risk early warning safety model for sports events based on back propagation neural network machine learning. Saf. Sci. 2019, 118, 332–336. [Google Scholar] [CrossRef]
  60. Zhong, C.H.; Lou, W.G.; Wang, C.T. Neural network-based modeling for risk evaluation and early warning for large-scale sports events. Mathematics 2022, 10, 3228. [Google Scholar] [CrossRef]
  61. Yu, X.; Lou, W. An exploration of prediction performance based on projection pursuit regression in conjunction with data envelopment analysis: A comparison with artificial neural networks and support vector regression. Mathematics 2023, 11, 4775. [Google Scholar] [CrossRef]
  62. Pu, X.G.; Liu, L.M. An empirical tudy on the performance evaluation of databases based on Coefficient of variation and grey relational analysis. Libr. Inf. Serv. 2014, 58, 71–78. [Google Scholar]
Figure 1. The sketch diagram of the output values of the T1-T48 samples and the cut-off values between the adjacent classes. Notes: The lines E–G, G–F, and F–P denote the cut-off values between the excellent and the good, the good and the fair, and the fair and the poor, respectively. The ordinate represents the output value of the samples, and the abscissa represents the samples’ number.
Mathematics 11 04919 g001
Figure 2. The sketch diagram of the weights of the 19 indicators. Note: The ordinate represents the weights, and the abscissa represents the 19 indicators.
Mathematics 11 04919 g002
Table 1. The standard ranges of individual indices in tourism safety early warning and the experts’ judged alarming modes.
Safety StatusFrequency of Hydrometeorological Disasters
( x 1 ) *
Frequency of Earthquakes and Geological Disasters
( x 2 )
Frequency of Epidemic Diseases
( x 3 )
Service Saturation of Tourism Facilities ( x 4 ) **Degree in Traffic Safety
( x 5 )
Political Stability
( x 6 )
Unemployment Rate
( x 7 )
Social Safety Stability
( x 8 )
Rate of Consumer Price Index Increase
( x 9 )
Potential   Index   of   Host Guest   Cultural   Conflict   ( x 10 )Alarming Mode
Excellent0.100.100.100.800.450.700.050.700.050.10Green
Good0.150.150.200.700.350.600.060.600.100.20Blue
Fair0.200.200.300.600.250.500.080.500.200.30Orange
Poor>0.20>0.20>0.30<0.60>0.25<0.50>0.08<0.50>0.20>0.30Red
* The unit is %; ** the upper limit x 4 is 0.95, the upper limit x 7 is 0.30, the upper limits of other indicators are all 1.0, and the lower limits are all 0.
Table 2. The positively transformed data of all 48 samples denoted by T1~T48.
Samples 1 x 1 1 x 2 1 x 3 x 4 x 5 x 6 0.30 x 7 x 8 1 x 9 1 x 10
T10.930.920.930.940.520.750.280.750.970.90
T20.950.930.940.870.510.720.270.700.960.89
T30.960.940.960.930.530.690.290.720.950.84
T40.950.950.920.880.510.770.260.740.960.85
T50.940.900.900.870.470.740.270.710.990.90
T60.910.910.920.950.500.710.280.730.980.91
T70.920.930.910.920.490.730.260.680.950.88
T80.940.890.940.860.460.680.250.720.960.89
T90.930.920.970.940.480.730.280.770.970.87
T100.950.910.950.890.430.690.270.690.980.86
T110.880.890.850.880.420.650.250.650.940.82
T120.870.900.880.860.410.660.240.630.950.83
T130.890.880.870.680.40.640.250.600.930.85
T140.900.870.860.820.380.670.260.660.910.81
T150.880.860.840.800.440.580.240.580.900.77
T160.890.870.790.870.350.590.250.680.890.84
T170.920.840.830.890.390.610.240.640.920.78
T180.860.900.820.850.380.630.260.610.930.79
T190.880.890.900.890.360.680.250.670.900.82
T200.910.850.810.880.370.600.240.620.940.8
T210.850.850.80.760.300.540.230.570.910.75
T220.870.860.710.750.330.520.220.510.880.76
T230.860.820.720.680.320.560.240.560.850.77
T240.810.840.790.790.360.580.240.520.880.72
T250.830.810.740.760.290.570.220.580.840.74
T260.820.820.820.820.280.540.230.540.820.71
T270.850.790.750.770.300.600.240.600.850.76
T280.840.810.780.780.350.510.220.490.830.78
T290.850.800.770.840.340.530.250.550.890.74
T300.830.830.690.770.310.590.230.590.860.75
T310.800.800.600.70.200.450.210.450.810.70
T320.780.750.550.720.220.440.200.420.780.69
T330.810.770.660.740.210.430.220.410.680.68
T340.770.760.760.710.250.460.180.460.720.66
T350.790.780.680.790.280.490.190.420.800.63
T360.760.790.660.750.260.470.210.480.730.65
T370.780.810.670.730.270.500.220.470.620.64
T380.820.790.630.780.240.480.120.500.550.67
T390.810.780.540.760.230.420.130.430.610.63
T400.800.760.720.660.220.510.120.490.720.65
T410.910.940.960.960.450.750.280.730.970.88
T420.940.890.710.880.520.620.260.670.960.89
T430.920.890.850.830.380.680.250.690.940.86
T440.860.840.800.750.430.650.220.680.910.83
T450.840.820.730.680.350.520.230.550.880.69
T460.830.790.680.570.280.580.210.500.850.77
T470.720.800.650.630.260.470.180.500.780.7
T480.790.770.560.580.280.410.150.410.720.48
Table 3. The 13 samples with the safety levels judged by the PPDC model.
Samples x 1 x 2 x 3 x 4 x 5 x 6 x 7 x 8 x 9 x 10 Safety Level
W197.5689.377.368.153.4590.2488.627.470.676.38no-alarm
W277.1379.6512.8113.525.3480.7475.6313.781.5718.52light-alarm
W372.5875.3114.3612.675.8675.2672.3716.242.6216.39light-alarm
W465.3771.4517.8216.237.3869.3163.1825.623.5424.63medium-alarm
W594.7692.845.278.632.5893.1882.236.590.588.12no-alarm
W642.5558.2935.4642.3712.6260.0355.3230.214.3641.28serious-alarm
W758.1168.6216.3918.246.5159.3767.2924.733.0127.58medium-alarm
W878.4977.2613.5614.815.0277.1976.5417.202.7417.62light-alarm
W988.3289.436.547.314.2687.7591.235.130.357.53no-alarm
W1052.7474.8318.4717.537.7373.8464.5127.323.2228.19medium-alarm
W1175.6484.5211.2411.855.4779.3171.2315.631.8315.37light-alarm
W1237.6461.3847.2838.1615.2866.8158.7431.494.6139.56serious-alarm
W1383.7193.268.766.773.1689.3284.868.390.799.12no-alarm
Table 4. The positively transformed data of the 12 collected samples with 19 indicators and the expert opinion (denoted y).
No. x 1 x 2 0.30 x 3 0.30 x 4 0.50 x 5 x 6 x 7 x 8 x 9 x 10 x 11 1.0 x 12 x 13 x 14 1.0 x 15 1.0 x 16 1.0 x 17 1.0 x 18 1.0 x 19 y
10.750.800.280.290.400.750.900.520.850.900.900.920.900.800.940.960.980.950.930.95
20.740.760.270.290.400.710.890.470.800.890.890.910.850.780.930.940.920.960.900.92
30.690.660.270.280.360.690.860.430.780.870.890.950.840.700.910.920.910.920.950.85
40.650.610.250.260.320.650.850.420.750.850.780.880.750.650.910.880.900.890.850.77
50.580.520.240.260.270.580.800.440.720.820.750.850.700.600.900.880.870.860.840.70
60.600.620.240.250.300.620.760.370.700.800.700.800.700.500.910.880.850.850.810.65
70.540.560.230.250.250.570.740.300.650.750.680.790.680.400.880.850.850.830.800.58
80.570.590.220.250.240.580.700.290.620.720.640.760.650.350.850.820.830.830.740.55
90.590.550.230.240.250.590.650.310.600.700.600.730.630.300.830.800.810.820.690.52
100.450.490.210.190.200.450.620.280.580.650.550.690.480.210.800.790.810.820.590.49
110.490.450.190.160.130.420.590.280.540.610.510.640.450.190.790.780.810.780.650.43
120.900.950.260.260.400.750.910.610.850.100.820.850.870.640.860.840.980.920.95/
Disclaimer/Publisher’s Note: The statements, opinions and data contained in all publications are solely those of the individual author(s) and contributor(s) and not of MDPI and/or the editor(s). MDPI and/or the editor(s) disclaim responsibility for any injury to people or property resulting from any ideas, methods, instructions or products referred to in the content.

