Article

A Periodically Rotating Distributed Forcing of Flow over a Sphere for Drag Reduction

1
Intelligent Accident Mitigation Research Division, Korea Atomic Energy Research Institute, 989-111 Daeduck-Daero, Yuseong-gu, Daejeon 34057, Republic of Korea
2
Department of Mechanical Engineering, Ajou University, Suwon-si 16499, Republic of Korea
*
Author to whom correspondence should be addressed.
Mathematics 2023, 11(3), 706; https://doi.org/10.3390/math11030706
Submission received: 6 January 2023 / Revised: 27 January 2023 / Accepted: 28 January 2023 / Published: 30 January 2023
(This article belongs to the Section Engineering Mathematics)

Abstract

:
In the present study, we propose a periodically rotating distributed forcing for turbulent flow over a sphere for its drag reduction. The blowing/suction forcing is applied on a finite slot of the sphere surface near the flow separation, and unsteady sinusoidal forcing velocities are azimuthally distributed on the sphere surface. This forcing profile periodically rotates in the azimuthal direction over time with a forcing frequency, satisfying the instantaneous zero net mass flux. The Reynolds number considered is R e = 10 4 and large eddy simulations are conducted to assess the control performance. It is shown that the drag reduction performance varies with the forcing frequency, and the control results are classified into low-frequency ineffective, effective drag reduction, and high-frequency saturation regimes. With forcing frequencies in the effective drag reduction regime, a helical vortex is generated from the forcing on the sphere and evolves in the shear layer, and this vortex is responsible for the separation delay and flow reattachment resulting in the base pressure recovery and drag reduction. The maximum drag reduction is about 44% with the forcing frequency in the effective drag reduction regime, while controls in other regimes do not produce a drag reduction.

1. Introduction

The control of flow over a bluff body has been one of the long-lasting research subjects in fluid engineering industries and academia [1,2,3]. Control methods for flow over a bluff body can be classified into passive, active open-loop and active closed-loop controls [4]. Among them, the active open-loop control is featured by the use of predetermined control inputs without measuring flow field variables, making it easier to implement than active closed-loop control. Therefore, many active open-loop control methods have been developed and applied to flows over various bluff bodies such as a circular cylinder, a sphere, bodies with a blunt trailing edge, etc. [4,5,6,7,8,9]. In the present study, we focus on investigating an active open-loop control method applied to flow over a sphere as a representative three-dimensional bluff body. Therefore, in the following, we review previous investigations related to this topic.
Kim and Choi [5] first performed the distributed forcing of flow over a circular cylinder. In their study, steady blowing/suction actuations were distributed on the upper and lower surface slots of the circular cylinder near the flow separation, and their amplitudes varied sinusoidally along the spanwise direction, satisfying the zero net mass flux. For both laminar and turbulent flows, they showed that this distributed forcing annihilated or attenuated the Kármán vortex shedding, leading to reductions of the mean drag and lift fluctuations. In addition, they demonstrated that the performance of the distributed forcing was affected by the spanwise period of the sinusoidal profile, amplitude of actuations, and in and out of forcing phases on the upper and lower slots of the circular cylinder. In particular, they achieved a drag reduction of about 25 % for the turbulent flow at the Reynolds number R e d = u d / ν = 3900, where u is the free-stream velocity, d is the cylinder diameter, and ν is the kinematic viscosity. They attributed the attenuation of the vortex shedding to the phase mismatch along the spanwise direction, which disrupted the coherence of the vortex shedding and resulted in three-dimensional vortical structures in the wake. The flow over a circular cylinder is well known for its nominally two-dimensional Kármán vortex shedding [4], and the significance of this study is that this two-dimensional vortical structure can be successfully weakened by the distributed forcing. It is worth noting that similar strategies have been shown to be effective for the control of flow over a cylinder such as wavy cylinder [10], helically twisted elliptic cylinder [11,12], cylinder with tabs [13], and so on.
On the other hand, there have been fewer successful active open-loop controls for flow over a bluff body having nominally three-dimensional vortex shedding, such as flow over a sphere or flow over an axisymmetric body. Kim and Durbin [14] experimentally investigated the effect of a time-periodic acoustic excitation on the turbulent flow over a sphere. In their study, the acoustic excitation was provided by a loudspeaker installed at the wind tunnel inlet and directed to the wind tunnel exit, and the sphere was placed inside the test section of the wind tunnel. The frequencies for the time periodic excitation ranged from that associated with the vortex shedding to that associated with the instability of shear layers. They observed that, with this time periodic excitation, the separating shear layer moved toward the sphere surface and the size of the recirculation region behind the sphere was reduced. Consequently, the base pressure of the sphere decreased and hence the drag exerted on the sphere increased.
As opposed to the approach by Kim and Durbin [14], the experimental study by Jeon et al. [15] installed a time-periodic actuation on the surface of a sphere and showed that this strategy applied to turbulent flow over a sphere at subcritical Reynolds numbers could effectively reduce the drag of the sphere. They provided a time-periodic forcing (blowing and suction) from a slit located before the flow separation line, which was actuated by a speaker inside the sphere. For the Reynolds number of 10 5 , they showed that the drag was reduced by about 50 % at the high forcing frequency regime ( S t d = f d / u 2.85 ), and the amount of drag reduction remained the same for higher forcing frequencies. Here, f is the forcing frequency, and d is the diameter of the sphere. They observed that the control performance was degraded with smaller Reynolds numbers ( R e < 10 5 ). With surface oil flow pattern visualizations, they demonstrated that the drag reduction was due to the fact that the disturbances from the time-periodic forcing delayed the first separation while maintaining laminar separation, and they entrained the high momentum flow in the free stream toward the sphere surface, resulting in the flow reattachment and the delay of the main separation. A similar mechanism can also be found in the drag reduction by dimples on a sphere [16].
Findanis and Ahmed [17] applied a localized synthetic jet to turbulent flow over a sphere. Unlike actuations by Jeon et al. [15] where the actuations were uniformly allocated in the the azimuthal direction, the synthetic jet in this study was realized by a single-pointed round jet located at the sphere surface near the flow separation. This localized synthetic jet generated a three-dimensional and asymmetric forcing profile and was shown to effectively delay the flow separation, causing an overall drag reduction of 12 % .
Oxlade et al. [18] studied the effect of high-frequency forcing on a turbulent axisymmetric wake behind a bluff body model. They activated the forcing with a high-fidelity speaker mounted inside the model to inject a high-frequency periodic jet below the point of separation. With the control, the time-averaged area-weighted pressure on the model base increased by 35 % at forcing frequencies roughly five times the shear layer frequency. According to their study, the high-frequency jet created a row of closely spaced vortex rings in the wake, which would be responsible for the attenuation of the flow entrainment and the reduction in the pressure drag.
A numerical study by Jardin and Bury [6] investigated a distributed forcing applied to the flow past a blunt-based axisymmetric bluff body at the Reynolds numbers of 800 and 1000. Similar to Kim and Choi [5], they adopted a steady and azimuthally distributed blowing/suction actuation imposed on the trailing edge of the bluff body, and examined the effects of the forcing profile by varying its wavelength, amplitude, etc. With this approach, it was demonstrated that drag fluctuations experienced by the bluff body could be effectively reduced. However, it was observed that the distributed forcing did not produce a significant reduction of the mean drag. This indicates that, unlike the distributed forcing applied to the flow over a cylinder discussed above [5], that applied to flow over a axisymmetric body may not be so successful. The wake behind an axisymmetric body such as a sphere is naturally three-dimensional, and therefore, adding more three-dimensionality through the distributed forcing would make little difference in the unsteady wake characteristics behind an axisymmetric body [4].
As discussed above, previous studies on the distributed forcing typically adopted a steady forcing with fixed locations of the maximum magnitudes for blowing/suction actuations [5,6,19]. In the present study, we propose an unsteady distributed forcing and apply it to the turbulent flow over a sphere, a representative three-dimensional and axisymmetric bluff body. In this approach, we impose an unsteady distributed forcing on the sphere surface, for which the locations for the maximum blowing/suction amplitudes periodically rotate in the azimuthal direction over time (see Figure 1). This periodically rotating distributed forcing is different from previous time-periodic forcings [15,18] in that its forcing profile retains a large-scale variation in the space and it satisfies the instantaneous zero net mass flux. The goals of the present study are to assess the performance of the periodically rotating distributed forcing in reducing the drag exerted on the sphere and to analyze the near-wake characteristics modified by the control. The control strategy and numerical details are described in Section 2. The control results are presented and discussed in Section 3, followed by the conclusions in Section 4.

2. Control Strategy and Numerical Details

2.1. Control Strategy

In the present study, we investigate the periodically rotating distributed forcing applied to turbulent flow over a sphere, which is given as follows:
ψ ( t , θ ) = V 0 cos ( θ 2 π f t ) ,
where ψ is the forcing velocity on the sphere surface, V 0 is the maximum forcing velocity, θ is the azimuthal direction, f is the forcing frequency, and t is the time. Figure 1 shows the schematic diagram for the present control method. As shown in Figure 1a, the slot for the forcing is located near the flow separation on the sphere, and its finite streamwise width is 0.1 d with ϕ 1 = 84 and ϕ 2 = 96 . As shown in Figure 1b,c, the blowing and suction forcing velocities are azimuthally ( θ ) distributed on the sphere surface, and the forcing profile periodically rotates over time at the forcing frequency f in the azimuthal direction. The positive and negative values of ψ in Equation (1) correspond to the blowing and suction forcings on the sphere surface, respectively, and fluxes from blowing and suction are the same at every instance ensuring the instantaneous zero net mass flux. In Equation (1), the present active open-loop control method contains two predetermined parameters of f and V 0 . This study considers various values of f and V 0 to evaluate their effects on the reduction of the drag exerted on the sphere.
In this study, to investigate the periodically rotating distributed forcing, we conduct numerical simulations of turbulent flow over a sphere. The forcing in Equation (1) is realized by the velocity boundary condition on the sphere surface based on the immersed boundary method [20]. We note that the immersed boundary method used in this study [20] has been successfully applied to a wide variety of active control methods that use blowing/suction on solid walls [21,22,23,24].

2.2. Numerical Details

In the present study, we perform large eddy simulations (LES) of turbulent flow over a sphere. The governing equations are unsteady filtered incompressible continuity and Navier–Stokes equations on the cylindrical coordinate system:
u ¯ i x i q = 0 ,
u ¯ i t + u ¯ i u ¯ j x j = p ¯ x i + 1 R e 2 u ¯ i x j x j τ i j x j + f i ,
where ( ) ¯ indicates the filtering operation for LES, x i ’s are the cylindrical coordinates, u i ’s are the corresponding velocity components, p is the pressure, and τ i j = u i u j ¯ u ¯ i u ¯ j is the subgrid-scale (SGS) stress tensor. f i and q are the momentum forcing and the mass source/sink for the immersed boundary method, respectively [20]. All the variables are non-dimensionalized by the sphere diameter d and the free-stream velocity u . The Reynolds number is defined as R e = u d / ν .
A staggered grid system is employed in this study, and thus, u i and f i are defined at the cell face, whereas p and q are defined at the cell center. A fractional-step method [25] is adopted for the decoupling of the pressure and the velocity in the Navier–Stokes equation. In this study, we use a second-order semi-implicit time advancement scheme consisting of a third-order Runge–Kutta method (RK3) for the convection term and the second-order Crank–Nicolson method (CN2) for the diffusion term [26]. Mainly, the second-order central difference scheme is used for the discretizations of spatial derivative terms, while a third-order QUICK scheme is partly used for the discretization of the convection term in the laminar acceleration region over the sphere [27].
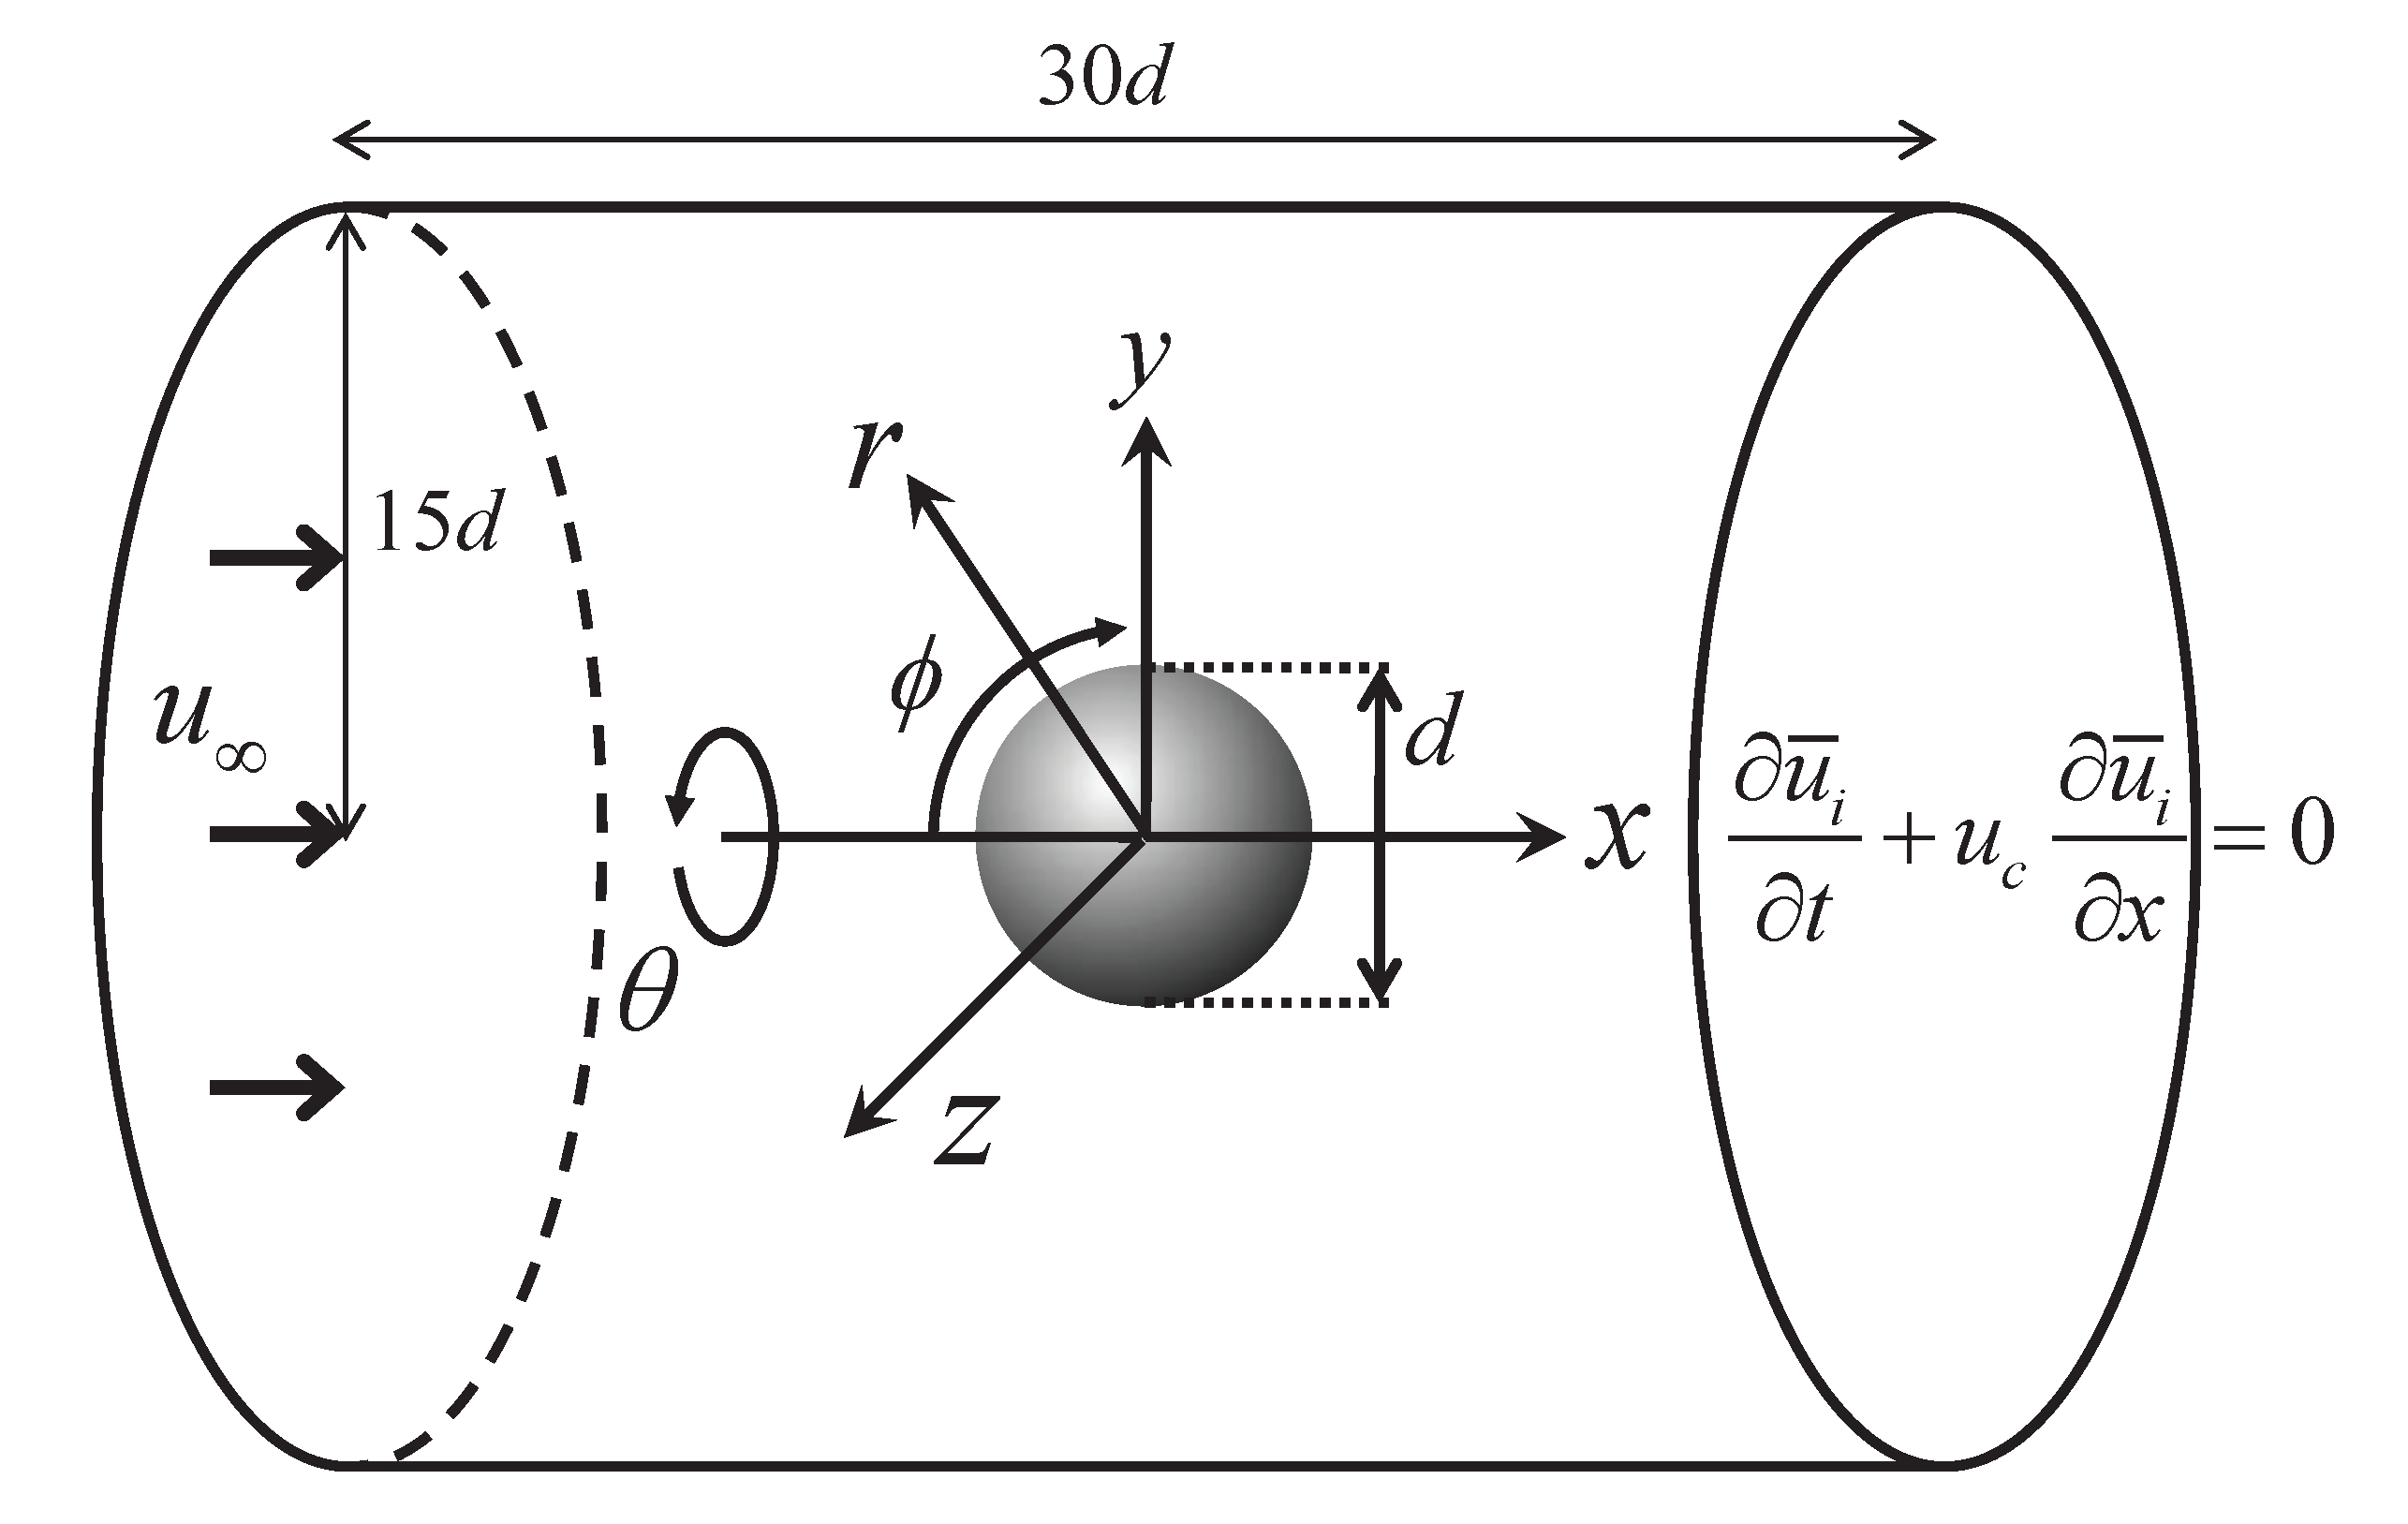
Figure 2 shows the coordinate system, computational domain and boundary conditions used in this study. As stated before, we use the cylindrical coordinate system, where x, r and θ denote the streamwise, radial and azimuthal directions, respectively. A Cartesian coordinate system ( x , y , z ) is also adopted in order to define the drag and lift forces, where the lift force is composed of two orthogonal (y and z) components which are perpendicular to the streamwise direction (x). The computational domain used is 15 x / d 15 , 0 r / d 15 , and 0 θ 2 π , where ( x / d = 0 , r / d = 0 ) corresponds to the center location of the sphere. The number of grid points used is 705 ( x ) × 181 ( r ) × 64 ( θ ) . Figure 3 shows grid distributions near the sphere in both y-z and x-r planes. As shown, grid lines for the mesh do not necessarily coincide with the geometry of the sphere owing to the adoption of the immersed boundary method [20]. To accurately capture the flow near the sphere wall, we allocate 200 streamwise grid points in 1 x / d 1 . The immersed boundary method used in this study [20] is classified as a discrete forcing method [28]. We note that this immersed boundary method [20] has been extensively applied to turbulent flows over various complex bluff bodies and produced accurate predictions for them [11,24,29,30,31]. Non-uniform meshes are used and dense resolutions for r / d 0.5 are allocated to accurately capture the separating shear layer around the sphere. A Dirichlet boundary condition ( u x = u , u r = 0 , u θ = 0 ) is used at the inflow and far-field boundaries ( r / d = 15 ), and a convective boundary condition ( u i / t + u c u i / x = 0 ) is used for the outflow boundary, where u c is the space-averaged streamwise velocity at the exit. The numerical accuracy is confirmed by increasing the number of grid points in each direction.
In the present study, for the modeling of the SGS stress tensor τ i j in Equation (3), we adopt the dynamic global subgrid-scale eddy-viscosity model based on the Germano identity [29,32]:
τ i j 1 3 τ k k δ i j = 2 ν T S ¯ i j ,
S ¯ i j = 1 2 u ¯ i x j + u ¯ j x i ,
where ν T is the eddy viscosity and S ¯ i j is the filtered strain rate tensor. ν T is determined by the Vreman eddy viscosity model [33] in the following form,
ν T = C v B β ¯ α ¯ i j α ¯ i j ,
α ¯ i j = u ¯ j x i ,
B β ¯ = β ¯ 11 β ¯ 22 + β ¯ 11 β ¯ 33 + β ¯ 22 β ¯ 33 β ¯ 12 2 β ¯ 13 2 β ¯ 23 2 ,
β ¯ i j = m = 1 3 Δ ¯ m 2 α ¯ m i α ¯ m j ,
where C v is the Vreman model coefficient, and Δ ¯ denotes the size of grid filter. The Vreman model guarantees theoretically zero subgrid-scale dissipation for various laminar shear flow regions. In the previous studies, it was shown that the value of C v for the accurate prediction of turbulent flow depends on the flow configurations [29,32,34]. Therefore, in this study, by using the dynamic global procedure based on the Germano identity, C v is dynamically determined in the following form [32]:
C v = 1 2 L i j M i j V M i j M i j V ,
L i j = u ¯ i u ¯ j ˜ u ¯ ˜ i u ¯ ˜ i ,
M i j = B β ¯ ˜ α ¯ ˜ i j α ¯ ˜ i j S ¯ ˜ i j B β ¯ α ¯ i j α ¯ i j S ¯ i j ˜ .
Here, V denotes the instantaneous volume averaging for the entire computational domain, and thus, C v is constant in space but a function of the time.

3. Results and Discussion

3.1. Uncontrolled Flow

Table 1 shows the flow statistics of the uncontrolled flow over a sphere at R e = 10 4 from the present numerical simulation together with those from previous studies. In the table, the mean drag coefficient ( C D ), mean base pressure coefficient ( C p b ), and mean separation angle ( ϕ s ) are presented. The mean separation angle ϕ s is measured from the stagnation point of the sphere, and obtained by averaging over the azimuthal direction ( θ ) and the time. As shown in Table 1, the flow statistics from the present large eddy simulation are generally in good agreements with those from the previous investigations.
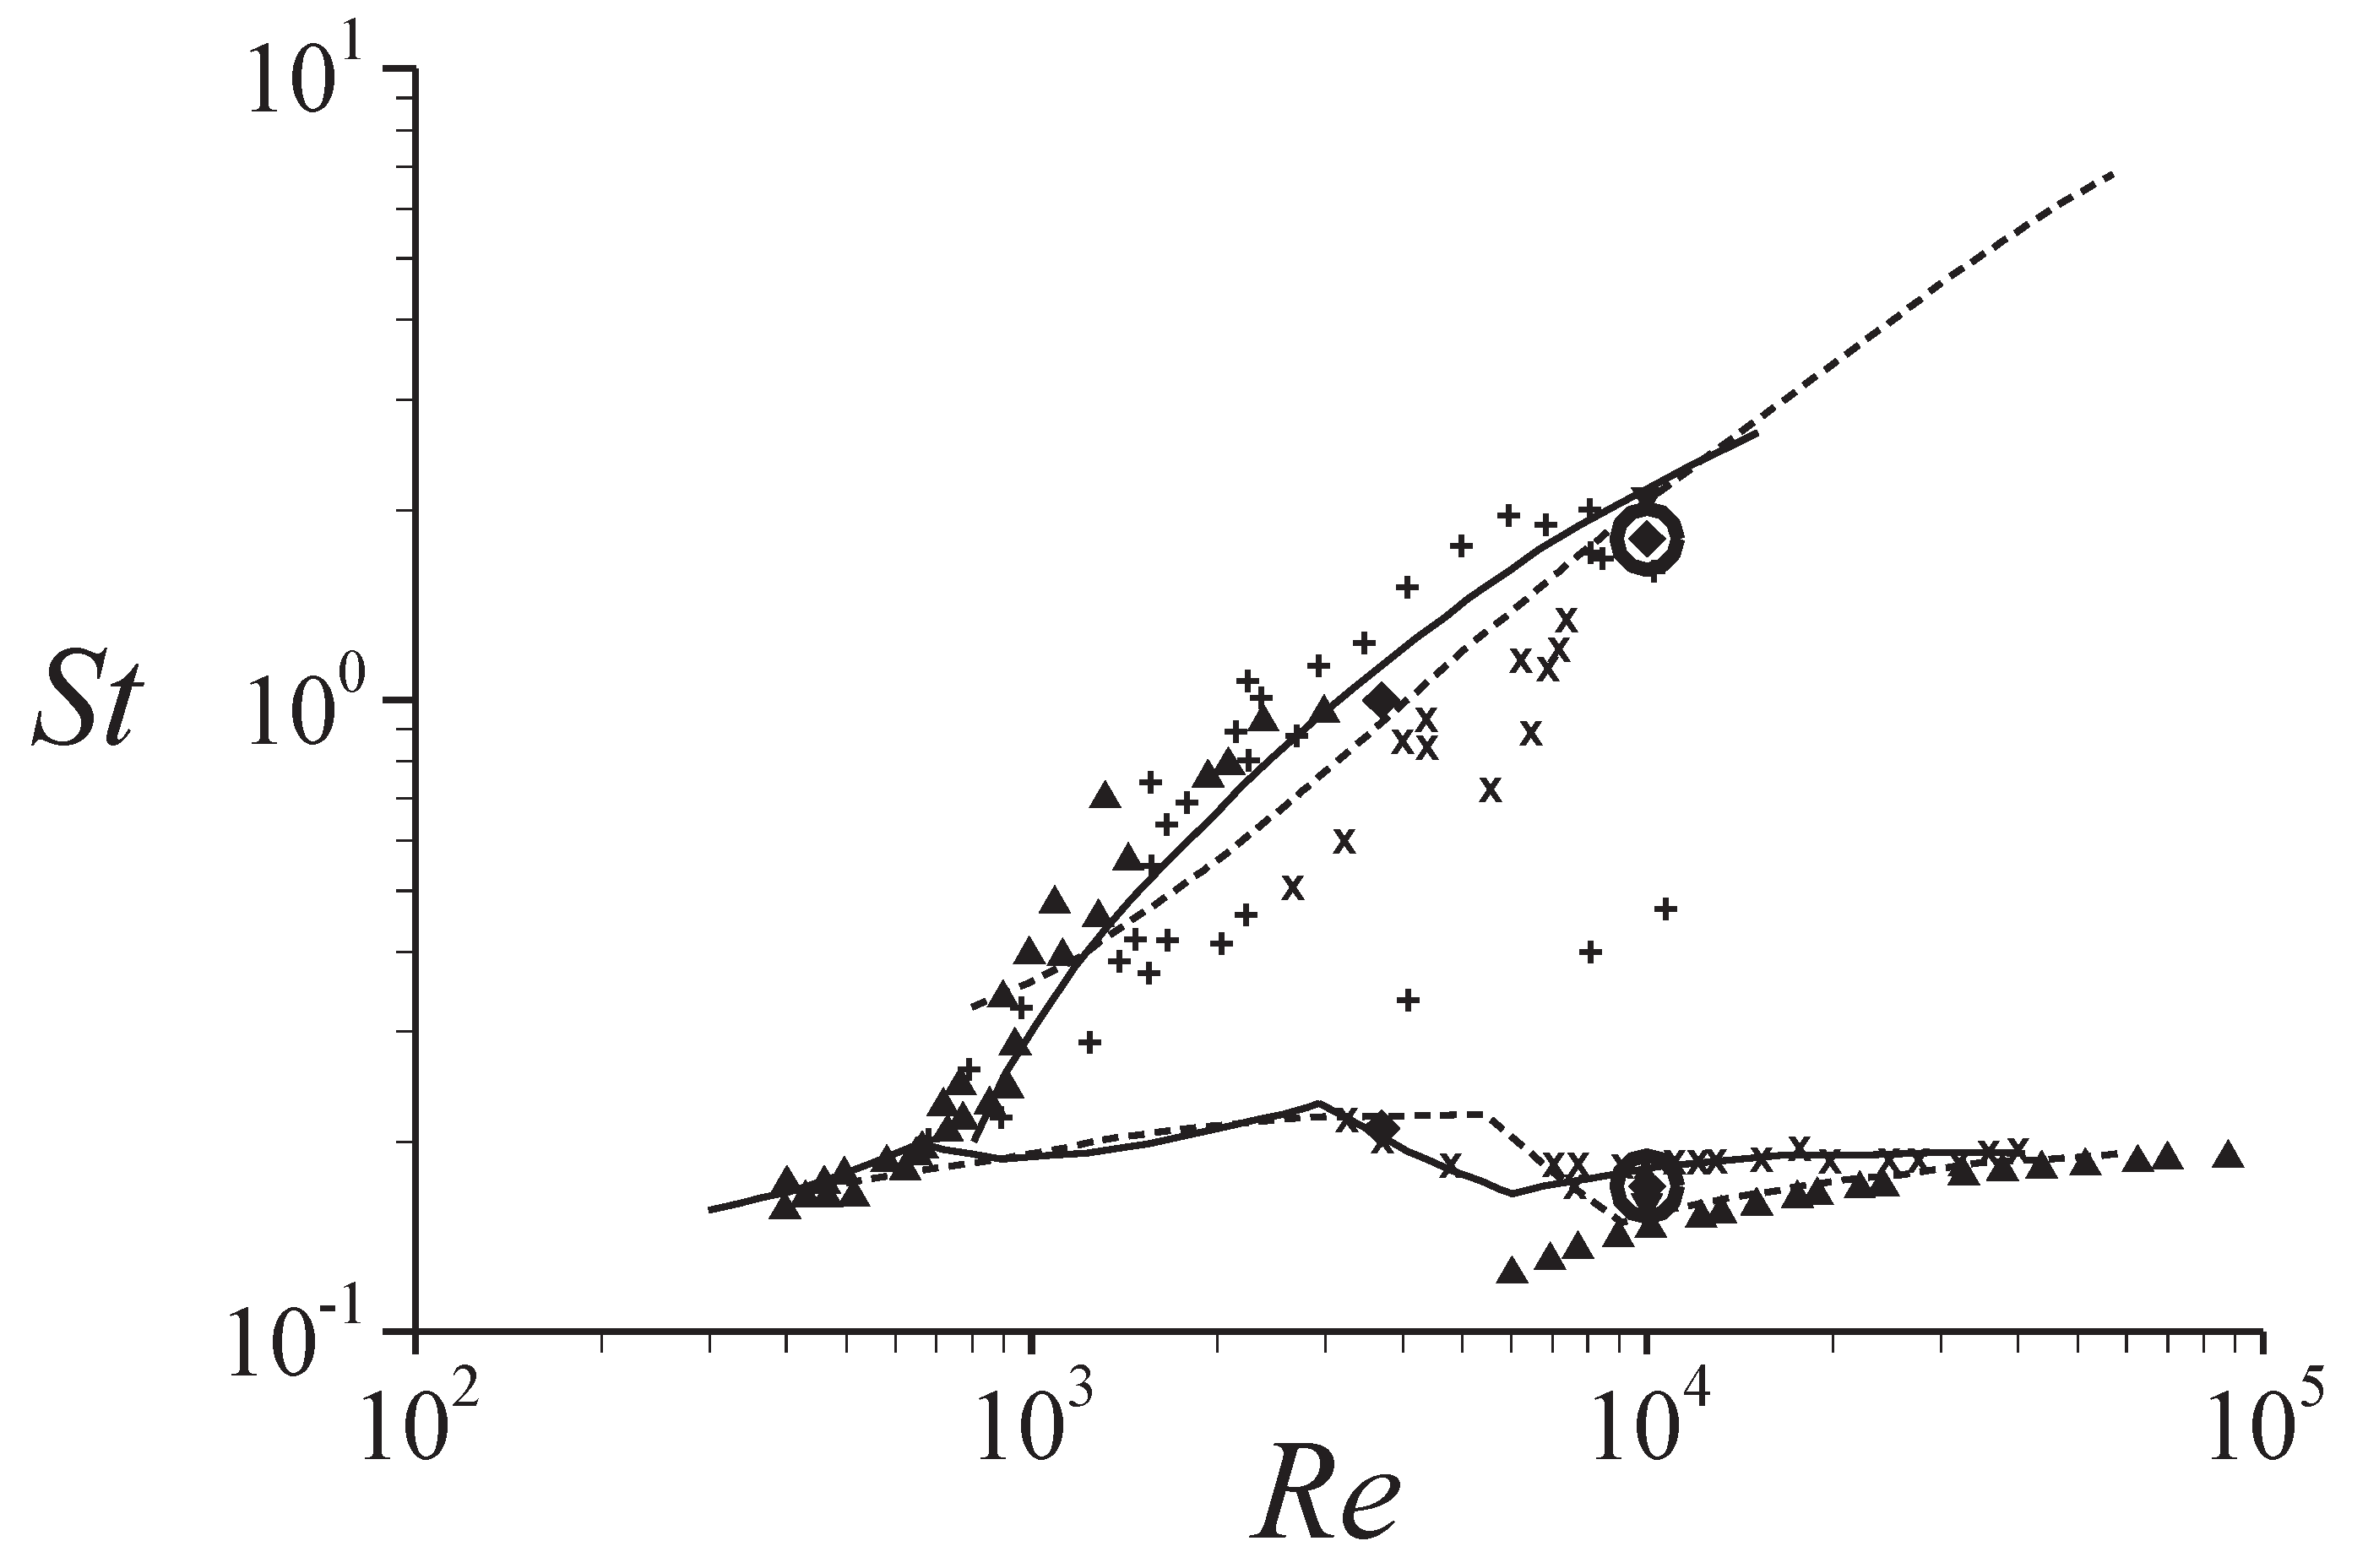
The frequencies corresponding to the shear layer and wake instabilities are obtained from the time traces of radial velocities near the shear layer ( x / d = 1 , r / d = 0.6 ) and in the wake ( x / d = 5 , r / d = 0.3 ), respectively [27]. Figure 4 shows the variations of Strouhal number corresponding to these shear layer and wake instabilities with the Reynolds number from the present simulation and previous experimental and numerical studies. In this figure, with increasing the Reynolds number, the high frequency associated with the shear layer instability increases, while the low frequency associated with the wake instability exhibits mild variations [35]. It is evident that these frequencies at R e = 10 4 are successfully predicted by the present simulation, indicating the accuracy of the present numerical approach.

3.2. Effect of Forcing Frequency f

In this section, we investigate the effect of the forcing frequency (f) on the control performance. We vary the forcing frequency from f * = 0.125 to f * = 5.0 , covering both the wake and shear layer frequencies, while the forcing amplitude is fixed to be V 0 / u = 0.2 . Here, f * is the non-dimensional forcing frequency defined to be f * = f d / u .
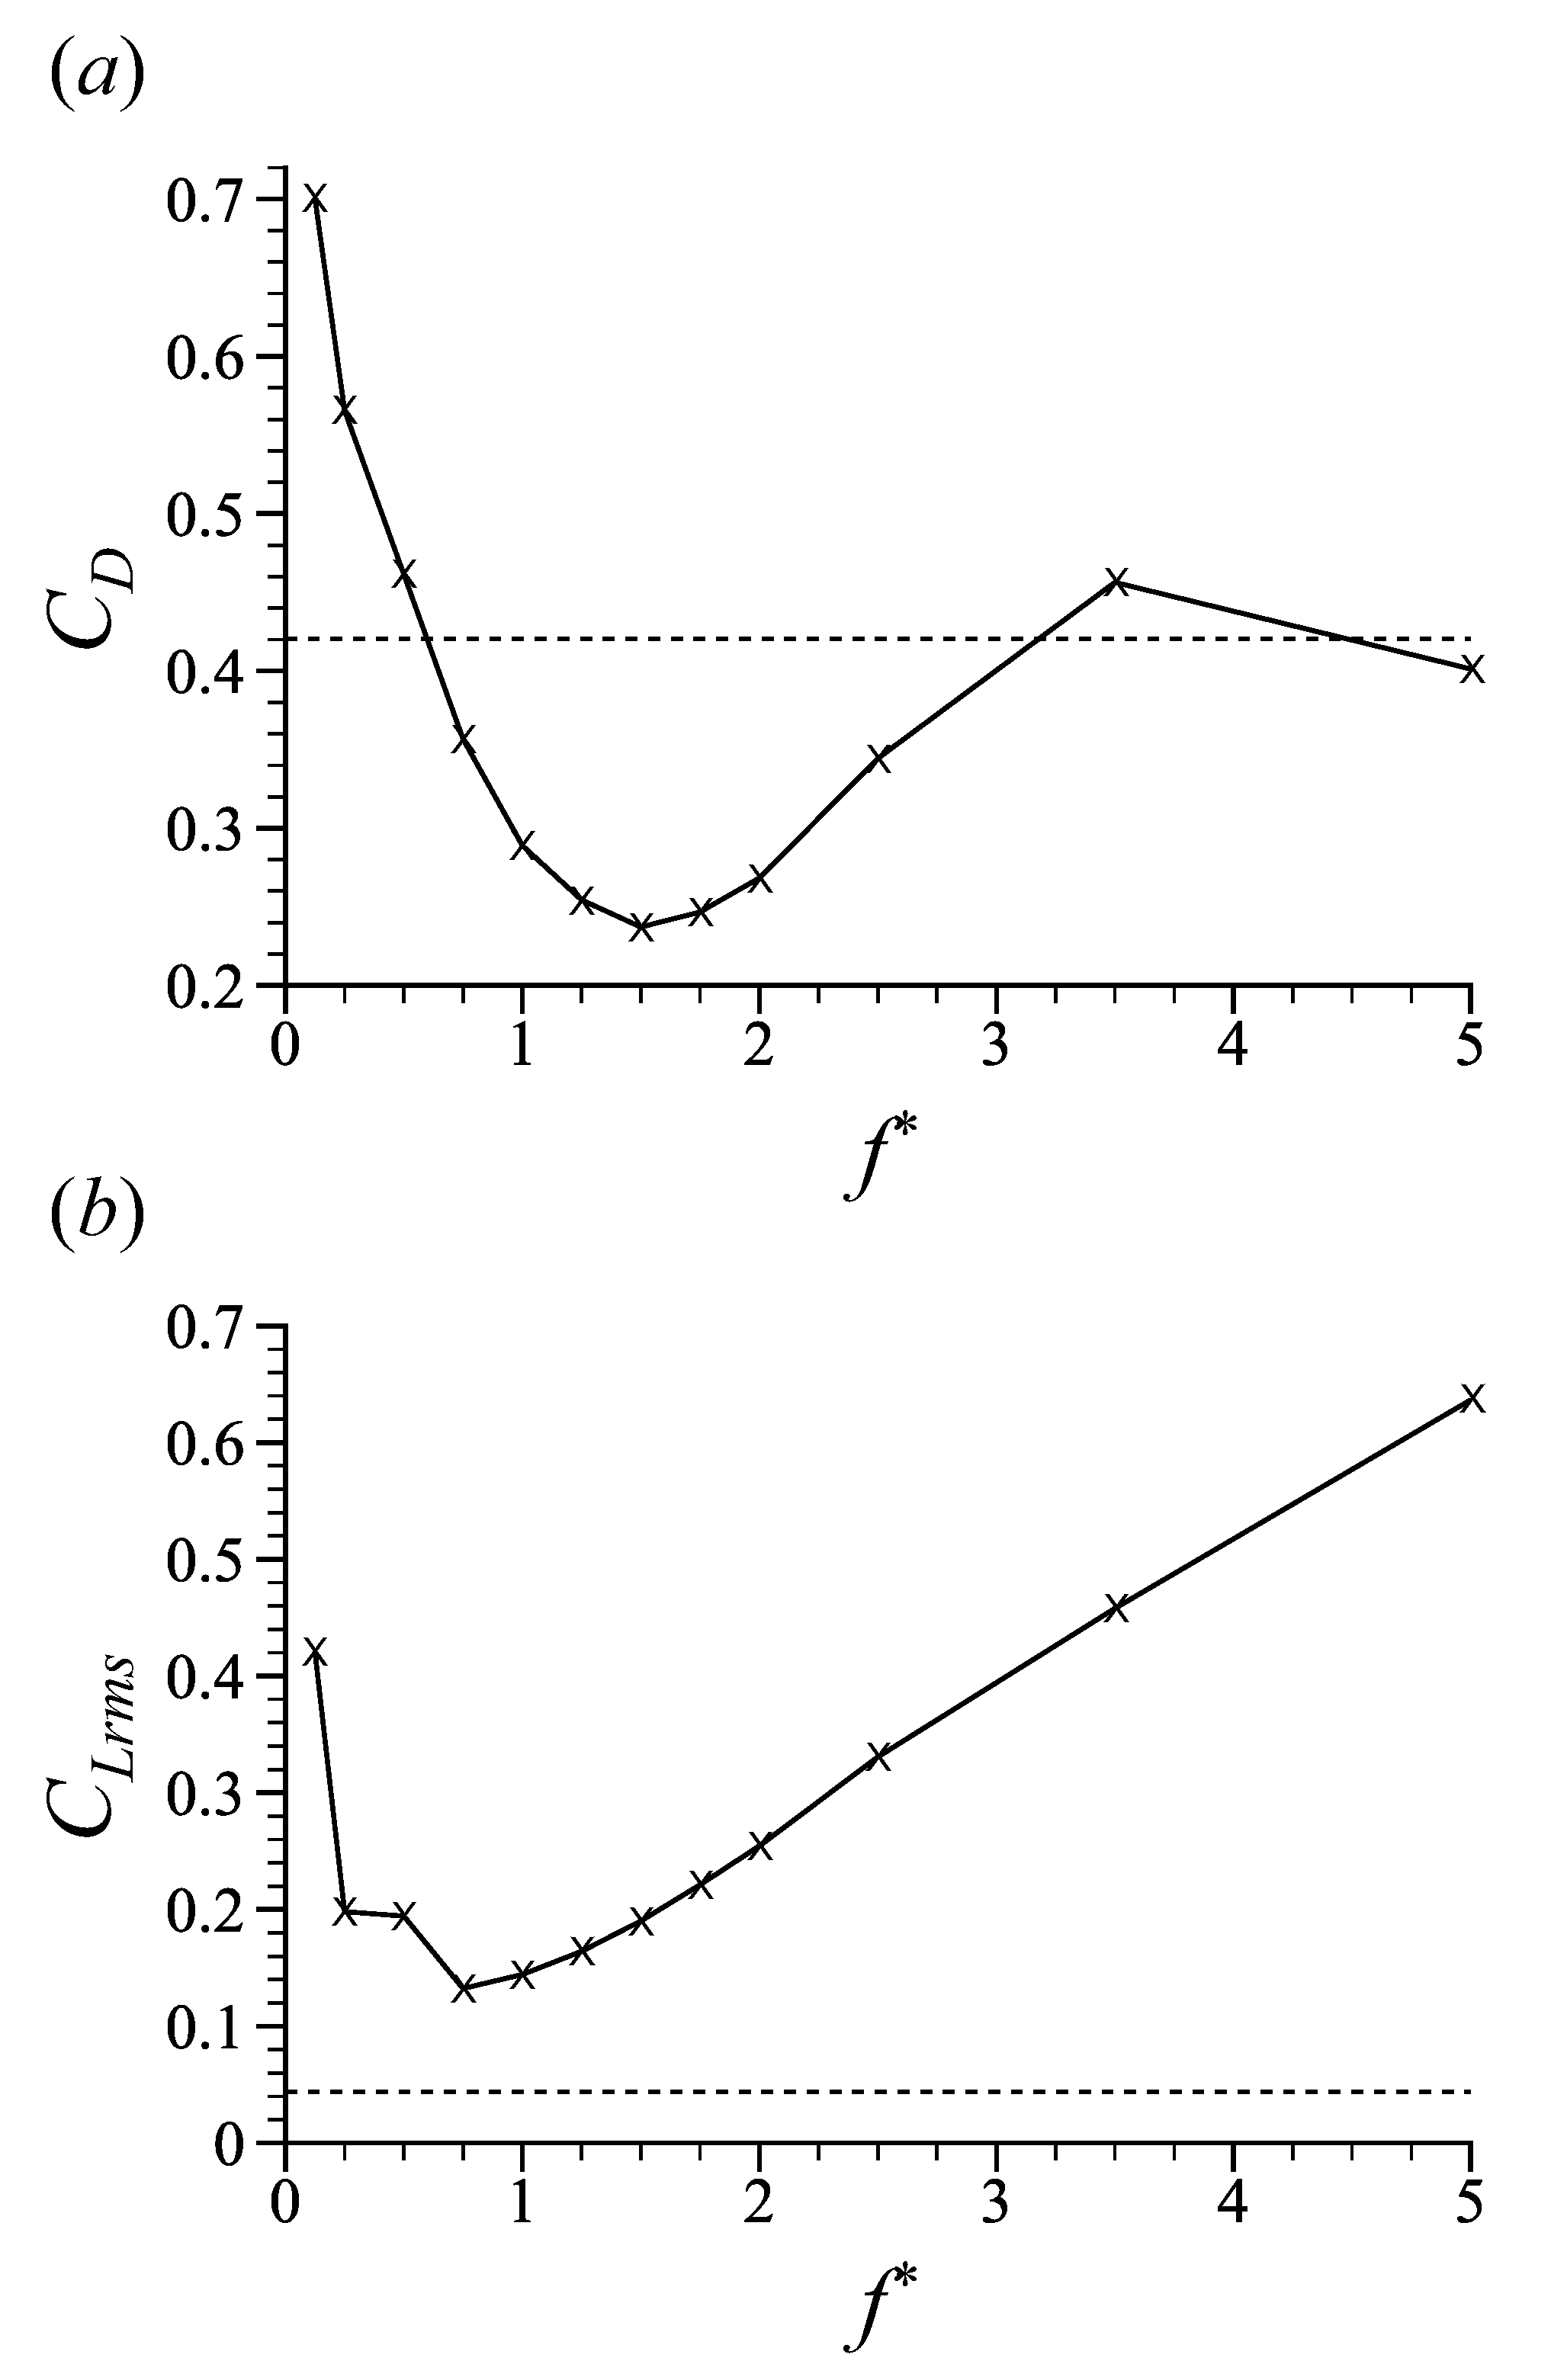
Figure 5 shows variations of the mean drag and lift fluctuations according to the forcing frequency f * . In the cases of low forcing frequencies ( 0.125 f * 0.5 ), the mean drag and lift fluctuations increase by the control. Additionally, with controls using forcing frequencies close to the vortex shedding frequency in the wake (see Figure 4) such as f * = 0.25 , it is observed that the shedding frequency measured from the time trace in the wake region ( x / d = 5 , r / d = 0.3 ) is fixed to be the forcing frequency f, indicating that the flow perturbed by the control experiences a lock-on phenomenon, where the behavior of vortex shedding is locked on to the forcing frequency of a control that differs from the shedding frequency of the uncontrolled flow [43,44,45]. On the other hand, for moderate forcing frequencies ( 0.75 f * 2.5 ), the drag exerted on the sphere is reduced by the control with the maximum amount of drag reduction by about 44 % ( C D = 0.237 ) at f * = 1.5 . This suggests that, unlike the steady distributed forcing [6], the present unsteady distributed forcing with appropriate forcing frequencies can successfully reduce the drag of an axisymmetric bluff body. For high forcing frequencies, ( 3.5 f * 5.0 ), the mean drag approaches to the value of the uncontrolled flow ( C D = 0.420 ), and becomes saturated. We note that, as shown in Figure 5b, the lift fluctuations increase for all forcing frequencies considered in this study, indicating that the periodically rotating distributed forcing is not an effective way of reducing lift fluctuations, contrary to the drag reduction by it with moderate forcing frequencies ( 0.75 f * 2.5 ).
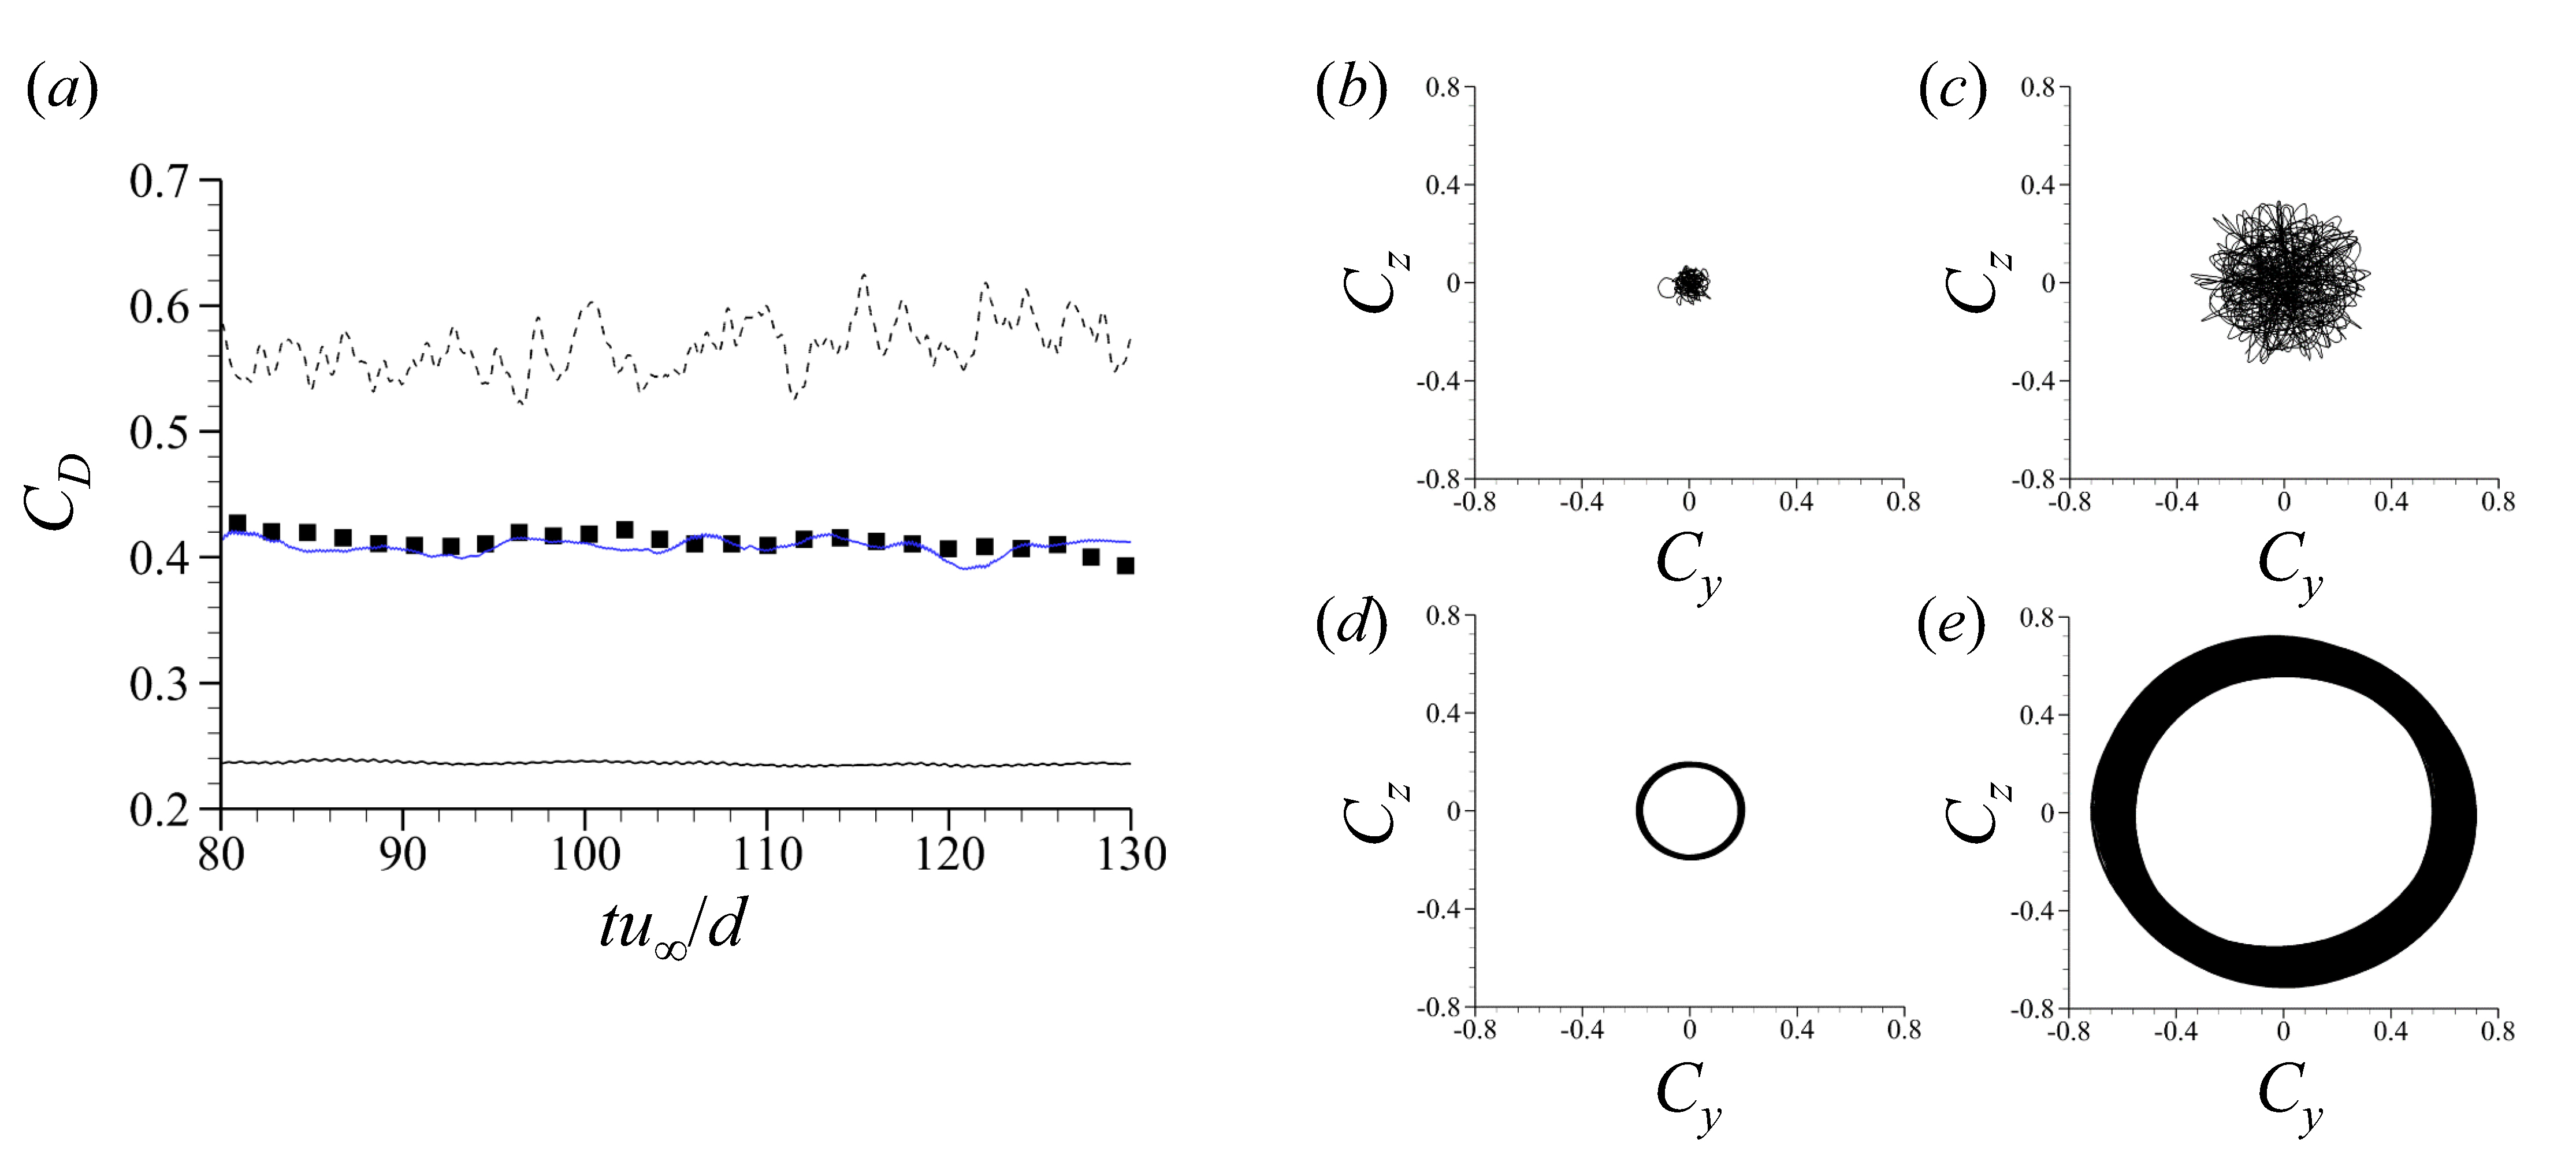
Based on the discussion in the preceding paragraph, the control results from the present periodically rotating distributed forcing can be divided into three categories: low-frequency ineffective ( 0.125 f * 0.5 ), effective drag reduction ( 0.75 f * 2.5 ), and high-frequency saturation ( 3.5 f * 5.0 ) regimes. To illustrate the temporal evolutions of forces for these regimes, the time traces of the drag and lift coefficients for cases with typical forcing frequencies of f * = 0.25 , 1.5 , and 5.0 are shown in Figure 6. In Figure 6a, it is clear that the drag owing to the control with f * = 1.5 is reduced by about 44 % compared to that of the uncontrolled flow. On the other hand, the control with f * = 0.25 increases the drag, while the control with f * = 5.0 produces a similar value of drag to that without control. As expected from Figure 5, the amplitudes of lift fluctuations increase at f * = 0.25 , 1.5 and 5.0 (Figure 6c–e) compared with the case of the uncontrolled flow (Figure 6b). We note that, as shown in the figure, ( C y , C z ) ’s move around ( 0 , 0 ) for all control cases, indicating that the present control does not produce an undesirable non-zero mean lift force. From Figure 6b–e, instantaneous lift coefficients on the yz plane show two different types of temporal behavior. In the cases of the uncontrolled flow and low-frequency ineffective regime (Figure 6b,c), the lift coefficients on the y-z plane move irregularly around the center of (0, 0) over time. On the other hand, in the cases of effective drag reduction and high-frequency saturation regimes (Figure 6d,e), lift forces move in the counterclockwise direction (when viewed from the downstream), which is the same direction as the rotating direction of forcing in Equation (1).
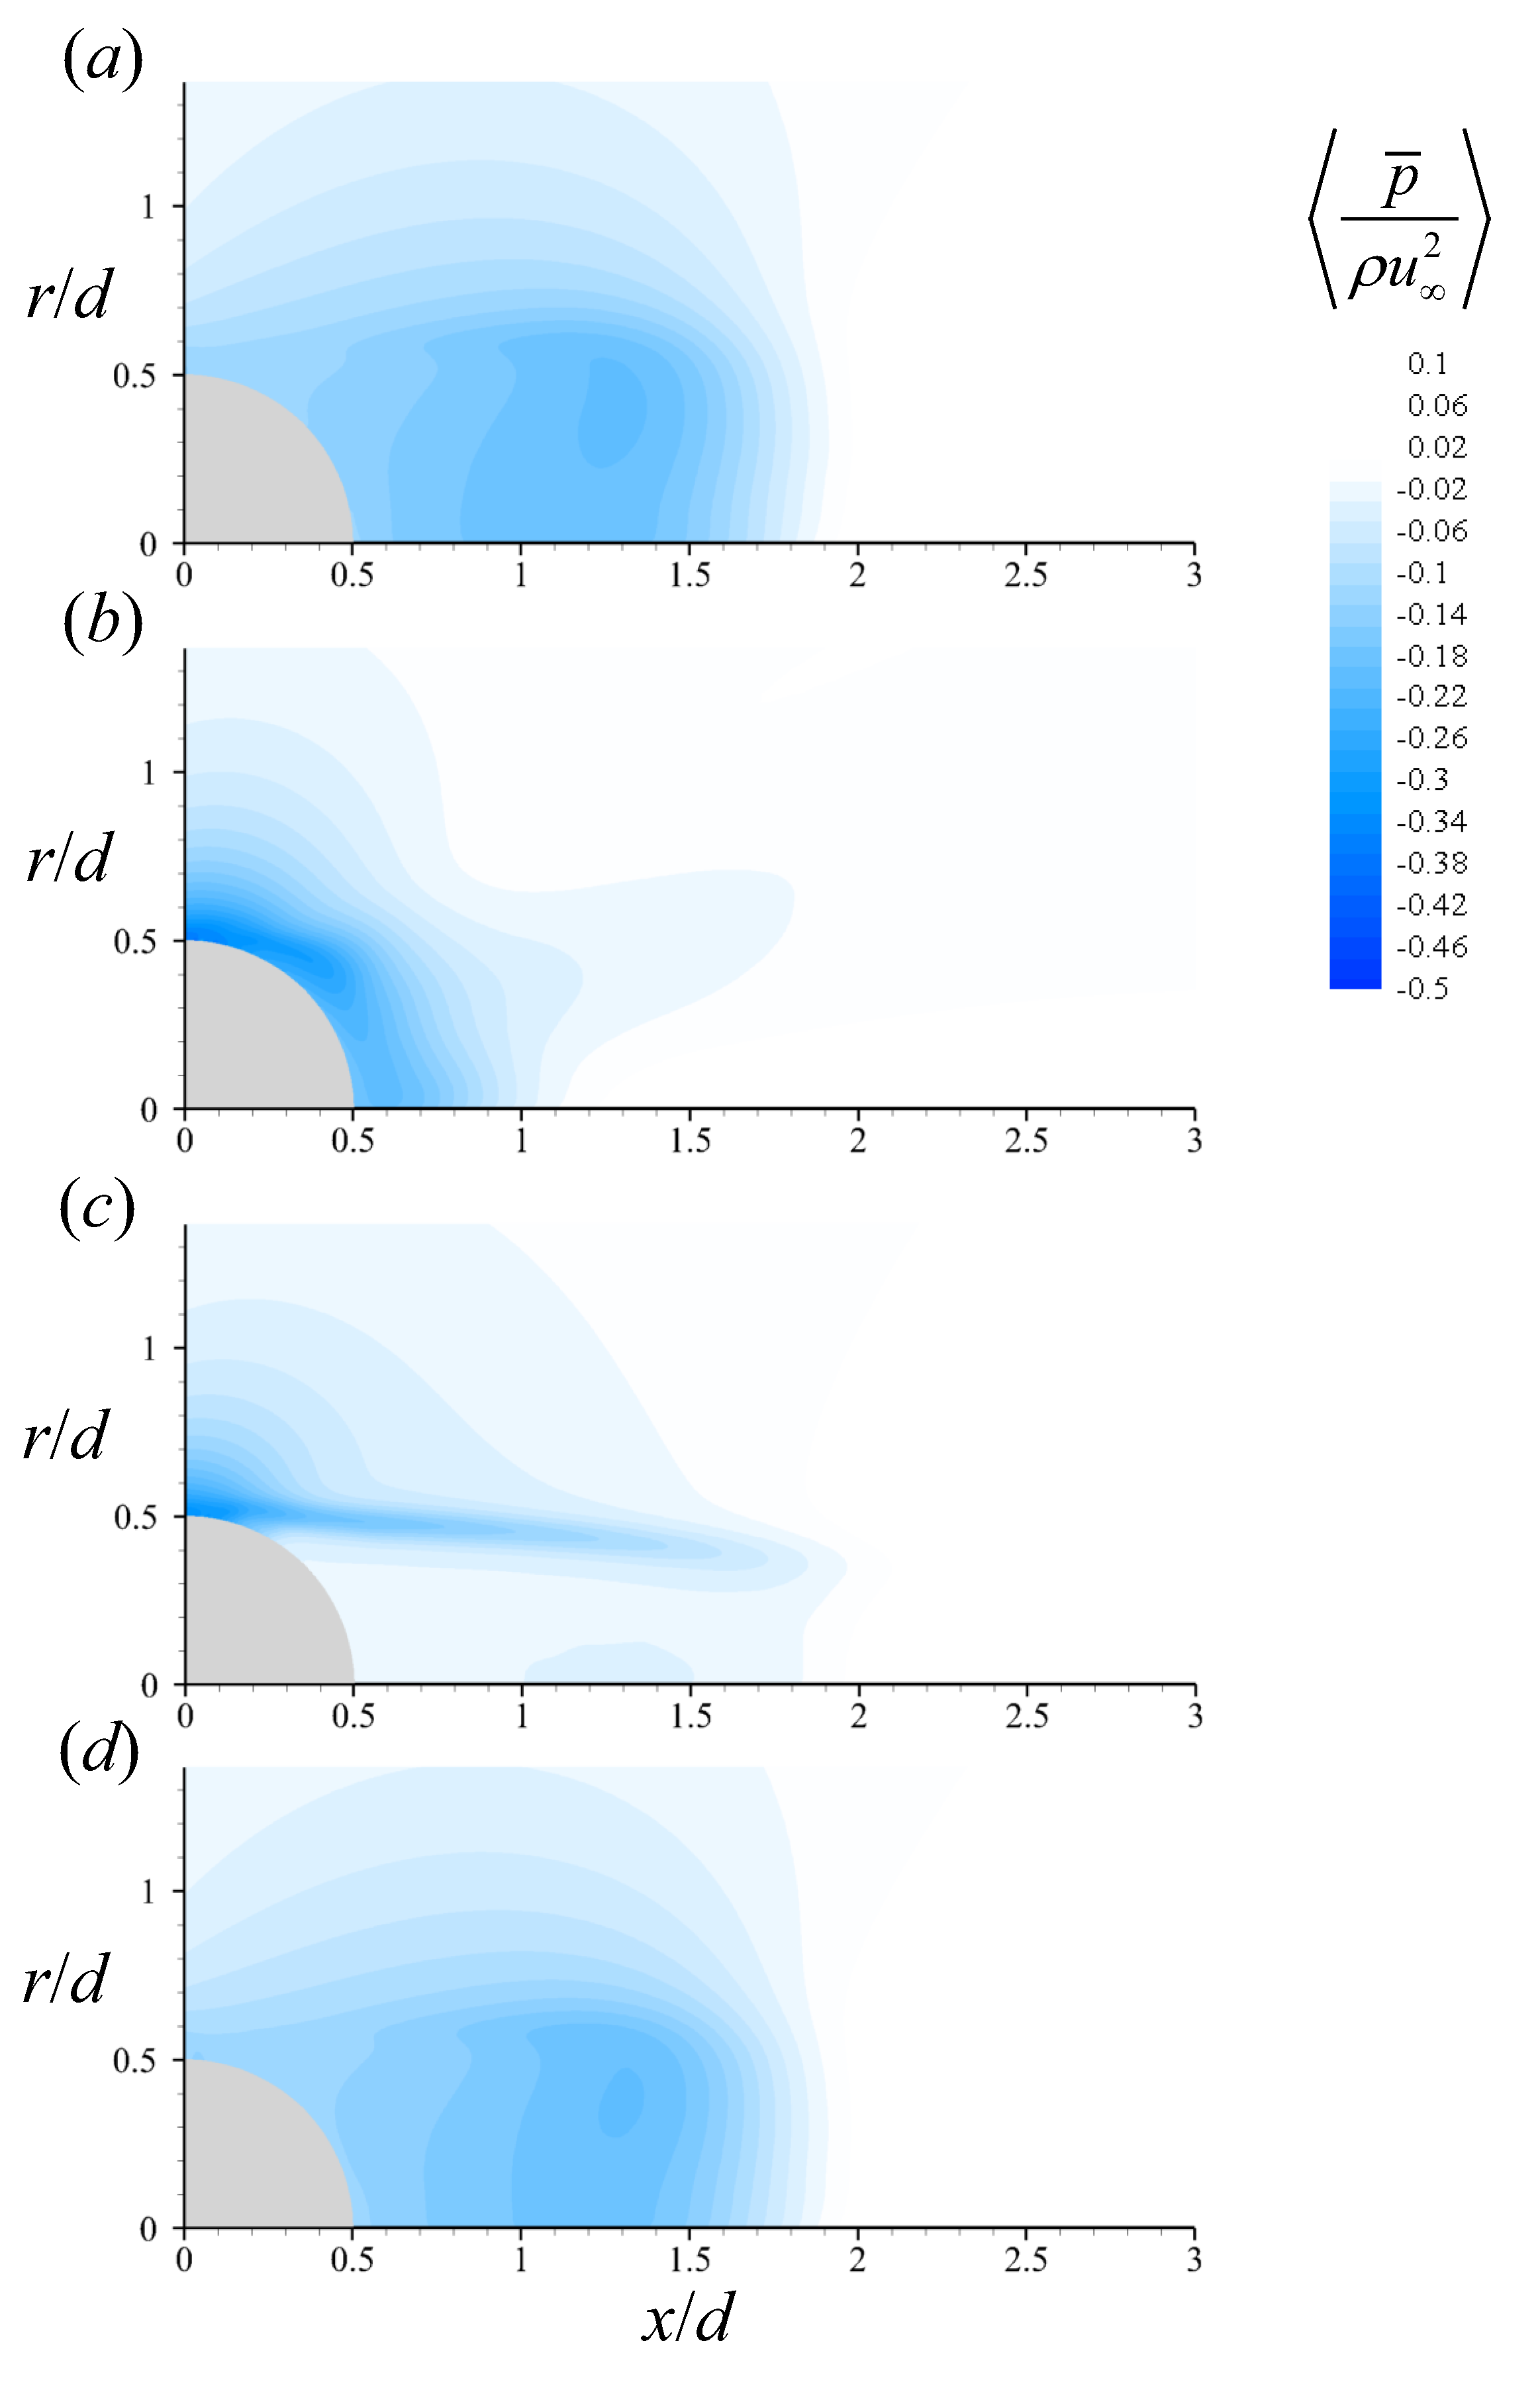
Figure 7 shows contours of the averaged pressure in the near wake of the sphere with the typical forcing frequencies of f * = 0.25 , 1.5 and 5.0, together with that of the uncontrolled flow. As shown in Figure 7a, it is observed that a low-pressure region for the uncontrolled flow locates near the centerline behind the sphere ( x / d 1.3 , r / d 0.4 ). With the control at f * = 0.25 in the low-frequency ineffective regime (Figure 7b), the low-pressure region moves to the sphere surface, which incurs the pressure decrease on the rear surface of the sphere resulting in the increase of the drag. In the effective drag reduction regime ( f * = 1.5 , Figure 7c), the low-pressure region is located on the shear layer of the sphere in an elongated shape owing to the forcing and pressures on the rear surface and the base of the sphere are recovered, which is favorable for the drag reduction. The pressure at the sphere base ( ( x , r ) = ( 0.5 d , 0 d ) ) with f * = 1.5 is C P b = 0.0766 , which is significantly higher than that of the uncontrolled flow (see Table 1). With the control at f * = 5.0 in the high-frequency saturation regime (Figure 7d), the pressure contour is similar to that of the uncontrolled flow (Figure 7a), which could explain the similar drag values to that without the control in this regime.
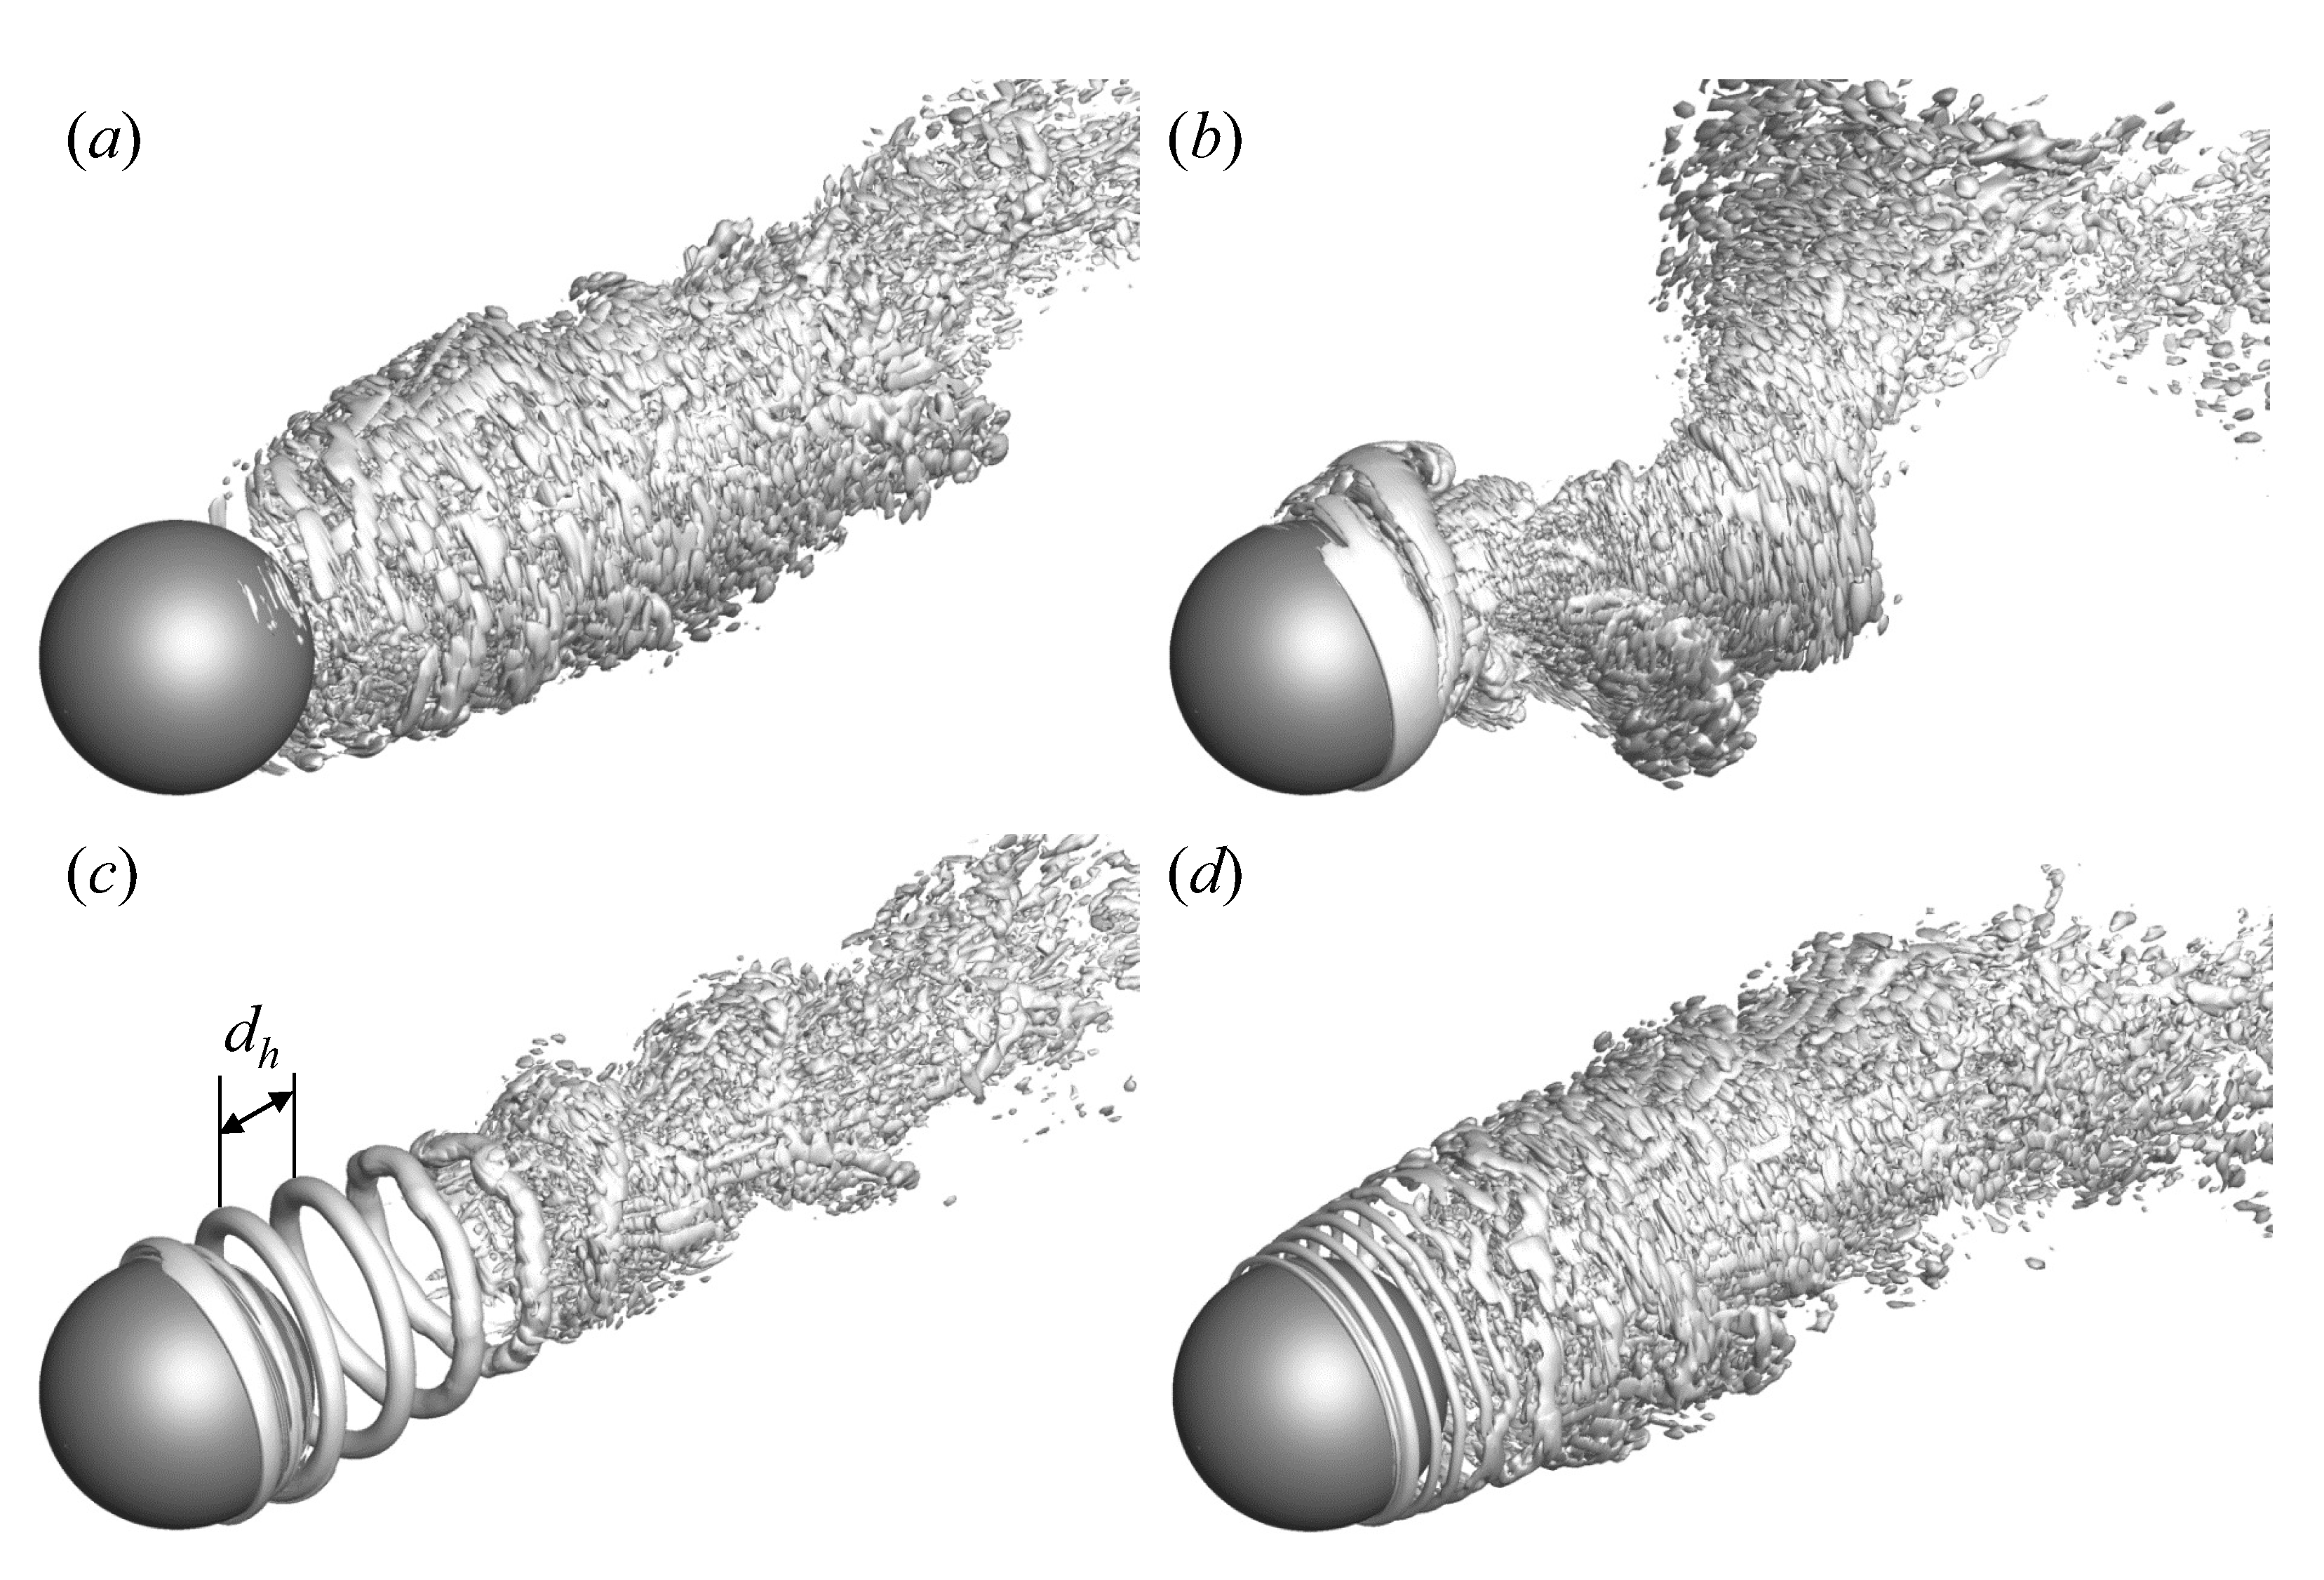
Figure 8 shows instantaneous three-dimensional vortical structures in the turbulent wake of the sphere identified using the λ 2 method [46] with the typical forcing frequencies of f * = 0.25 , 1.5 and 5.0. Compared to the vortical structures of the uncontrolled flow in Figure 8a, the vortex shedding in the wake with the control at f * = 0.25 is strengthened owing to the lock-on phenomena [43], and the vortical structures behind the sphere exhibit a distinct waviness along the streamwise direction (Figure 8b). In the case of f * = 1.5 (Figure 8c), it is observed that a helically rotating vortex forms and dissipates in the shear layer of the sphere, which is generated from the blowing actuation of distributed forcing on the sphere surface. The streamwise distance d h for this helical vortex shown in Figure 8c is measured to be about d h = 0.3 d 0.4 d . It is noteworthy that this distance for the helical vortex is similar to the value measured for the vortex rings from the periodic forcing by Oxlade et al. [18]. In the vortical structures with the control at f * = 5.0 shown in Figure 8d, the helical vortex is created from the forcing slot, but it is so thin that it quickly disappears as it travels downstream. This behavior suggests that the high-frequency forcing is not so effective in changing the vortical structures in the wake.
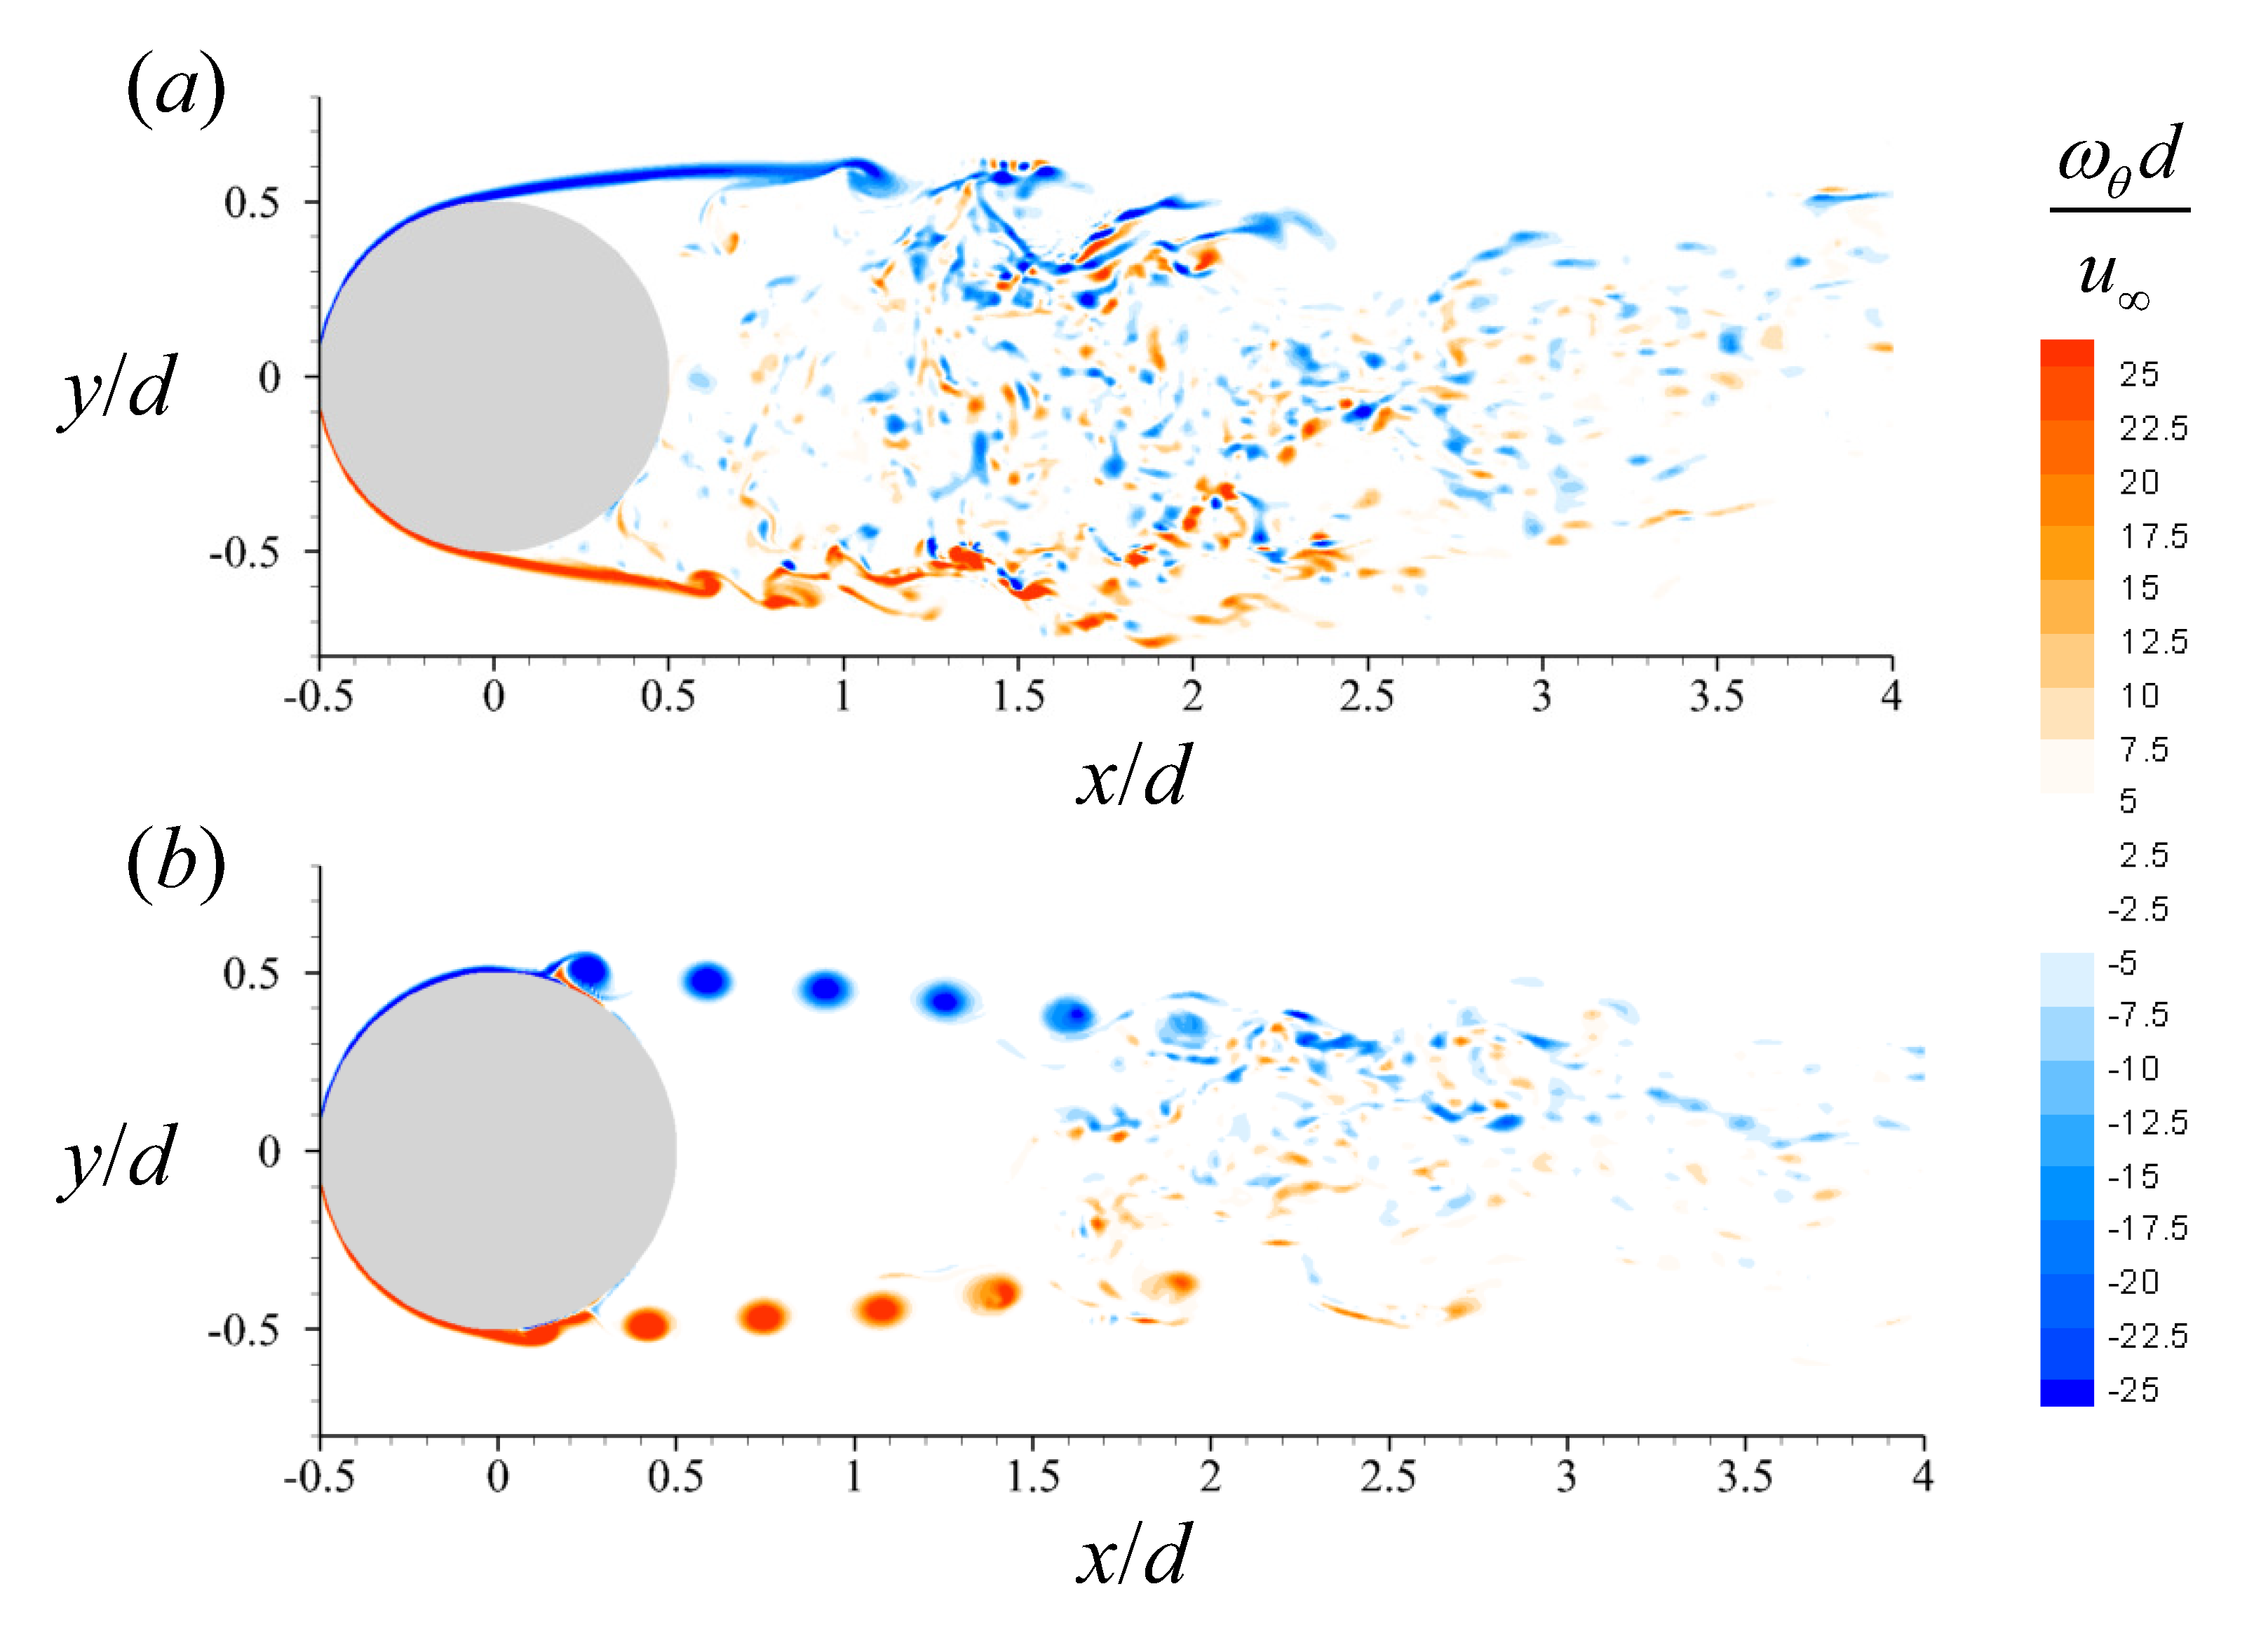
Figure 9 illustrates contours of instantaneous azimuthal vorticity ( ω θ ) on a x-y plane for uncontrolled and controlled flows. For the uncontrolled flow shown in Figure 9a, the growth of the laminar boundary layer, flow separation, evolution and roll-up of the shear layer, vortex shedding in the wake, as well as vivid small-scale vortices are visible. Consistent with the three-dimensional vortical structures in Figure 8c, the staggered formations of vortices in the upper and lower shear layers of the sphere by the control (Figure 9b) indicate the evolution of the helical vortex in the shear layer, and these vortices disappear as they travel downstream. After the helical vortex starts to disappear around x / d = 1.5 , the turbulent wake exhibits small-scale vortices.
To understand the detailed process for the generation of helical vortex, Figure 10 displays instantaneous velocity vectors on the x-r plane ( θ = 0 ) in the near wake at different temporal instances for the case of f * = 1.5 and V 0 / u = 0.2 in the effective drag reduction regime. At t = 0 in Figure 10a, flow separation occurs upstream of the helical vortex. At t = T / 4 in Figure 10b, it is observed that the helical vortex at t = 0 moves downstream in the shear layer, and in addition, a small helical vortex generated from the blowing forcing is also visible on the surface of the sphere. Here, T denotes the temporal period defined to be T = 1 / f . At this time instance, it is evident that a flow reattachment occurs on the sphere surface between these two helical vortices. A similar behavior was also observed in the time-periodic forcing by Jeon et al. [15]. At t = 2 T / 4 and t = 3 T / 4 in Figure 10c,d, respectively, these two helical vortices travel downstream, and hence, the instantaneous locations of flow separation and reattachment are also further delayed on the sphere surface. Compared to the separation point ϕ s = 88 of the uncontrolled flow (see Table 1), it is certain that the separation point is much delayed at all instances, which reduces the drag on the sphere. The mean separation and reattachment points are ϕ = 102 and ϕ = 129 , respectively. We note that the separation delay for flow over a bluff body is generally favorable to the base pressure recovery and drag reduction [4].

3.3. Effect of Forcing Amplitude V 0

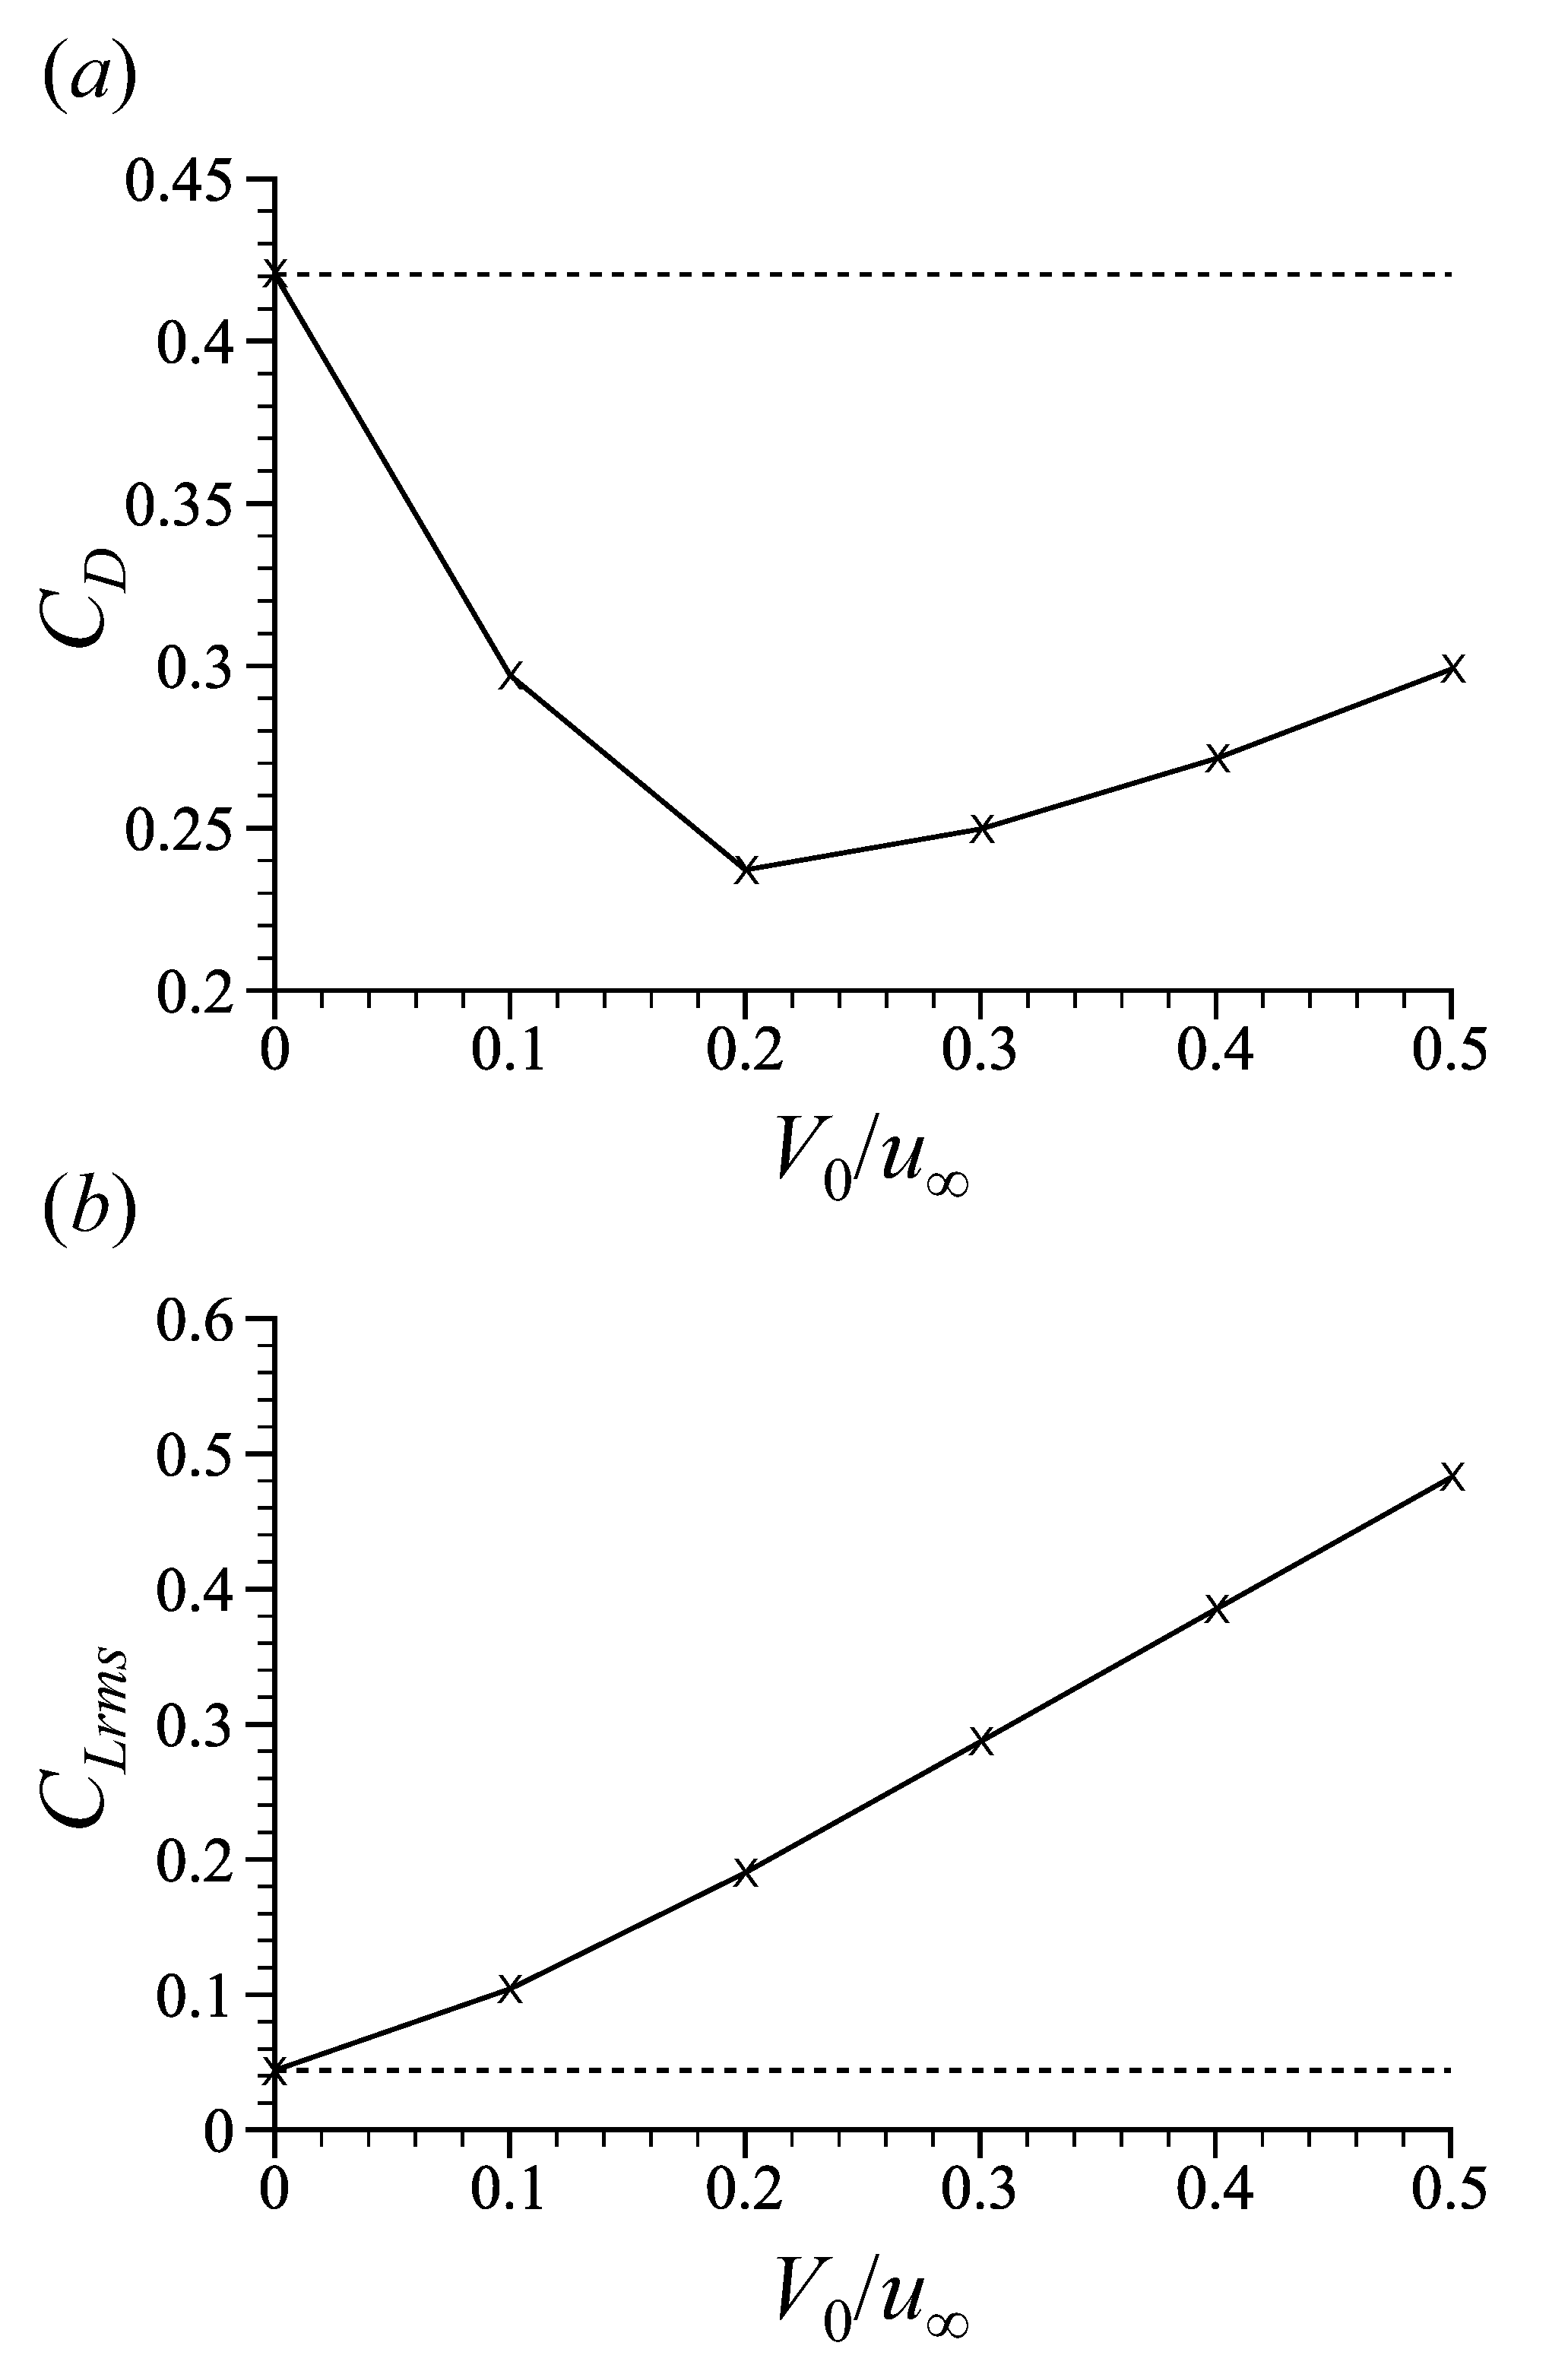
In the previous section, we examined the control performance according to the forcing frequency f and found that the control performance varied according to the value of the forcing frequency. In this section, we examine the control performance according to the forcing amplitude V 0 . With the fixed forcing frequency at f * = 1.5 in the effective drag reduction regime, we assess the control performance by changing the forcing amplitude V 0 / u from 0.1 to 0.5.
Figure 11 shows variations of the mean drag and lift fluctuations according to the forcing amplitude V 0 / u . For all forcing amplitudes considered in the figure ( 0.1 V 0 / u 0.5 ), the drag is successfully reduced with the maximum drag reduction at V 0 / u = 0.2 . On the other hand, the rms of lift coefficient fluctuations linearly increases with the forcing amplitude, as shown in Figure 11b.

4. Conclusions

In the present study, we proposed the periodically rotating distributed forcing for turbulent flow over a sphere for its drag reduction. The blowing/suction forcing was applied on a finite slot of the sphere surface near the flow separation, and unsteady sinusoidal forcing velocities were azimuthally ( θ ) distributed on the sphere surface. This forcing profile periodically rotated in the azimuthal direction over time with the forcing frequency f, satisfying the instantaneous zero net mass flux. The Reynolds number considered was R e = 10 4 and large eddy simulations were conducted to assess the control performance. It was shown that the drag reduction performance varied with the forcing frequency, and the control results were classified into low-frequency ineffective, effective drag reduction, and high-frequency saturation regimes. With forcing frequencies in the effective drag reduction regime, the helical vortex was generated from the forcing on the sphere and evolved in the shear layer, and this vortex was responsible for the separation delay and flow reattachment resulting in the base pressure recovery and drag reduction. The maximum drag reduction was about 44% with the forcing frequency in the effective drag reduction regime, while controls in other regimes did not produce an effective drag reduction.
While the previous steady distributed forcings [5,6,19] were not so effective for the drag reduction of an axisymmetric body, the unsteady distributed forcing in this study successfully reduced the drag experienced by the sphere. This suggests that the present periodically rotating distributed forcing can effectively control flow around an axisymmetric bluff body. Additionally, this technique has the advantage of satisfying instantaneous zero net mass flux, unlike other time-periodic forcing techniques [15,18]. Therefore, applying the present control strategy to other axisymmetric flows with nominally three-dimensional vortex shedding would be an interesting topic to pursue.
Despite the drag reduction owing to the periodically rotating distributed forcing, it was observed that the lift fluctuations of the sphere increased by the control with the forcing frequencies considered in this study. We suspect that this increase of lift fluctuations is due to the asymmetry of the distributed forcing in the azimuthal direction. That is, the blowing and suction in the present forcing profile in Equation (1) have opposite phases (out of phase), and this may cause an asymmetry for flow structures in the wake. To address this issue, it is worth considering a forcing profile that produces symmetric blowing and suction actuations. For example, using a forcing profile such as ψ ( t , θ ) = V 0 cos ( 2 θ 4 π f t ) instead of Equation (1) would satisfy this condition. Currently, we are investigating periodically rotating distributed forcings adopting such a forcing profile, and the results will be reported in a future study.

Author Contributions

Conceptualization, methodology, investigation: D.S. and J.L.; validation, formal analysis, writing—original draft preparation, visualization: D.S. and J.L.; writing—review and editing, supervision, project administration, funding acquisition: D.S. and J.L. All authors have read and agreed to the published version of the manuscript.

Funding

This research was supported by Basic Science Research Program through the National Research Foundation of Korea (NRF) funded by the Ministry of Education (2019R1F1A1060841), and NRF funded by the Ministry of Science, ICT, and Future Planning of Korean government (No. RS-2022-00144357). Additionally, this work was supported by the National Supercomputing Center with supercomputing resources (KSC-2021-CRE-0361).

Data Availability Statement

The data presented in this study are available from the corresponding author upon reasonable request.

Conflicts of Interest

The authors declare no conflict of interest.

Nomenclature

xStreamwise direction
yTransverse direction
zSpanwise direction
rRadial direction
θ Azimuthal direction
ϕ Angle measured from the stagnation point
tTime
dSphere diameter
uFluid velocity
pPressure
u Free stream velocity
ν Kinematic viscosity
f i Momentum forcing
qMass source/sink
S i j Strain rate tensor
τ i j Subgrid-scale stress tensor
δ i j Kronecker delta
ν T Eddy viscosity
( ) ¯ Filtered quantity
R e Reynolds number
S t Strouhal number
C D Drag coefficient
C L Lift coefficient
C y Lift coefficient in the y direction
C z Lift coefficient in the z direction
r m s Root-mean-square value
C p b Base pressure coefficient
ϕ s Separation angle
V 0 Forcing amplitude
fForcing frequency
ψ Forcing velocity
d h Streamwise distance for helical vortex

References

  1. Gad-el Hak, M.; Pollard, A.; Bonnet, J.P. Flow Control: Fundamentals and Practices; Springer Science & Business Media: New York, NY, USA, 2003; Volume 53. [Google Scholar]
  2. Collis, S.S.; Joslin, R.D.; Seifert, A.; Theofilis, V. Issues in active flow control: Theory, control, simulation, and experiment. Prog. Aerosp. Sci. 2004, 40, 237–289. [Google Scholar] [CrossRef]
  3. Le, T.T.G.; Jang, K.S.; Lee, K.S.; Ryu, J. Numerical investigation of aerodynamic drag and pressure waves in hyperloop systems. Mathematics 2020, 8, 1973. [Google Scholar] [CrossRef]
  4. Choi, H.; Jeon, W.P.; Kim, J. Control of flow over a bluff body. Annu. Rev. Fluid Mech. 2008, 40, 113–139. [Google Scholar] [CrossRef] [Green Version]
  5. Kim, J.; Choi, H. Distributed forcing of flow over a circular cylinder. Phys. Fluids 2005, 17, 033103. [Google Scholar] [CrossRef]
  6. Jardin, T.; Bury, Y. Distributed forcing of the flow past a blunt-based axisymmetric bluff body. Theor. Comput. Fluid Dyn. 2014, 28, 259. [Google Scholar] [CrossRef] [Green Version]
  7. Feng, L.H.; Wang, J.J. Modification of a circular cylinder wake with synthetic jet: Vortex shedding modes and mechanism. Eur. J. Mech. B. Fluids 2014, 43, 14–32. [Google Scholar] [CrossRef]
  8. Naghib-Lahouti, A.; Hangan, H.; Lavoie, P. Distributed forcing flow control in the wake of a blunt trailing edge profiled body using plasma actuators. Phys. Fluids 2015, 27, 035110. [Google Scholar] [CrossRef]
  9. Wu, Z.; Choi, H. Modification of flow behind a circular cylinder by steady and time-periodic blowing. Phys. Fluids 2021, 33, 115126. [Google Scholar] [CrossRef]
  10. Lam, K.; Lin, Y. Effects of wavelength and amplitude of a wavy cylinder in cross-flow at low Reynolds numbers. J. Fluid Mech. 2009, 620, 195–220. [Google Scholar] [CrossRef] [Green Version]
  11. Kim, W.; Lee, J.; Choi, H. Flow around a helically twisted elliptic cylinder. Phys. Fluids 2016, 28, 053602. [Google Scholar] [CrossRef]
  12. Yoon, H.S.; Kim, M.I.; Kim, H.J. Reynolds number effects on the flow over a twisted cylinder. Phys. Fluids 2019, 31, 025119. [Google Scholar] [CrossRef]
  13. Yoon, J.; Kim, J.; Choi, H. Control of laminar vortex shedding behind a circular cylinder using tabs. J. Mech. Sci. Technol. 2014, 28, 1721–1725. [Google Scholar] [CrossRef]
  14. Kim, H.; Durbin, P. Observations of the frequencies in a sphere wake and of drag increase by acoustic excitation. Phys. Fluids 1988, 31, 3260–3265. [Google Scholar] [CrossRef]
  15. Jeon, S.; Choi, J.; Jeon, W.P.; Choi, H.; Park, J. Active control of flow over a sphere for drag reduction at a subcritical Reynolds number. J. Fluid Mech. 2004, 517, 113–129. [Google Scholar] [CrossRef] [Green Version]
  16. Choi, J.; Jeon, W.P.; Choi, H. Mechanism of drag reduction by dimples on a sphere. Phys. Fluids 2006, 18, 041702. [Google Scholar] [CrossRef] [Green Version]
  17. Findanis, N.; Ahmed, N. The interaction of an asymmetrical localised synthetic jet on a side-supported sphere. J. Fluids Struct. 2008, 24, 1006–1020. [Google Scholar] [CrossRef]
  18. Oxlade, A.R.; Morrison, J.F.; Qubain, A.; Rigas, G. High-frequency forcing of a turbulent axisymmetric wake. J. Fluid Mech. 2015, 770, 305–318. [Google Scholar] [CrossRef] [Green Version]
  19. Kim, J.; Hahn, S.; Kim, J.; Lee, D.k.; Choi, J.; Jeon, W.P.; Choi, H. Active control of turbulent flow over a model vehicle for drag reduction. J. Turbul. 2004, 5, 019. [Google Scholar] [CrossRef]
  20. Kim, J.; Kim, D.; Choi, H. An immersed-boundary finite-volume method for simulations of flow in complex geometries. J. Comput. Phys. 2001, 171, 132–150. [Google Scholar] [CrossRef]
  21. Son, D.; Jeon, S.; Choi, H. A proportional–integral–differential control of flow over a circular cylinder. Phil. Trans. R. Soc. A 2011, 369, 1540–1555. [Google Scholar] [CrossRef]
  22. Lee, J.; Son, D. Proportional feedback control of laminar flow over a hemisphere. J. Mech. Sci. Technol. 2016, 30, 3667–3672. [Google Scholar] [CrossRef]
  23. Son, D.; Choi, H. Iterative feedback tuning of the proportional-integral-differential control of flow over a circular cylinder. IEEE Trans. Control Syst. Technol. 2018, 27, 1385–1396. [Google Scholar] [CrossRef]
  24. Yun, J.; Lee, J. Active proportional feedback control of turbulent flow over a circular cylinder with averaged velocity sensor. Phys. Fluids 2022, 34, 095133. [Google Scholar] [CrossRef]
  25. Kim, J.; Moin, P. Application of a fractional-step method to incompressible Navier-Stokes equations. J. Comput. Phys. 1985, 59, 308–323. [Google Scholar] [CrossRef]
  26. Akselvoll, K.; Moin, P. An efficient method for temporal integration of the Navier–Stokes equations in confined axisymmetric geometries. J. Comput. Phys. 1996, 125, 454–463. [Google Scholar] [CrossRef]
  27. Yun, G.; Kim, D.; Choi, H. Vortical structures behind a sphere at subcritical Reynolds numbers. Phys. Fluids 2006, 18, 015102. [Google Scholar] [CrossRef]
  28. Mittal, R.; Iaccarino, G. Immersed boundary methods. Annu. Rev. Fluid Mech. 2005, 37, 239–261. [Google Scholar] [CrossRef] [Green Version]
  29. Park, N.; Lee, S.; Lee, J.; Choi, H. A dynamic subgrid-scale eddy viscosity model with a global model coefficient. Phys. Fluids 2006, 18, 125109. [Google Scholar] [CrossRef]
  30. Park, K.; Choi, H.; Choi, S.; Sa, Y. Effect of a casing fence on the tip-leakage flow of an axial flow fan. Int. J. Heat Fluid Flow 2019, 77, 157–170. [Google Scholar] [CrossRef]
  31. Song, D.; Kim, W.; Kwon, O.K.; Choi, H. Vertical and torsional vibrations before the collapse of the Tacoma Narrows Bridge in 1940. J. Fluid Mech. 2022, 949, A11. [Google Scholar] [CrossRef]
  32. Lee, J.; Choi, H.; Park, N. Dynamic global model for large eddy simulation of transient flow. Phys. Fluids 2010, 22, 075106. [Google Scholar] [CrossRef]
  33. Vreman, A. An eddy-viscosity subgrid-scale model for turbulent shear flow: Algebraic theory and applications. Phys. Fluids 2004, 16, 3670–3681. [Google Scholar] [CrossRef]
  34. You, D.; Moin, P. A dynamic global-coefficient subgrid-scale eddy-viscosity model for large-eddy simulation in complex geometries. Phys. Fluids 2007, 19, 065110. [Google Scholar] [CrossRef] [Green Version]
  35. Prasad, A.; Williamson, C.H. The instability of the shear layer separating from a bluff body. J. Fluid Mech. 1997, 333, 375–402. [Google Scholar] [CrossRef]
  36. Constantinescu, G.; Squires, K. Numerical investigations of flow over a sphere in the subcritical and supercritical regimes. Phys. Fluids 2004, 16, 1449–1466. [Google Scholar] [CrossRef] [Green Version]
  37. Muto, M.; Tsubokura, M.; Oshima, N. Negative Magnus lift on a rotating sphere at around the critical Reynolds number. Phys. Fluids 2012, 24, 014102. [Google Scholar] [CrossRef] [Green Version]
  38. Rodríguez, I.; Lehmkuhl, O.; Borrell, R.; Oliva, A. Flow dynamics in the turbulent wake of a sphere at sub-critical Reynolds numbers. Comput. Fluids 2013, 80, 233–243. [Google Scholar] [CrossRef]
  39. Möller, W. Experimentelle untersuchungen zur hydrodynamik der kugel. Phys. Z. 1938, 39, 57–80. [Google Scholar]
  40. Cometta, C. An Investigation of the Unsteady Flow Pattern in the Wake of Cylinders and Spheres Using a Hot Wire Probe; Report No. WT-21; Brown University: Providence, RI, USA, 1957. [Google Scholar]
  41. Achenbach, E. Vortex shedding from spheres. J. Fluid Mech. 1974, 62, 209–221. [Google Scholar] [CrossRef]
  42. Sakamoto, H.; Haniu, H. A study on vortex shedding from spheres in a uniform flow. J. Fluids Eng. 1990, 112, 386–392. [Google Scholar] [CrossRef]
  43. Mittal, R.; Najjar, F. Vortex dynamics in the sphere wake. In Proceedings of the 30th Fluid Dynamics Conference, Norfolk, VA, USA, 28 June–1 July 1999; p. 3806. [Google Scholar]
  44. Mittal, R. Response of the sphere wake to freestream fluctuations. Theor. Comput. Fluid Dyn. 2000, 13, 397–419. [Google Scholar] [CrossRef]
  45. Kim, W.; Yoo, J.Y.; Sung, J. Dynamics of vortex lock-on in a perturbed cylinder wake. Phys. Fluids 2006, 18, 074103. [Google Scholar] [CrossRef]
  46. Jeong, J.; Hussain, F. On the identification of a vortex. J. Fluid Mech. 1995, 285, 69–94. [Google Scholar] [CrossRef]
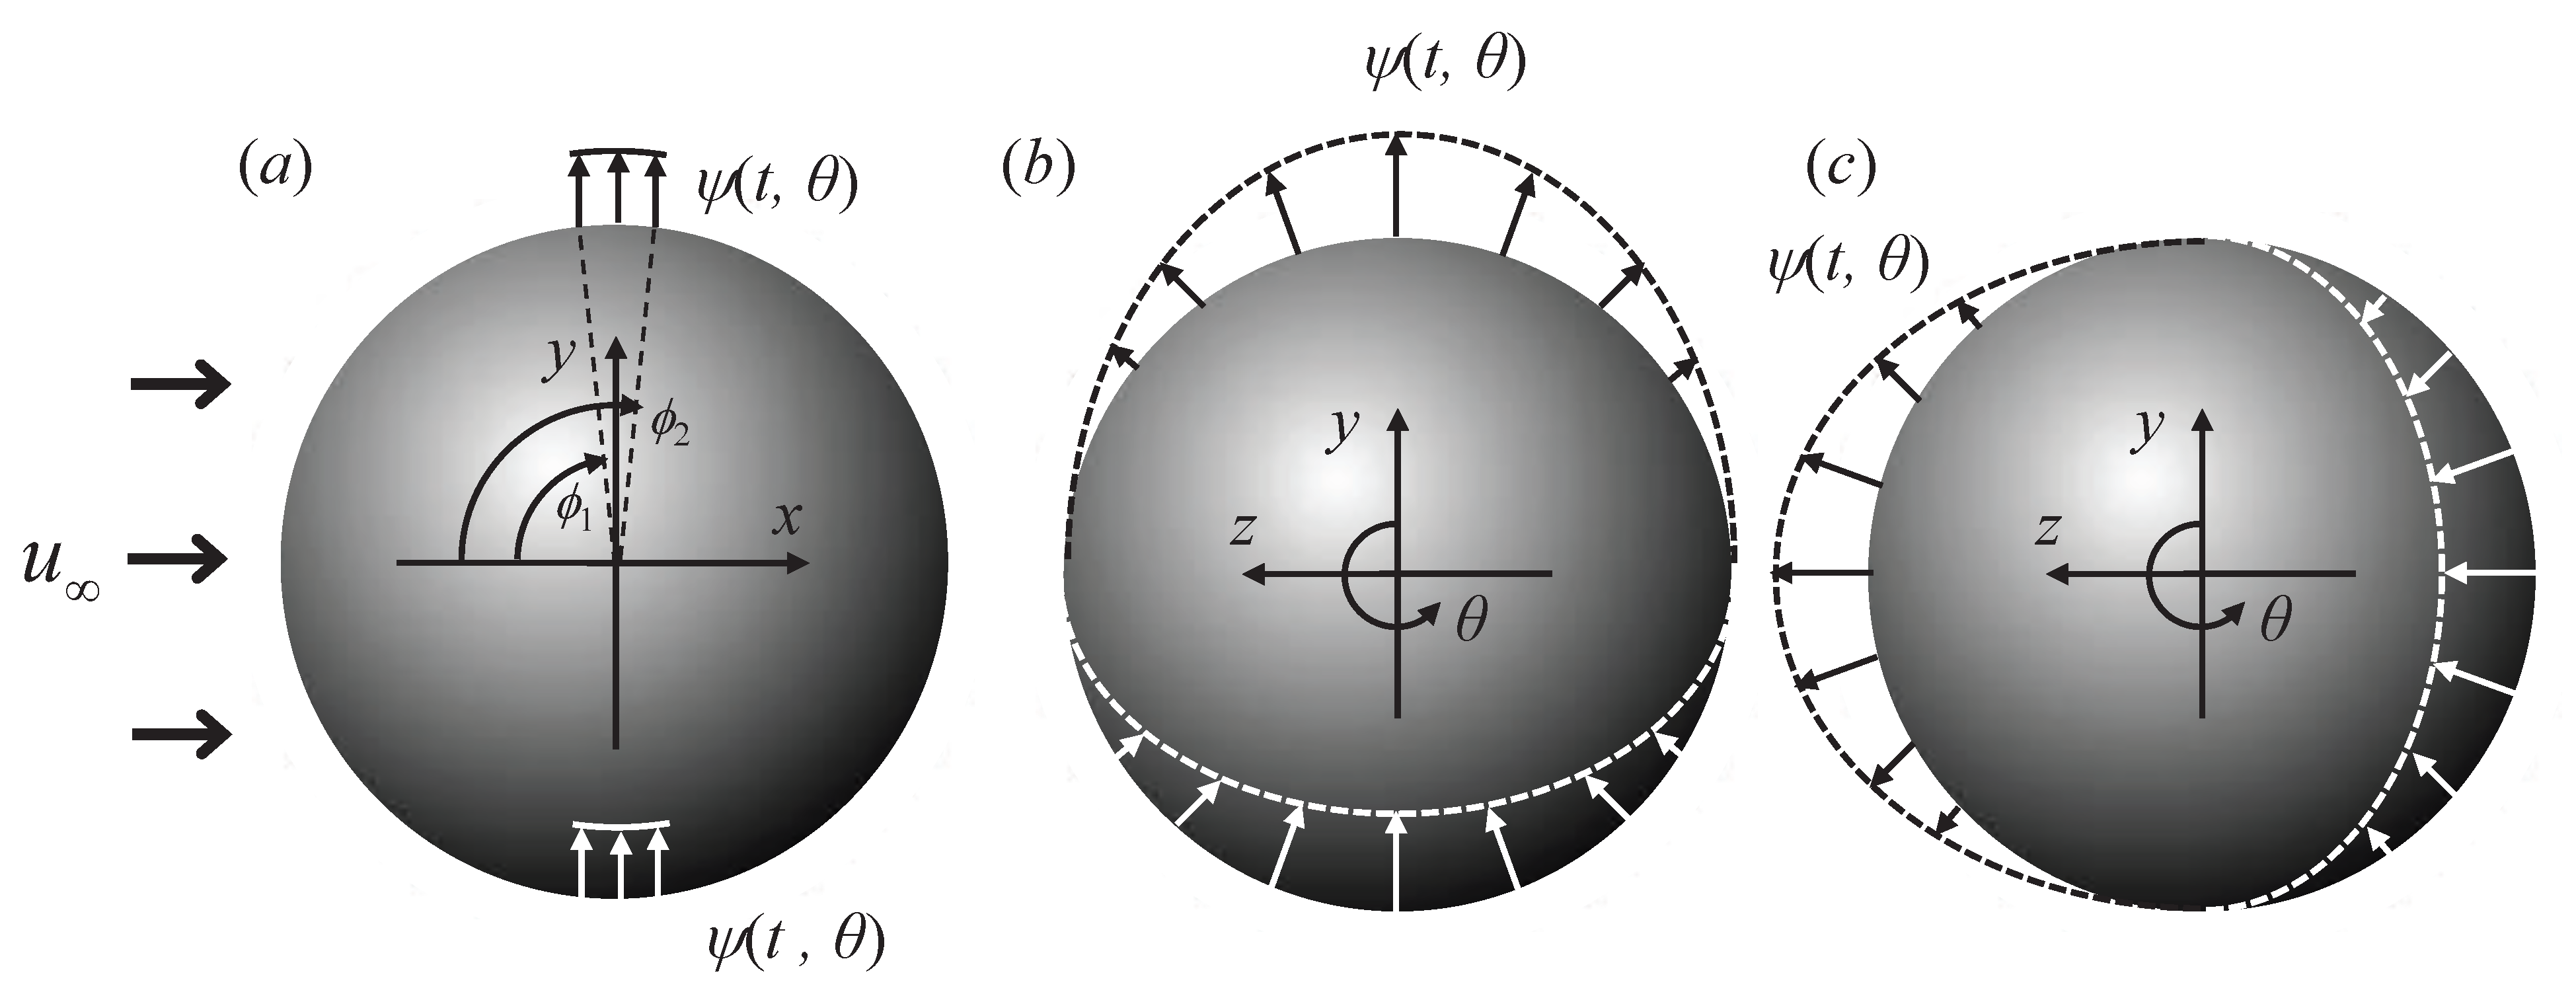
Figure 1. Schematic diagram for periodically rotating distributed forcing on the sphere surface: (a) forcing profile in x-y plane; (b) forcing profile in y-z plane at t = 0 ; (c) forcing profile in y-z plane at t = 0.25 / f . Here, arrows on the sphere surface indicate blowing/suction forcings. The forcing profile refers to Equation (1).
Mathematics 11 00706 g001
Figure 2. Coordinate system, computational domain and boundary conditions.
Mathematics 11 00706 g002
Figure 3. Grid distributions near the sphere: (a) in yz plane; (b) in xr plane. Every other grid is shown.
Mathematics 11 00706 g003
Figure 4. Shear layer and wake frequencies of the flow over a sphere at different Reynolds numbers: present study, ◯; Möller [39], +; Cometta [40], ×; Achenbach [41], ▲; Kim and Durbin [14], – – –; Sakamoto and Haniu [42], ——; Constantinescu and Squires [36], ▼; Yun et al. [27], ♦.
Mathematics 11 00706 g004
Figure 5. Variations of force coefficients versus the forcing frequency ( f * ) with the fixed forcing amplitude of V 0 / u = 0.2 : (a) mean drag coefficient ( C D ); (b) rms of lift coefficient fluctuations ( C L r m s ). Here, dashed line denotes values for the uncontrolled flow.
Mathematics 11 00706 g005
Figure 6. Time traces of force coefficients for various forcing frequencies: (a) C D versus the time; (b) C y C z for the uncontrolled flow; (c) C y C z for f * = 0.25 ; (d) C y C z for f * = 1.5 ; (e) C y C z for f * = 5.0 . For (a), ■, without control; – – – (black), f * = 0.25 ; —— (black), f * = 1.5 ; —— (blue), f * = 5.0 .
Mathematics 11 00706 g006
Figure 7. Contours of the averaged pressure in the near wake of the sphere with various forcing frequencies f * ( V 0 / u = 0.2 ): (a) uncontrolled flow; (b) f * = 0.25 ; (c) f * = 1.5 ; (d) f * = 5.0 . Here, denotes the averaging over time and azimuthal direction.
Mathematics 11 00706 g007
Figure 8. Instantaneous three-dimensional vortical structures in the turbulent wake of the sphere identified using the λ 2 method [46] with various forcing frequencies f * ( V 0 / u = 0.2 ): (a) uncontrolled flow; (b) f * = 0.25 ; (c) f * = 1.5 ; (d) f * = 5.0 .
Mathematics 11 00706 g008
Figure 9. Contours of instantaneous azimuthal vorticity ( ω θ ) on a xy plane: (a) uncontrolled flow; (b) controlled flow with f * = 1.5 and V 0 / u = 0.2 .
Mathematics 11 00706 g009
Figure 10. Instantaneous velocity vectors on the xr plane ( θ = 0 ) in the near wake at different temporal instances owing to the periodically rotating distributed forcing ( f * = 1.5 and V 0 / u = 0.2 ): (a) t = 0 ; (b) t = T / 4 ; (c) t = 2 T / 4 ; (d) t = 3 T / 4 . Here, T denotes the temporal period defined to be T = 1 / f . Note that the forcing slot locates from ϕ = 84 to ϕ = 96 .
Mathematics 11 00706 g010
Figure 11. Variations of force coefficients according to the forcing amplitude V 0 / u with the fixed forcing frequency of f * = 1.5 : (a) mean drag coefficient ( C D ); (b) rms of lift coefficient fluctuations ( C L r m s ). Here, dashed line denotes values for the uncontrolled flow.
Mathematics 11 00706 g011
Table 1. Flow statistics of the uncontrolled flow over a sphere at R e = 10 4 from the present simulation together with those from previous studies.
R e C D C p b ϕ s (deg)
Constantinescu and Squires [36] 10 4 0.393−0.27584
Yun et al. [27] 10 4 0.393−0.27490
Muto et al. [37] 10 4 0.446--
Rodríguez et al. [38] 10 4 0.402−0.27284.7
Present study 10 4 0.420−0.27488
Disclaimer/Publisher’s Note: The statements, opinions and data contained in all publications are solely those of the individual author(s) and contributor(s) and not of MDPI and/or the editor(s). MDPI and/or the editor(s) disclaim responsibility for any injury to people or property resulting from any ideas, methods, instructions or products referred to in the content.