Abstract
This study attempts to reveal the consequences of coronavirus disease 2019 (COVID-19) on micro, small, and medium enterprises (MSMEs) in Chiang Mai, Thailand. A total of 786 MSMEs were surveyed during May and August 2022, corresponding to the period when the recovery of businesses and livelihoods from the ongoing COVID-19 crisis became more perceptible. The perceptions of COVID-19’s impact on MSMEs and their survivability are explored and investigated. To achieve this goal, a copula-based sample selection survival model is introduced. This idea of the model is extended from the concept of the Cox proportional hazards model and copula-based sample selection model, enabling us to construct simultaneous equations—namely, the probability-of-failure equation (selection equation) and the duration-of-survival equation (time-to-event or outcome equation). Several copula functions with different dependence patterns are considered to join the failure equation and the duration-of-survival equation. By comparing the Akaike and Bayesian information criteria values of the candidate copulas, we find that Farlie–Gumbel–Morgenstern (FGM) copula performs the best-fit joint function in our analysis. Empirically, the results from this best-fit model reveal that the survival probability of MSMEs in the next year is around 80%. However, some MSMEs may not survive more than three months after the interview. Finally, our results also reveal that the tourism MSMEs have a lower chance of survival than the commercial and manufacturing MSMEs. Notably, the business size and the support schemes from the government—such as the debt restructuring process, the tax payment deadline extension, and the reduced social security contributions—exhibited a role in lengthening the survival duration of the non-surviving MSMEs.
MSC:
62N02; 62H05
1. Introduction
Coronavirus disease 2019 (COVID-19) has had significant impacts on national and global economies [,,]. After the announcement of the COVID-19 pandemic in January 2020, many countries implemented lockdown policies, causing severe economic impacts on large and small businesses []. Shankar [] found that small businesses were the primary victims of COVID-19 and were more vulnerable to this crisis compared to large enterprises. This is due to their lack of sufficient resources and opportunities to generate income during the crisis [], and they were not ready for any COVID-19–related disruptions [,]. As a result, many small businesses temporarily or permanently shut down and laid off their workers [,]. In particular, many MSMEs are running out of funds, some are barely surviving, and others will soon liquidate.
In this study, we attempt to explore the impact of COVID-19 on micro, small, and medium-sized enterprises (MSMEs) operating in Chiang Mai, Thailand, during the recovery period. Three research questions are investigated: First, how long do MSMEs expect to survive during this ongoing pandemic? Second, how do MSMEs adjust to the economic failure resulting from COVID-19? Third, what are the factors hindering or supporting the survivability of the MSMEs? Even though business survival or vulnerability is not a new issue in the research related to MSMEs [,], the study of business survival of MSMEs is still important in the context of the urgent need for knowledge about how MSMEs may survive during this recovery period. The results of this study will establish the basis for preparing a government policy and strategy that shields the operation of MSMEs.
This study focuses on the MSMEs operating in Chiang Mai, as this subsector is the largest contributor to the economy of Northern Thailand (gross provincial product (GPP) of USD 7.99 billion in 2019). Chiang Mai has the potential for the development of startup businesses, and the number of MSMEs has grown continuously over the past 40 years. Recently, MSMEs in Chiang Mai have become essential vehicles for creating economic activities, generating more than 10,000 jobs each year. However, the number of operational MSMEs has dropped by about 50% since the advent of the COVID-19 pandemic in Thailand (after March 2020). These challenges in Chiang Mai’s MSMEs remind policymakers to prepare countermeasures against COVID-19, and this task necessitates an in-depth analysis of how to improve the survivability of MSMEs. Several internal and external factors hindering and supporting MSMEs’ survival are worth investigating.
From the methodological point of view, several statistical and econometric methods have been applied to investigate the set of factors affecting business survivability. Altman [] first introduced multiple discriminant analysis (MDA) to investigate the probability of financial failure of businesses. Nevertheless, this method has several disadvantages: First, the results obtained from the MDA are limited to the probability of non-survival and ignore the information about the surviving businesses. Second, the expected time-to-failure or time-to-event is neglected. Third, this model cannot predict the probability of business failure [,]. Subsequently, the logit and probit models were proposed to predict the probability of business survival []. However, these models continue to neglect the length of time until the business failure occurs, reducing the predictive power of the survival probability.
Later, the Cox proportional hazards model [] was proposed to include the time-to-event data in the analysis of the survival probability. Traditionally, in survival analysis, death is the event variable, and loss to follow-up is the censoring variable (due to patient withdrawal from the study). In this study, we define the time-to-event data or censoring variable as the length of time until the occurrence of the business failure due to the COVID-19 crisis. Thus, this model enables us to simultaneously predict the time to business failure and the probability of the business failure. Recently, this model has been employed for business failure prediction in many studies (e.g., [,,]), confirming the higher performance and greater usefulness of this Cox model compared to the conventional models.
However, the Cox proportional hazards model generally assumes that failure and censoring components in the dependent variable are independent. Huang and Zhang [] raised this issue and explained that this independent assumption could lead to several problems in the estimation of the model. They showed that the survival function is quite sensitive to the degree of correlation between failure and censoring. Specifically, if the correlation between these two components is not well defined, it will lead to estimation bias of the model parameters. To deal with the independence assumption between the failure and censoring components, Huang and Zhang [] suggested using the copula approach to join the marginal distributions of failure and censoring times. Several copula functions are proposed in the literature [], and each copula has a different joint distribution structure. This allows the copula to be more flexible to capture any complicated joint distribution between random variables—for example, joint asymmetry, excess joint skewness, or joint kurtosis [,]. Hence, it is beneficial to have a wide range of potential candidate models from which a preferred fit can emerge []. Nevertheless, Xu et al. [] mentioned that estimating the parameters with the dependence assumption as the nonparametric likelihood would be challenging. Furthermore, although the copula is a powerful joint distribution function, it is still difficult to join the marginal distributions of failure and censoring times when their marginal distributions are nonparametric. As a result, the association parameter for the copula model is not easy to estimate, and this parameter estimation is a vital step when using copulas in survival analysis. Another application of the copula to the survival model was proposed by Petti et al. [] to link various time-to-event outcomes that are measured on the same individuals.
As reviewed above, the copula approach has often been suggested for estimating survival models, since it has been found to improve the accuracy of survival analysis. In this work, we also want to contribute further value to the literature in this field of interest by applying the copula-based sample selection model of Smith [] to Cox’s survival analysis. This model consists of a selection equation and an outcome equation, where the outcome is observable but the observation is not subject to censoring. Through this application, the Cox proportional hazards model is split into two equations, where the selection equation is synonymous with the probability-of-failure equation ( if the business does not survive or is not censored, and if the business survives), and the outcome equation is synonymous with the time-to-event equation (). The joint copula model is thus identifiable because the marginals of the selection and outcome equations are parametric.
In this study, we use bivariate copula functions to join the marginal distributions of the failure time (time-to-event) and probability-of-failure equations. To the best of our knowledge, this is the very first attempt to propose using a copula to join the marginal distributions of the survival time and probability-of-failure equations in the survival analysis. Another novelty of this study is that although recent studies related to COVID-19’s impact on businesses have shown a growing interest, few studies have applied survival models to predict the length of MSMEs’ survival in the context of the COVID-19 crisis. To date, no study has been conducted to identify how the sociodemographic and economic characteristics of the MSMEs are associated with the survival of MSMEs operating in Chiang Mai, Thailand. Thus, this work aims to apply the new survival models to identify the factors that hinder or support Chiang Mai MSMEs’ survivability during the COVID-19 recovery period. Our results highlight how long MSMEs could survive during the COVID-19 crisis, as well as their survival probabilities. Policymakers should consider this information to develop the appropriate COVID-19 countermeasures for Chiang Mai’s MSMEs.
We organize the rest of the paper as follows: Section 2 reviews the literature on the theories and foundations of business responses and the impacts of COVID-19 on businesses. In Section 3, we provide the concepts of the Cox proportional hazards model and introduce the copula approach with special reference to the Cox proportional hazards model. Section 4 introduces the variables and survey data. In Section 5, we discuss our main results. Finally, the paper ends with conclusions and policy implications in Section 6.
2. Literature Review
2.1. Theories and Foundations of the Business Response to COVID-19
Since the onset of COVID-19, scholars have suggested several theories and foundations to better understand the economic impacts of COVID-19 on businesses in various countries. These theories include disaster, effectuation, resilience, dynamic capabilities, and digitalization theories []. These theories attempted to explain the businesses’ responses or decisions under the risk of uncertain periods. Resilience theory [] defines this uncertainty as the crises and exogenous shocks that cannot be forecasted or controlled. The business owner needs to reorient their business in new ways to solve the consequences of COVID-19 []. For example, many businesses have turned to online marketing to reach those consumers who have shifted to online buying []. This is in contrast to the effectuation theory [], which considers uncertainty to be controllable if we adjust the business’s goals to be consistent with resources. In particular, it advises balancing the business’s goals with resources to reduce uncertainty. The study of Haneberg [] revealed that the actions or responses of some businesses to cope with COVID-19 mostly appeared during the second wave of the COVID-19 pandemic, after learning and understanding the uncertainties in the first wave. Another theory is the dynamic capabilities theory of Teece et al. [], which explains that the firm or business needs to integrate, build, and reconfigure internal and external capabilities to produce a new technique to respond quickly to uncertainty []. For instance, during the COVID-19 pandemic, many businesses have transformed their business model by the adoption of digital technology and digital skills to cope with environmental changes caused by the pandemic []. Finally, there is the digitization theory, which assesses the digital capabilities of the business and uses them to construct a new resilience business model for dealing with uncertainty (for example, a shift to remote working and remote operations) [].
2.2. The Survivability of Thai MSMEs
Many studies have attempted to explore the factors affecting the survival of businesses in Thailand. Rattanapongpinyo [] explored the determinants of SMEs’ survival in the western provinces of Thailand using ANOVA and Pearson’s correlation coefficients, revealing that leadership, innovation, and economic and sociological factors were the key supporting factors of SMEs’ survival. However, small businesses that have a high debt ratio are more likely to collapse. Earlier, Wongveeravuti and Rewin [] attempted to find a survival kit for SMEs and revealed that efficient capital management is the key variable affecting the survival and expansion of the firm. Meanwhile, Ruenrom [] suggested that corporate brand, enterprise value, recognition, transaction measurement, and worker engagement should also be considered as the success factors of SMEs.
Regarding the impact of COVID-19 on the survivability of Thai MSMEs, although the COVID-19 crisis has been confirmed to have hurt businesses in many countries ([,,,], there are a very small number of published papers attempting to explore the potential recovery factors for Thai MSMEs. Pongsakornrungsilp et al. [] investigated the responses of tourism businesses in Thailand to COVID-19 and explored how these businesses could recover from the pandemic. They found that businesses with strong brand management are more likely to be able to survive the COVID-19 crisis. Recently, Pongsakornrungsilp et al. [] further suggested that a sustainable tourism management plan can also be used to manage the impacts of COVID-19. This plan should consist of three aspects—namely, the environmental, social, and economic—to achieve sustainable tourism. In addition, this plan should build collaboration between economic and social parties to protect and manage natural resources.
Although the existing studies have provided empirical findings on the identified factors determining the survival of businesses, they were conducted only as qualitative research in the form of in-depth interviews or focus group interviews, which might not be enough to confirm the statistical evidence of COVID-19′s impacts. Moreover, the investigation of businesses’ survival duration during this recovery period is still neglected. In particular, COVID-19’s impact on the survival probability of Chiang Mai businesses has still been overlooked. Moreover, many Chiang Mai MSMEs are more prone to failure due to the lack of sufficient governmental support. Little is known about how COVID-19 has affected the survivability of MSMEs. Hence, it is worth revisiting the impact of COVID-19 and suggesting policy recommendations for the survival of MSMEs in Chiang Mai during the COVID-19 recovery period.
3. Methodology
In this section, we briefly review the concept of survival analysis, the Cox proportional hazards model, and the copula approach. Then, the proposed copula-based survival analysis is introduced and derived.
3.1. Survival Analysis
Survival analysis is the method of measuring the duration and probability of units surviving at time until the event of interest occurs. In this study, our units can be viewed as the businesses of MSMEs, and the event of interest is one year after interviewing the businesses during the ongoing COVID-19 pandemic. Let be the survival time. Then, we can define the probability of MSMEs surviving at time as follows:
and its density function is
The survival function of MSMEs is defined as follows:
As it is quite difficult to determine the core failure pattern of the survival function, Liu [] suggested applying the hazard function, which can provide more information regarding the failure mechanism than the survival function. Note that the hazard function is the instantaneous probability of failure (i.e., shutting down the business) at time t, given survival until , and it can be defined as follows:
where is the probability density of failure at time . This implies that
or, equivalently,
where is the cumulative hazard function.
3.2. The Cox Proportional Hazards Regression Model
We are trying to model the effects of covariates (i.e., hindering and supporting factors), and we are typically interested in understanding the effects of the covariates on the hazard function. The common model used to investigate this issue is the Cox proportional hazards model []. The model takes the following form:
where is the baseline hazard—the hazard function associated with . is the coefficient of factor , and is the vector of the covariate . Note that all independent variables are assumed to be independent of one another to avoid the multicollinearity problem. The Cox model can be conveniently expressed in terms of a log-log regression model; thus, taking log on both sides of Equation (7) yields
This model is semiparametric regression, as the baseline hazard can take any form, and the covariates are regressed linearly on the log conditional hazard function. To estimate this model, as is not easy to specify, the partial likelihood is normally used. The partial likelihood function is constructed on the conditional probability that a particular business would fail at time given the set of businesses that survive just before time . Thus, we can define the partial likelihood as follows:
where is an indicator of whether the business survives; thus, if is the time-to-event (i.e., the length of time that it takes for a business to fail during COVID-19), ; otherwise, if is the right-censored time or business has not yet failed (survive), and is the censoring period determining the survival of the business . We can observe that if becomes 1; thus, the product of the conditional probabilities for all of the right-censored observations is also 1. Therefore, the full likelihood in Equation (9) can be simplified by only multiplying the conditional probabilities over all events , where is the recorded time of failure (i.e., the number of business failures).
3.3. Copula-Based Sample Selection Survival Model
The structure of the sample selection survival model can be formulated as follows:
where is the indicator function. In this model, we restrict the covariates or regression coefficients to be time-fixed, and the time-to-event (outcome equation) and the probability of failure (selection equation) have identical independent variables. However, as we deal with the system of equations, the exclusion restriction is not fulfilled under this restriction setting, which may result in higher standard errors in the parameter estimates []. Note that the exclusion restriction is fulfilled if the vectors of explanatory variables for the probability-of-failure equation and the time-to-business-failure equation are independent. However, Chamberlain [] revealed that the standard errors of the estimates depend on the variation in the latent selection equation, even without the exclusion restriction being fulfilled. If the model contains a higher variation in the covariates, smaller standard errors are obtained. In this study, several covariates or factors were collected from the survey data, with high variation. Thus, our estimation will not lead to biased results.
In this study, we used the copula function to join the marginal distributions of and . Thus, the bivariate joint distribution of and can be defined as follows:
where and are the marginal cumulative distribution of and , respectively. Thus, and are uniform marginal on the [0, 1] interval. is a parameter that governs the degree of dependence. The properties of the copula function are as follows:
Thus, to estimate this joint distribution, we need to define the joint distribution function. By using the chain rule and the properties of the copula function, Smith [] suggested the partial derivative of a joint density as follows:
where is the density function of the error in the time-to-failure equation. According to Heckman [], the likelihood of Equation (11) is defined as follows:
where is the density function of the error , and is the bivariate joint density function of the errors and . Then, we can modify the conventional likelihood function by replacing the bivariate joint density function with the copula density function (Equation (13)). This leads to the following likelihood function:
where . As we work on the survival data, the appropriate marginal distribution for and must be well specified, reflecting the character of the time-to-event and probability-of-failure equations. In this study, Poisson or negative binomial distributions are assumed for the time-to-failure equation, while logistic distribution is assumed for the probability-of-failure equation. This is due to the censoring indicator being defined in 0 and 1, while the failure time represents the number of months that the business could survive before the event. The use of the copula for joining discrete and continuous variables is possible, and it has been proven and explained by Zilko and Kurowicka [] and Ahn, Fuchs, and Oh []. Note that the event of interest considered in this study is the event that a business is permanently closed due to COVID-19 within one year after the interview process. To estimate all of the parameters of the model, we can take the logarithm on the partial likelihood (Equation (15)) to obtain the log partial likelihood, as follows:
where and are the sum over those observations for non-surviving and surviving businesses, respectively, while is the derivative of the copula generator function, which then maximizes Equation (16) with respect to and . Furthermore, to compute the standard errors of the parameters, we can compute them from the Hessian matrix derived from the second derivatives of the log partial likelihood with respect to our parameters. Specifically, we can take the square root of the diagonal inverse of the Hessian matrix to obtain the standard errors of , , and .
In terms of copula function, there are many copulas that we can choose, and different copulas imply different structures of the joint distribution. In this study, several copulas—including Gaussian, Farlie–Gumbel–Morgenstern (FGM), Student’s t, Ali–Mikhail–Haq (AMH), Clayton, Frank, Gumbel, and Joe—are considered, and the functional forms of these copulas are provided in Table 1. Note that the Gaussian, Student’s t, FGM, and Frank copulas have symmetric dependence patterns. However, the Frank copula exhibits a stronger dependence in tails than the Gaussian, while Student’s t copula has a stronger tail dependence than the Gaussian and Frank copulas. The Ali–Mikhail–Haq (AMH), Clayton, Gumbel, and Joe copulas are non-symmetric dependence copulas that only exhibit either upper or lower tail dependence.

Table 1.
Distribution functions of copulas.
4. Data
Data Collection
This study uses a survey collected as part of the project of studying the impacts of COVID-19 on the vulnerabilities of the MSMEs in Chiang Mai during the COVID-19 recovery period (from May to August 2022). The timing of the survey allows us to understand the expectations of MSMEs when both the progression of COVID-19 and the COVID-19 countermeasures are quite certain. The survival expectations survey is utilized to uncover how MSMEs perceive and react to the COVID-19 pandemic. We present a business survival and vulnerability analysis model and collect data from micro 60%), small (27.5%), and medium (12.5%) businesses to address local problems in Chiang Mai, Thailand. The data were collected through a snowball sampling technique due to the cost- and time-saving benefits []. Around 95% of the respondents were either the owners of MSMEs or working in managerial positions. The survey sample consisted of 786 MSMEs in Chiang Mai, divided into 485 micro-sized samples, 237 small samples, and 64 medium-sized samples. Note that all participants had already signed the informed consent form before being interviewed. This survey asked MSMEs whether or not COVID-19 had impacted their survivability, how they had adapted to these impacts, and whether they participated in the mitigation program provided by the government.
Survival analysis is a technique used to analyze the length of time for which a business can survive under certain conditions. It requires data on the duration from when the business was surveyed until it failed. The questionnaire has a filter question to classify the surviving and non-surviving MSMEs by asking about their expectations of business survival during the COVID-19 recovery period. In this study, if MSMEs can survive for more than one year (12 months), we classify them as surviving MSMEs; otherwise, they are classified as non-surviving MSMEs. In this context, the survey question “During the recent COVID-19 recovery period, if Thailand faces COVID-19 for another year, how much longer could your business survive under the current conditions?” was used to gather information on the survival duration of MSMEs. The options given in the survey, ranging from 1 month to more than 12 months, can be used to determine the likelihood of the business’s survival.
Furthermore, to identify the key factors affecting the survival probability of MSEs, the considered independent variables were business-specific characteristics, COVID-19-associated impacts, business adaptation against COVID-19, and participation in government-sponsored programs ([,,]).
Table 2 presents the definitions of the variables used in this study and their corresponding mean statistics. We can observe that 87.2% of MSMEs owners expected to close their business within one year, while the average number of survival months of this group was 6.621 months. This indicates that some MSMEs remained concerned about the negative impacts of COVID-19 during this recovery period. In terms of COVID-19-associated impacts on business, the participating MSMEs have been severely affected by COVID-19. Notably, on average, the MSMEs reported that they had lost one worker since the advent of COVID-19 and that their profits had dropped by 37.51% and 27.04% in 2020 and 2021, respectively, compared to their 2019 levels. We also found that the businesses’ debt has increased by an average of THB 416,805.62 baht during the pandemic. In the case of participation in the government-sponsored programs, fewer than 50% of the MSMEs said that they participated in the government programs, except for the reducing water and electricity bills program (65.7%).
Table 2.
Variable descriptions and descriptive statistics.
5. Results
5.1. Model Selection
Before we present this study’s results, the best copula function for joining the survival time and probability-of-failure equations in the sample selection survival model and the marginal distribution of the time-to-event equation are explored by using the Akaike information criterion (AIC) and the Bayesian information criterion (BIC). The values of the AIC and BIC for each copula-based model are presented in Table 3. Several copula functions and two types of marginal distributions are considered, and the results show that FGM with logistic-negative binomial type II margins is the best-fit specification, obtaining the lowest AIC and BIC. This implies that the dependence between the survival time and probability-of-failure equations is symmetrical, and that no tail dependence exists between them. Moreover, we also performed the likelihood ratio (LR) test to check the null hypothesis of independence between the errors and . Note that the alternative hypothesis is dependence between them, characterized by each of the copula families based on logistic-negative binomial type II margins. Our results confirm that the dependence between error components exists, thereby justifying the use of the copula-based survival model.
Table 3.
Model selection.
5.2. Estimation Results
This section presents the estimated coefficients corresponding to the hazard ratios in Table 4. The interpretation of the hazard ratio is that if the value is above 1, it implies that the corresponding variable could worsen the survival probability of the MSMEs. On the other hand, if the hazard ratio is below 1, the corresponding variable is a supporting factor for business survivability. In Table 4, the results reveal that eight variables significantly affect the survival of the Thai MEMSs—namely, business sectors (S1, S2), business adaptation (Ad3, Ad4, Ad5), and the government’s support programs (P4, P7, P13). Note that the full descriptions of the variables are provided in Table 2. In this study, we focus on three different business sectors: the manufacturing, service, and commercial sectors, where the business is designated as S1 (if it is in the manufacturing sector) or S2 (if it is in the service sector). The estimated results show that businesses in the manufacturing and commercial sectors have a higher chance of surviving during the recovery time from the COVID-19 pandemic than those in the service sector, with hazard ratios of 0.303 and 0.435, respectively. This means that if the Thai MSMEs are in the manufacturing and commercial sectors, their survival probability will increase by 69.7% and 56.5%, respectively. This finding is consistent with the economic fundamentals of Thailand. Thailand’s service sector depends greatly on tourism. Therefore, during the COVID-19 pandemic, tourism was sluggish, which negatively affected the service sector. Even during the economic recovery, the service sector—especially the tourism sector—was slow to recover compared to other economic sectors.
Table 4.
Estimation results of the failure equation.
In contrast, we can observe that business adaptation (Ad3, Ad4, Ad5) and support programs from the government (P4, P7, P13) show positive signs, indicating that these factors hinder the business’s survival probability. Indeed, the hazard ratios of variables Ad3, Ad4, and Ad5 are 3.751, 3.924, and 4.336, respectively, implying that if a business adjusts its use of raw materials, its chance of survival will be reduced by 375.1% (for Ad3)—or 3.751 times lower than the unadjusted level. Similarly, if a business adjusts its use of machinery (e.g., by changing production equipment or machine operating hours) and the use of its business place (e.g., by reducing the rent of the business premises, selling, or leaving the place idle), its probability of business failure will increase by 3.924 (for Ad4) and 4.336 (for Ad5) times the levels with no change, respectively. Furthermore, Shafi, Liu, and Ren [] found that most businesses faced a cash flow shortage during the pandemic. As a result, they need to reduce the costs of production and revamp their internal processes to manage the cost and cash flow. However, this study found that adaptations made to internal processes—especially those related to raw materials, machinery, and business premises—will decrease the business’s survival probability. Moreover, during the survey process, we found that most Thai MSMEs decided to protect their workforce and did not lay off their employees—especially in the service sector—to avoid loss of human capital in the long term. Therefore, they decided to adjust the costs of production in other ways and focused on raw materials, machinery, and business premises instead. However, we must note that survival probability in this study was based on the business owners’ self-assessment. Thus, businesses that have adapted their internal processes may have less confidence in their survival compared to businesses with no changes.
Lastly, in terms of the support programs from the government, we found that social security (P4), reducing water and electricity bills (P7), and the “Ying Chai Ying Dai” program (P13) harm the businesses’ survival probability. This means that the businesses participating in these programs will have a higher risk of business failure than those not participating, with hazard ratios of 6.828, 6.234, and 9.650, respectively. Among all measures, the “Ying Chai Ying Dai” program has the highest relative impact on business failure. We found that if a business participates in this program, its probability of failure will be 9.469 times higher than that of those not participating. According to the Thai government spokesman, the “Ying Chai Ying Dai” program aims at increasing the general public’s spending, with the concept of “the more you spend, the more you get”. This scheme provides a cashback E-voucher with 10–15% of spending (with a maximum limit of THB 10,000 per person) to people who purchase domestic products through the government mobile application. This program is expected to boost public spending and stimulate the Thai economy effectively during the pandemic. However, the shops or businesses that want to join this program must register for VAT (value-added tax), which causes higher costs to the participating shops and harms small and medium-sized businesses’ survival probability.
Concerning the non-surviving businesses, some variables could extend the duration of their survival. As shown in Table 5, we found that if the Thai MSMEs are in the manufacturing sector (S1), their survival duration will increase by 0.299 months compared to other sectors. Moreover, we found that the size of the business also matters. Small businesses tend to survive longer than micro- and medium-sized businesses, with a coefficient of 0.475 (for B2), meaning that their survival duration will increase by 0.475 months if they are a small enterprise. In addition, participating in the debt restructuring process (Ad10) was found to increase the duration of survival by 1.201 months. This process will help improve the business’s chance of paying back its obligations by, for example, reducing the interest rates of loans and extending their due dates. Lastly, our results reveal that some government support programs can benefit the survival duration—namely, the extension of the tax payment deadline (P8) and reducing social security contributions for three months (P10). In particular, the Thai government has extended the deadlines for paying income tax and VAT from March to August (extended for three months) to help people and MSMEs during the pandemic. Our results reveal that this scheme could help the businesses and lengthen their survival by 0.581 months. Similarly, the Social Security Office (SSO) of Thailand also announced a three-month extension of the social security contributions reduction during the pandemic. This scheme could help reduce the businesses’ operation costs and was found to extend the survival duration by 0.655 months.
Table 5.
Estimation results of the time-to-event equation of the failed businesses.
In contrast, we observed that the amount of business debt (D), adaptation in research/technology (Ad6), and debt moratorium/waiver of debt repayment/debt correction NPL (P2) showed negative signs, indicating that these factors hinder the survival duration of the non-surviving businesses. In particular, the coefficient of business debt (D) is −0.004, meaning that if the business has higher debt, it will reduce the survival duration by 0.004 months. Similarly, the coefficient of the debt moratorium/waiver of debt repayment/debt correction NPL (P2) is −0.523, indicating that if the business participates in this scheme, it will reduce their survival duration by 0.523 months. Among these three variables, we found that adaptation in research/technology (Ad6) had the most significant effect on the survival duration, with a coefficient of 1.193. This means the Thai MSMEs that adapt their research and technology will survive 1.193 months less than those who do not. The possible reason behind this finding is that adopting new technology and engaging in research and development are proven to help businesses offer better products and services, meet customer needs, and give company executives a competitive advantage in the long term; however, R&D usually takes a long time to become effective and provide a return to the adapting company, and it often costs money. Therefore, businesses should refrain from investing in research and development during the pandemic or the recovery period.
Finally, our results also reveal the FGM dependence parameter as 0.805, implying the positive dependence between survival probability and time-to-event.
5.3. Survival Path Analysis
In this section, we present the survival path at times conditional on each significant covariate presented in Table 5 (i.e., business sector, debt moratorium, extension of the tax payment deadline, reducing social security contributions, adaptation in terms of debt restructuring, and adaptation in research and technology). We adopt the Kaplan–Meier estimator [] for constructing the survival function. The survival function is given by
where represents the recurrence times across all businesses (i.e., times when at least one event happened), is the number of non-surviving businesses at time , and is the number of surviving business up to time . The plots of survival probability with respect to the significant factors are presented in Figure 1, Figure 2, Figure 3, Figure 4, Figure 5 and Figure 6.
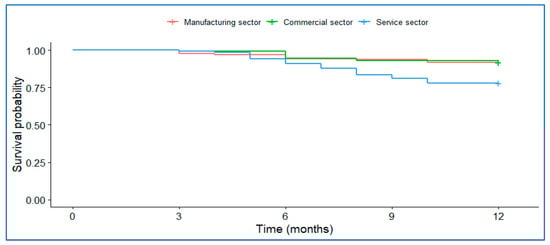
Figure 1.
Business sector (S1).
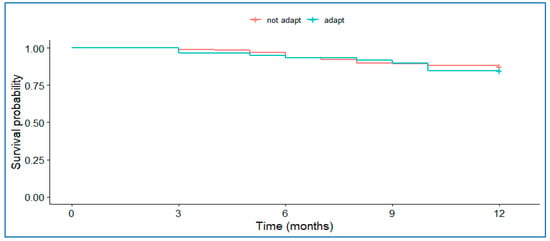
Figure 2.
Adaptation by debt restructuring (Ad10).
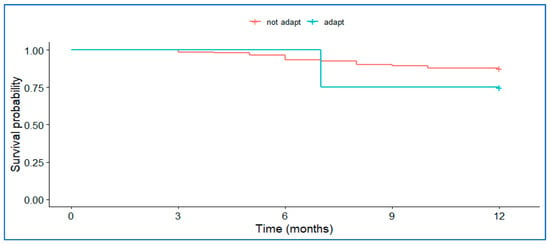
Figure 3.
Adaptation in research/technology (Ad16).
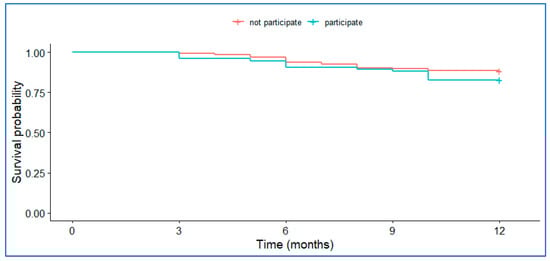
Figure 4.
Debt moratorium/waiver of debt repayment/debt correction NPL program participation (P2).
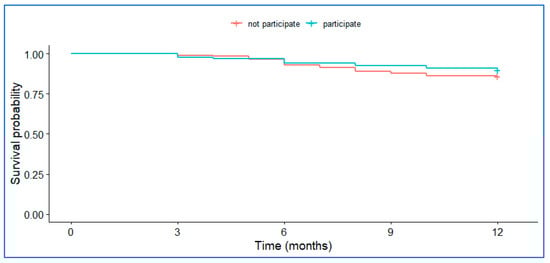
Figure 5.
Extension of tax payment deadline program participation (P8).
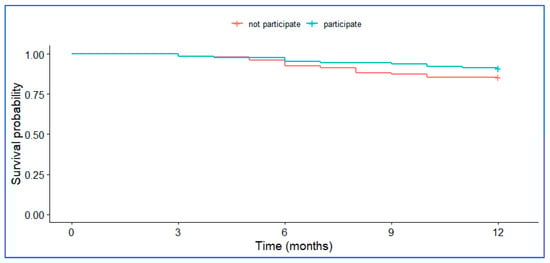
Figure 6.
Reducing social security contributions for 3 months program participation (P10).
Overall, we can observe that the survival path of the MSMEs has a step- or stair-shaped downward slope. The survival probabilities with respect to significant factors show a similar pattern to the way in which the survival probabilities gradually decrease over the periods that follow . The observed survival times are first sorted in ascending order, starting with the business with the shortest survival time. It can also be observed that the probability of business failure drops after the third month.
Considering the impact of each significant factor on the survival path, we found that the survival function was similar between the MSMEs in the manufacturing and commercial sectors, but different for the service sector (see Figure 1), as the MSMEs in the service sector had a lower survival probability than those in the manufacturing and commercial sectors. In particular, one of the leading industries in the service sector of Thailand is the tourism industry, which was most affected by the COVID-19 pandemic. The revenue of tourism MSMEs is greatly dependent on international tourists who are not fully entering Thailand. It is relevant that all COVID-19 travel restrictions for travelers to Chiang Mai have yet to be fully canceled. Thus, the expectation of tourism business owners remains pessimistic [], ultimately causing a lower survival probability compared to other sectors.
In business adaptation (e.g., online conference software and online marketing), we observed that if MSMEs adapt their research and technology, their survival probability is relatively high compared to MSMEs not adapting their research and technology to the COVID-19 shock. However, the opposite result was obtained after seven months of business survival, i.e., the survival expectations of the MSMEs dropped after seven months. Implementing changes in research and technology could bring them high initial costs [], and if COVID-19 continues to have an impact in the next six months, the business may face a cash shortage. According to the self-determination theory of Ryan and Deci [], many workers are looking at technology as the “survival kit” (the feeling of self-satisfaction) rather than an optional choice for business survivability. For example, suppose MSMEs adopt online work. In that case, the workers are able to continue their work activities online with other people, which may not be suitable for the hands-on work usually performed in MSMEs. However, if COVID-19 lasts for seven months or more, this technology adaptation may not be a good factor for the business, as it will decrease the survival probability of the business.
Similar patterns were obtained in terms of other significant factors, namely, debt restructuring, debt moratorium, an extension of the tax payment deadline, and the reduction in social security contributions for three months. We can observe that the survival probability is 100% for the first month and then gradually drops to 80% in the 12th month. These results reveal that the survival rates of MSMEs are not much different, consistent with the finding of the insignificant effect of debt restructuring (AD10) and the debt moratorium (P2) on survival probability in Table 3. However, MSMEs participating in the tax payment deadline extension and social security contributions reduction programs have been shown to have a higher survival chance than those who do not. This result implies that participating in these government support programs during this recovery period may result in a higher chance of survival, which is consistent with the findings of Liu et al. [].
6. Conclusions
This study analyzed the business survivability of MSMEs in Chiang Mai, Thailand, by dividing the sample into three main segments: micro, small, and medium. The main objective was to identify and evaluate these groups’ survival probability differences. Moreover, various supporting and hindering factors of business survivability were investigated to help us propose insightful policy recommendations for the MSMEs and government during this recovery period (from May to August 2022). These factors include business-specific characteristics, COVID-19-associated impacts, business adaptation against COVID-19, and support programs from the government. The reason for considering this recovery period is that this is the golden time for businesses that have survived the tremendous impact of COVID in 2020 and 2021. Therefore, if the appropriate policies and suggestions are introduced adequately by these MSMEs, it will help sustain their growth, accelerate their recovery speed, and result in the sustainable development of the MSMEs in the future.
To answer our research questions presented in the Introduction, we conducted a survey on the MSMEs’ expectations, characteristics, and responses to COVID-19 during the recovery period (from May to August 2022). The survey sample comprised 786 MSMEs in Chiang Mai, divided into 485 micro-sized samples, 237 small samples, and 64 medium-sized samples.
From the methodological perspective, we proposed the survival analysis model called the copula-based sample selection survival model. We extended the concept of the Cox proportional hazards model to the sample selection approach, where the selection equation is used to explain the survival probability of the MSMEs, and the outcome equation is used to explain the time-to-event or survival time of the MSMEs. To preserve the characteristics of the survival probability and survival time of the MSMEs, the distribution of the survival probability equation is assumed to be a logistic function, while the Poisson or negative binomial type II distribution is assumed for the survival time equation. To improve the accuracy of the model, we allow these two equations to be correlated and joined by the copula function. Several copula functions are considered in this analysis; these copulas include Gaussian, Student’s t, FGM, Frank, AMH, Clayton, Gumbel, Joe, and rotated copulas.
The copula comparison results show that FGM performs the best copula function according to the AIC and BIC. Thus, we used this copula to join the survival probability and time-to-event equations. The results from this model revealed that the survival probability of Thai MSMEs depends on business sectors and is influenced by business adaptation and support programs from the government. However, surprisingly, our results revealed that most of these factors negatively affect the survival probability of Thai MSMEs during the recovery period—especially the support programs from the government. Participation in the programs will harm small and medium-sized businesses’ survival probability. Furthermore, for the non-surviving businesses, some variables were found to expand their duration of surviving the pandemic. Our results highlight the role of business size and the government support schemes—such as the debt restructuring process, the extension of the tax payment deadline, and reducing social security contributions—in extending the survival duration of the non-surviving MSMEs for policymakers to consider. From our research, the following overall conclusions and recommendations can be drawn:
First, the findings of this study have strategic implications for Thai MSMEs—especially businesses that expect to fail within one year. Regarding financial support from the government, we found that the loan policy may be insignificant for the MSMEs. The reason for this is that the MSMEs need to better manage the debt caused by COVID-19, and this debt may be used inefficiently. Thus, the government should also provide appropriate financial plans and management for the MSMEs along with the loans. MSME owners will benefit from learning and using this loan proposal efficiently. However, we also observed that tax payment extensions and tax returns are the keys to extending these risky MSMEs’ survival time.
Second, our results revealed that participating in the government-sponsored program for customer and business adaptation is not the key to the MSMEs’ survivability during this recovery period. These results are in contrast with the findings in the literature reported during the peak of the COVID-19 crisis (e.g., [,,,]). Thus, the government-sponsored program should be revised appropriately to meet the demands of the current situation. Furthermore, a new state-sponsored program should be provided to the MSMEs—especially those in the service sector, which was slow to recover compared to other economic sectors.
Finally, it is essential to note that this study has some limitations: First, our survival data were derived from the expectations of the enterprise owners. Thus, the survival probability may not correspond to the actual insolvency of the business in the future. In other words, expectations and outcomes can be different. Second, in terms of methodology, more marginal distributions of the error terms should be considered, as they might lead to a greater estimation efficiency. Third, the post-COVID-19 period is also suggested for further investigation. Fourth, COVID-19’s impacts on health and food security in Chiang Mai should also be explored []. In a future study, we also suggest improving our copula-based survival models by considering the asymmetric copulas for joining failure and time-to-event equations, as this will provide more insight into asymmetric dependence. In addition, the Conway–Maxwell–Poisson distribution is also suggested for time-to-event equations, as it can model either under- or overdispersed data relative to the Poisson distribution [].
Author Contributions
P.M., R.P., W.P. and T.S. carried out the literature review, statistical analysis, and drafted the manuscript. R.P. and W.P. helped with the data collection, data analysis, and discussion. P.M. and R.P. made major contributions to writing the manuscript. W.Y. and P.T. prepared the computer code and estimation. All authors have read and agreed to the published version of the manuscript.
Funding
This research is supported by Fundamental Fund 2022, Chiang Mai University, Thailand. FF65/087.
Data Availability Statement
The data are available upon request.
Conflicts of Interest
The authors declare no conflict of interest.
References
- Shafi, M.; Liu, J.; Ren, W. Impact of COVID-19 Pandemic on micro, small, and medium-sized Enterprises operating in Pakistan. Res. Glob. 2020, 2, 100018. [Google Scholar] [CrossRef]
- Shen, H.; Fu, M.; Pan, H.; Yu, Z.; Chen, Y. The impact of the COVID-19 Pandemic on firm performance. Emerg. Mark. Financ. Trade 2020, 56, 2213–2230. [Google Scholar] [CrossRef]
- Leurcharusmee, S.; Yamaka, W.; Maneejuk, P.; Thaiprasert, N.; Tuntichiranon, N. Economic survival duration of Thai workers during COVID-19. Econ. Res.-Ekon. Istraživanja 2022, 1–21. [Google Scholar] [CrossRef]
- Rashid, S.; Ratten, V. Entrepreneurial ecosystems during COVID-19: The survival of small businesses using dynamic capabilities. World J. Entrep. Manag. Sustain. Dev. 2021, 17, 457–476. [Google Scholar] [CrossRef]
- Shankar, K. The impact of COVID-19 on IT services industry-expected transformations. Br. J. Manag. 2020, 31, 450. [Google Scholar] [CrossRef]
- Prasad, K.D.V.; Vaidya, R.; Anil Kumar, V. A study on causes of stress among the employees and its effect on the employee performance at the workplace in an International Agricultural Research Institute, Hyderabad, Telangana, India. Int. J. Manag. Res. Bus. Strategy 2015, 4, 68–82. [Google Scholar]
- Bartik, A.W.; Bertrand, M.; Cullen, Z.B.; Glaeser, E.L.; Luca, M.; Stanton, C.T. How Are Small Businesses Adjusting to COVID-19? Early Evidence from a Survey; No. w26989; National Bureau of Economic Research: Cambridge, MA, USA, 2020. [Google Scholar]
- Deller, S.C.; Conroy, T. Business survival rates across the urban–rural divide. Community Dev. 2017, 48, 67–85. [Google Scholar] [CrossRef]
- Chadwick, I.C.; Raver, J.L. Psychological resilience and its downstream effects for business survival in nascent entrepreneurship. Entrep. Theory Pract. 2020, 44, 233–255. [Google Scholar] [CrossRef]
- Altman, E.I. Financial ratios, discriminant analysis and the prediction of corporate bankruptcy. J. Financ. 1968, 23, 589–609. [Google Scholar] [CrossRef]
- Lane, W.R.; Looney, S.W.; Wansley, J.W. An application of the Cox proportional hazards model to bank failure. J. Bank. Financ. 1986, 10, 511–531. [Google Scholar] [CrossRef]
- Kim, M.H.Y.; Ma, S.; Zhou, Y.A. Survival prediction of distressed firms: Evidence from the Chinese special treatment firms. J. Asia Pac. Econ. 2016, 21, 418–443. [Google Scholar] [CrossRef]
- Ohlson, J.A. Financial ratios and the probabilistic prediction of bankruptcy. J. Account. Res. 1980, 18, 109–131. [Google Scholar] [CrossRef]
- Cox, D.R. Regression models and life-tables. In Breakthroughs in Statistics; Springer: New York, NY, USA, 1992; pp. 527–541. [Google Scholar]
- Gémar, G.; Moniche, L.; Morales, A.J. Survival analysis of the Spanish hotel industry. Tour. Manag. 2016, 54, 428–438. [Google Scholar] [CrossRef]
- Puttachai, W.; Yamaka, W.; Maneejuk, P.; Sriboonchitta, S. Analysis of the global economic crisis using the Cox proportional hazards model. In International Econometric Conference of Vietnam; Springer: Cham, Switzerland, 2019; pp. 863–872. [Google Scholar]
- Pelaez-Verdet, A.; Loscertales-Sanchez, P. Key Ratios for Long-Term Prediction of Hotel Financial Distress and Corporate Default: Survival Analysis for an Economic Stagnation. Sustainability 2021, 13, 1473. [Google Scholar] [CrossRef]
- Huang, X.; Zhang, N. Regression survival analysis with an assumed copula for dependent censoring: A sensitivity analysis approach. Biometrics 2008, 64, 1090–1099. [Google Scholar] [CrossRef] [PubMed]
- Nelsen, R.B. An Introduction to Copulas; Springer Series in Statistics; Springer: New York, NY, USA, 2007. [Google Scholar]
- Pastpipatkul, P.; Maneejuk, P.; Wiboonpongse, A.; Sriboonchitta, S. Seemingly unrelated regression based copula: An application on Thai rice market. In Causal Inference in Econometrics; Springer: Cham, Switzerland, 2016; pp. 437–450. [Google Scholar]
- Sriboonchitta, S.; Liu, J.; Wiboonpongse, A.; Denoeux, T. A double-copula stochastic frontier model with dependent error components and correction for sample selection. Int. J. Approx. Reason. 2017, 80, 174–184. [Google Scholar] [CrossRef]
- Smith, M.D. Modelling sample selection using Archimedean copulas. Econom. J. 2003, 6, 99–123. [Google Scholar] [CrossRef]
- Xu, J.; Ma, J.; Connors, M.H.; Brodaty, H. Proportional hazard model estimation under dependent censoring using copulas and penalized likelihood. Stat. Med. 2018, 37, 2238–2251. [Google Scholar] [CrossRef]
- Petti, D.; Eletti, A.; Marra, G.; Radice, R. Copula link-based additive models for bivariate time-to-event outcomes with general censoring scheme. Comput. Stat. Data Anal. 2022, 175, 107550. [Google Scholar] [CrossRef]
- Audretsch, D.B.; Belitski, M.; Cherkas, N. Entrepreneurial ecosystems in cities: The role of institutions. PLoS ONE 2021, 16, e0247609. [Google Scholar]
- Meyer, B.H.; Prescott, B.; Sheng, X.S. The impact of the COVID-19 Pandemic on business expectations. Int. J. Forecast. 2022, 38, 529–544. [Google Scholar] [CrossRef]
- Kuckertz, A.; Brändle, L.; Gaudig, A.; Hinderer, S.; Reyes, C.A.M.; Prochotta, A.; Steinbrink, K.M.; Berger, E.S. Startups in times of crisis–A rapid response to the COVID-19 Pandemic. J. Bus. Ventur. Insights 2020, 13, e00169. [Google Scholar] [CrossRef]
- Lungu, A.J.; Swinkels, W.; Claesen, L.; Tu, P.; Egger, J.; Chen, X. A review on the applications of virtual reality, augmented reality and mixed reality in surgical simulation: An extension to different kinds of surgery. Expert Rev. Med. Devices 2021, 18, 47–62. [Google Scholar] [CrossRef] [PubMed]
- Sarasvathy, S.D.; Kotha, S. Managing knightian uncertainty in the new economy. In E-Commerce and Entrepreneurship; IAP: Greenwich, CT, USA, 2001; Volume 1, pp. 31–62. [Google Scholar]
- Haneberg, D.H. SME managers’ learning from crisis and effectual behaviour. J. Small Bus. Enterp. Dev. 2021, 28, 873–887. [Google Scholar] [CrossRef]
- Teece, D.J.; Pisano, G.; Shuen, A. Dynamic capabilities and strategic management. Strateg. Manag. J. 1997, 18, 509–533. [Google Scholar] [CrossRef]
- Belitski, M.; Boreiko, D. Success factors of initial coin offerings. J. Technol. Transf. 2021, 47, 1690–1706. [Google Scholar] [CrossRef]
- Priyono, A.; Moin, A.; Putri, V.N.A.O. Identifying digital transformation paths in the business model of SMEs during the COVID-19 Pandemic. J. Open Innov. Technol. Mark. Complex. 2020, 6, 104. [Google Scholar] [CrossRef]
- Kim, H.K.; Lee, C.W. Relationships among healthcare digitalization, social capital, and supply chain performance in the healthcare manufacturing industry. Int. J. Environ. Res. Public Health 2021, 18, 1417. [Google Scholar] [CrossRef]
- Rattanapongpinyo, T. Determinants of survival and thriving of SMEs in the western province of Thailand. Humanit. Arts Soc. Sci. Stud. 2018, 18, 259–277. [Google Scholar]
- Wongveeravuti, S.; Rewin, A. Working Capital–SMEs Survival Kit. Exec. J. 2013, 33, 9–14. [Google Scholar]
- Ruenrom, G. Applying the philosophy of sufficiency economy in policies and marketing plans of Small and Medium Enterprises (SMEs). Chulalongkorn Bus. Rev. 2013, 135, 49–79. [Google Scholar]
- Pongsakornrungsilp, S.; Pongsakornrungsilp, P.; Kumar, V.; Maswongssa, B. The art of Survival: Tourism businesses in Thailand recovering from COVID-19 through brand management. Sustainability 2021, 13, 6690. [Google Scholar] [CrossRef]
- Pongsakornrungsilp, P.; Pongsakornrungsilp, S.; Jansom, A.; Chinchanachokchai, S. Rethinking Sustainable Tourism Management: Learning from the COVID-19 Pandemic to Co-Create Future of Krabi Tourism, Thailand. Sustainability 2022, 14, 11375. [Google Scholar] [CrossRef]
- Liu, X. Survival Analysis: Models and Applications; John Wiley & Sons: Hoboken, NJ, USA, 2012. [Google Scholar]
- Leung, S.F.; Yu, S. On the choice between sample selection and two-part models. J. Econom. 1996, 72, 197–229. [Google Scholar] [CrossRef]
- Chamberlain, G. Asymptotic efficiency in semi-parametric models with censoring. J. Econom. 1986, 32, 189–218. [Google Scholar] [CrossRef]
- Heckman, J.J. Sample selection bias as a specification error. Econom. J. Econom. Soc. 1979, 47, 153–161. [Google Scholar] [CrossRef]
- Zilko, A.A.; Kurowicka, D. Copula in a multivariate mixed discrete–continuous model. Comput. Stat. Data Anal. 2016, 103, 28–55. [Google Scholar] [CrossRef]
- Ahn, J.Y.; Fuchs, S.; Oh, R. A copula transformation in multivariate mixed discrete-continuous models. Fuzzy Sets Syst. 2021, 415, 54–75. [Google Scholar] [CrossRef]
- Williams, S.; Schaefer, A. Small and medium-sized enterprises and sustainability: Managers’ values and engagement with environmental and climate change issues. Bus. Strategy Environ. 2013, 22, 173–186. [Google Scholar] [CrossRef]
- Kaplan, E.L.; Meier, P. Nonparametric estimation from incomplete observations. J. Am. Stat. Assoc. 1958, 53, 457–481. [Google Scholar] [CrossRef]
- Dias, Á.; Silva, G.M. Willingness to stay of tourism lifestyle entrepreneurs: A configurational perspective. Sustainability 2021, 13, 13519. [Google Scholar] [CrossRef]
- Thomas, M.J.; Lal, V.; Baby, A.K.; James, A.; Raj, A.K. Can technological advancements help to alleviate COVID-19 Pandemic? a review. J. Biomed. Inform. 2021, 117, 103787. [Google Scholar] [CrossRef]
- Ryan, R.M.; Deci, E.L. Self-determination theory and the facilitation of intrinsic motivation, social development, and well-being. Am. Psychol. 2000, 55, 68. [Google Scholar] [CrossRef]
- Liu, Y.; Dilanchiev, A.; Xu, K.; Hajiyeva, A.M. Financing SMEs and business development as new post COVID-19 economic recovery determinants. Econ. Anal. Policy 2022, 76, 554–567. [Google Scholar] [CrossRef]
- Leurcharusmee, S.; Maneejuk, P.; Yamaka, W.; Thaiprasert, N.; Tuntichiranon, N. Survival Analysis Of Thai Micro And Small Enterprises During The COVID-19 Pandemic. J. Bus. Econ. Manag. 2022, 23, 1211–1233. [Google Scholar] [CrossRef]
- He, Y. Home Production: Does It Matter for the Korean Macroeconomy during the COVID-19 Pandemic? Mathematics 2022, 10, 2029. [Google Scholar] [CrossRef]
- Kovács, S.; Rabbi, M.F.; Máté, D. Global Food Security, Economic and Health Risk Assessment of the COVID-19 Epidemic. Mathematics 2021, 9, 2398. [Google Scholar] [CrossRef]
- Conway, R.W.; Maxwell, W.L. A queuing model with state dependent service rates. J. Ind. Eng. 1962, 12, 132–136. [Google Scholar]
Disclaimer/Publisher’s Note: The statements, opinions and data contained in all publications are solely those of the individual author(s) and contributor(s) and not of MDPI and/or the editor(s). MDPI and/or the editor(s) disclaim responsibility for any injury to people or property resulting from any ideas, methods, instructions or products referred to in the content. |
© 2023 by the authors. Licensee MDPI, Basel, Switzerland. This article is an open access article distributed under the terms and conditions of the Creative Commons Attribution (CC BY) license (https://creativecommons.org/licenses/by/4.0/).