Article

Mixed Convection in a Horizontal Channel–Cavity Arrangement with Different Heat Source Locations

by
Farhan Lafta Rashid
1,†,
Asseel M. Rasheed Al-Gaheeshi
2,
Mohammed Alhwayzee
1,
Bagh Ali
3,
Nehad Ali Shah
4,*,† and
Jae Dong Chung
4
1
Department of Petroleum Engineering, College of Engineering, University of Kerbala, Karbala 56001, Iraq
2
Department of Electrical and Electronic Engineering, College of Engineering, University of Kerbala, Karbala 56001, Iraq
3
Department of Applied Mathematics, Northwestern Polytechnical University, Xi’an 710129, China
4
Department of Mechanical Engineering, Sejong University, Seoul 05006, Republic of Korea
*
Author to whom correspondence should be addressed.
These authors contributed equally to this work and are co-first authors.
Mathematics 2023, 11(6), 1428; https://doi.org/10.3390/math11061428
Submission received: 17 February 2023 / Revised: 7 March 2023 / Accepted: 13 March 2023 / Published: 15 March 2023
(This article belongs to the Special Issue Advances in Computational Fluid Dynamics with Applications)

Abstract

:
Several researchers are very interested in mixed convection heat transfer because of how widely it is used, particularly for solar thermal collectors, cooling electronic equipment, and chemical process instruments. Using COMSOL-Multiphysics, this article establishes laminar coupled mixed convection heat transfer characteristics across a horizontal channel–cavity architecture. Investigations are conducted into the effect of heat source location on isotherms, velocity distribution, pressure, temperature, average and local Nusselt numbers, and air density. The intake airflow Reynolds number is assumed constant on 2.8814. The enclosure with an isothermally heated right wall in the shape of a “<” as a heat source in three configurations (heat source in the base (1st case), in the upper step (2nd case), and the below step (3rd case). The obtained numerical results present that the higher heat transfer is performed in case two because the heat source is near the contact surface between the channel and the cavity. With the hot sources’ locations being altered, the velocity distribution seems to be unchanged. The increase in the positive y axis has no impact on the pressure distribution throughout the channel. Changing the position of the heated source does not seem to have any impact on the pressure distribution. Air density profiles start to diverge across cases around y = 0.035 m; the third example has a larger value than the second case, and the latter case has a larger value in the density distribution than the former. The contact between the enclosure and the channel (y = 0), where the greatest Nusselt number also occurs, exhibits the highest heat transfer. The maximal Nusselt number falls as y’s absolute value rises.

1. Introduction

Heat transfer is essential in many industries in the world. Even while it may manifest in a variety of ways (convection, conduction, and radiation), radiation is more explicitly targeted in a number of clearly defined circumstances, such as industrial processes and cooling electronic equipment [1,2,3,4,5,6,7]. Convection may happen in three ways in heat transfer flows: naturally, forcibly, and mixed. The last of these has uses in various commercial and natural processes, including cooling nuclear reactors and electronic systems, heating or cooling fluids in heat exchangers, compact heat exchangers, and the food sector [8,9,10]. Mixed convection, which happens when natural convection and forced convection processes work together to transfer heat, is a term used in fluid thermodynamics to describe this situation. Instances in which buoyant and pressure forces interplay are also referred to as this [11].
There are several applications of the mixed convection issue with lid driven flows inside an enclosure in engineering and research, incorporating heat transfer and flow in solar ponds [12], lake dynamics [13], nuclear reactor thermal hydraulics [14], and the manufacturing of float glass [15]. A common benchmark example for assessing numerical solution techniques is the lid driven cavity issue [16,17].
In a horizontal channel linked with composite open cavity, Al-Hassan and Ismael [18] examined the numerical modelling of heat and mass exchange. The lowest portion of the open cavity is formed by a porous layer. The temperature and concentration of one of the cavity’s vertical sidewalls are both maintained constants. Thermal insulation is used on the other hollow and channel walls. The opposite situation gives the most convective heat transfer, with 53.07 and 90.18% Nusselt number increases for Re = 50 and 250 for Ri = 0.01 and 36.30 and 17.81% for Ri = 100.
Researchers Esfe and colleagues [19] showed that Al2O3/water nanofluids travel in a flow of laminar mixed convection along a horizontal tube equipped with two heated barriers on the bottom. The governing equations are solved numerically with the help of the SIMPLER and finite volume techniques. The investigation makes use of three thermophysical models, each of which incorporates temperature-dependent as well as temperature-independent interactions. The findings are presented for a wide variety of critical issue factors, including the nanoparticle volume per cent, Rayleigh number, and Richardson number. In addition to this, research is performed to determine how the mean Nusselt number is affected by the different aspect ratios of the obstacles. The findings indicate that there was a variation of no more than three percent on average in the average Nusselt values that were produced by the three different sets of thermophysical models.
Rahul [20] presented a numerical analysis that makes use of FLUENT to model the transfer of heat from the surface and mixed convection in a channel that contains heated barriers. In order to draw significant theoretical and practical conclusions, this research studied the impacts of obstacle height, breadth, spacing, number, and Reynolds number. A chip with effective heat transfer properties might be designed using the study’s findings for industrial electronics and electrical systems.
Energy transmission, as well as both natural and artificial convection, was investigated by Sivasankaran and Janagi [21] in an open cavity. A finite-length adiabatic baffle is fastened to the top wall. Heating is provided in a sinusoidal pattern to the bottom horizontal wall of the open cavity. The remaining channel cavity regions are handled as adiabatic. The control volume approach is used in order to find solutions to the governing equations for a wide range of significant factor values. Calculations are made to determine the average Nusselt number, bulk temperature, and drag force. Recirculating eddies next to the baffle are known to weaken or vanish as the channel’s or cavity’s inclination angle is raised. The average thermal energy transportation increases for all baffle inclination degrees and lengths after progressively decreasing until Ri = 1.
A numerical investigation of mixed convection in a horizontal channel with an open trapezoidal enclosure that was exposed to a discrete heat source in various locations was carried out by Oudina et al. [22]. This work was carried out by Oudina et al. The heat source temperature, which has a length of = 0.75, is kept constant. The channel is continuously filled with a horizontal stream of cold air moving at a constant speed. The enclosure’s other walls, as well as the canal, are adiabatic. For Prandtl number (Pr = 0.71), various heat source locations and Reynolds number (Re = 100) velocity, isotherm, and Nusselt numbers are supplied. The Heat source position greatly affects isotherm distribution.
In a horizontally vented chamber that was heated from below and had a thin adiabatic barrier on the heated surface, Bahlaoui et al. [23] demonstrated a mixture of convection and surface radiation. The cooling fluid is thought to be air, a radiatively transparent medium. The connection that exists between the regulating parameters of the fluid flow and heat transfer characteristics—the wall emissivity, 0 ≤ ε ≤ 1, the Reynolds number; 5000 ≥ Re ≥ 200; and the baffle relative height, 0 ≤ Hb ≤ 0.75—was thoroughly investigated. In connection to the regulating parameters, the maximum, mean, and QE/QL heat amounts that leave the cavity via the exit and the left vertical cold side are displayed.
Rajamohan et al. [24] looked at how surface radiation and mixed convection heat transfer affect thermally expanding laminar airflow in an isothermally heated horizontal channel with adiabatic walls at the top and bottom. The isothermal wall that is heated from the side has a heater built in, and the wall on the other side serves as a source of steady heat. The findings show and illustrate the surface temperature distribution along the channel’s walls and the rate of convection heat transfer. The flowing smoke at the bottom of the entry part depicts the flow structure of the channel within. According to quantitative and qualitative statistics, the square channel’s total heat transmission improved due to wall emissivity and other thermal and geometric properties.
In order to investigate the hydrodynamic and thermal features of mixed convection, Gangawane and Gupta [25] positioned a heated elliptical block in the center of a rectangular container with one movable wall of the container’s vertical compartment. Using the finite volume method (FVM) and the SIMPLE numerical approach, the influence of a number of flow-related parameters, such as the direction of a moving vertical wall (either in positive or negative y coordinate directions), the aspect ratio of an elliptical cylinder (Er = 0.5, 1, and 2), and a wide range of dimensionless parameters (Reynolds number: 5000 ≥ Re ≥ 1; Prandtl number: 100 ≥ Pr ≥ 1), was investigated.
Ding et al. [26] carried out a computer investigation of the heat transfer that occurs during vertical upward flow in an ocean environment. Their research took into account both mixed and free convection. The experimental results were utilized to establish the turbulent heat transfer in a smooth circular tube at low flow rates and the influence of ocean conditions. With the help of the v2-f turbulence model and some additional inertial force, a CFD method was built. According to the study, heat transfer was influenced by the buoyancy parameter and ocean conditions. In oceanic circumstances, the Coriolis force and gravity predominate over free convection and mixed heat transfer, making the impact of rolling radius minimal. Because of the inclination effects, the heat transfer variance grows as the rolling time grows. Nevertheless, the heat transfer behavior was non-monotonic, making it difficult to predict as the rolling amplitude increases. This was due to the combined influence of Coriolis forces and buoyancy effects.
Everts et al. [27] used computational and experimental approaches to investigate the thermal and hydrodynamic properties of a developing mixed convective laminar flow in a long horizontal tube. Their research focused on the features of the flow. The tube measured 11.52 mm in diameter on the inside, had a total length of 9.5 m, and was heated at a variety of constant heat fluxes. In order to do numerical simulations with an extremely well-organized mesh and exact temperature-dependent thermophysical properties for water, the software ANSYS-Fluent 19.3 was used. The experimental and numerical results showed that the local mixed convective Nusselt numbers dropped near to the tube entry, but, beyond that, they rose the remainder of the way as secondary flow significantly increased. In addition, there was an increase in the secondary flow, which resulted in a decrease in the thermal entrance length but an increase in the hydrodynamic entry length.
Zhang et al. [28] constructed a three-dimensional numerical model of a large-scale closed cavity using the finite volume approach. Their goal was to investigate the mixed convection heat transfer and turbulent flow of an internal high-pressure gas using this model. The model included two spinning blades and a reactor. It was decided that the medium for heat transfer would be a compressible gas with a wide variety of thermophysical properties, and the numerical model was solved by using an unstable Reynolds-averaged Navier–Stokes equation set (URANS). According to the results, if P and Th remain the same, then a change in Re will always have an effect on the transient flow and heat transfer process that occurs within the enclosure and the reactor. Both the turbulent flow and the heat transmission are enhanced whenever the Re value increased. With the value of Re = 900,000, there was a greater influence of forced convection inside the reactor.
Moradi et al. [29] used computational fluid dynamics to examine how different cavity shapes as flame holders affected the scramjet’s mixing effectiveness. In order to evaluate the relative merits of different cavity flame holder configurations, it was necessary to first solve the Reynolds-averaged Navier–Stokes equations using the SST turbulence model. This revealed the effect of significant parameters. According to their research, the trapezoidal cavity preserved the igniting zone inside the cavity more effectively than other designs. Additionally, when the free stream Mach number increases, the cavity’s major circulations grow more vigorous, which, ultimately, results in the formation of a stable igniting zone.
Yaseen and Ismael [30] were able to effectively model fluid–structure interaction (FSI) and coupled convective heat exchange in an open trapezoidal cavity–channel. In the laminar area, a non-Newtonian (power law) fluid was examined. An isothermal hot hollow bottom wall simulated the heat source, and all other solid walls were completely insulated. The outcomes were contrasted with those of the unbaffled channel. The findings of the investigation showed that the heat transfer efficiency of the baffled channel that was recommended was greatly improved.
To recover data and extend the non-Gaussian non-stationary wind pressure, Li and Li [31] developed a hybrid prediction model by using the improved empirical wavelet transform (IEWT), particle swarm optimization (PSO), and least squares support vector machines (LSSVM) (complex signal). The IEWT was originally suggested in this paradigm to deconstruct the signals and remove their noise components. The final findings show that IEWT can significantly improve the forecasting accuracy of complicated signals while successfully reducing noise interference.
In Pulsating Heat Pipes, the idea of dominant frequency was addressed and analytically defined by Perna et al. [32]. In a full-scale Pulsating Heat Pipe experiment conducted in microgravity, the wavelet transform was used to do an analysis of the fluid pressure data in the frequency domain while simultaneously modifying the heat power input at the evaporator and the condenser zone. The slug-plug flow regime had dominant frequencies that range between 0.6 and 0.9 Hz, and these frequencies had a tendency to increase when the heat load is applied. The computed instantaneous angle of phase, which ranged from 310 to 360 degrees, is the result.
After the brief summary presented above, the purpose of this article is to demonstrate how the COMSOL-Multiphysics tool may be used to simulate the mixed convective heat transfer that occurs in a channel-open cavity that has many heat source sites. In this document, the influence that the locations of heat sources have on isotherms, velocity distributions, pressure distributions, temperatures, local and average Nusselt numbers, and air densities is explored. The enclosure with a heat source consisting of an isothermally heated right wall in the < shape of a in three different configurations (the heat source being located in the base (in the first case), in the upper step (in the second case), and in the below step (in the third case) of the square enclosure).

2. Problem Formulation and Numerical Approach

Figure 1 shows the physical system’s schematic diagram of channel-open enclosure assembly with different heat source locations. The enclosure with an isothermally heated right wall in the shape of a “<” as a heat source in three configurations (heat source in the base (first case), in the upper step (second case), and in the below step (third case) of the square enclosure’s right wall in the shape of a “<”). The cavity has a dimension of 0.1 m width and 0.07 m height. The channel has a diameter of 0.12 m. It is expected that the channel extends 0.6 m beyond the depression in its free length. The radius of the heat source is 0.02 m. The power output is kept constant at 20 Watts each. Airflow with the temperature of the surrounding environment (20 °C) enters the horizontal channel from the left. Table 1 presents all required values in the case study.

2.1. The Governing Equations

Because of these presumptions, the dimensionless governing equations for the conservation of mass, momentum, and energy are as follows [33,34,35]:
The parameters of the dimensionless figure may be expressed as follows:
θ = T T c T h T c ,   U = u u i n ,   V = v u i n ,   X = x H ,   Y = y H ,   P = P ρ u i n 2 ,  
where H is the length of the cavity. ε = L H H , where LH is the length of the heated source.
The equation of continuity:
U X + V Y = 0
The following are the equations that describe the principle of momentum conservation in the X-direction:
U U X + V U Y = P X + 1 R e i n 2 U X 2 + 2 U Y 2
Thus, for the Y direction:
U V X + V V Y = P Y + 1 R e i n 2 V X 2 + 2 V Y 2 + R i θ
The conservation of energy can be written as:
U θ X + V θ Y = 1 R e i n P r 2 θ X 2 + 2 θ Y 2
where [36]:
R e i n = ρ u i n H μ is the Reynolds number, where H is the length of the enclosure.
The Richardson number (Ri) can be written as: R i = G r R e i n 2 = g H β T h T c u i n 2
The Prandtl number may be presented as P r = v α
The boundary conditions for the previously described Equations (1)–(4), which may be found in [37], are as follows:
(i).
U = Ui = ±1 and V = 0 at the intake (going either right or left).
(ii).
θ = 0 at the inlet and cold wall; θ = 1 at the hot wall.
(iii).
Under outlet constant pressure, P = 0.
(iv).
U = V= 0 at all walls.

Nusselt Number

The typical Nusselt values for the hot wall are [38,39]:
N a v g = 1 ε 0 ε θ X d Y
with ε, which is the active wall’s or heater’s non-dimensional length.
ε = H L L = 0.4

2.2. Procedures for Simulation and Numerical Testing [40]

There are a number of activities that must be completed and confirmed before the numerical simulation of the present research can be conducted. When trying to summarize these concepts, you should concentrate on these two key elements:
(1)
To reduce the amount of inaccuracy present in the numerical findings, two techniques may be used: establishing the grids and doing an examination of the density of each individual grid component.
(2)
Assessing the accuracy of the findings produced by the numerical model.
Using COMSOL-Multiphysics, the resulting mathematical models are numerically assessed. In this case, a grid with a size of 161 × 161 was used for all computations. The numerical simulations come to an end when they attain order 10−6 convergence.

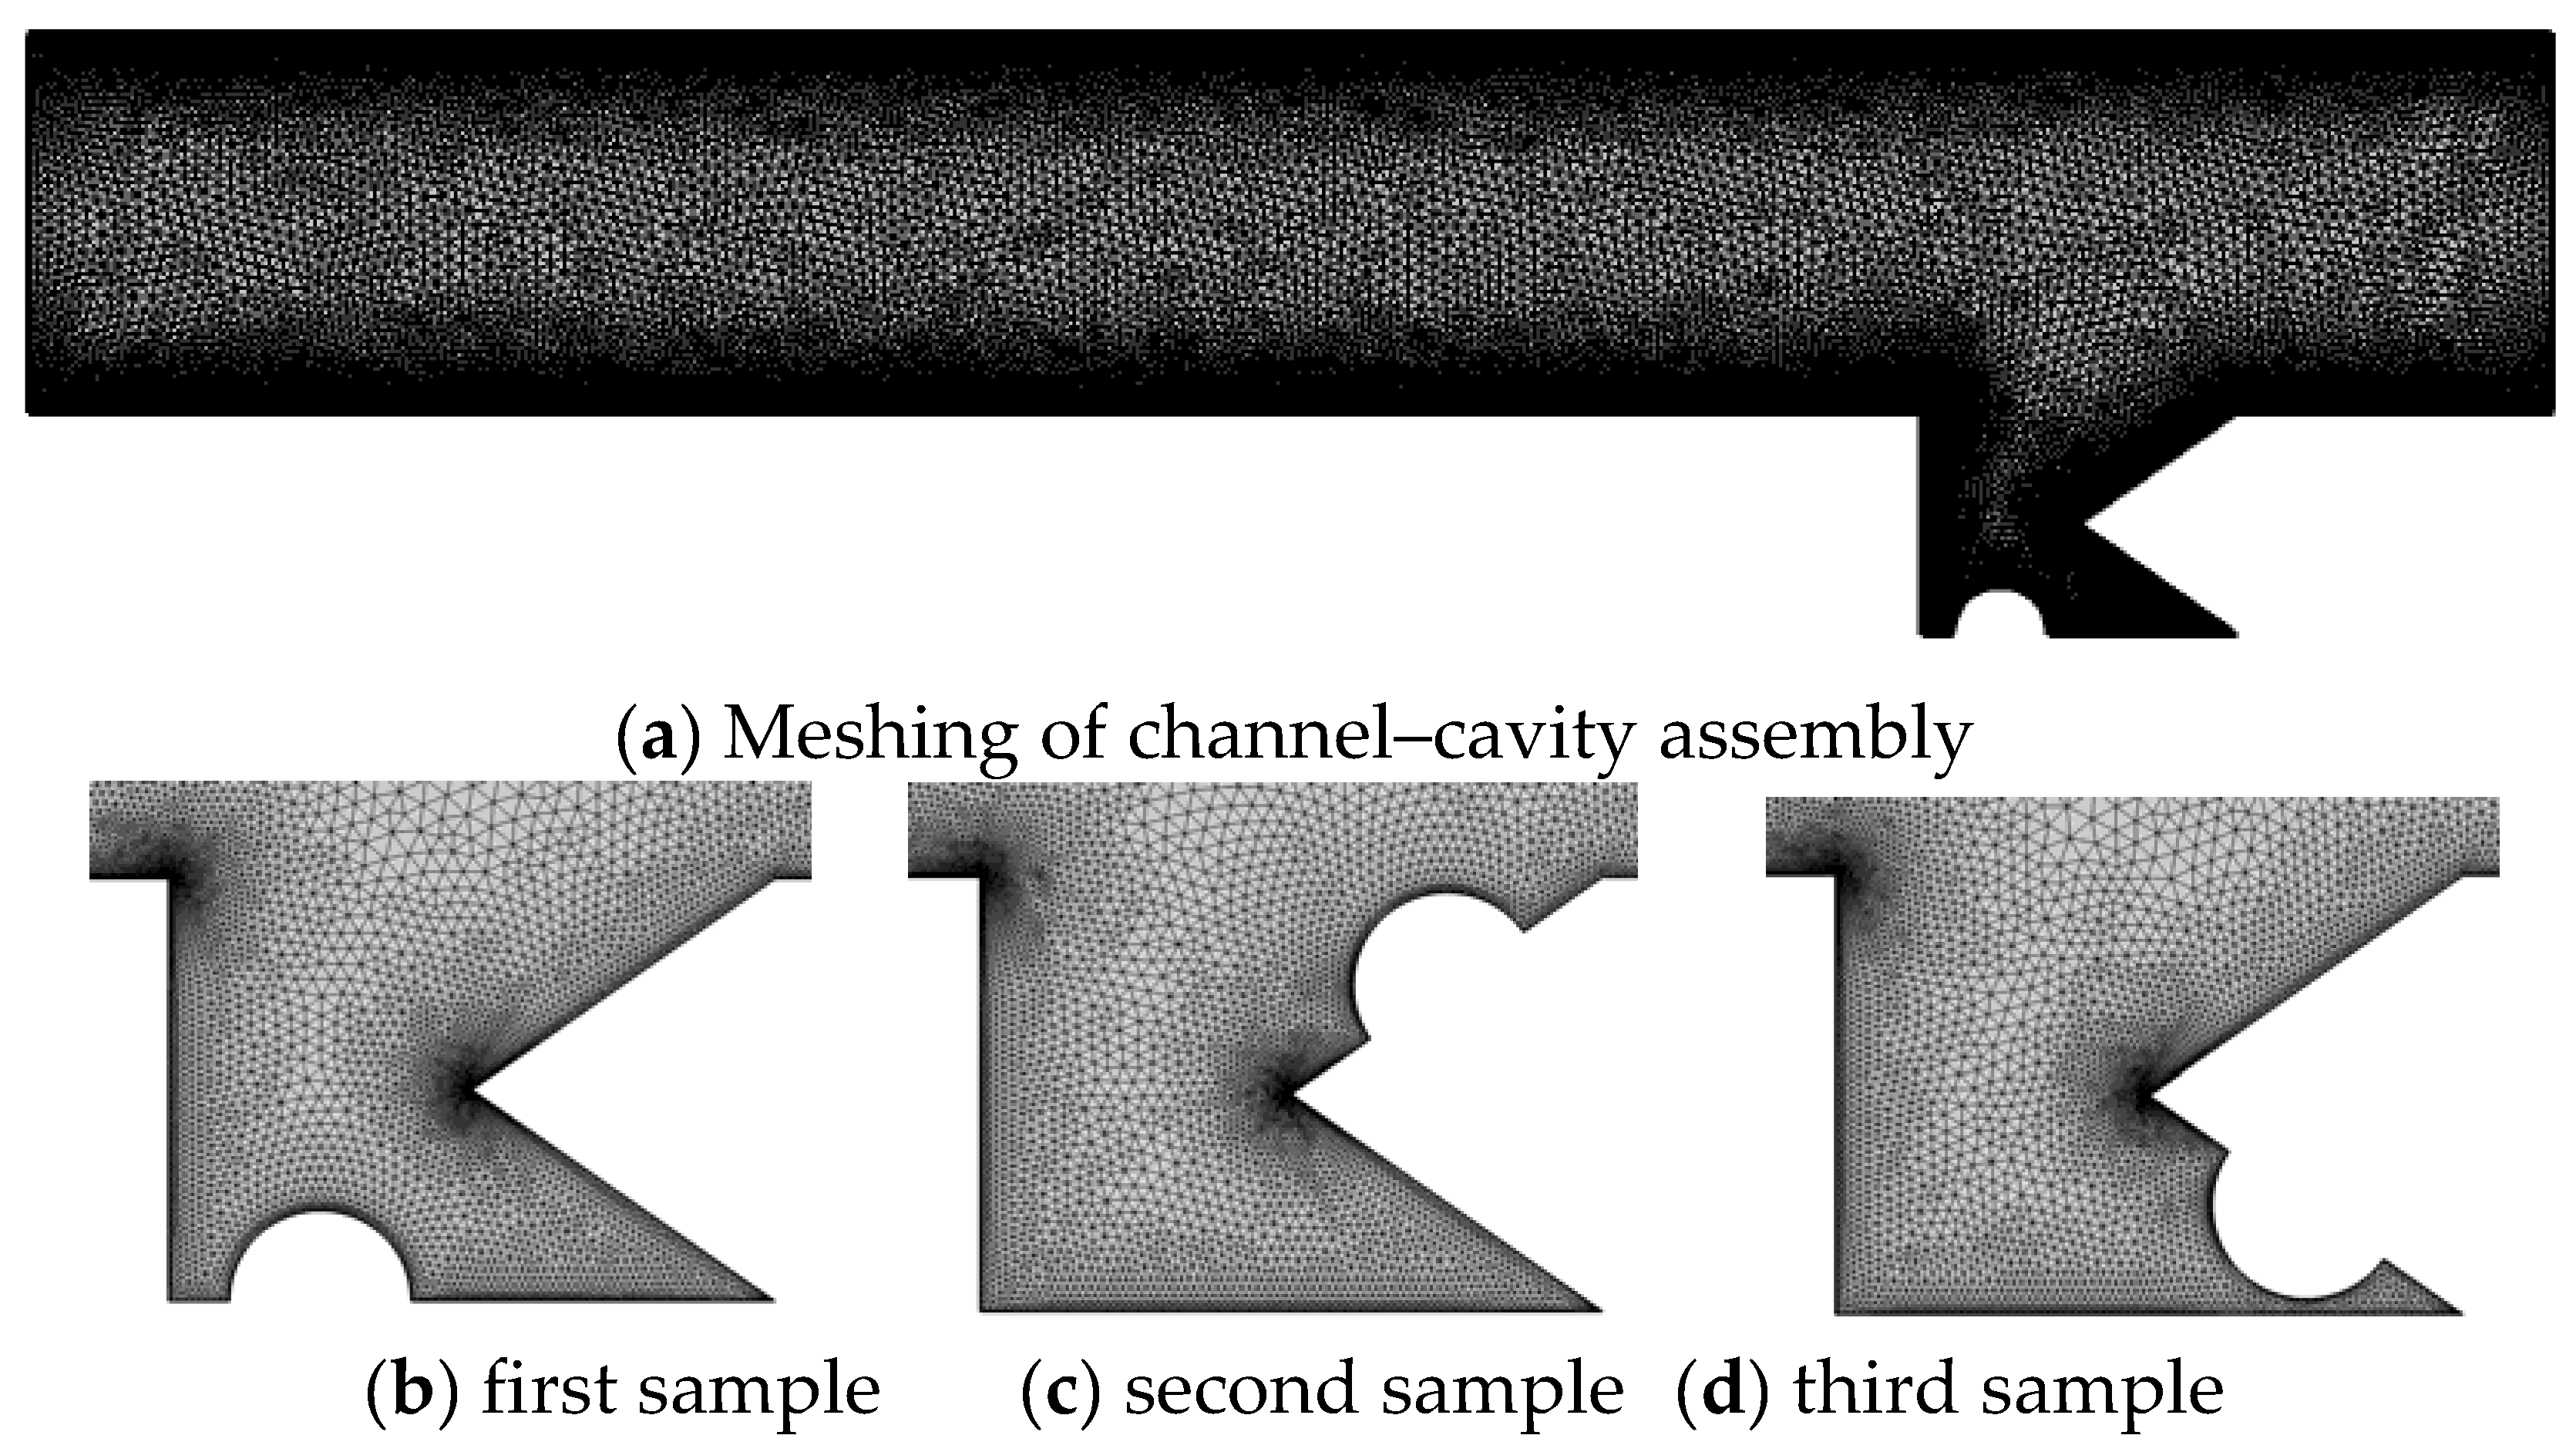
2.3. Grid Independency Test

Figure 2 displays the grid’s structure in its final form. In each instance, the ratio value was utilized to calculate the component densities. The outcomes of this investigation are shown in Table 2. It is conceivable to achieve the conclusion that the number of components in scenario 3 is enough to deliver the required degree of fulfilment since it is possible to reach this conclusion. This particular procedure is known as the grid independence test.

3. Results and Discussion

Figure 3 presents the isotherm contours of three cases (heat source in the base (1st case), in the upper step (2nd case), and in the below step (3rd case) of the square enclosure’s right wall in the shape of a “<”) the heat source of 20 W, and the air entering at a constant flow Reynolds number of 2.8814 (0.1 m/s). In general, three basic types of heat transfer may be seen. Because of the slow flow, the channel experiences forced convection, the bottom of the cavity experiences diffusion, and the channel and cavity contact zone experiences mixed convection. The bulk of the cavity’s heat removal process is driven by heat diffusion because of the cavity’s relatively low velocity and the heat source’s tiny size. To put it into perspective, forced convection dominates the heat removal process in the channel area because of the comparatively high velocities. However, the contours at the cavity rest and the channel present that the bulk of heat transferred is mediated by convection. The zone of diffusive transfer of heat is confined within the proximity cavity of the heat source. Furthermore, it is evident that the temperature decreases progressively as one approaches closer to the horizontal channel and far from the source of heat. The boundary condition for the problem is consistent with this finding. From these three cases, one can observe that the higher heat transfer is performed in case two because the heat source is near the contact surface between the channel and the cavity.
With a 20 W heat source, Figure 4 shows three temperature distribution contours for the three cases; the input air velocity is constant at 0.1 m/s (Reynolds number = 2.8814). These results clearly demonstrate that the flow of the air stream causes a visible change in the flow and temperature field inside the cavity and channel. When there is a temperature difference between the heat source and the channel passage, forced and natural convections occur. Natural convection is brought on by a temperature differential, while forced convection is brought on by air flowing upward through the cavity. The forced convection produced by the heated sources will be larger when the faster air enters the cavity. Consequently, there will be more hot and cold air mixing, which will lead to a more uniform temperature distribution within the hollow. In this Figure, the second case seems to have a more temperature distribution than the other cases because the heat source, in this case, is near the contact interface between the channel and enclosure.
Figure 5 displays three velocity contours for the three cases, and the input air velocity is constant at 0.1 m/s (Reynolds number = 2.8814). Due to two heating sources, a zone in which the air is recirculating fills the cavity. This zone exists as a direct result of the source of heat being there. The buoyancy force causes a recirculating component in the cavity to move air to the left toward the insulated wall of the hollow enclosure. The channel zone, however, may observe a normal laminar velocity profile with ultimate velocity in the channel center and zero at the walls owing to no-slip circumstances. The contact between the top of the cavity and the channel shows a unique zone. The weakly recirculating portion of this area’s enclosure alters the channel’s low-velocity profile. From this Figure, the velocity distribution seems unaffected by changing the location of heated sources because the changing of the heat source location occurs within the cavity and far from the effect of air stream passage.
Figure 6 shows the pressure streamline contours for the three cases and clearly shows the recirculating zones. This graphic shows how the recirculating streamlines zone is growing as changing the location of heated sources. The first and third cases have the same pressure distribution, while the second case causes more recirculating streamlines than the other cases because the air stream impinges with the heat source and thus increases the recirculation of the air stream at this zone.
At a constant flow Reynolds number of 2.8814 (0.1 m/s) and a constant heat source power of 20 W, the velocity distribution during positive y axis in channel flow for the three cases is shown in Figure 7. The velocity increases as the distance from the lower wall’s surface increases because less friction will be exerted on the walls. It has an impact on the channel’s laminar velocity profile when the region of the cavity with poor recirculation is located in close proximity to the interface zone. It can be seen that all three scenarios have the same velocity distribution by looking at these figures.
Figure 8 depicts the pressure distribution for the three cases along the positive y axis in a channel–enclosure assembly flow with a 20 W heat source with a constant flow Reynolds number of 2.8814 (0.1 m/s). It is clear that the pressure is higher at the channel’s intake, decreases gradually as it travels, and varies at the point where the channel and cavity meet. Except for the contact zone between the channel and cavity, where there is a weak region impacted by the incoming pressure from the channel, the pressure distribution along the channel is unaffected by the rise in the positive y axis. Changing the position of the heated source does not seem to have any effect on the distribution of the pressure.
At a constant flow Reynolds number of 2.8814 (0.1 m/s), Figure 9 illustrates the temperature distribution along the positive y axis in the channel–enclosure assembly. The heat source power was held constant at 20 W, and the heated sources were located in three separate places. These figures demonstrate how the location of heat sources has an impact on temperature distribution, which is at a minimum along the channel and elevated across the area where the channel and cavity come into contact. The stream of airflow causes mixing between the hot and cold air, which will enhance the distribution in temperature within the cavity and reduce the temperature at the channel-to-cavity contact. From these figures, the first case seems to have a larger temperature distribution than the other cases because the heat source is far from the airflow stream (at the enclosure bottom).
At a constant flow Reynolds number of 2.8814 (0.1 m/s) for three locations of heated sources of 20 W each, Figure 10 shows the velocity distribution during the negative y axis in the enclosure. Increases in absolute y direction result in a drop in the velocity distribution since they represent forwarding into the bottom of the cavity or the lowest airflow velocity but increases in input air velocity increase the velocity dispersion. The changing of the heated source location does not affect the velocity distribution, because the changing of heat source location occurs within the cavity and far from the effect of air stream passage.
Figure 11 depicts the pressure distribution of the three cases along the negative y axis in the enclosure at a constant flow Reynolds number of 2.8814 (0.1 m/s) and a constant heat source power of 20 W each. The pressure is a vacuum at the left side of the enclosure, then abruptly increases and then decreases at the right-hand side because of the recirculation effect generated through the enclosure. The second case differs from the other two cases in the pressure distribution because the heated source is near the contact surface between the channel and the enclosure, which impinges on the airflow stream.
Figure 12 shows the temperature distribution of the three cases in the enclosure during a negative y axis at a constant input air velocity of 0.1 m/s (Reynolds number = 2.8814) with constant heat source power of 20 W each. The temperature distribution will rise as the absolute y axis value increases. The airflow stream at the air entrance will enhance the natural convection produced by the heated source, or the mixing of hot and cold air, reducing the distribution of temperature within the cavity and lowering the temperature along the negative y axis. Since the heat source in the second scenario is placed close to the air flow stream, this scenario is appropriate; as a result, there will be improved mixing between the hot air that is surrounding the source and the cold air that is coming from the air stream.
The distribution of the Nusselt number locally inside the enclosure is seen in Figure 13. The input velocity of air is constant at 0.1 m/s (Reynolds number = 2.8814) with a constant 20 W heat source located at different locations. The highest heat transmission occurs at the interface between the enclosure and the channel (y = 0), where the maximum Nusselt number also occurs. As y increased, the maximum Nusselt number decreases. Because the heat source is located near the interface between the enclosure and the air flow stream in the second scenario, there is a greater chance of mixing between the hot and cold air. This, in turn, results in an increase in both the heat transfer and the Nusselt number. The best-case scenario for heat transfer is the second scenario.
Local velocity distribution in the channel–enclosure assembly is shown in Figure 14 with constant heat source power of 20 W each (in three locations) and at a constant flow Reynolds number of 2.8814 (0.1 m/s). The local velocity distribution was greatest at the channel inlet and abruptly failed due to the effect of shear stress caused by the channel wall. It then increased and fluctuated at the interface’s midpoint before being reduced to a minimum value due to the effect of air recirculation at the enclosure’s end. The three cases have the same local velocity distribution, except at the first half of the enclosure, where the first case has a larger local velocity than the third case, and the second case has the lowest local velocity.
The distribution of the local pressure is seen in Figure 15 for the channel–enclosure assembly for a 20 W constant heat source (in three locations) and constant input flow Reynolds number of 2.8814 (0.1 m/s). The maximum value of the pressure distribution is at the channel’s inlet and slightly decreases over the following distance. The three cases have the same local pressure distribution, except at the first half of the enclosure, where the first case has larger local pressure than the third case, and the second case has the lowest local pressure distribution.
With constant heat source power of 20 W each (in three locations), Figure 16 depicts the local temperature distribution in the channel–enclosure assembly at a constant input flow Reynolds number of 2.8814 (0.1 m/s). The distance that separates the channel and the enclosure has no impact on the temperature and keeps it at a low and stable level over the whole distance. This is because there is no influence from a heat source. On the other hand, the existence of a heat source brings about a discernible temperature difference over the whole of the contact region. The three cases have the same local temperature distribution, except at the first half of the enclosure, where the first case has a larger local temperature than the third case, and the second case has the lowest local temperature distribution.
The average Nusselt number change with distance is shown in Figure 17 for a constant input flow Reynolds number of 2.8814 (0.1 m/s), a constant heat source power of 20 W each is located in three different positions in the enclosure, and a value of ε = 0.4. Because there is a heat source in this zone, the temperature difference between the hot air and the cold air will increase, which will ultimately lead to an increase in the driving force for heat transfer, which is referred to as an increase in the Nusselt number. The value of the Nusselt number is at its highest point at the channel inlet, then it abruptly decreases through the distance before the enclosure, and then it abruptly increases once it is inside the enclosure ε .
The air velocity profile in the outlet channel passage flow is shown in Figure 18. The inlet air speed is constant at 0.1 m/s (Reynolds number = 2.8814), and the constant heat source power of 20 W is located at different zones in the enclosure. Due to the effect of shear stress at the wall, the velocity profile seems to be at its lowest position at the channel wall, while reaching its maximum peak in the channel center. This is the case because the channel wall is the location where the shear stress is greatest. This is due to the fact that the influence of shear stress at the wall is nullified as one reaches the middle of the channel. The three cases have the same velocity profile.
The temperature profile in the outlet channel passage flow can be shown in Figure 19, which was created using a constant input flow Reynolds number of 2.8814 (0.1 m/s) and a constant heat source power of 20 W, each located at different locations in the enclosure. The rise in temperature distribution that will occur as a consequence of the decrease in the y direction will occur. This is as a result of the fact that moving upward in the y direction allows one to move farther away from the influence of the heat source, which, in turn, results in a temperature distribution that is as uniform as possible. At y = 0.035 m, the temperature profile begins to differ from one case to the other, the first case has a larger value than the second, and the latter has the largest value in temperature distribution than in the third case.
The air density profile in the outlet channel passage flow at a constant input flow Reynolds number of 2.8814 (0.1 m/s) and a constant heat source power of 20 W located at different locations in the enclosure is shown in Figure 20. Because moving away from the source of heat causes an increase in the y directions, an increase in the y value causes an increase in the air density. At y = 0.035 m, the air density profile begins to differ from one case to other, the third case has the largest value than the second, and the latter has the largest value in density distribution than the first case.

4. Conclusions

An open cavity that was linked to a rectangular channel was the focus of the inquiry that was performed numerically into steady mixed convection. The influence of the heat source position on the isotherms, velocity distribution, pressure, temperature, local and average Nusselt numbers, and air density was simulated using COMSOL-Multiphysics. The enclosure with an isothermally heated right wall in the shape of a “<” was a heat source in three configurations (heat source in the base (1st case), in the upper step (2nd case), and in the below step (third case). According to the findings, the following conclusions may be drawn:
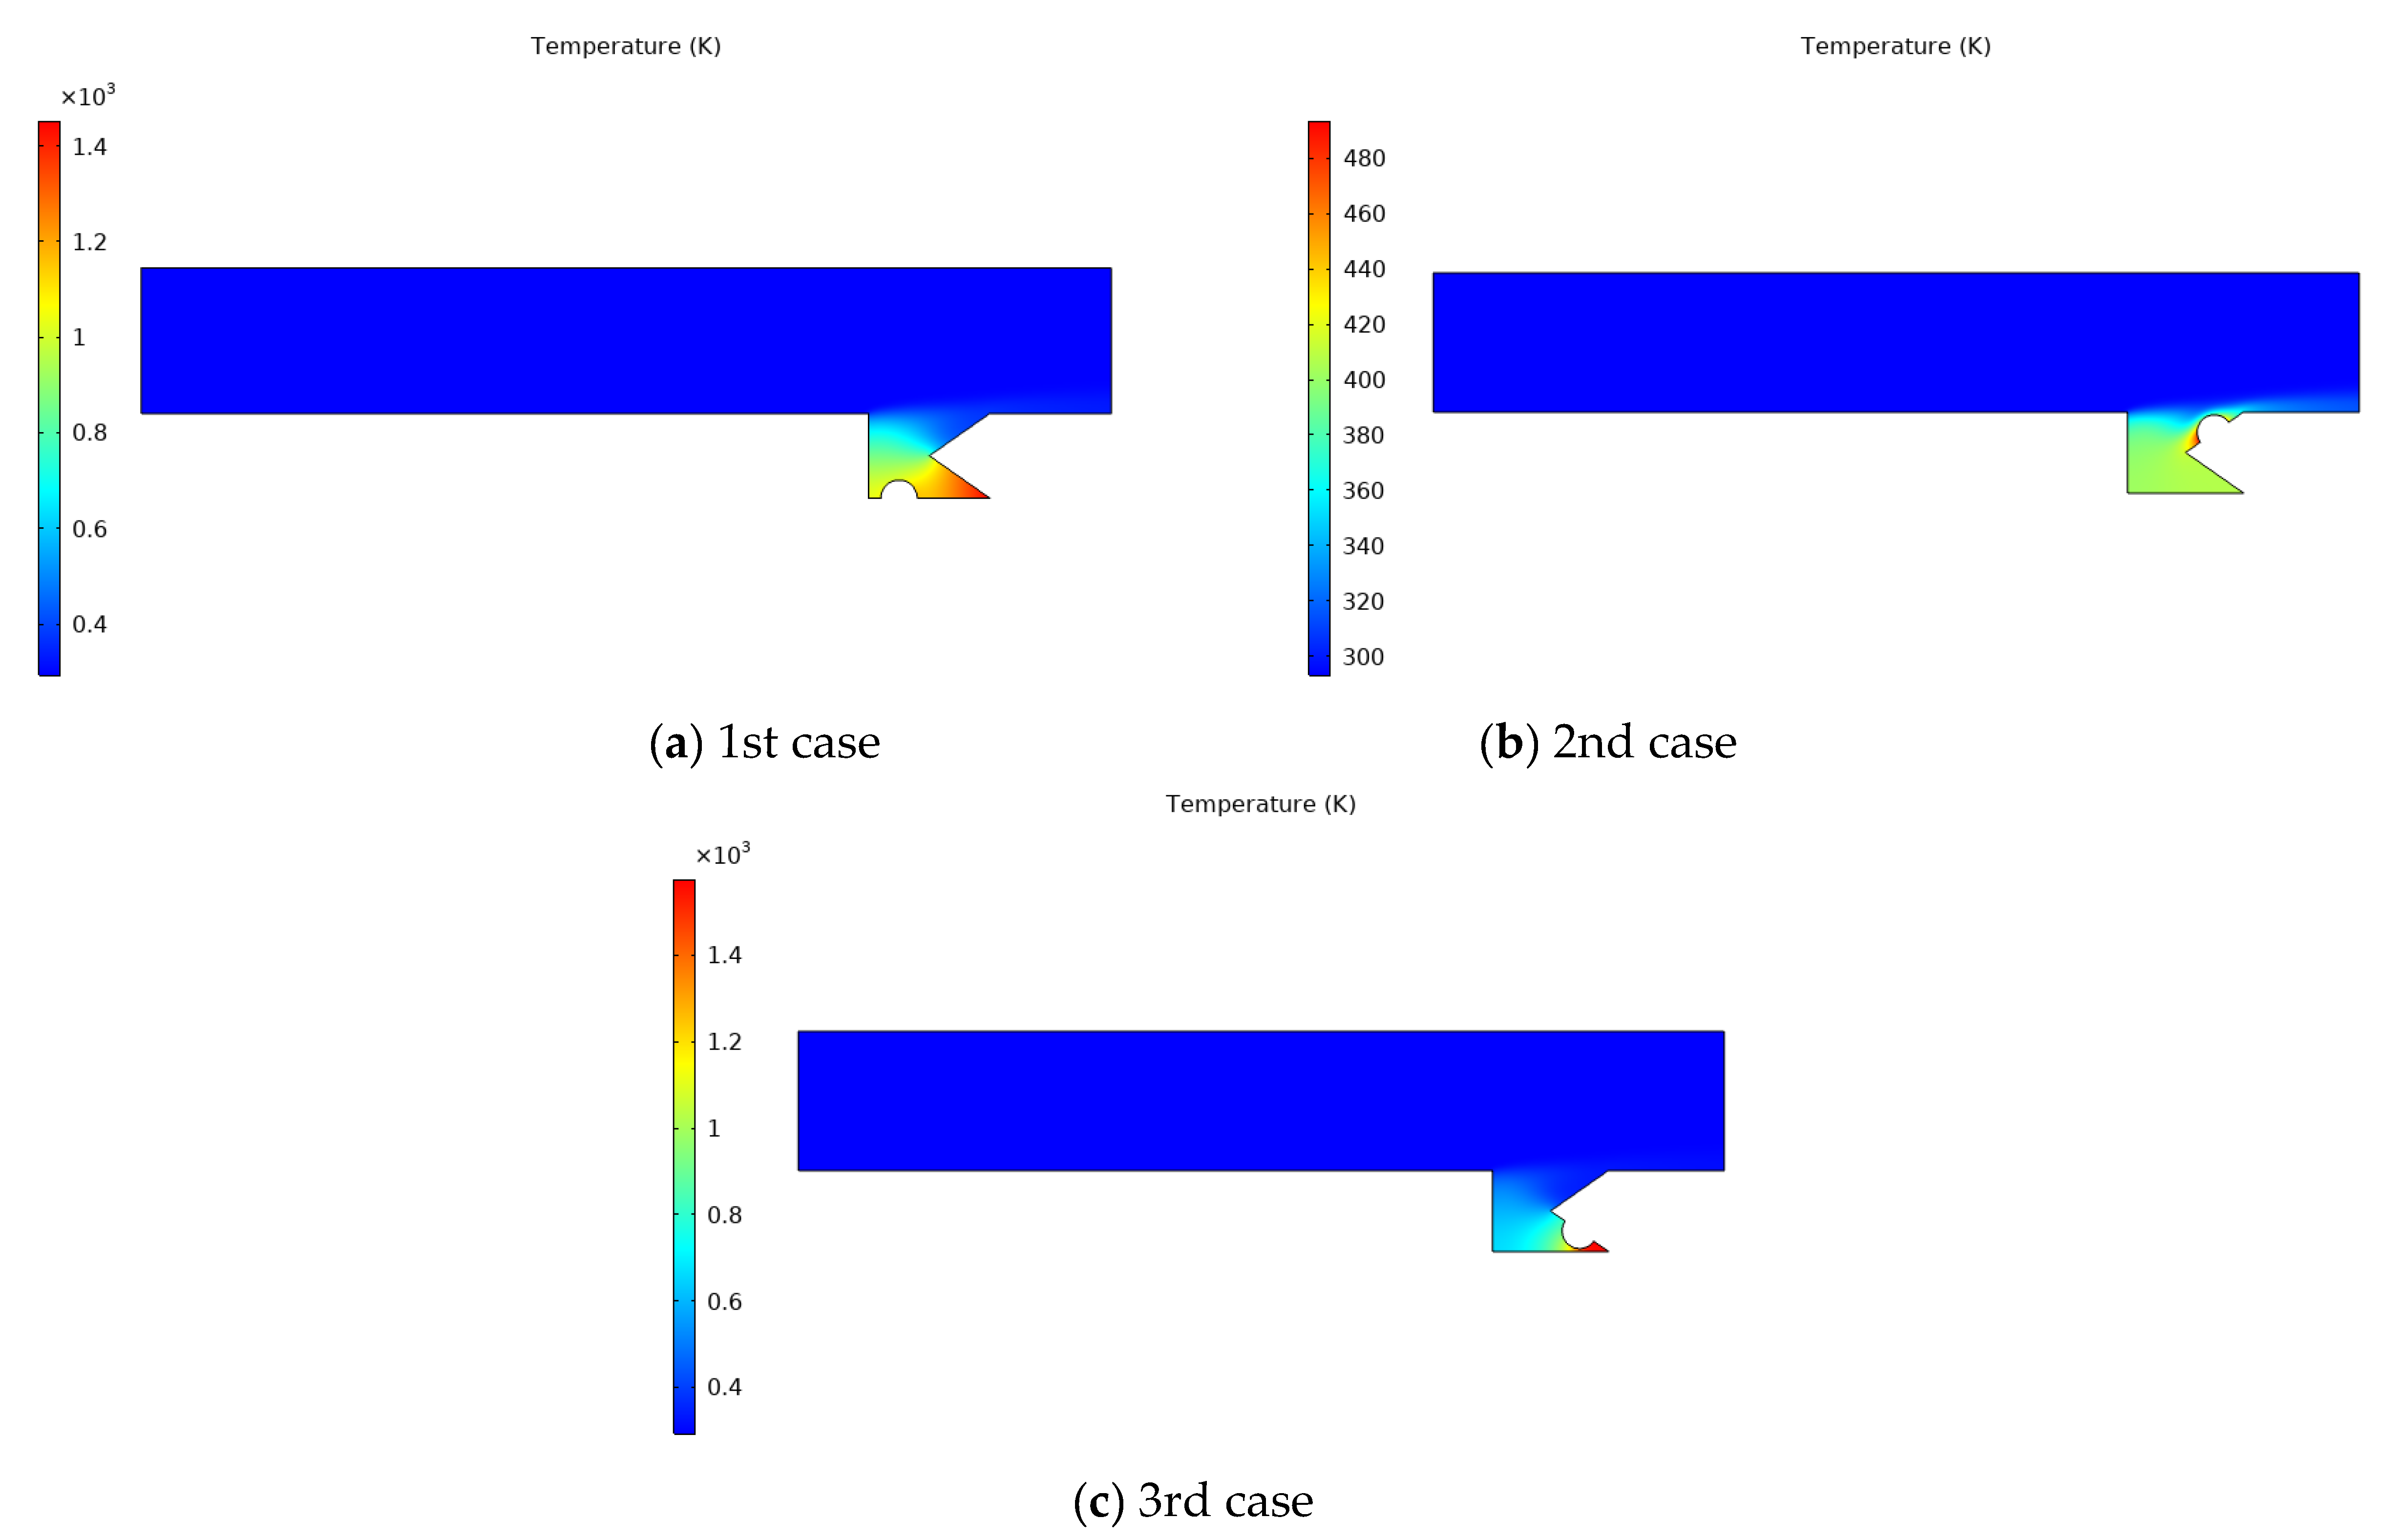
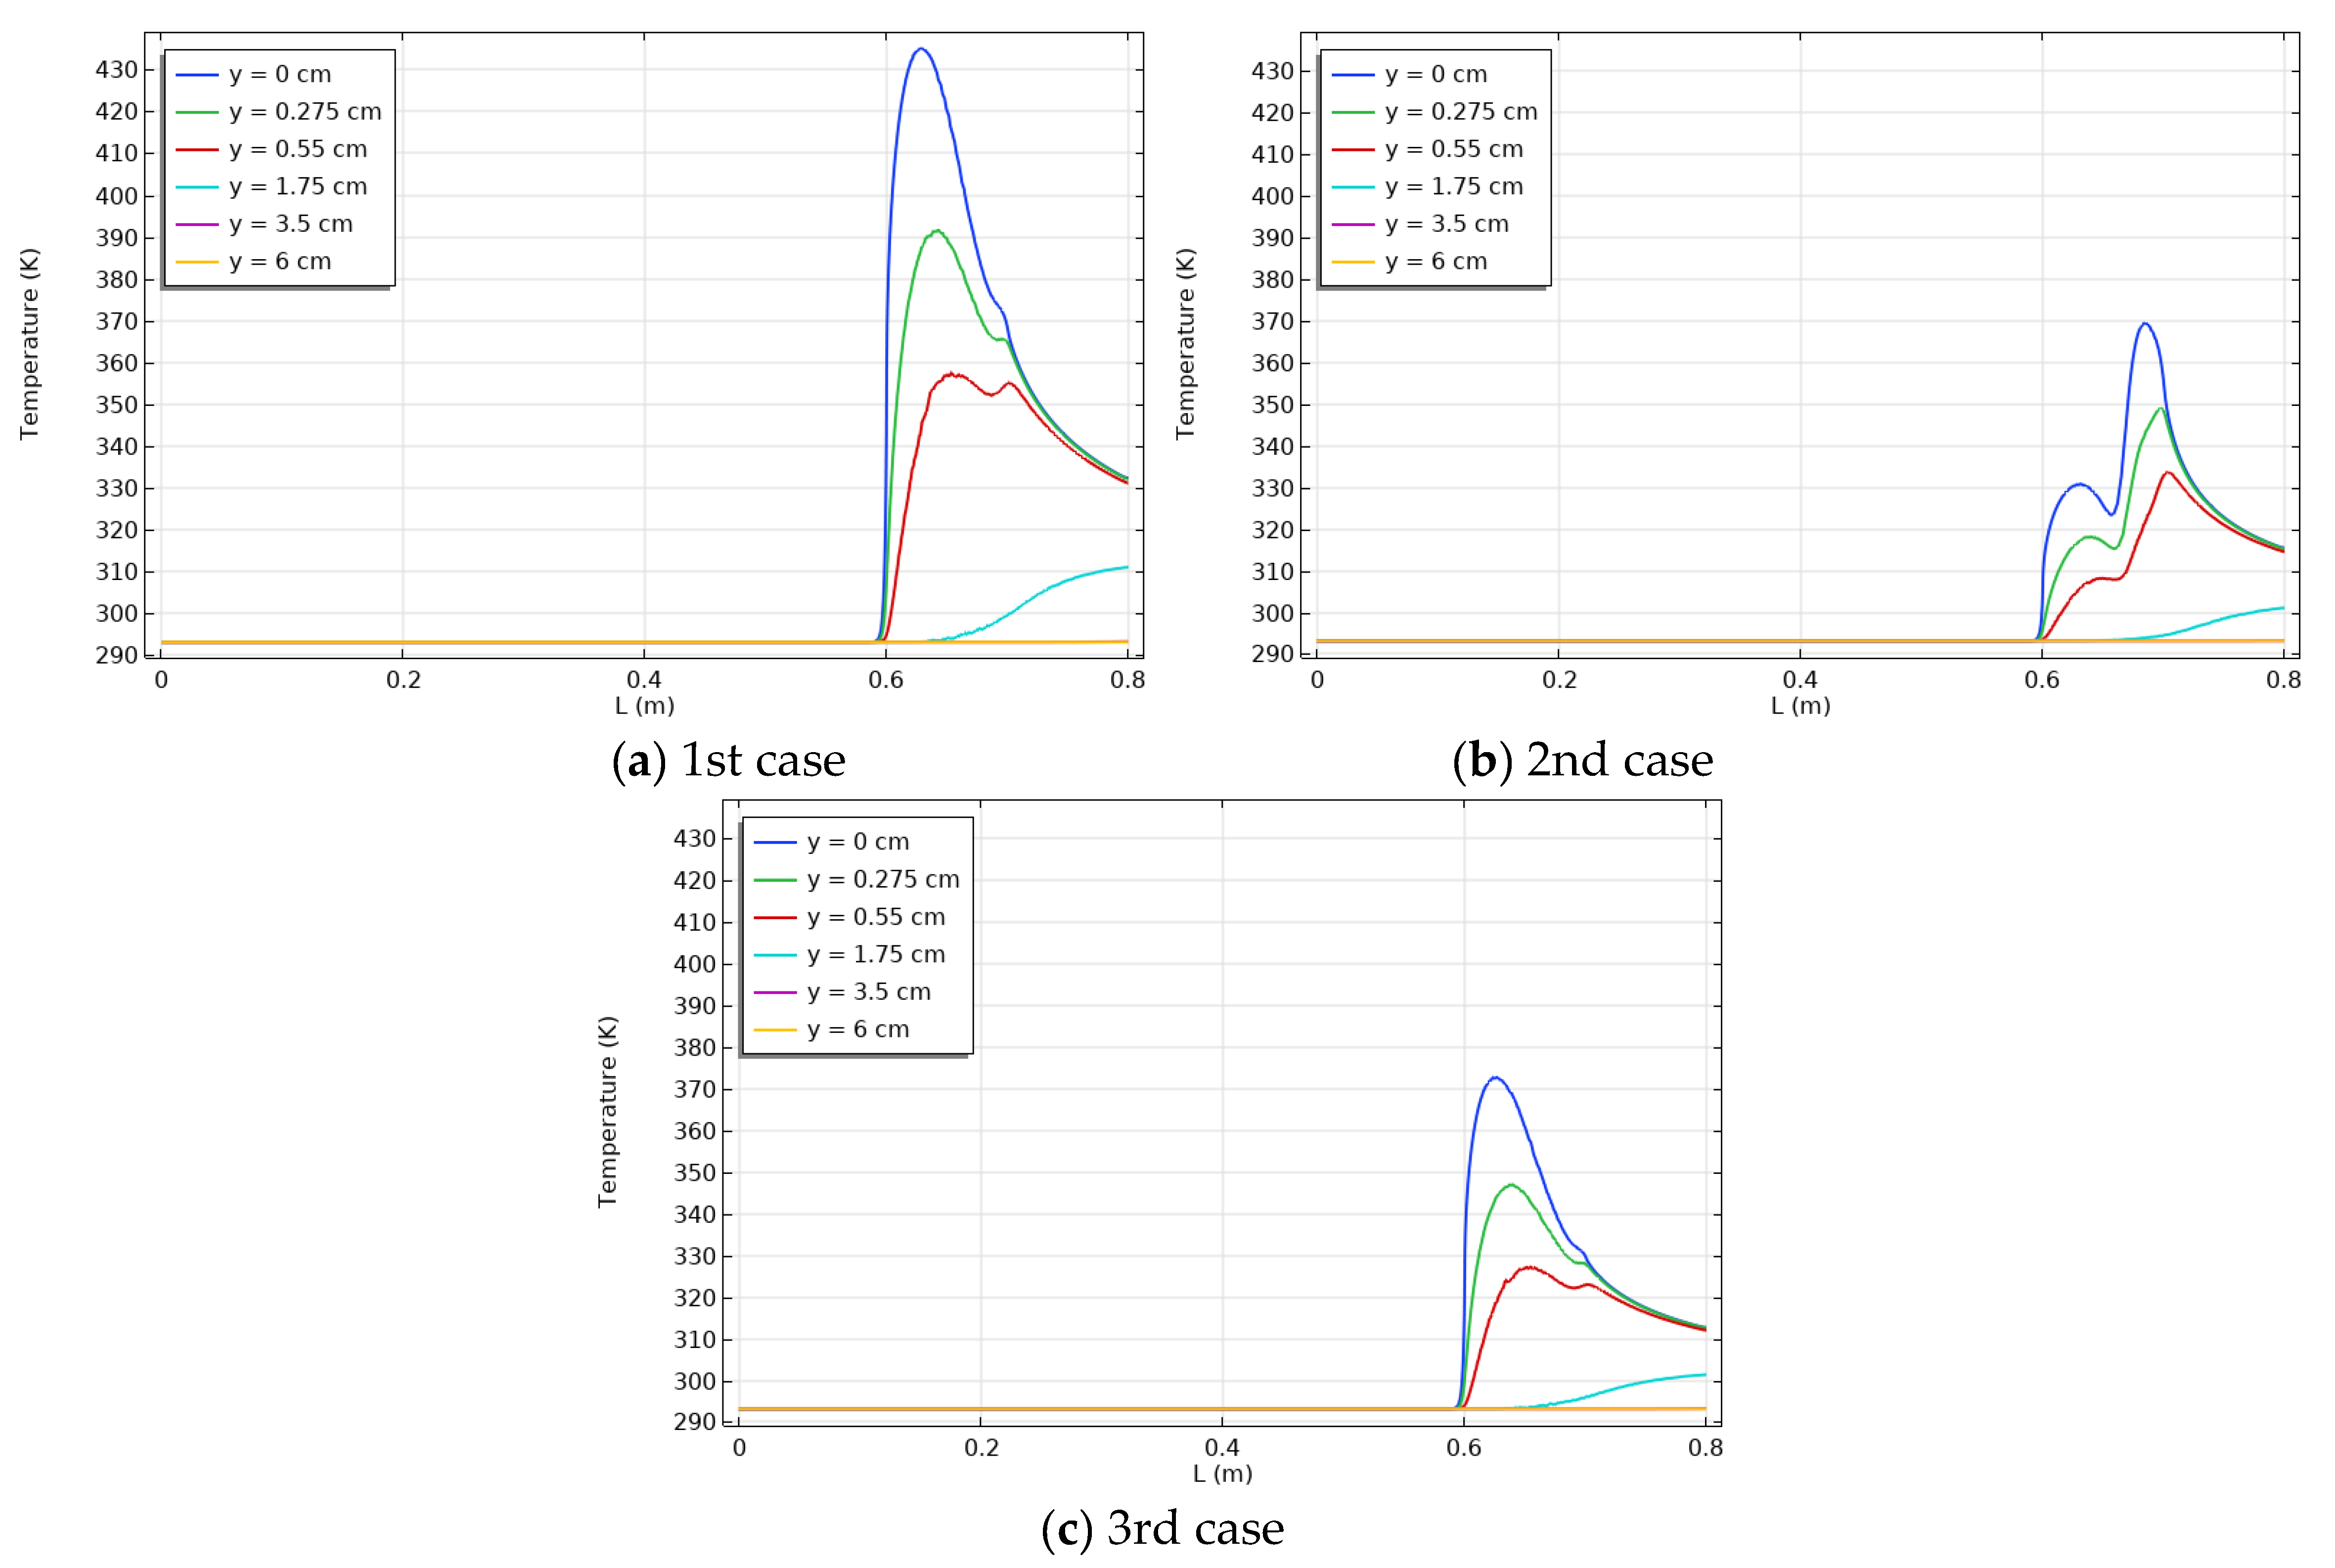
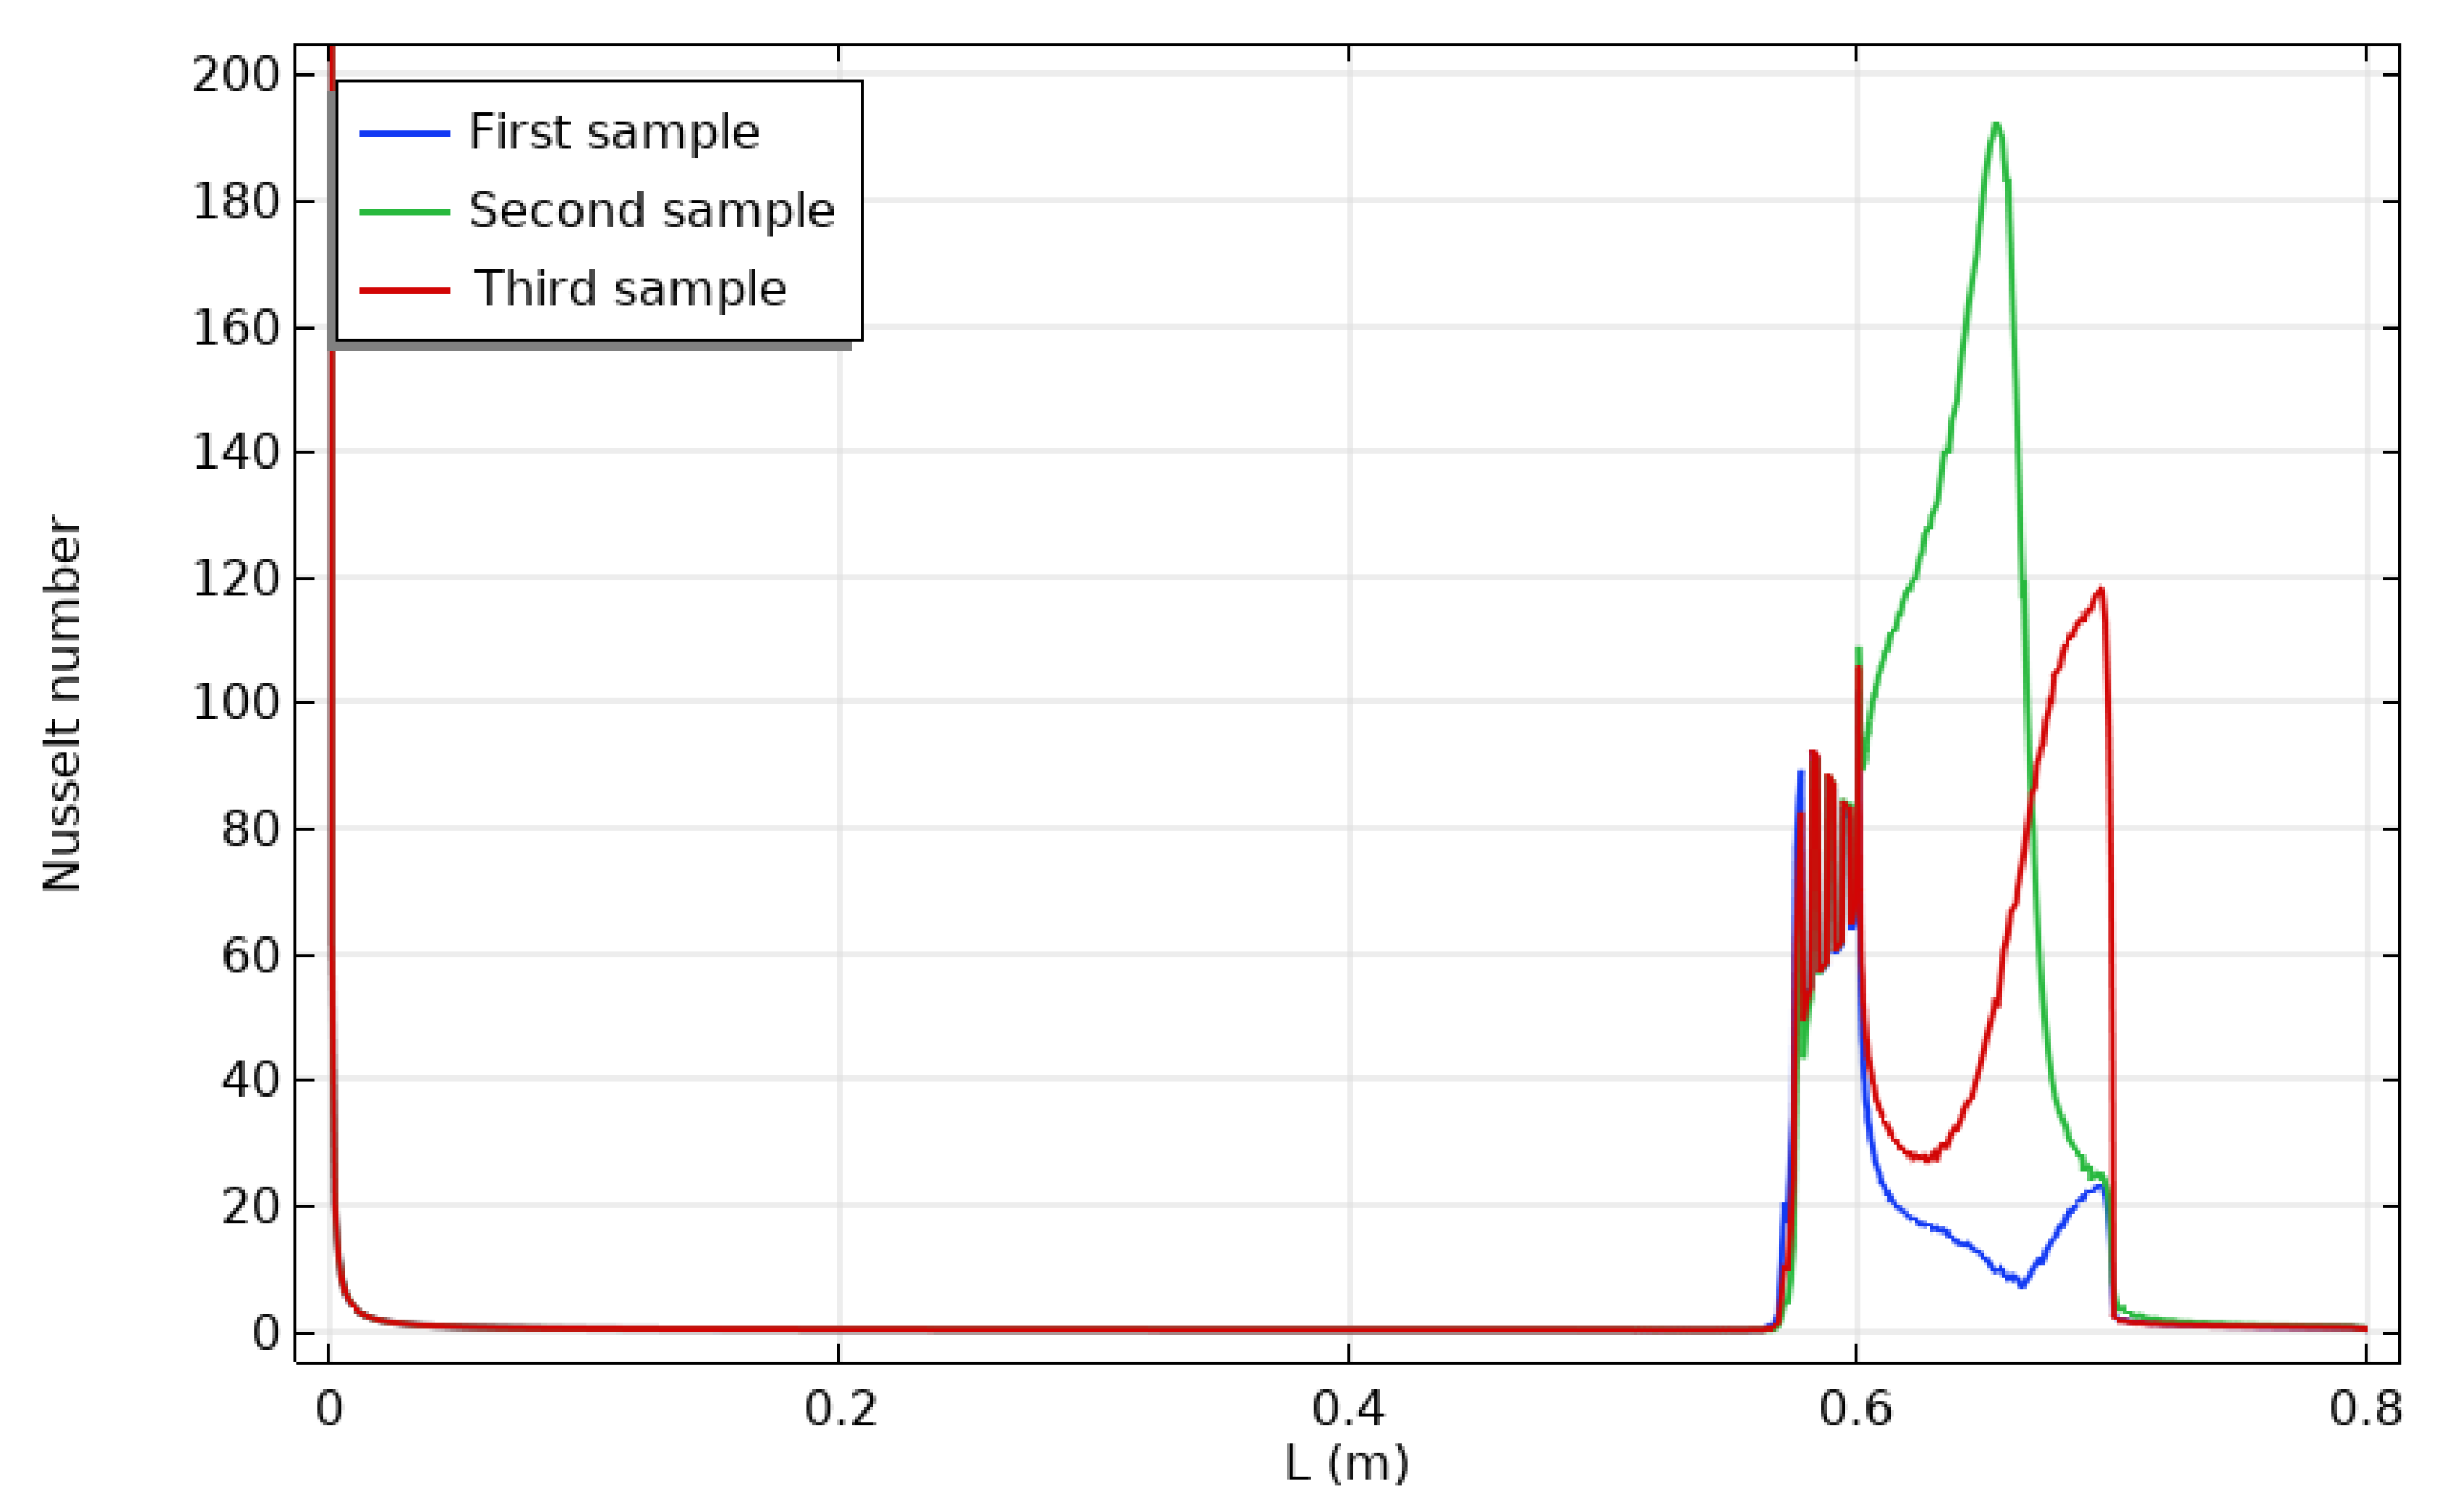
  • The higher heat transmission was performed in case two because the heat source was near the contact surface between the channel and the cavity.
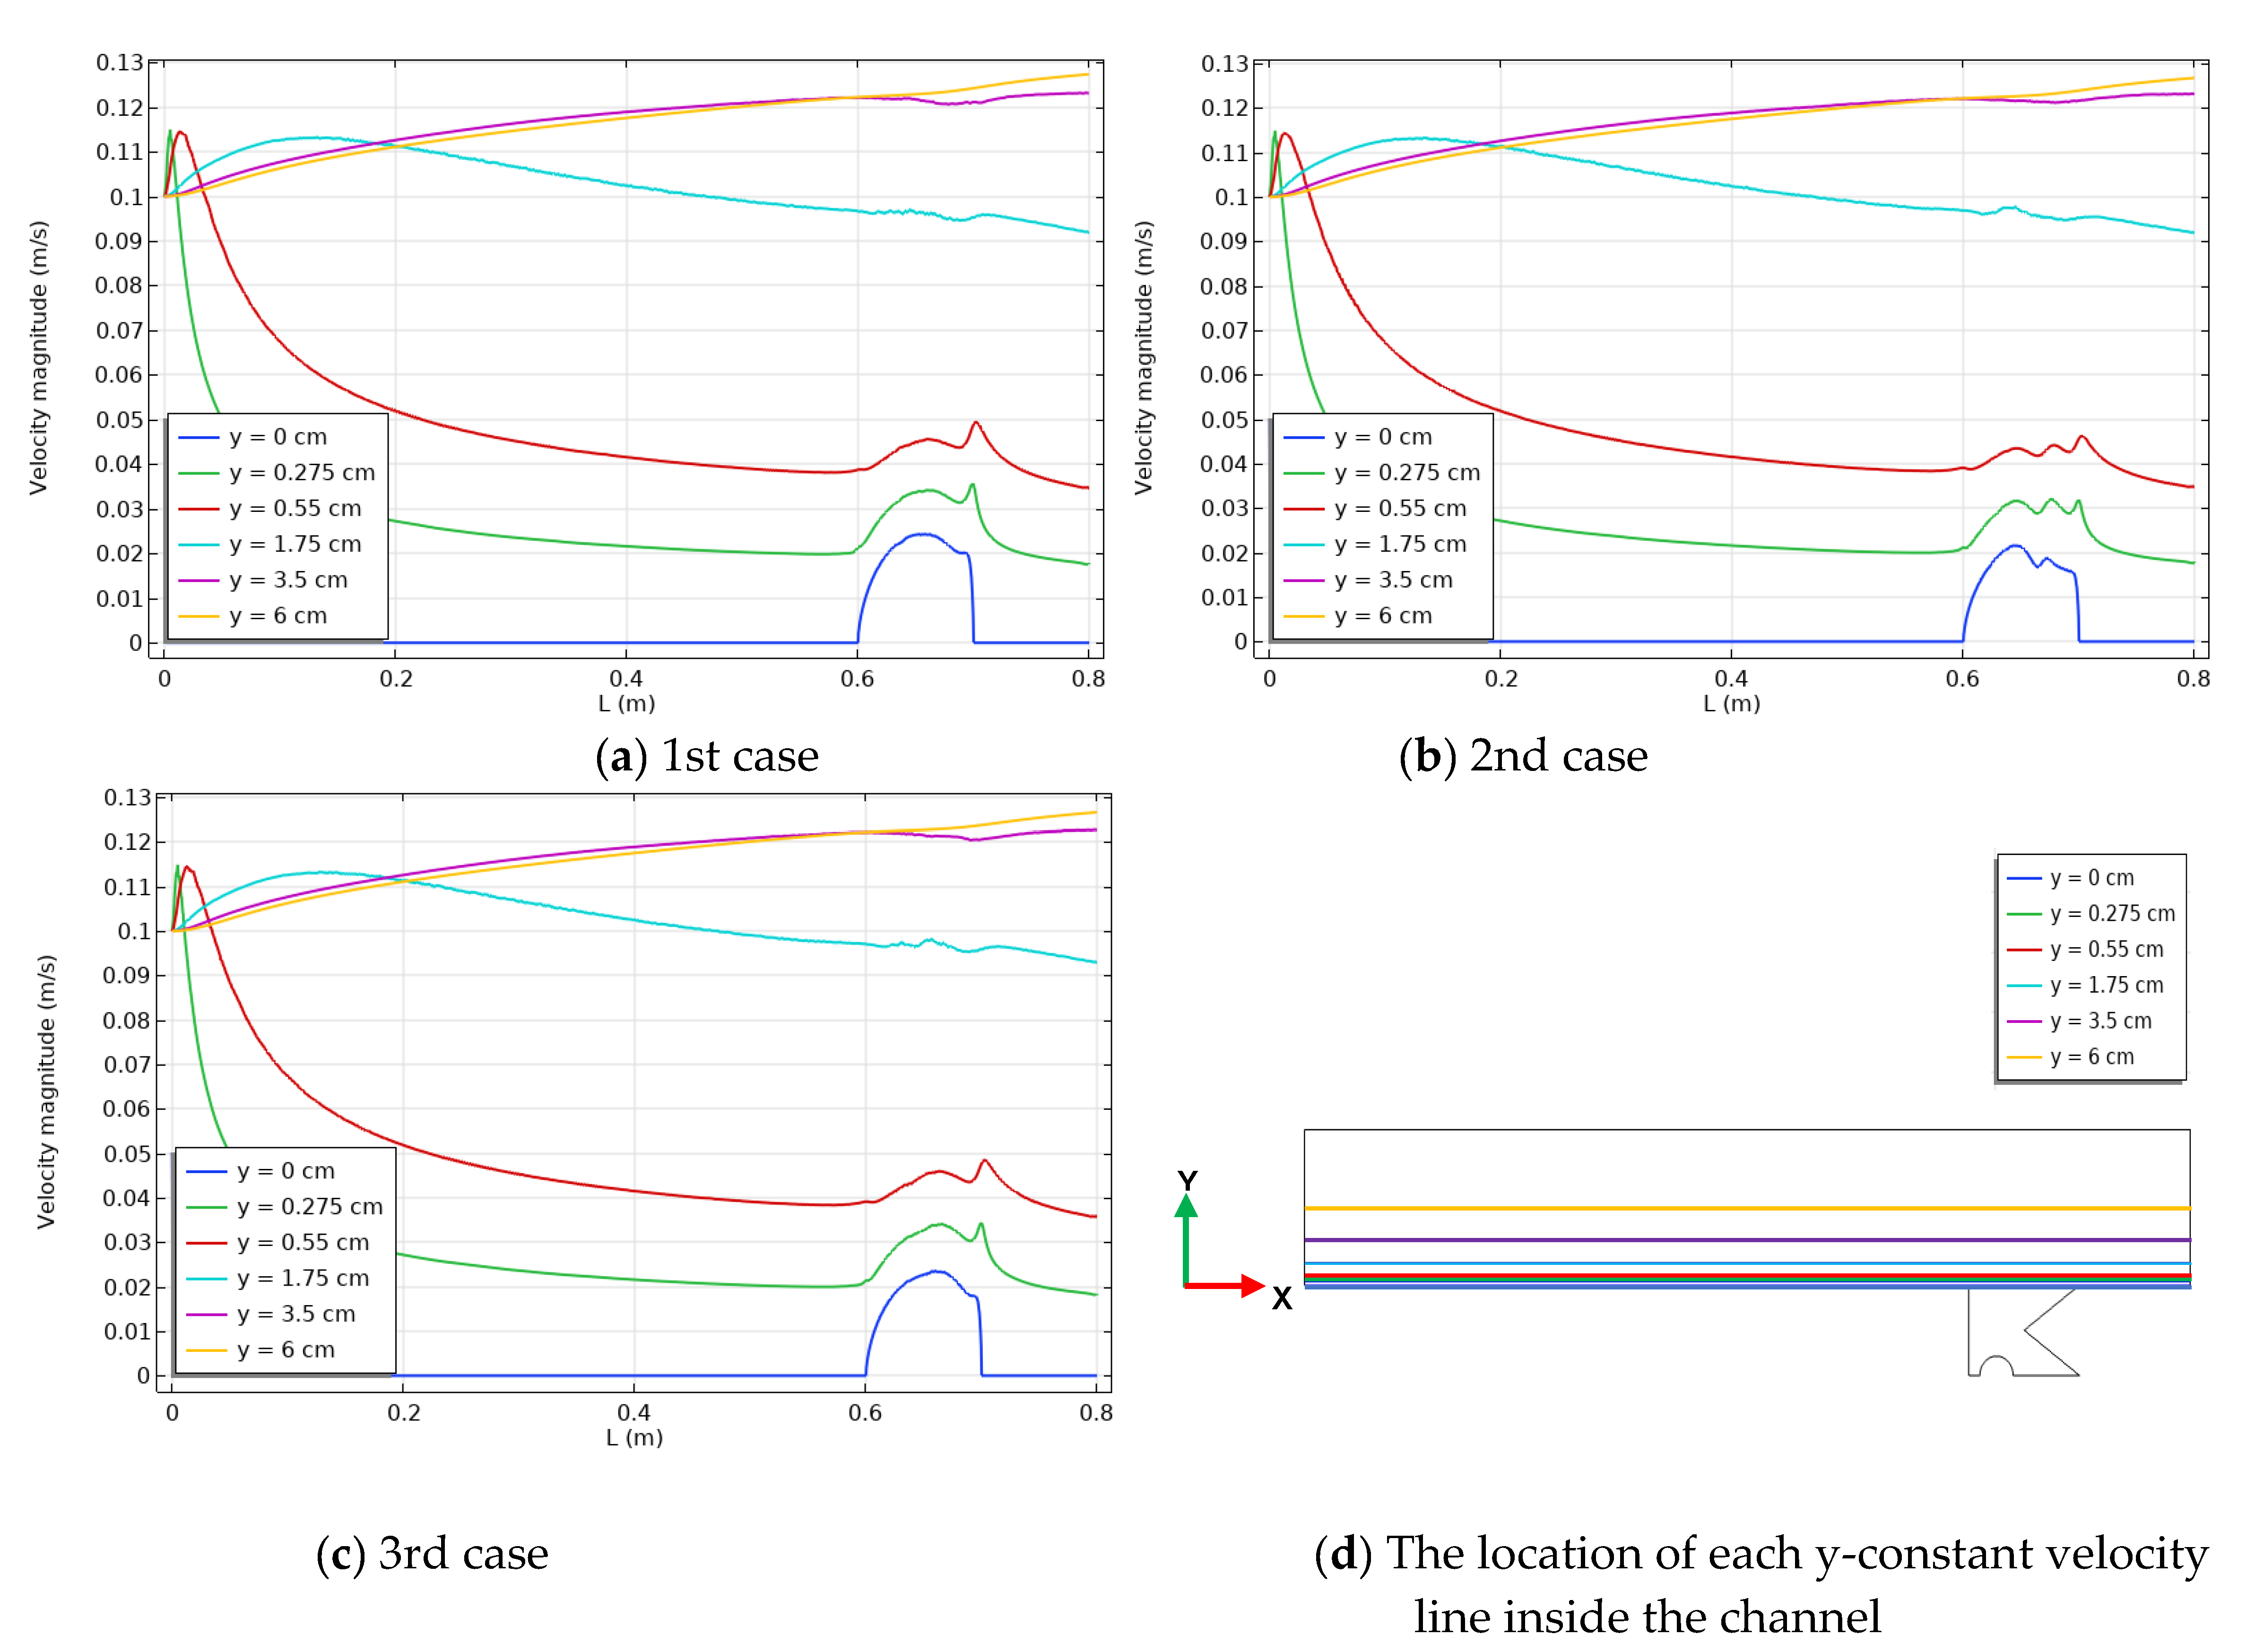
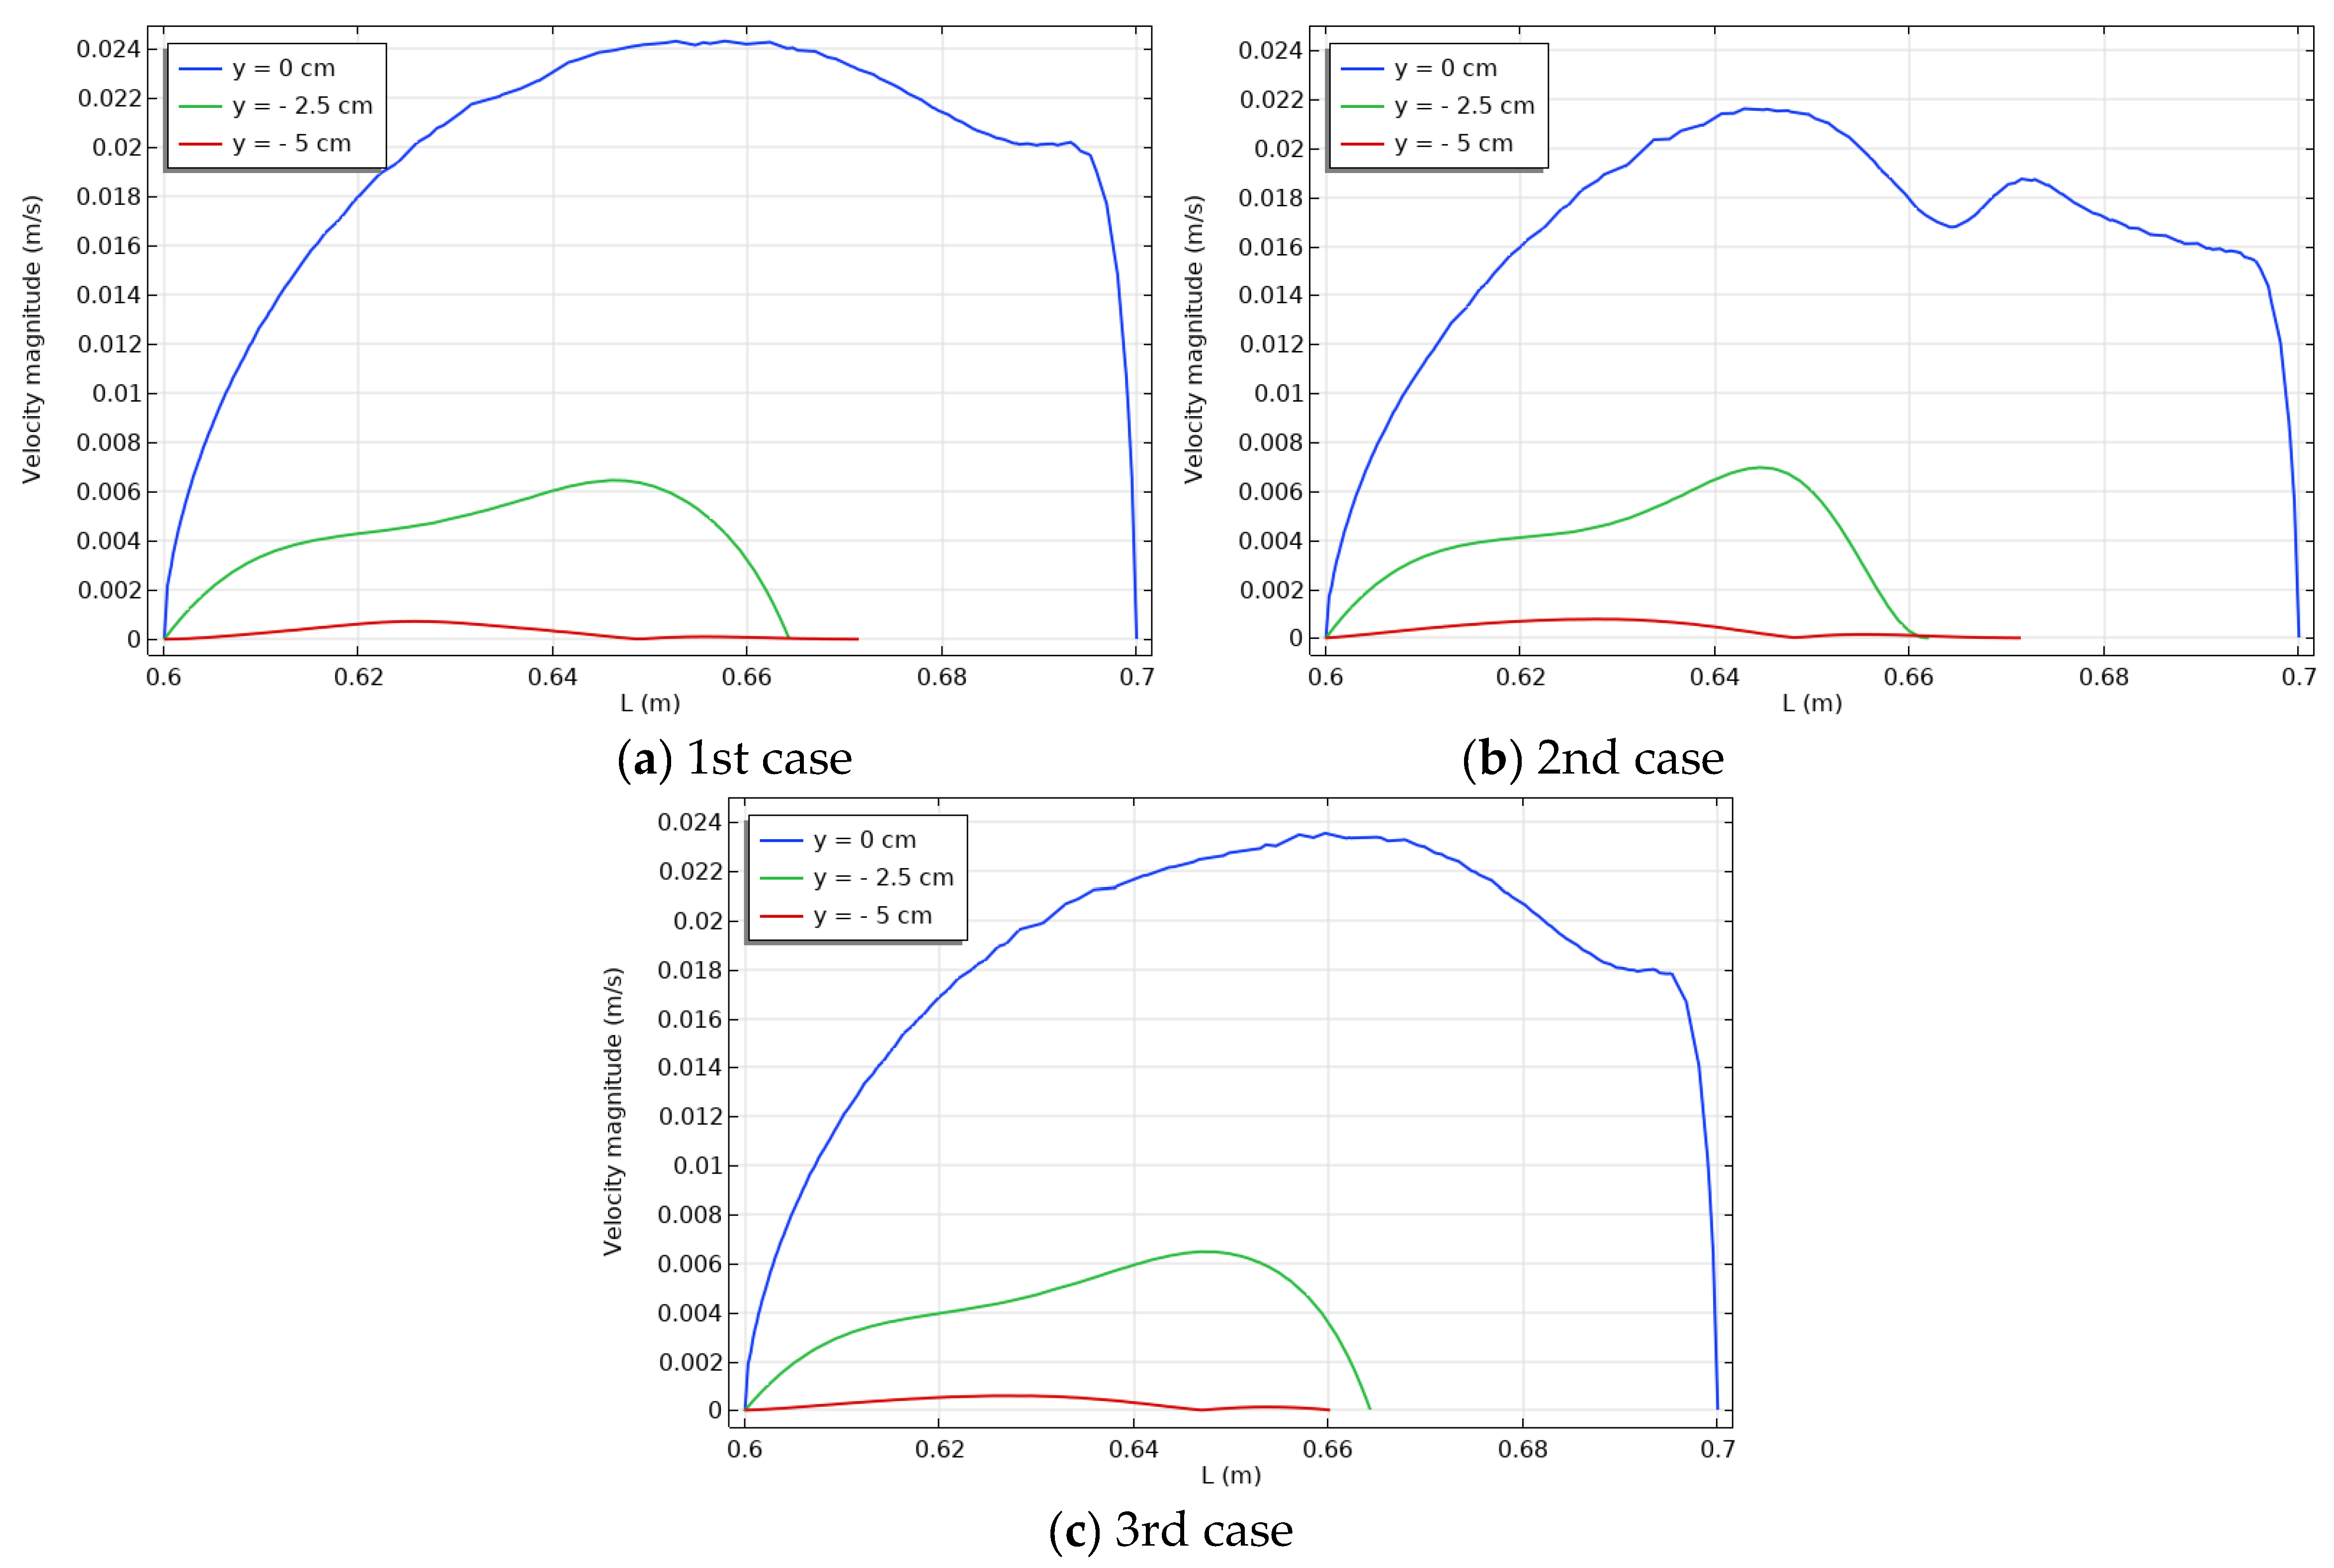
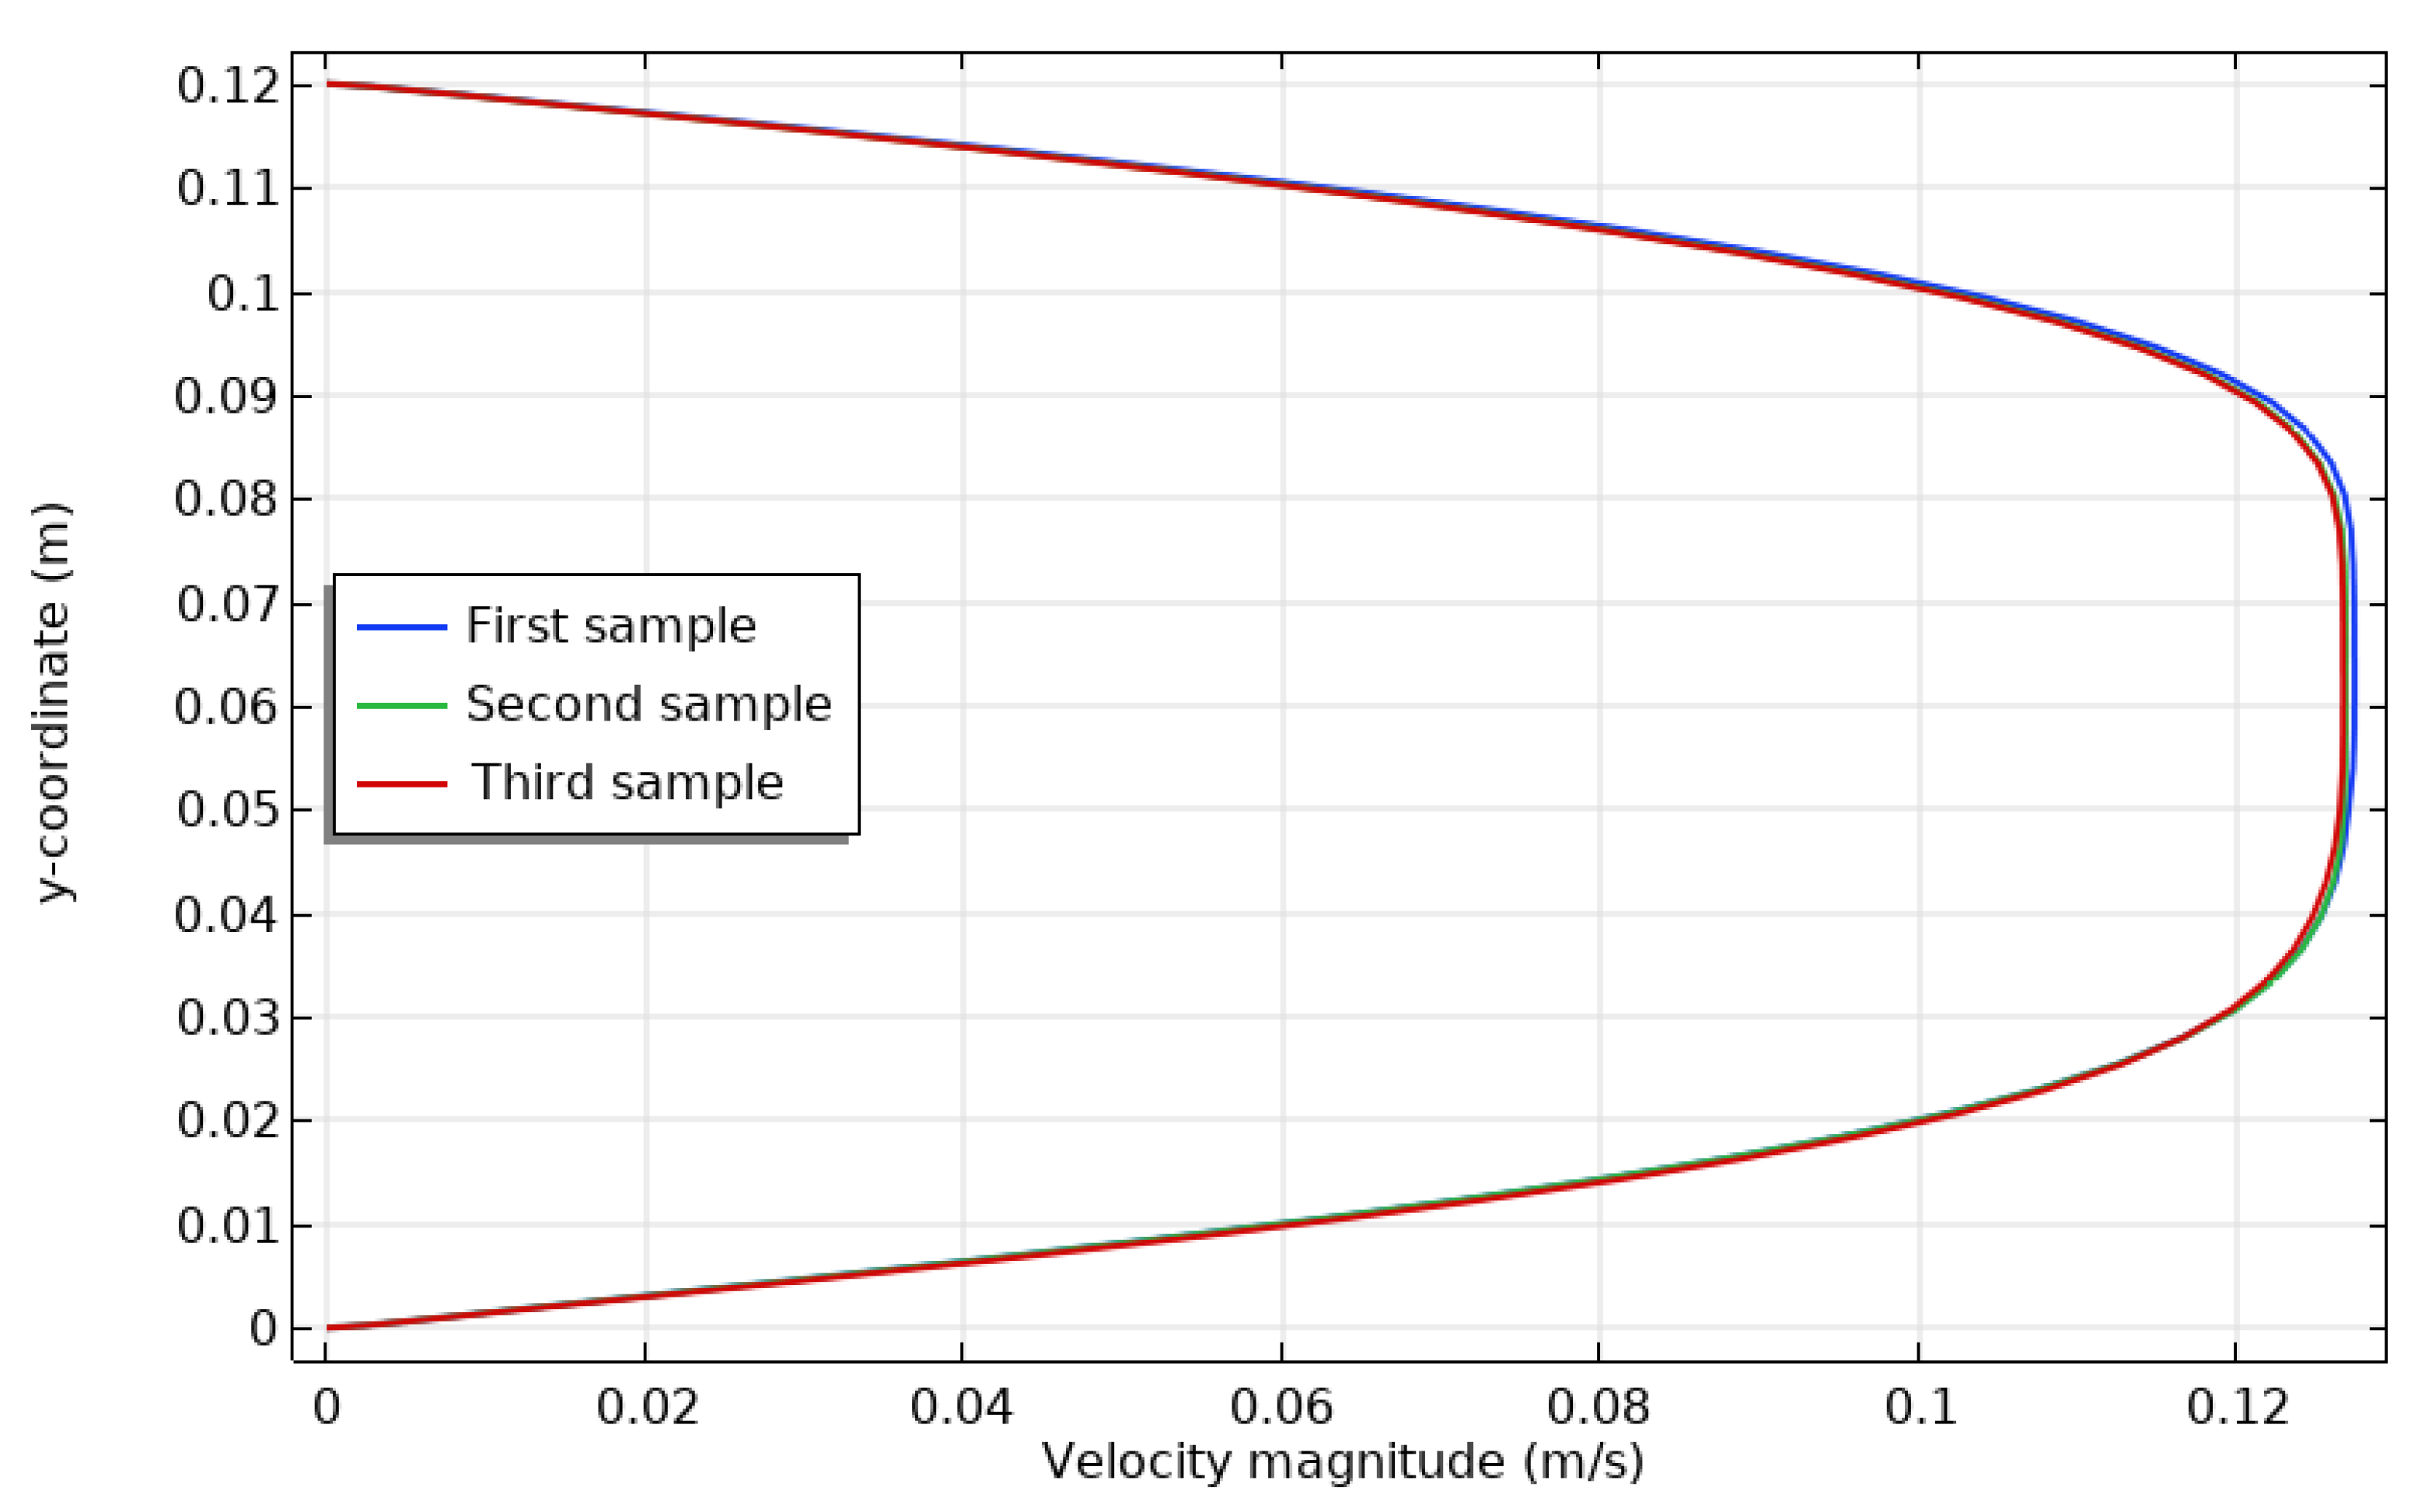
  • The velocity distribution seems unaffected by changing the location of heated sources.
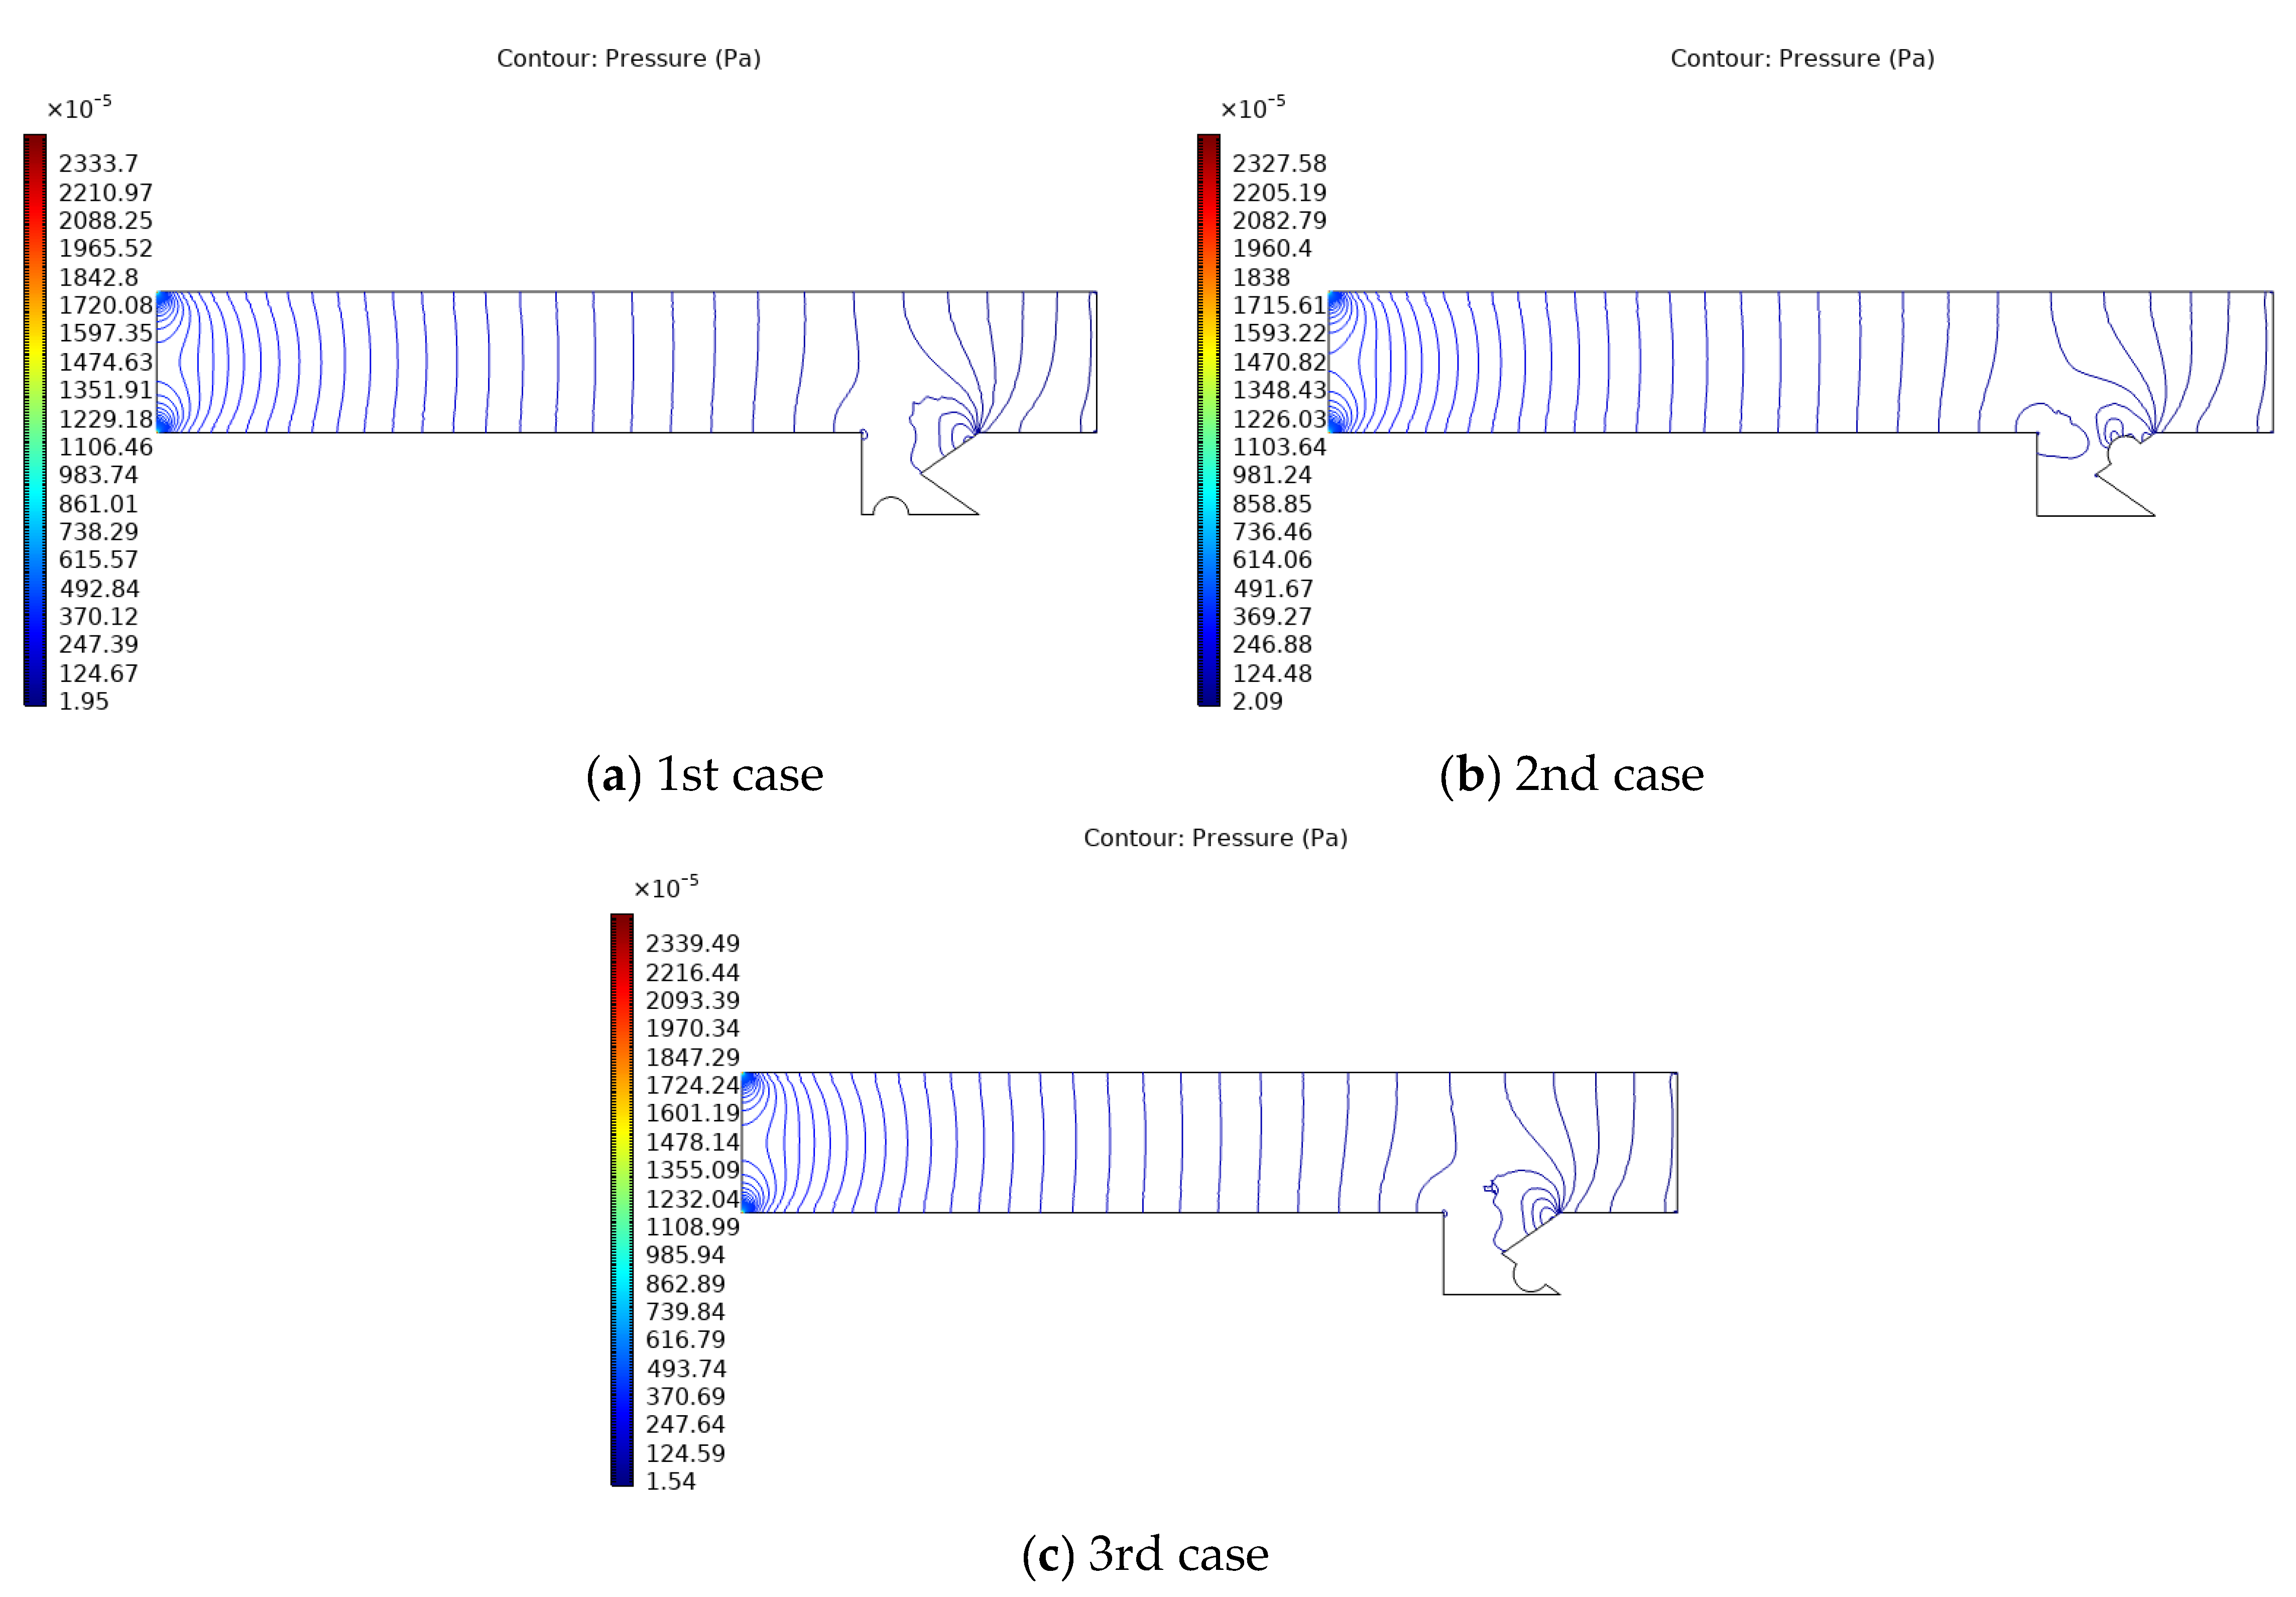
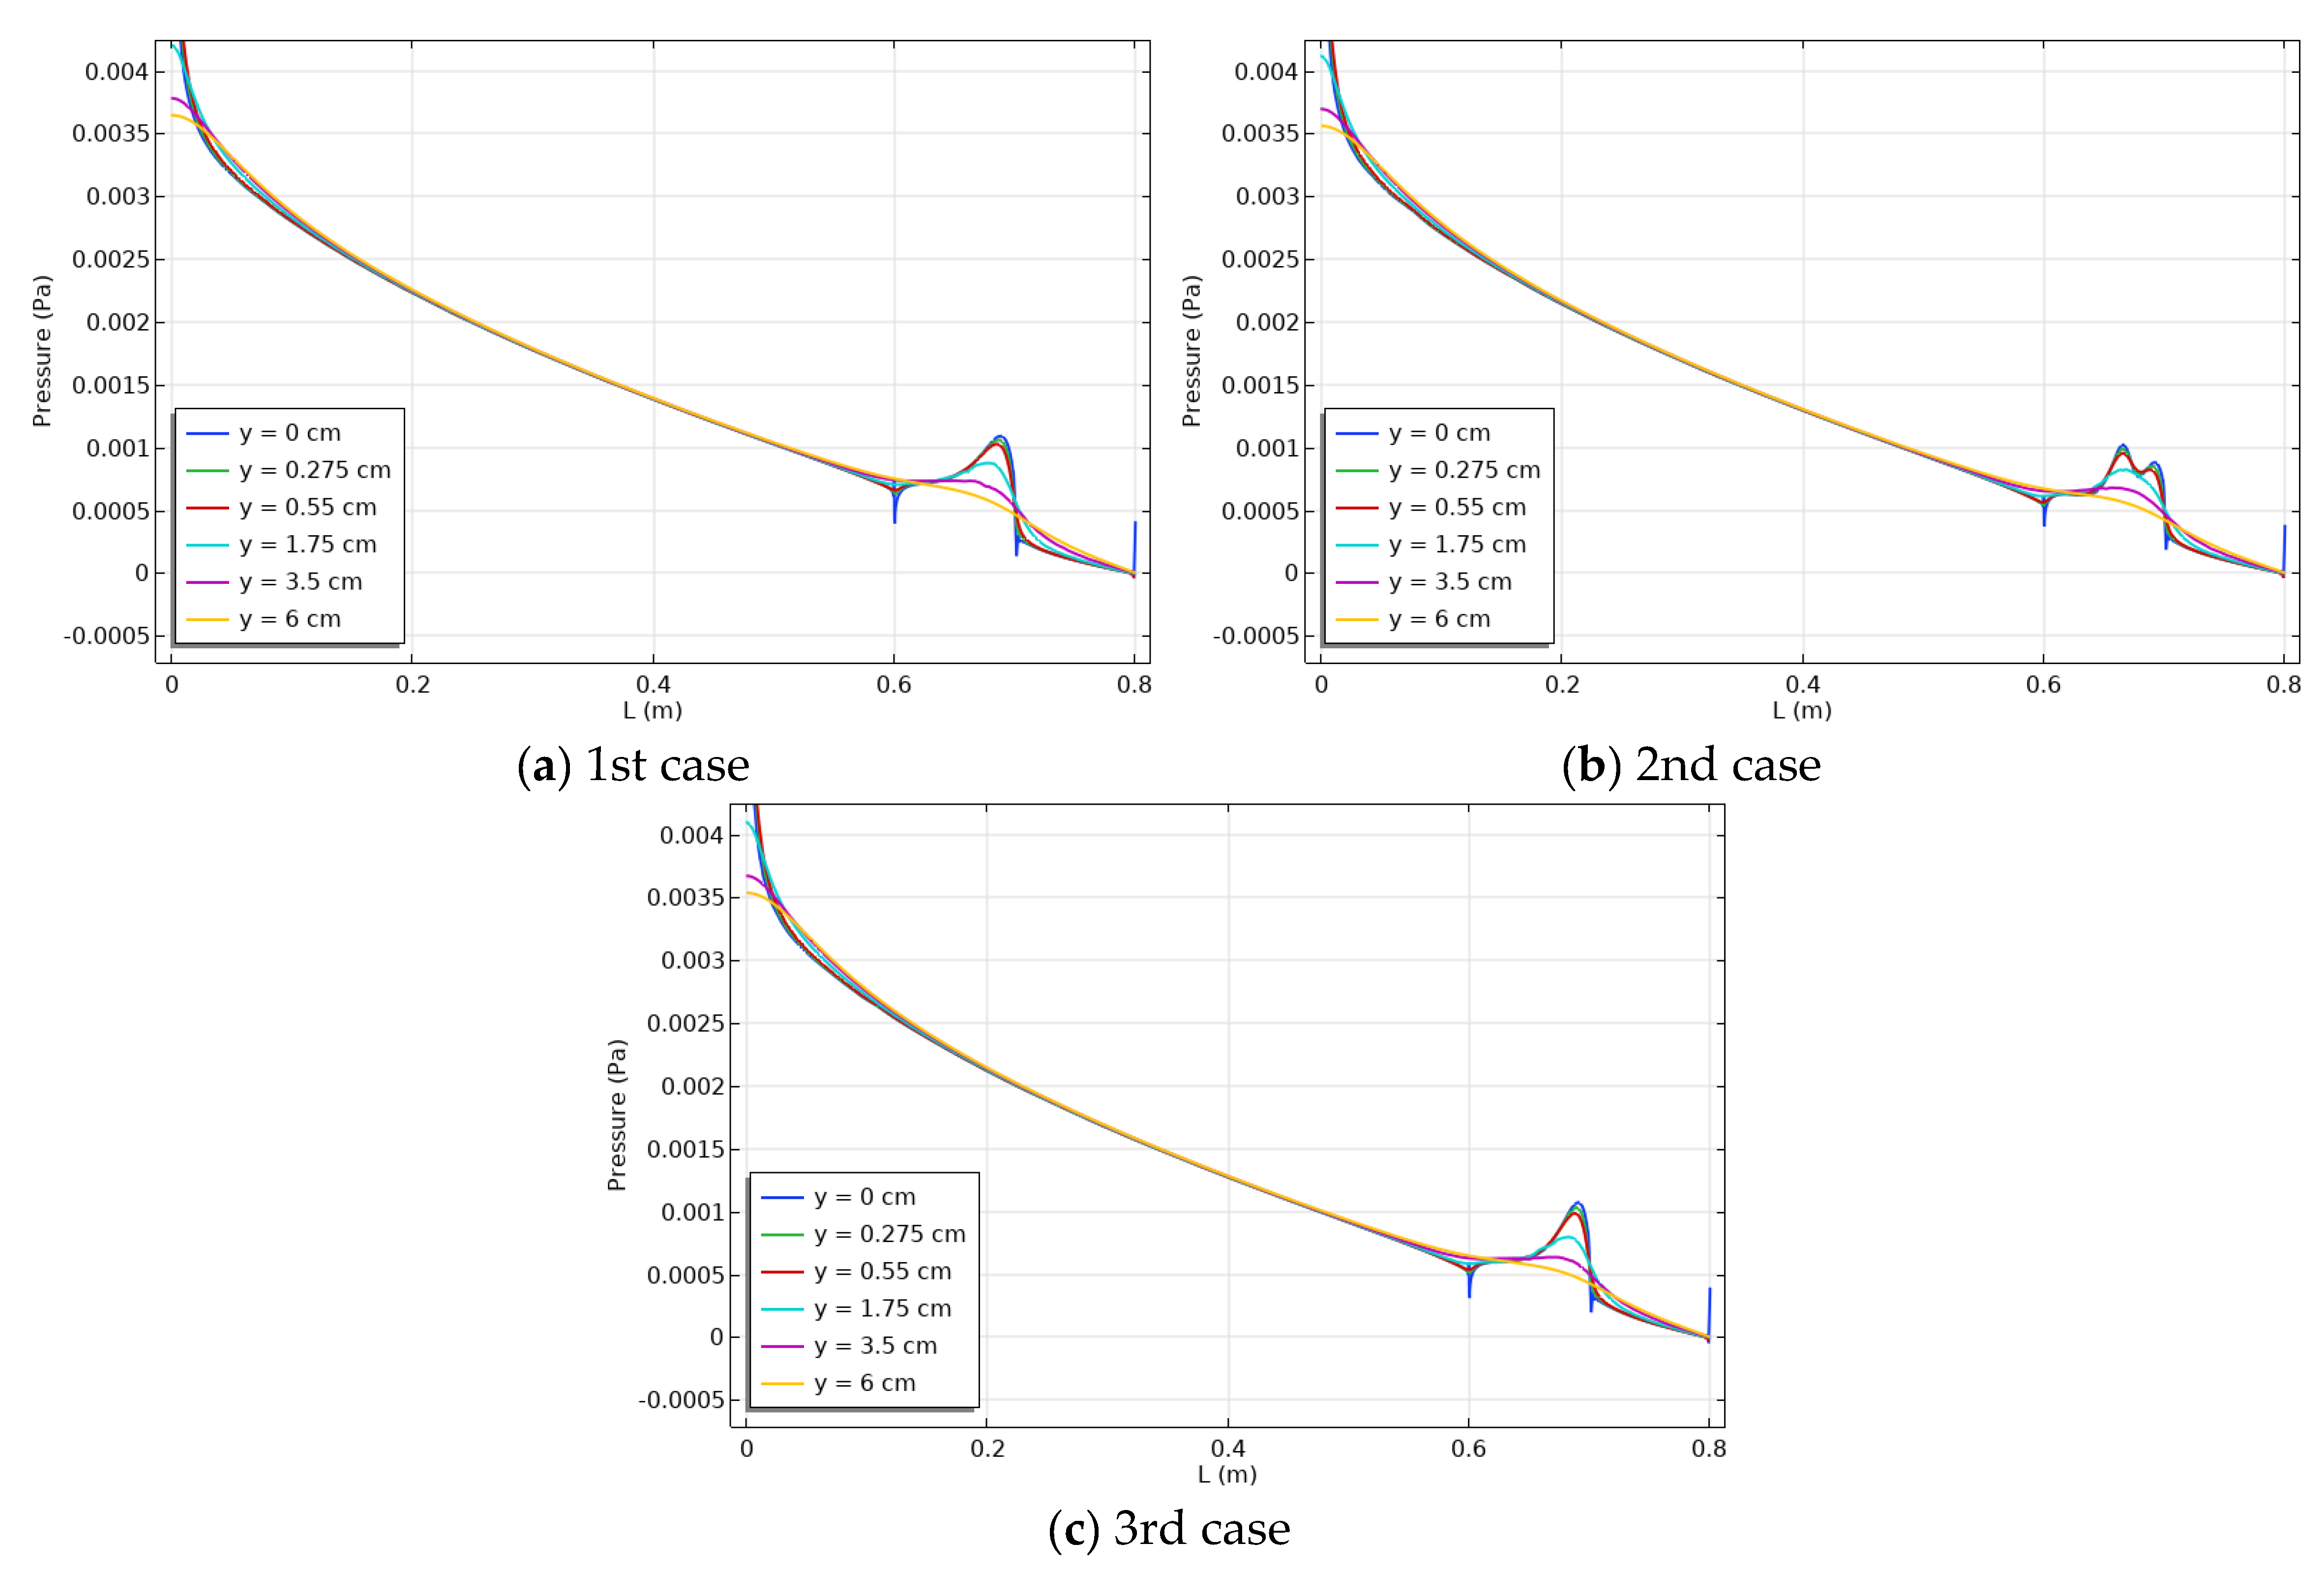
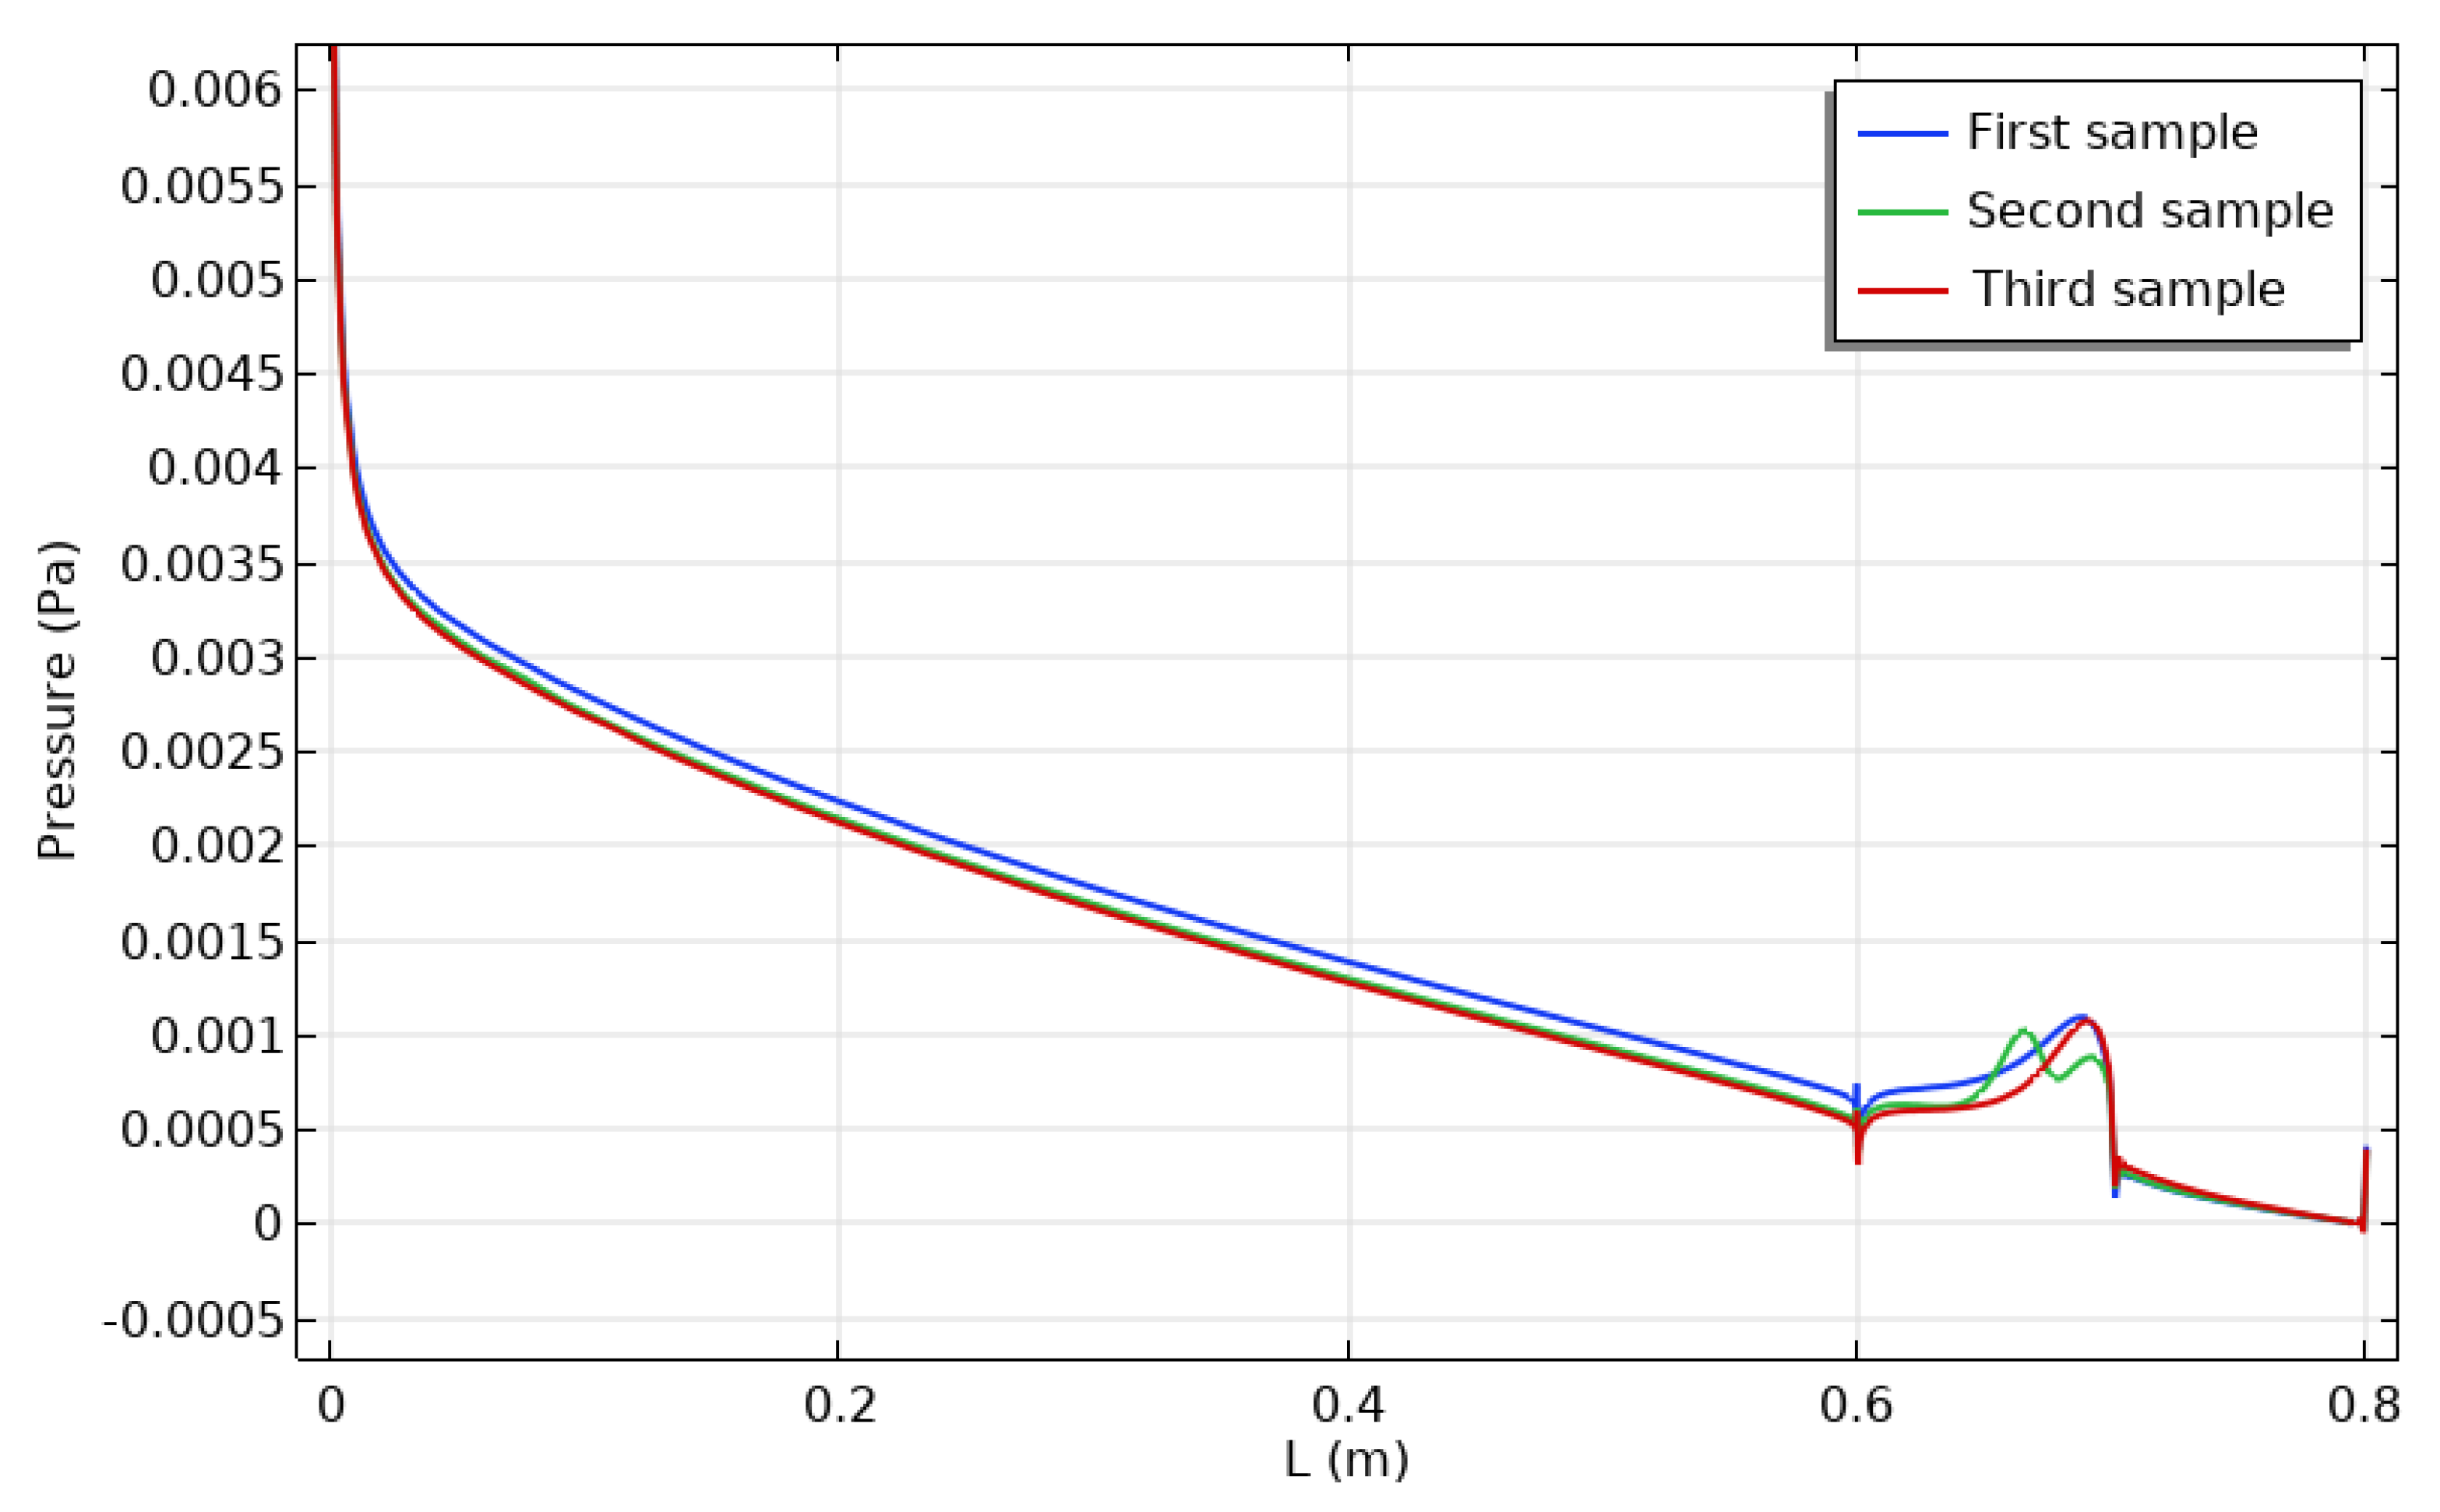
  • The pressure distribution along the channel was unaffected by the rise in the positive y axis.
  • The pressure distribution seems unaffected by changing the location of the heated source.
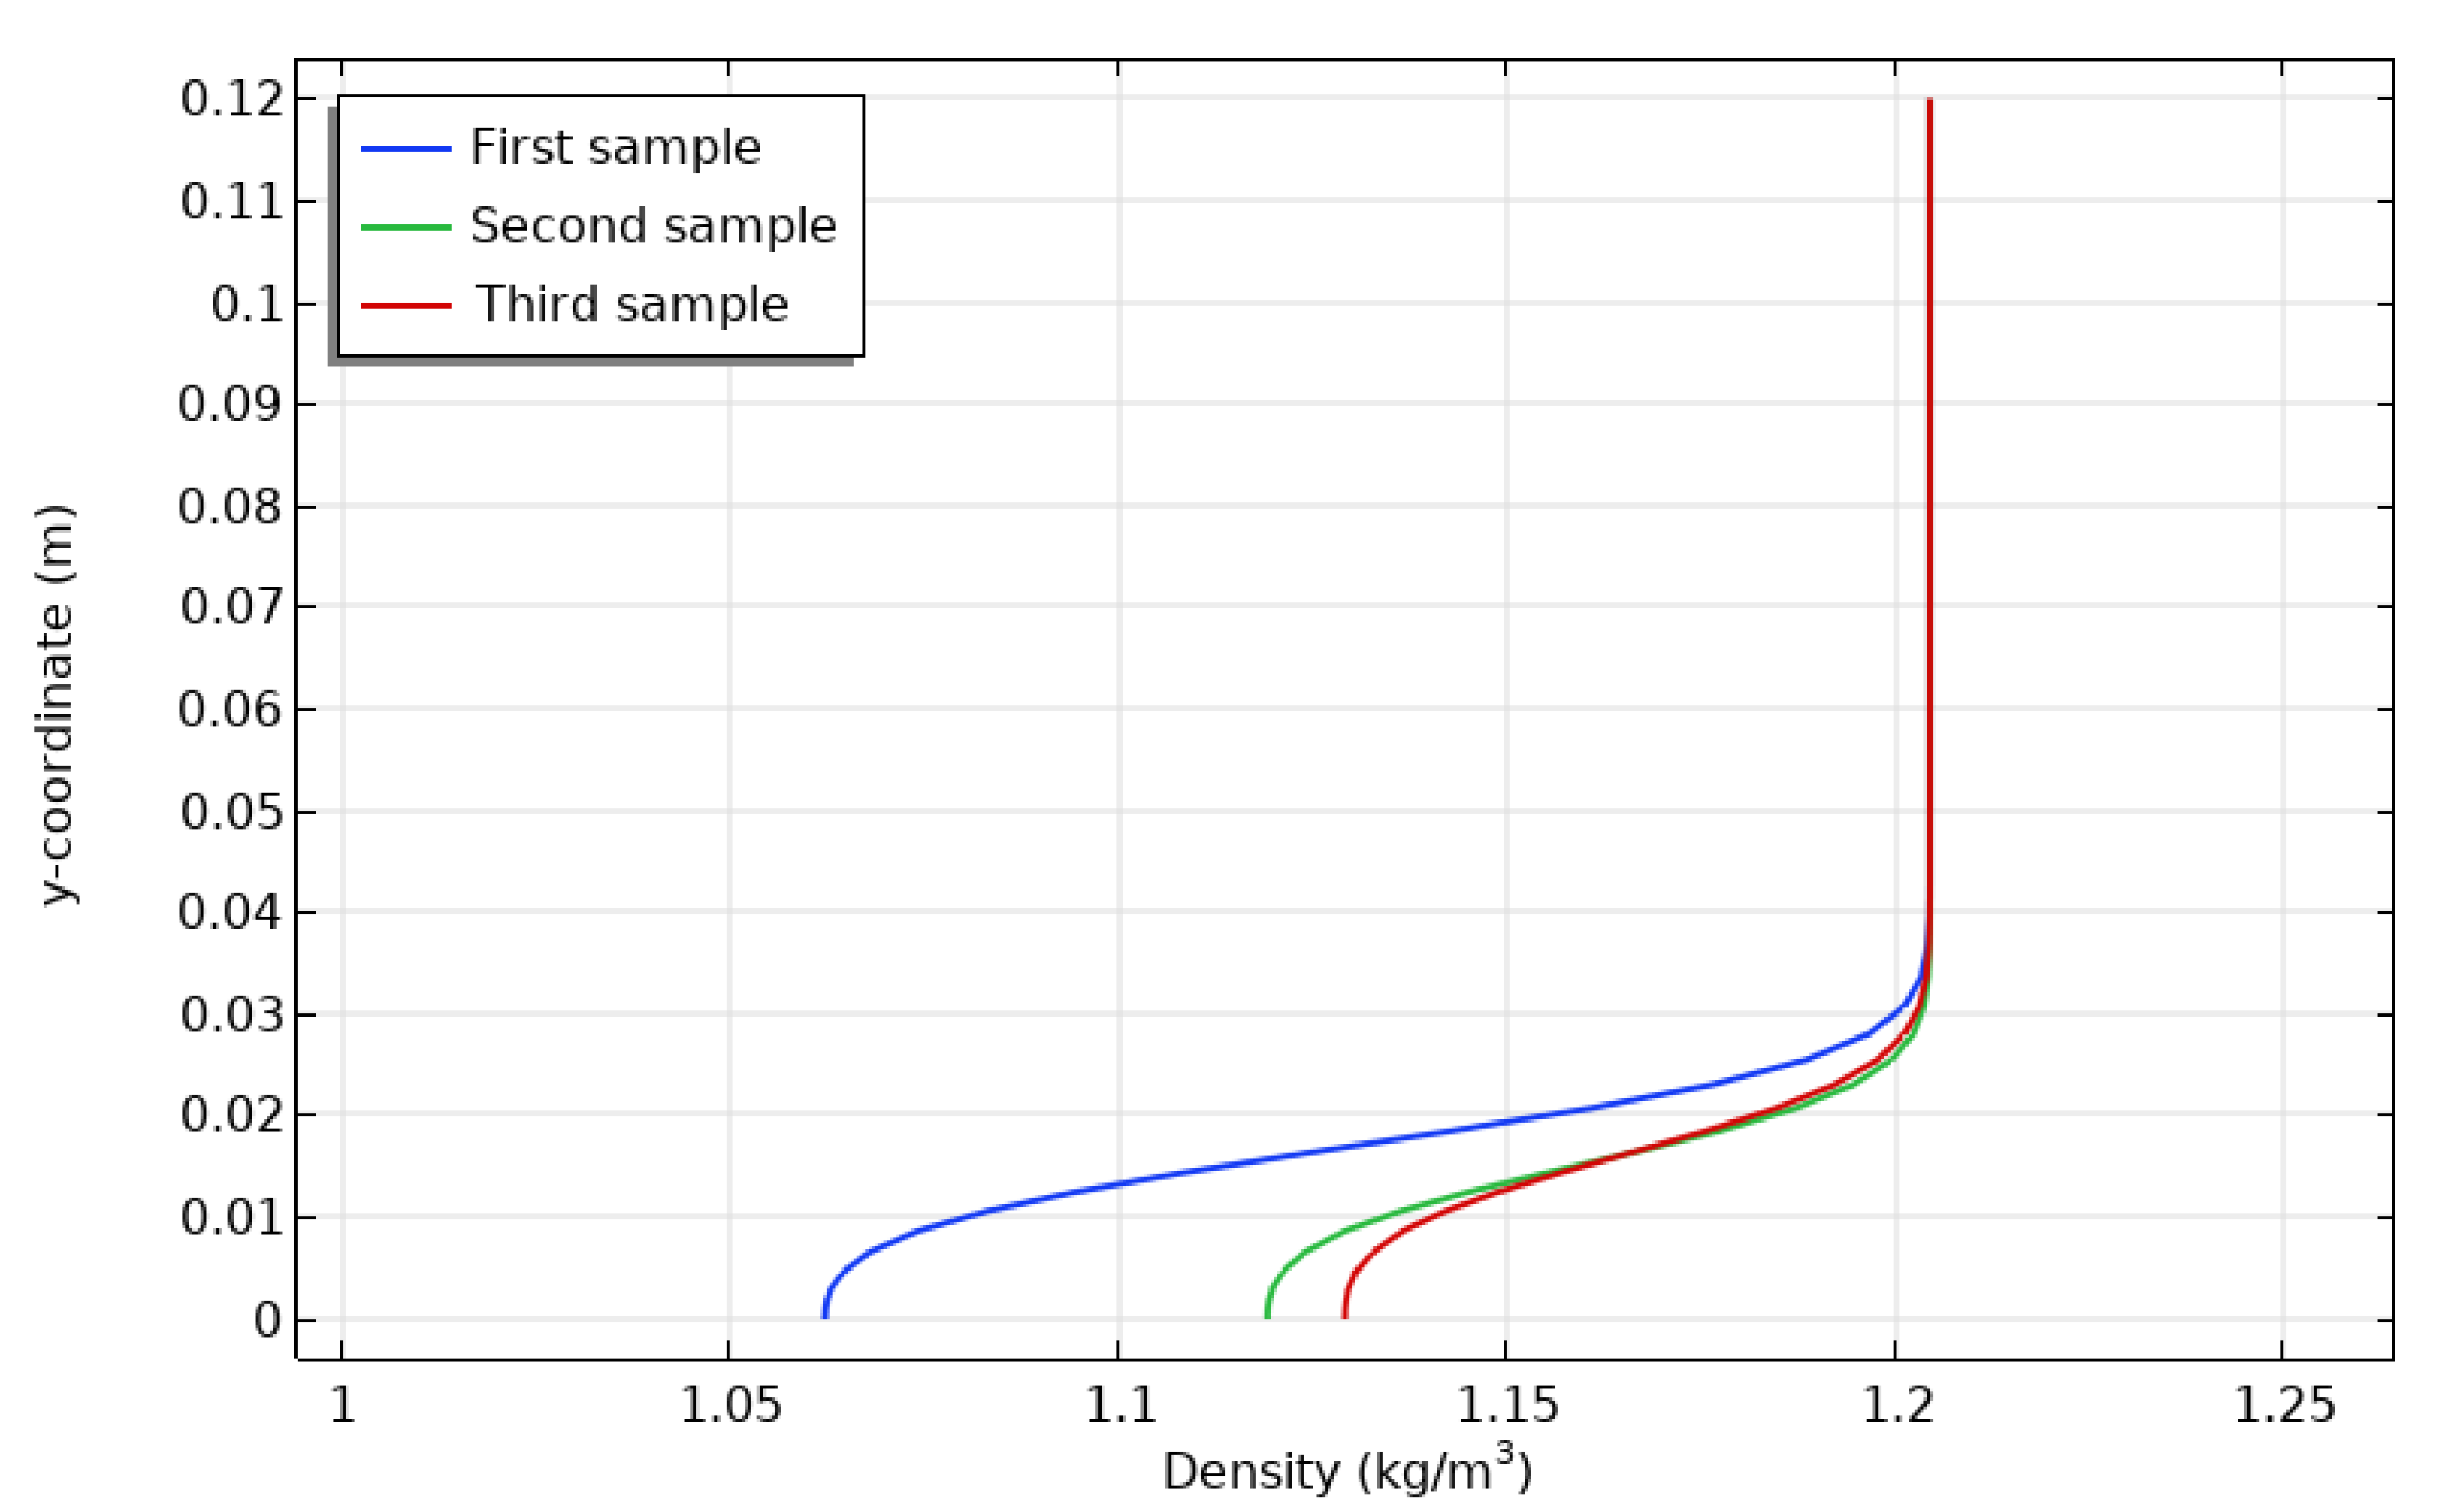
  • At y = 0.035 m, the air density profile began to differ from one case to another, the third case had the largest value than the second, and the latter had the largest value in density distribution than the first case.
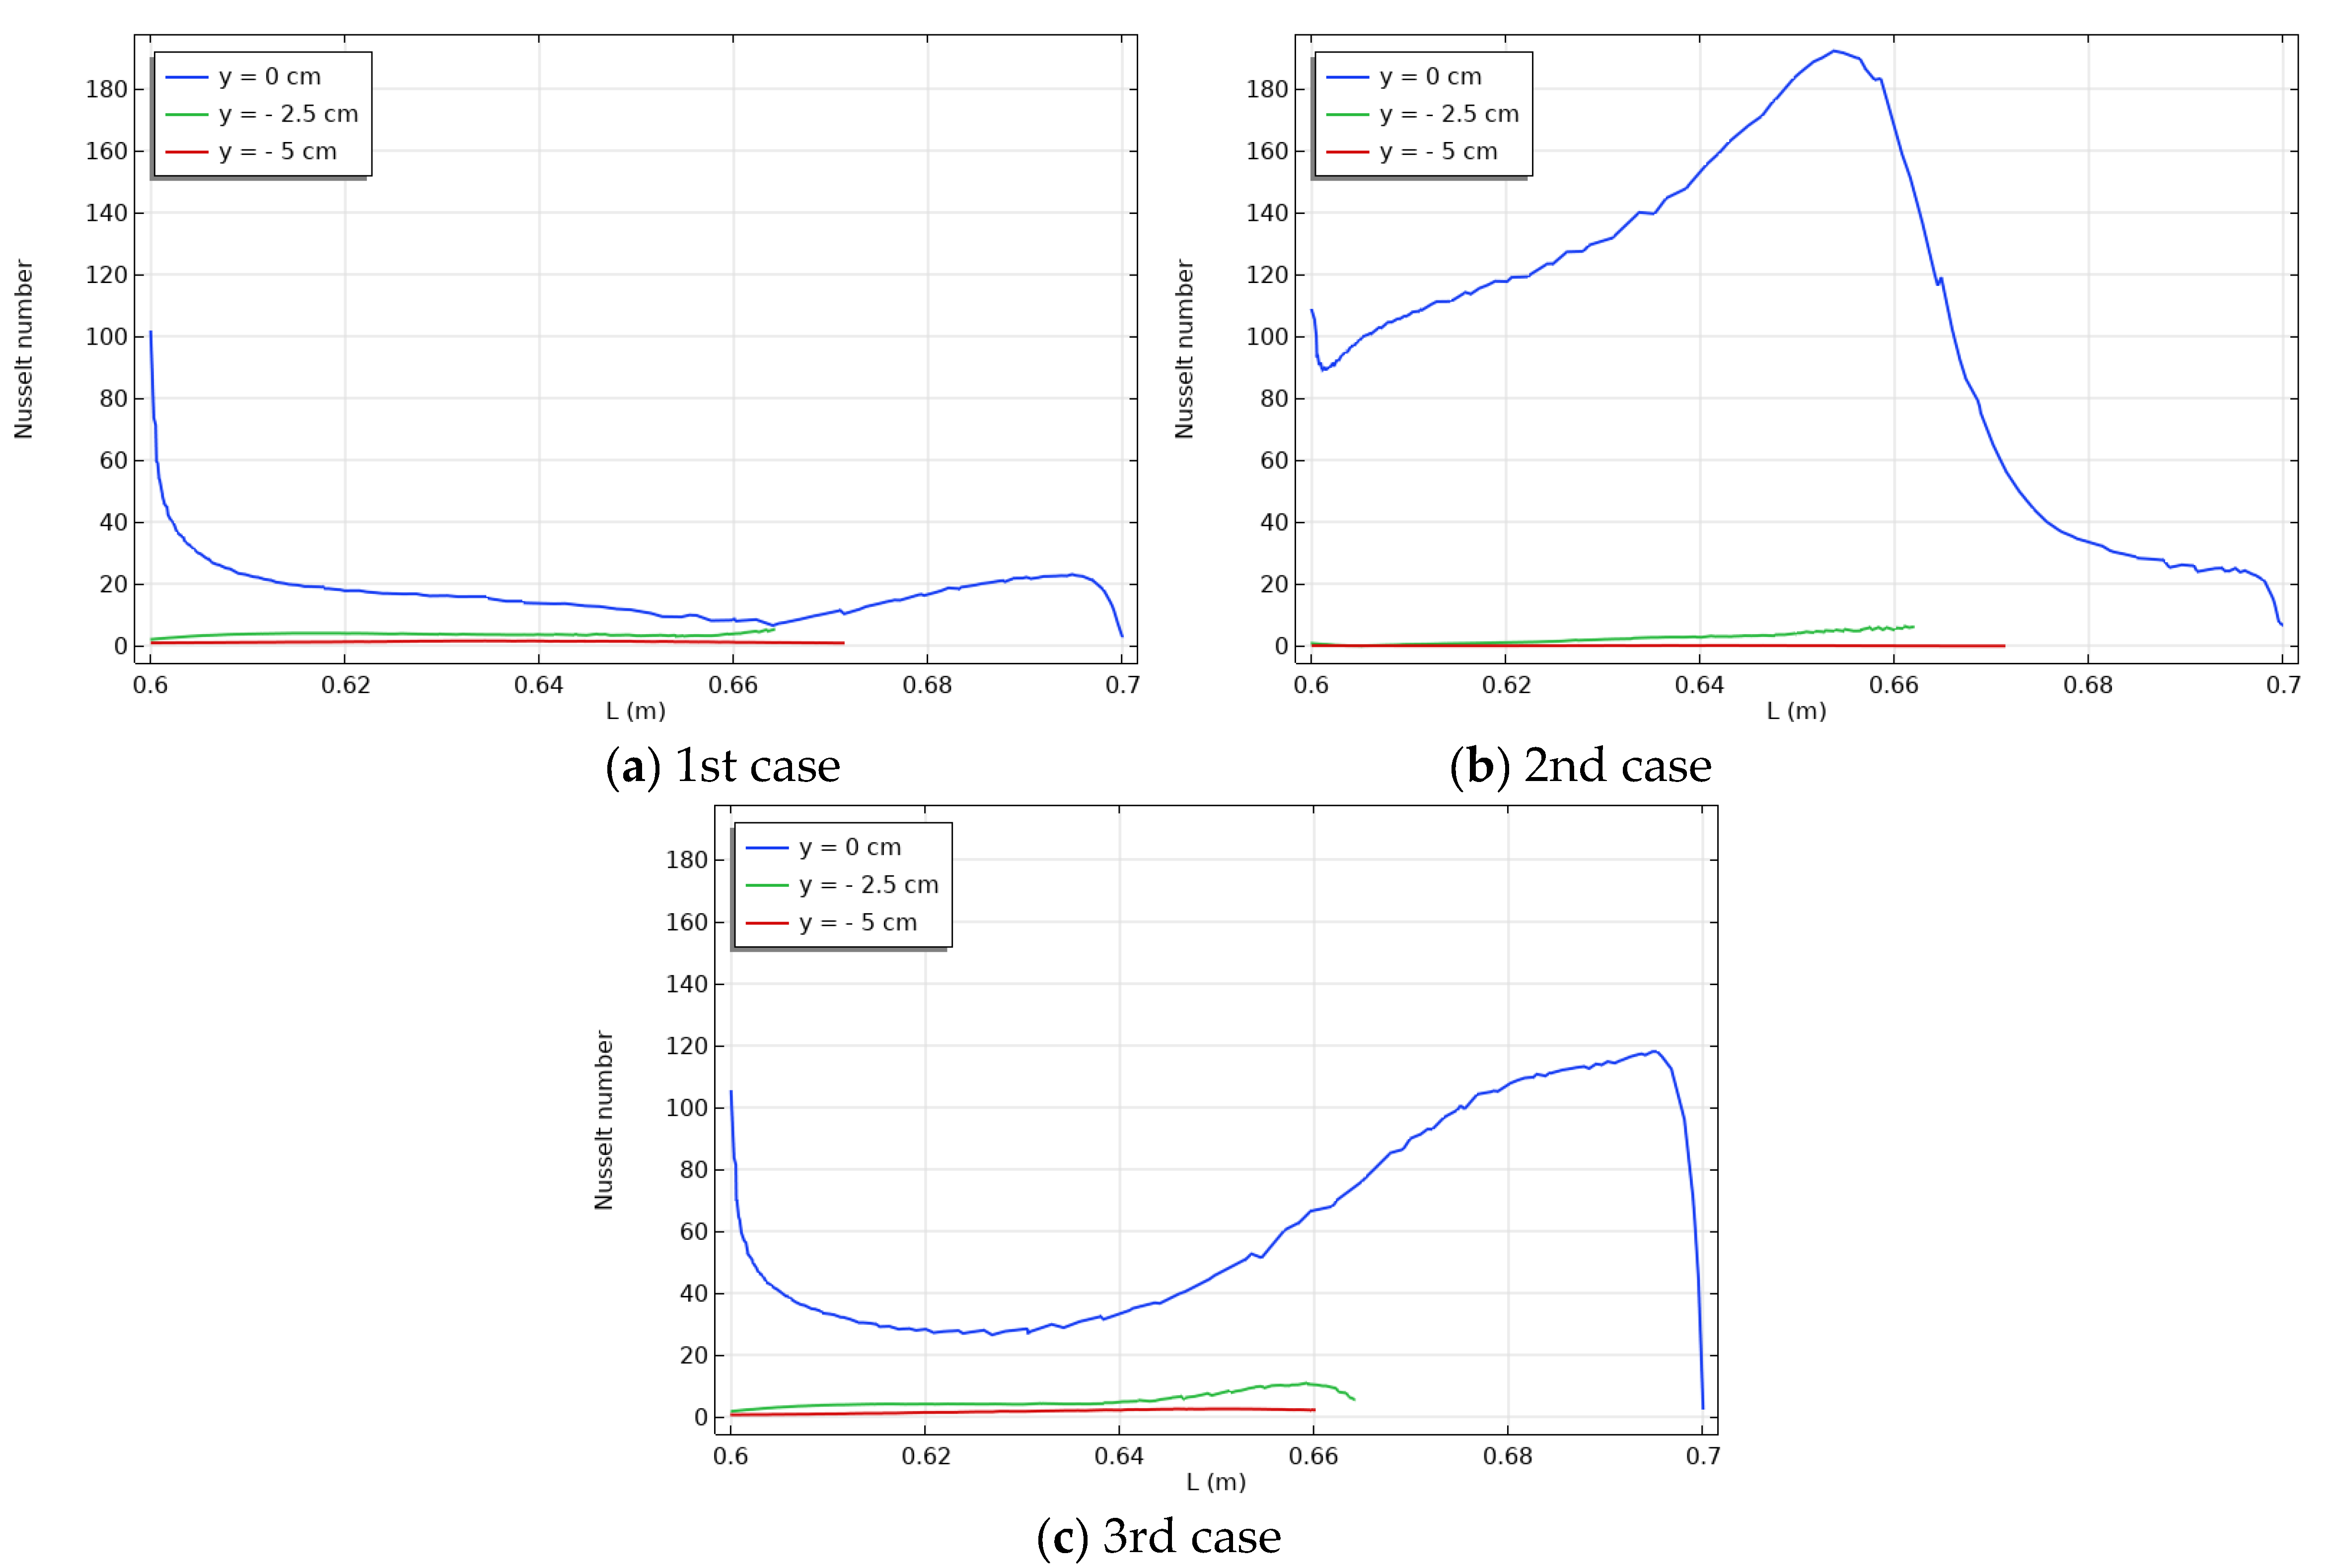
  • The highest heat transmission occurred at the interface between the enclosure and the channel (y = 0), where the maximum Nusselt number also occurred. As y increased in absolute value, the maximum Nusselt number decreased.
  • First and third cases had the same pressure distribution, while the second case caused more recirculating streamlines than the other cases because the air stream impinged with the heat source and thus increased the recirculation of the air stream at this zone.
  • The three cases had the same local velocity distribution, except at the first half of the enclosure, where the first case had a larger local velocity than the third case, and the second case had the lowest local velocity.
  • The investigation of the influence of magnetic field, tilt angle, vibration, and oscillation on mixed convection heat transfer in a channel–cavity assembly will be the focus of future work related to this research project.

Author Contributions

Methodology, B.A.; Validation, A.M.R.A.-G. and M.A.; Formal analysis, J.D.C.; Resources, J.D.C.; Writing—original draft, F.L.R.; Writing—review & editing, N.A.S. All authors have read and agreed to the published version of the manuscript.

Funding

This research received no external funding.

Data Availability Statement

All the data is available within the manuscript.

Acknowledgments

This work was supported by Korea Institute of Energy Technology Evaluation and Planning (KETEP) grant funded by the Korea government (MOTIE) (20202020900060, The Development and Application of Operational Technology in Smart Farm Utilizing Waste Heat from Particulates Reduced Smokestack).

Conflicts of Interest

The authors declare no conflict of interest.

Nomenclature

SymbolDefinition (unit)
DTube diameter (m)
LTube length (m)
WCavity width (m)
HCavity height (m)
rSpherical radius of heat source in cavity (m)
TinInlet temperature of flow (K)
VFlow velocity (m/s)
PwHeat power source in cavity (W)
ReReynolds number (--)
RiRichardson number (--)
PrPrandtl number (--)
NuNusselt number (--)
gGravitational acceleration (m/s2)
PPressure (Pa)
QHeat flux (W/m2)
Greek Symbols
SymbolDefinition
ρ Air Density (kg/m3)
v Viscosity (kinematic) of air (m2/s)
μ viscosity (dynamic) of air (kg/m.s)
ε Localized heat source Dimensionless length
θ Dimensionless temperature
β Thermal expansion coefficient (1/K)
α Air thermal diffusivity (m2/s)
Subscripts
SymbolDefinition
inInlet
hHot
cCold
avgAverage

References

  1. Mebarek-Oudina, F.; Bessaïh, R. Oscillatory mixed convection flow in a cylindrical container with rotating disk under axial magnetic field and various wall electrical conductivity. Int. Rev. Phys. 2010, 4, 45–51. [Google Scholar]
  2. Mebarek-Oudina, F.; Bessaïh, R. Numerical modeling of MHD stability in a cylindrical configuration. J. Frankl. Inst. 2014, 351, 667–681. [Google Scholar] [CrossRef]
  3. Abderrahmane, A.; Qasem, N.A.A.; Younis, O.; Marzouki, R.; Mourad, A.; Shah, N.A.; Chung, J.D. MHD Hybrid Nanofluid Mixed Convection Heat Transfer and Entropy Generation in a 3-D Triangular Porous Cavity with Zigzag Wall and Rotating Cylinder. Mathematics 2022, 10, 769. [Google Scholar] [CrossRef]
  4. Sajjan, K.; Shah, N.A.; Ahammad, N.A.; Raju, C.S.K.; Kumar, M.D.; Weera, W. Nonlinear Boussinesq and Rosseland approximations on 3D flow in an interruption of Ternary nanoparticles with various shapes of densities and conductivity properties. AIMS Math. 2022, 7, 18416–18449. [Google Scholar] [CrossRef]
  5. Kumar, M.D.; Raju, C.S.K.; Sajjan, K.; El-Zahar, E.R.; Shah, N.A. Linear and quadratic convection on 3D flow with transpiration and hybrid nanoparticles. Int. Commun. Heat Mass Transfer 2022, 134, 105995. [Google Scholar] [CrossRef]
  6. Mebarek-Oudina, F. Convective heat transfer of Titania nanofluids of different base fluids in cylindrical annulus with discrete heat source. Heat Transfer—Asian Res. 2019, 48, 135–147. [Google Scholar] [CrossRef] [Green Version]
  7. Younis, O.; Rashid, F.; Khalaf, A.; Hussein, A.; Ben Hamida, M.; Ali, B. Thermal-hydraulic analysis of transient conjugate heating between hemi-spherical body and air. Front. Heat Mass Transf. (FHMT) 2022, 19, 21. [Google Scholar] [CrossRef]
  8. Salhi, J.E.; Amghar, K.; Bouali, H.; Salhi, N. Combined Heat and Mass Transfer of Fluid Flowing through Horizontal Channel by Turbulent Forced Convection. Model. Simul. Eng. 2020, 2020, 1453893. [Google Scholar] [CrossRef]
  9. Younis, O.; Rashid, F.; Fakhrulddin, S.; Eleiwi, M.; Hussein, A.; Tahseen, T.; Ahmed, M. CFD Simulation In Thermal-Hydraulic Analysis of Air Flow on Different Attack Angles of Row Flat Tube. Front. Heat Mass Transf. (FHMT) 2022, 19, 6. [Google Scholar] [CrossRef]
  10. Ahmadinejad, M.; Soleimani, A.; Gerami, A. Performance enhancement of a photovoltaic thermal (PVT) system with sinusoidal fins: A quasi-transient energy-exergy analysis. Int. J. Green Energy 2022, 2131, 434. [Google Scholar] [CrossRef]
  11. Al-Jibory, M.W.; Rashid, F.L.; Talib, S.M. Numerical Investigation of Heat Transfer Enhancement in Ribbed Elliptical Passage. J. Eng. Appl. Sci. 2018, 13, 7223–7234. [Google Scholar]
  12. Cha, C.K.; Jaluria, Y. Recirculating mixed convection flow for energy extraction. Int. J. Heat Mass Transf. 1984, 27, 1801–1810. [Google Scholar] [CrossRef]
  13. Imberger, J.; Hamblin, P.F. Dynamics of lake reservoirs and cooling ponds, Annu. Rev. Fluid Mech. 1982, 14, 153–187. [Google Scholar] [CrossRef]
  14. Ideriah, F.J.K. Prediction of turbulent cavity flow driven by buoyancy and shear. J. Mech. Engng. Sci. 1980, 22, 287–295. [Google Scholar] [CrossRef]
  15. Pilkington, L.A.B. Review lecture: The float glass process. Proc. R. Soc. Lond. A 1969, 314, 1–25. [Google Scholar]
  16. Schriber, R.; Keller, H.B. Driven cavity flows by efficient numerical techniques. J. Comput. Phys. 1983, 49, 310–333. [Google Scholar] [CrossRef]
  17. Thompson, M.C.; Ferziger, J.H. An adaptive multigrid technique for the incompressible Navier–Stokes equations. J. Comput. Phys. 1989, 82, 94–121. [Google Scholar] [CrossRef]
  18. Abd Al-Hassan, A.Q.; Ismael, M.A. Numerical Study of Double Diffusive Mixed Convection in Horizontal Channel with Composite Opeb Porous Cavity. Spec. Top. Rev. Porous Media Int. J. 2019, 10, 401–419. [Google Scholar] [CrossRef]
  19. Esfe, M.H.; Arani, A.A.A.; Niroumand, A.H.; Yan, W.M.; Karimipour, A. Mixed convection heat transfer from surface-mounted block heat sources in a horizontal channel with nanofluids. Int. J. Heat Mass Transf. 2015, 89, 783–791. [Google Scholar] [CrossRef]
  20. Rahul, K.C. Numerical Simulations of Mixed Convection from a Horizontal Channel with Radiating Heat Sources. Int. J. Eng. Res. Technol. 2017, 6, 49–57. [Google Scholar] [CrossRef]
  21. Sivasankaran, S.; Janagi, K. Numerical Study on Mixed Convection Flow and Energy Transfer in an Inclined Channel Cavity: Effect of Baffle Size. Math. Comput. Appl. 2022, 27, 9. [Google Scholar] [CrossRef]
  22. Mebarek-Oudina, F.; Laouira, H.; Aissa, A.; Hussein, A.K.; El Ganaoui, M. Convection Heat Transfer Analysis in a Channel with an Open Trapezoidal Cavity: Heat Source Locations effect. MATEC Web Conf. 2020, 330, 01006. [Google Scholar] [CrossRef]
  23. Bahlaoui, A.; Raji, A.; Hasnaoui, M.; Ouardi, C.; Naïmi, M.; Makayssi, T. Height Partition Effect on Combined Mixed Convection and Surface Radiation in a Vented Rectangular Cavity. J. Appl. Fluid Mech. 2011, 4, 89–96. [Google Scholar]
  24. Rajamohan, G.; Ramesh, N.; Kumar, P. Mixed convection and radiation studies on thermally developing laminar flow in a horizontal square channel with variable side heated wall. Int. J. Therm. Sci. 2019, 140, 298–307. [Google Scholar] [CrossRef]
  25. Gangawane, K.M.; Gupta, S. Mixed convection characteristics in rectangular enclosure containing heated elliptical block: Effect of direction of moving wall. Int. J. Therm. Sci. 2018, 130, 100–115. [Google Scholar] [CrossRef]
  26. Ding, G.; Li, N.; Liu, B.; Li, J.; Xiao, Y.; Gu, H. Numerical study of mixed and free convection heat transfer under ocean conditions. Int. J. Heat Mass Transf. 2023, 203, 123811. [Google Scholar] [CrossRef]
  27. Everts, M.; Mahdavi, M.; Meyer, J.P.; Sharifpur, M. Development of the hydrodynamic and thermal boundary layers of mixed convective laminar flow through a horizontal tube with a constant heat flux. Int. J. Therm. Sci. 2023, 187, 108178. [Google Scholar] [CrossRef]
  28. Zhang, Z.; Gao, F.; Wang, J. Mixed convection heat transfer and transient flow of high-pressure gas in a large-scale cavity with rotating blade. Int. J. Therm. Sci. 2023, 187, 108205. [Google Scholar] [CrossRef]
  29. Moradi, R.; Mahyari, A.; Gerdroodbary, M.B.; Abdollahi, A.; Amini, Y. Shape effect of cavity flameholder on mixing zone of hydrogen jet at supersonic flow. Int. J. Hydrogen Energy 2018, 43, 16364–16372. [Google Scholar] [CrossRef]
  30. Yaseen, D.T.; Ismael, M.A. Effect of Deformable Baffle on the Mixed Convection of Non-Newtonian Fluids in a Channel-Cavity. Basrah J. Eng. Sci. 2020, 20, 18–26. [Google Scholar] [CrossRef]
  31. Li, Z.; Li, C. Non-Gaussian non-stationary wind pressure forecasting based on the improved empirical wavelet transform. J. Wind Eng. Ind. Aerodyn. 2018, 179, 541–557. [Google Scholar] [CrossRef]
  32. Perna, R.; Abela, M.; Mameli, M.; Mariotti, A.; Pietrasanta, L.; Marengo, M.; Filippeschi, S. Flow characterization of a pulsating heat pipe through the wavelet analysis of pressure signals. Appl. Therm. Eng. 2020, 171, 115128. [Google Scholar] [CrossRef]
  33. Ota, T.; Nishiyama, H.; Taoka, Y. Heat transfer and flow around an elliptic cylinder. Int. J. Heat Mass Transf. 1984, 27, 1771–1779. [Google Scholar]
  34. Howard, F.; Goodman, W. Axisymmetric bluff-body drag reduction through geometrical modification. J. Aircr. 1985, 22, 516–522. [Google Scholar] [CrossRef]
  35. Selby, G.V.; Lin, J.C.; Howard, F.G. Turbulent Flow Separation Control Over a Backward-Facing Ramp Via Transverse and Swept Grooves. J. Fluids Eng. 1990, 112, 238–240. [Google Scholar] [CrossRef]
  36. Ota, T.; Aiba, S.; Tsuruta, T.; Kaga, M. Forced convection heat transfer from an elliptical cylinder with axis ratio 1:3. Bull. JSME 1983, 26, 262–267. [Google Scholar] [CrossRef]
  37. Moallemi, M.K.; Jang, K.S. Prandtl number effects on laminar mixed convection heat transfer in a lid-driven cavity. Int. J. Heat Mass Transf. 1992, 35, 1881–1892. [Google Scholar] [CrossRef]
  38. Choi, S.U.S.; Siginer, D.A.; Wang, H.P. Enhancing Thermal Conductivity of Fluids with Nanoparticles Development and Applications of Non-Newtonian Flows; The American Society of Mechanical Engineers: New York, NY, USA, 1995; Volume 231, pp. 99–105. [Google Scholar]
  39. Liang, H.; You, S.; Zhang, H. Comparison of three optical models and analysis of geometric parameters for parabolic trough solar collectors. Energy 2016, 96, 37–47. [Google Scholar] [CrossRef]
  40. Bortolato, M.; Dugaria, S.; Col, D.D. Experimental study of a parabolic trough solar collector with flat bar-and-plate absorber during direct steam generation. Energy 2016, 116, 1039–1050. [Google Scholar] [CrossRef]
Figure 1. Schematic diagram of physical systems with geometric dimensions.
Mathematics 11 01428 g001
Figure 2. Mesh generation.
Mathematics 11 01428 g002
Figure 3. Isotherm contour map.
Mathematics 11 01428 g003
Figure 4. 2D passage temperature contours.
Mathematics 11 01428 g004
Figure 5. 2D Velocity contours.
Mathematics 11 01428 g005
Figure 6. Pressure streamline contour through the assembly.
Mathematics 11 01428 g006
Figure 7. Velocity distribution during the positive y axis in the assembly.
Mathematics 11 01428 g007
Figure 8. Pressure profile during the positive y axis in the assembly.
Mathematics 11 01428 g008
Figure 9. Temperature profile during the positive y axis in the assembly.
Mathematics 11 01428 g009
Figure 10. Velocity distribution during the negative y axis in the cavity.
Mathematics 11 01428 g010
Figure 11. Pressure profile during the negative y axis in the cavity.
Mathematics 11 01428 g011
Figure 12. Temperature profile during the negative y axis in the cavity.
Mathematics 11 01428 g012
Figure 13. Local Nusselt number during the negative y axis in the cavity.
Mathematics 11 01428 g013
Figure 14. Local velocity distribution in the channel–enclosure assembly.
Mathematics 11 01428 g014
Figure 15. Local pressure in the channel–enclosure assembly.
Mathematics 11 01428 g015
Figure 16. Local temperature in the channel–enclosure assembly.
Mathematics 11 01428 g016
Figure 17. Nusselt number in the channel–enclosure assembly.
Mathematics 11 01428 g017
Figure 18. Velocity profile in the outlet passage flow.
Mathematics 11 01428 g018
Figure 19. Temperature profile in the outlet passage flow.
Mathematics 11 01428 g019
Figure 20. Density profile in the outlet passage flow.
Mathematics 11 01428 g020
Table 1. Geometrical specifications and flow parameters.
SymbolValueDescription
D12 cmTube diameter
L80 cmTube length
W10 cmCavity width
H7 cmCavity height
r1.5 cmSpherical radius of heat source in cavity
Tin20 °CInlet temperature of flow
Vin0.1 m/sInlet velocity (Reynolds number = 2.8814)
Pw20 WHeat power source in cavity
Table 2. Test of grid independence for 0.1 m/s (Reynolds number = 2.8814) of intake air velocity.
Density of ComponentCaseNumber of Total CellVelocity Magnitude (m/s) V i + 1 V i V i %
0.1143,1570.082--
2160,0500.09212.195
3211,3000.0942.174
4292,5000.0951.064
0.2134,2200.062--
278,3400.07216.129
3137,5500.0742.778
4212,2000.0751.351
0.3141,1700.072--
261,5500.08213.889
3112,2000.0842.439
4182,0000.0840
Disclaimer/Publisher’s Note: The statements, opinions and data contained in all publications are solely those of the individual author(s) and contributor(s) and not of MDPI and/or the editor(s). MDPI and/or the editor(s) disclaim responsibility for any injury to people or property resulting from any ideas, methods, instructions or products referred to in the content.

