
Influence of Platen Stiffness on the Contact Stress Distribution in the Standardized Uniaxial Compression Test
 , and
, and
Abstract
:1. Introduction
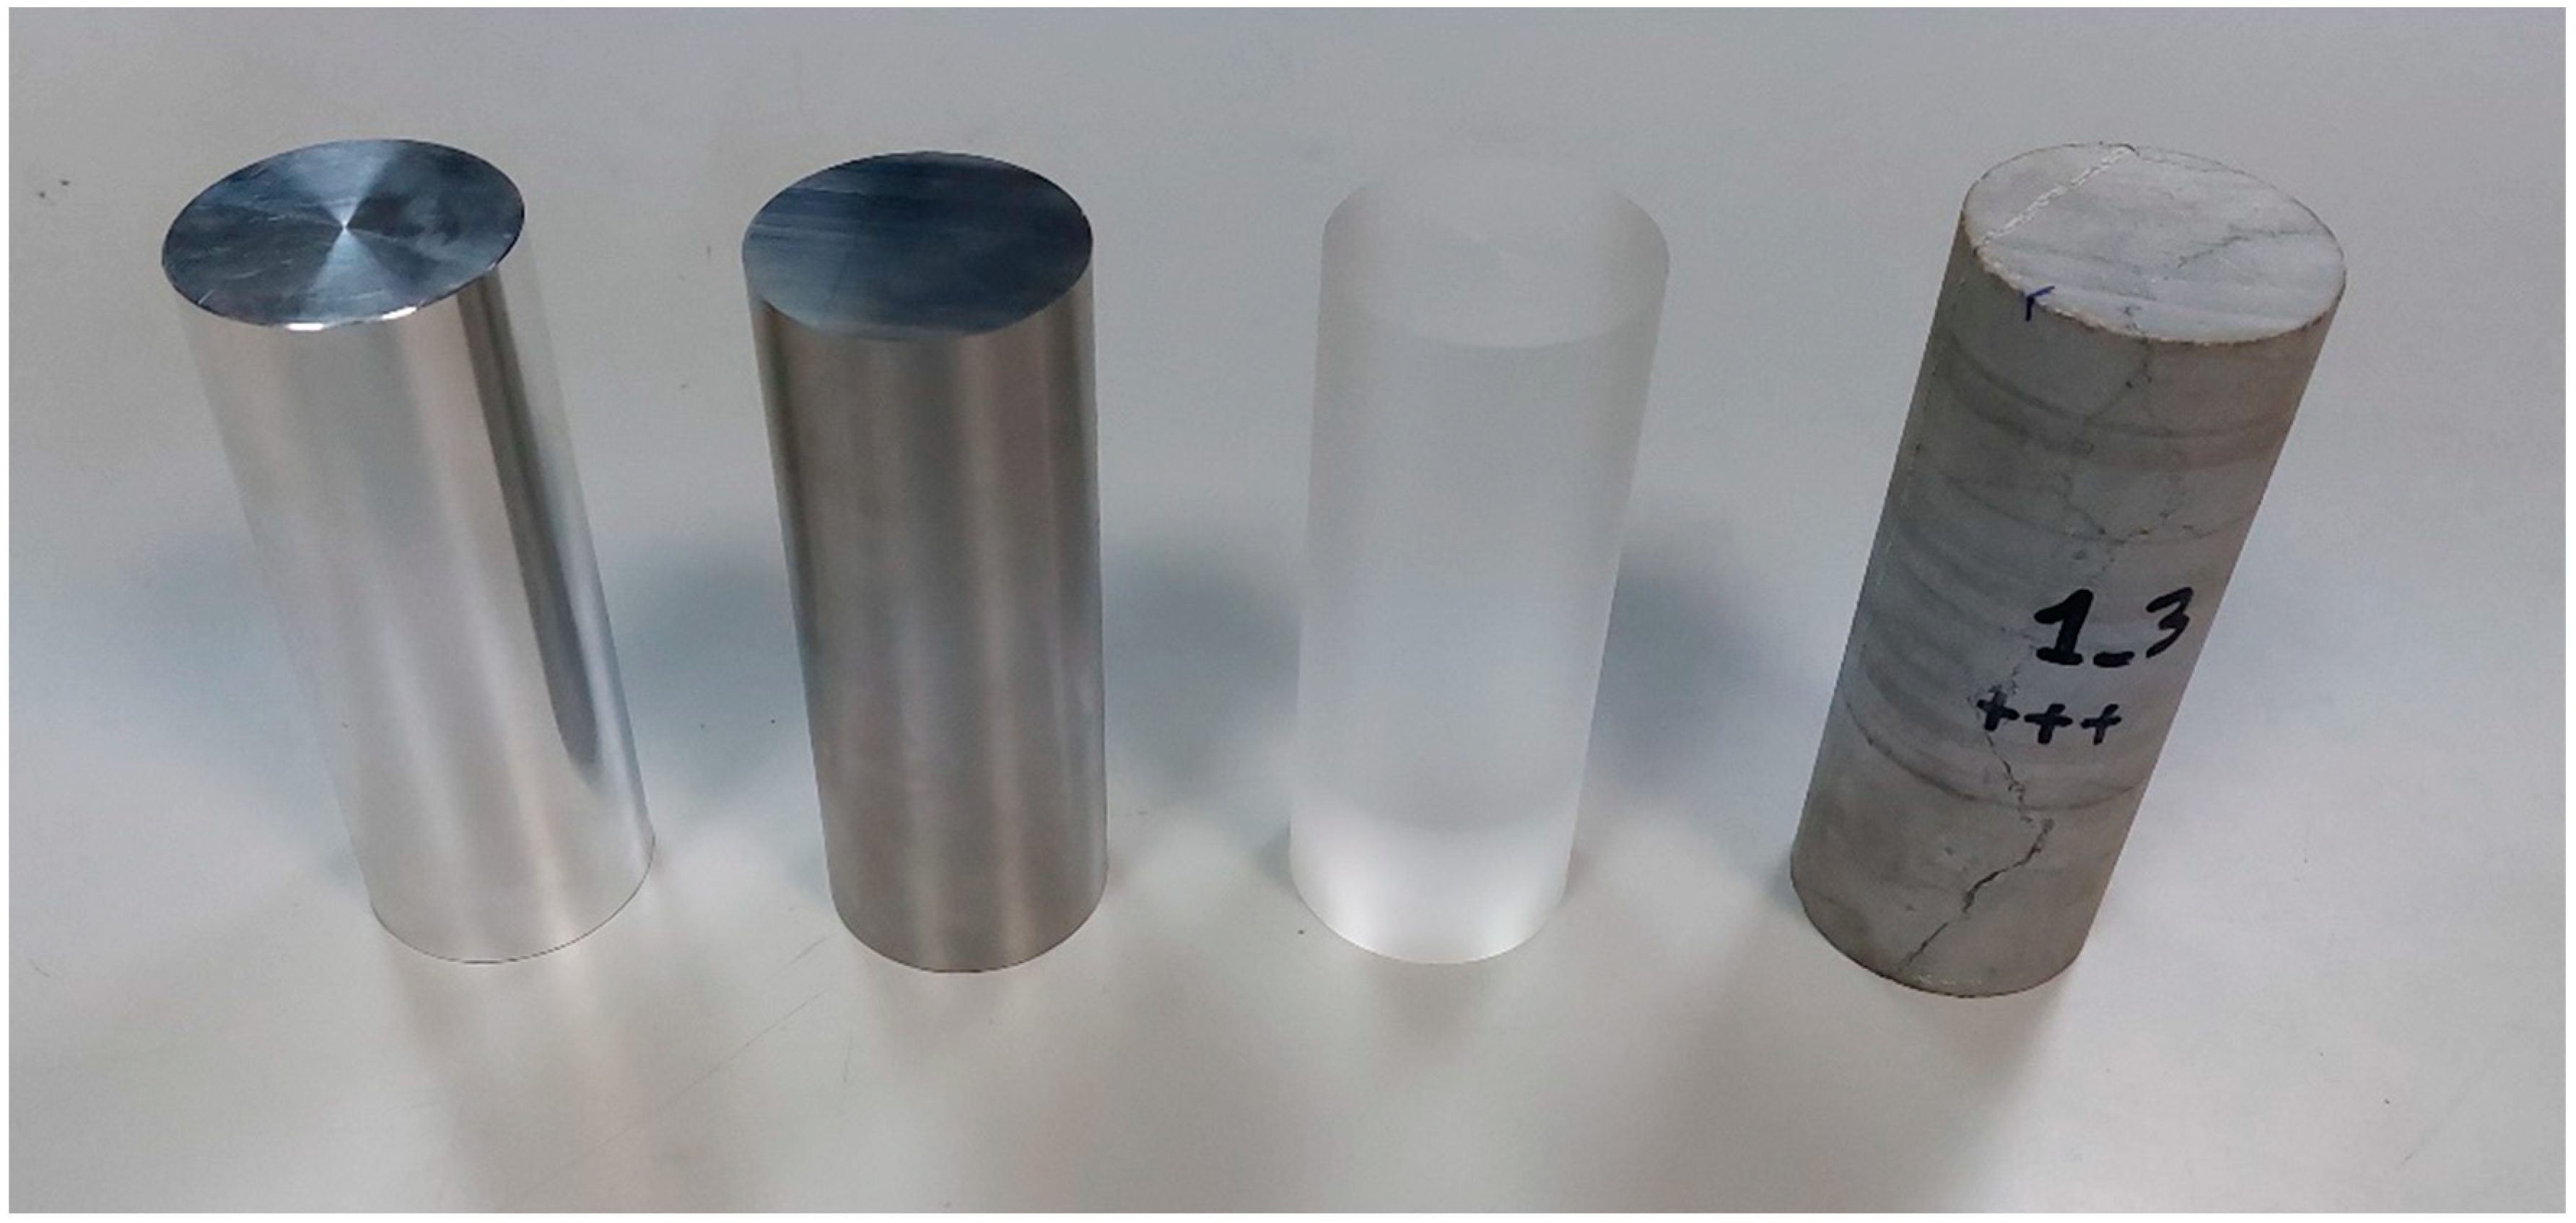
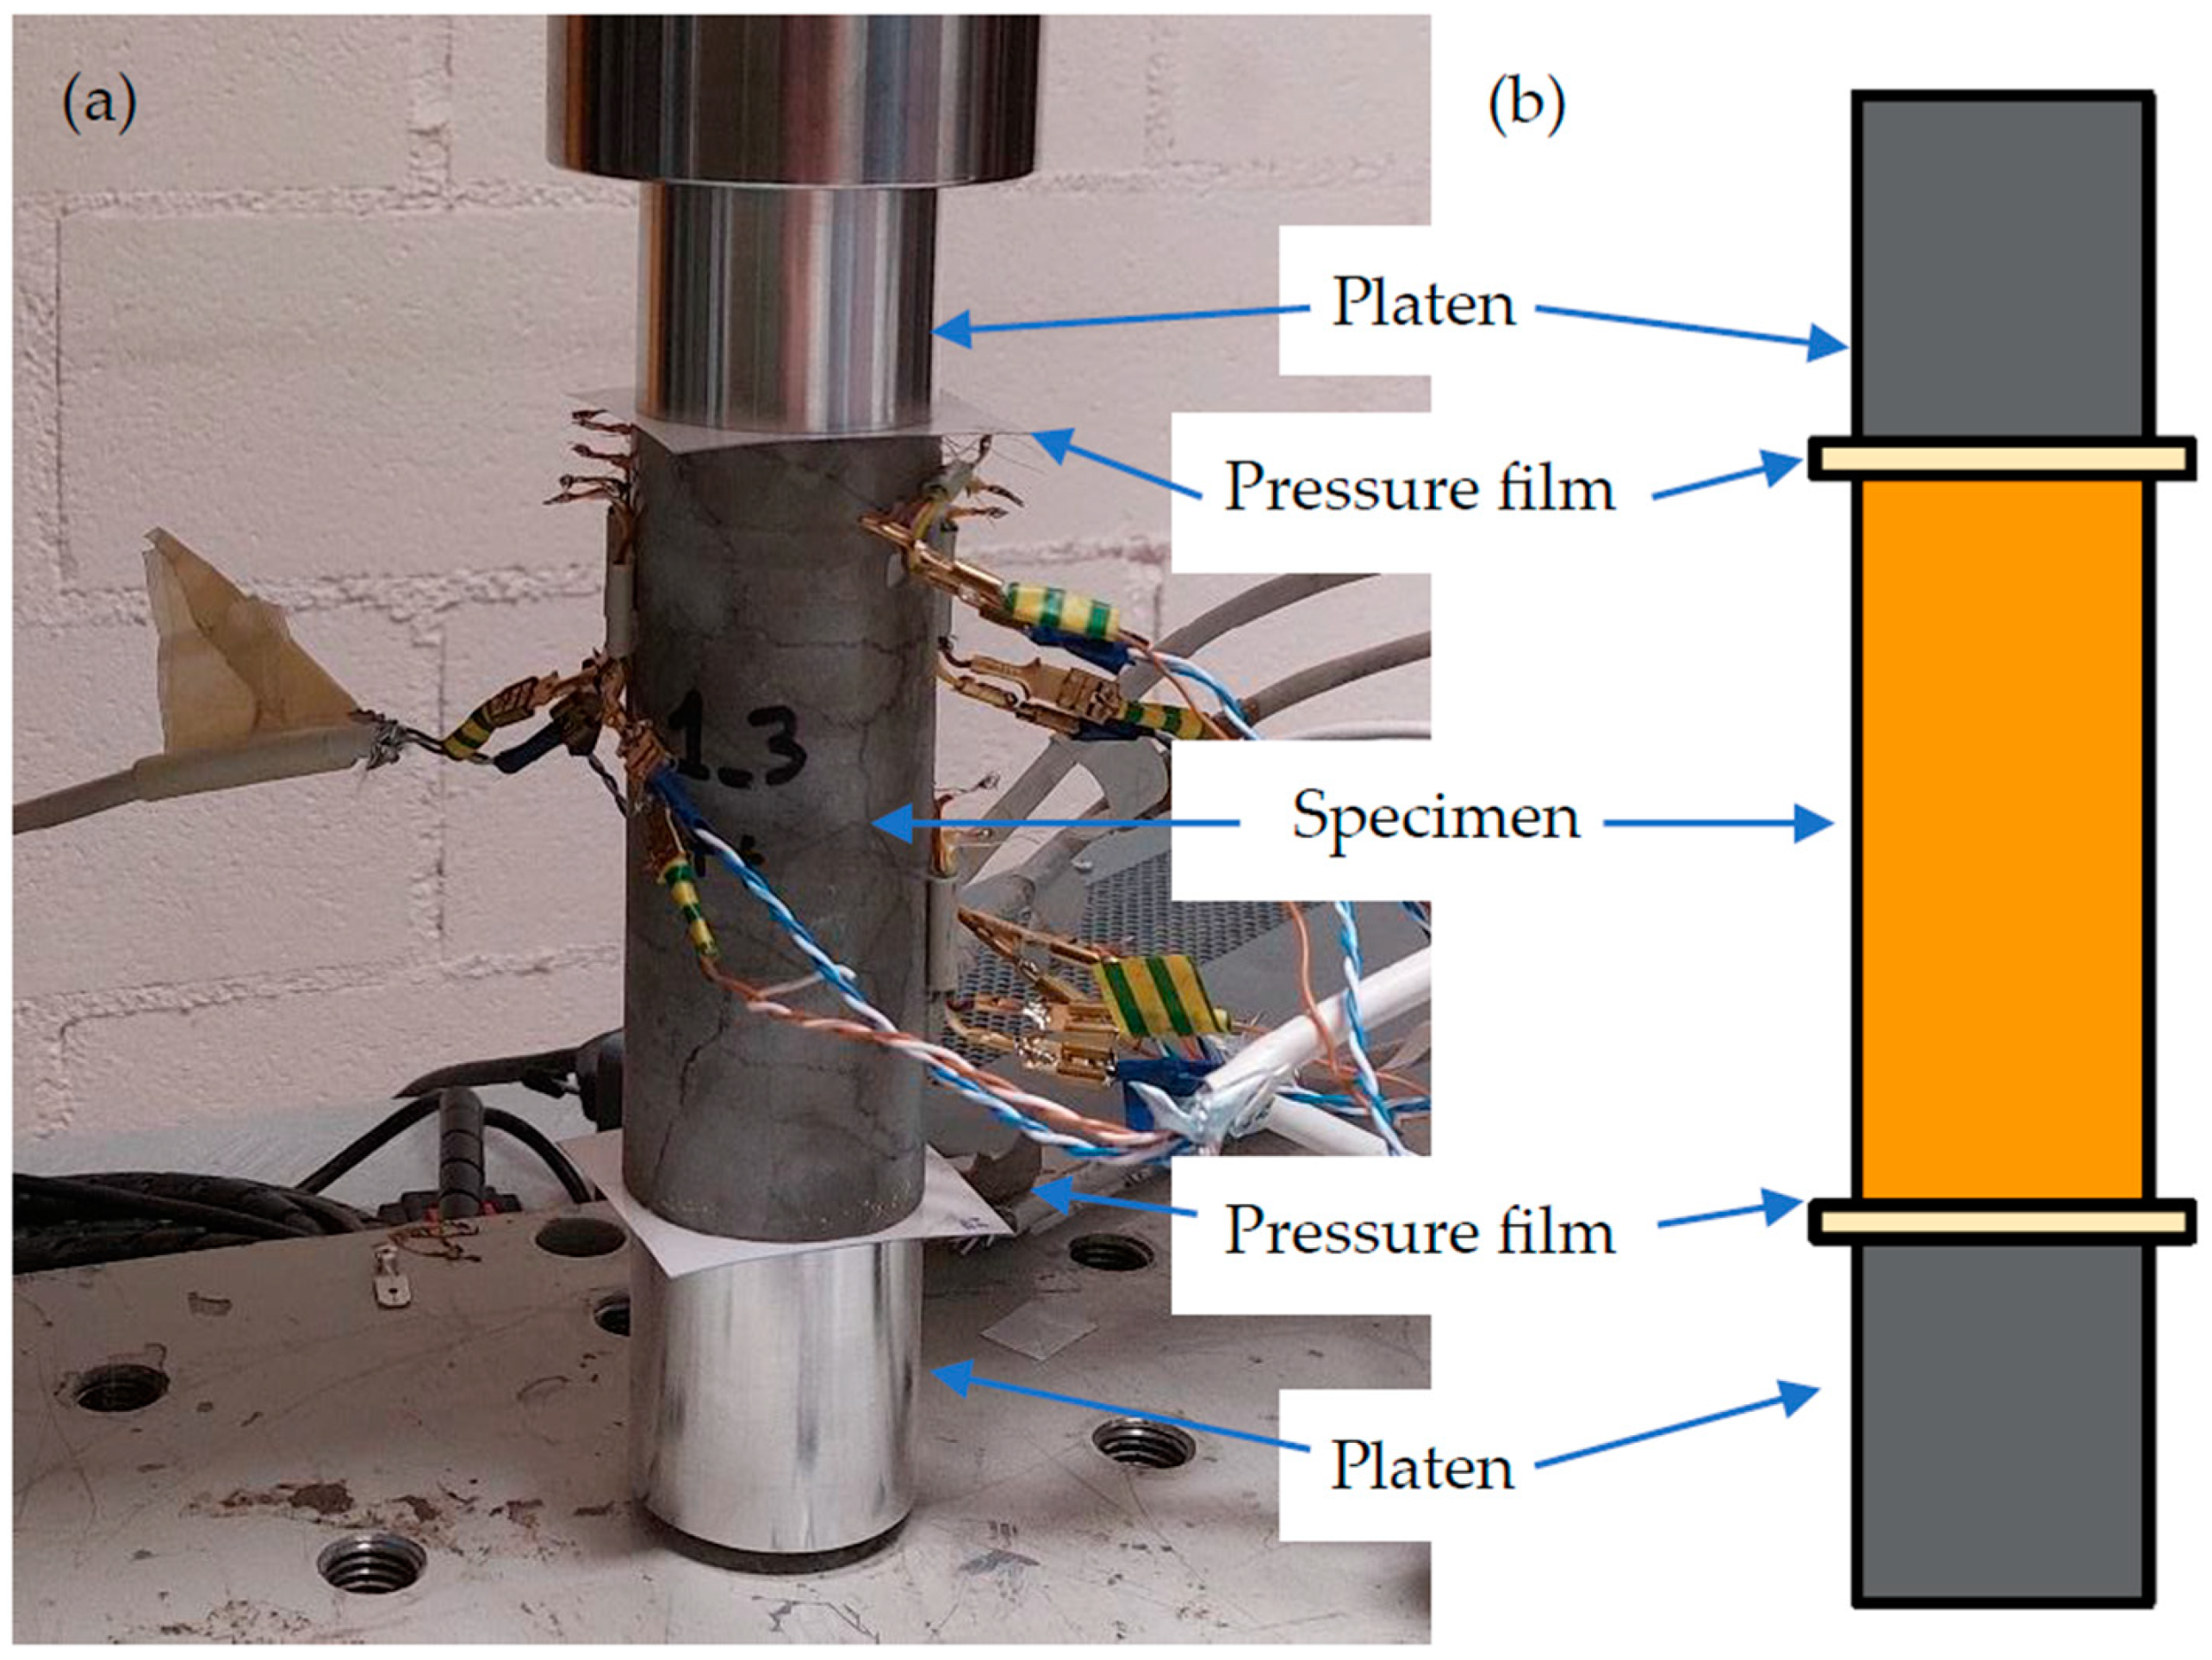
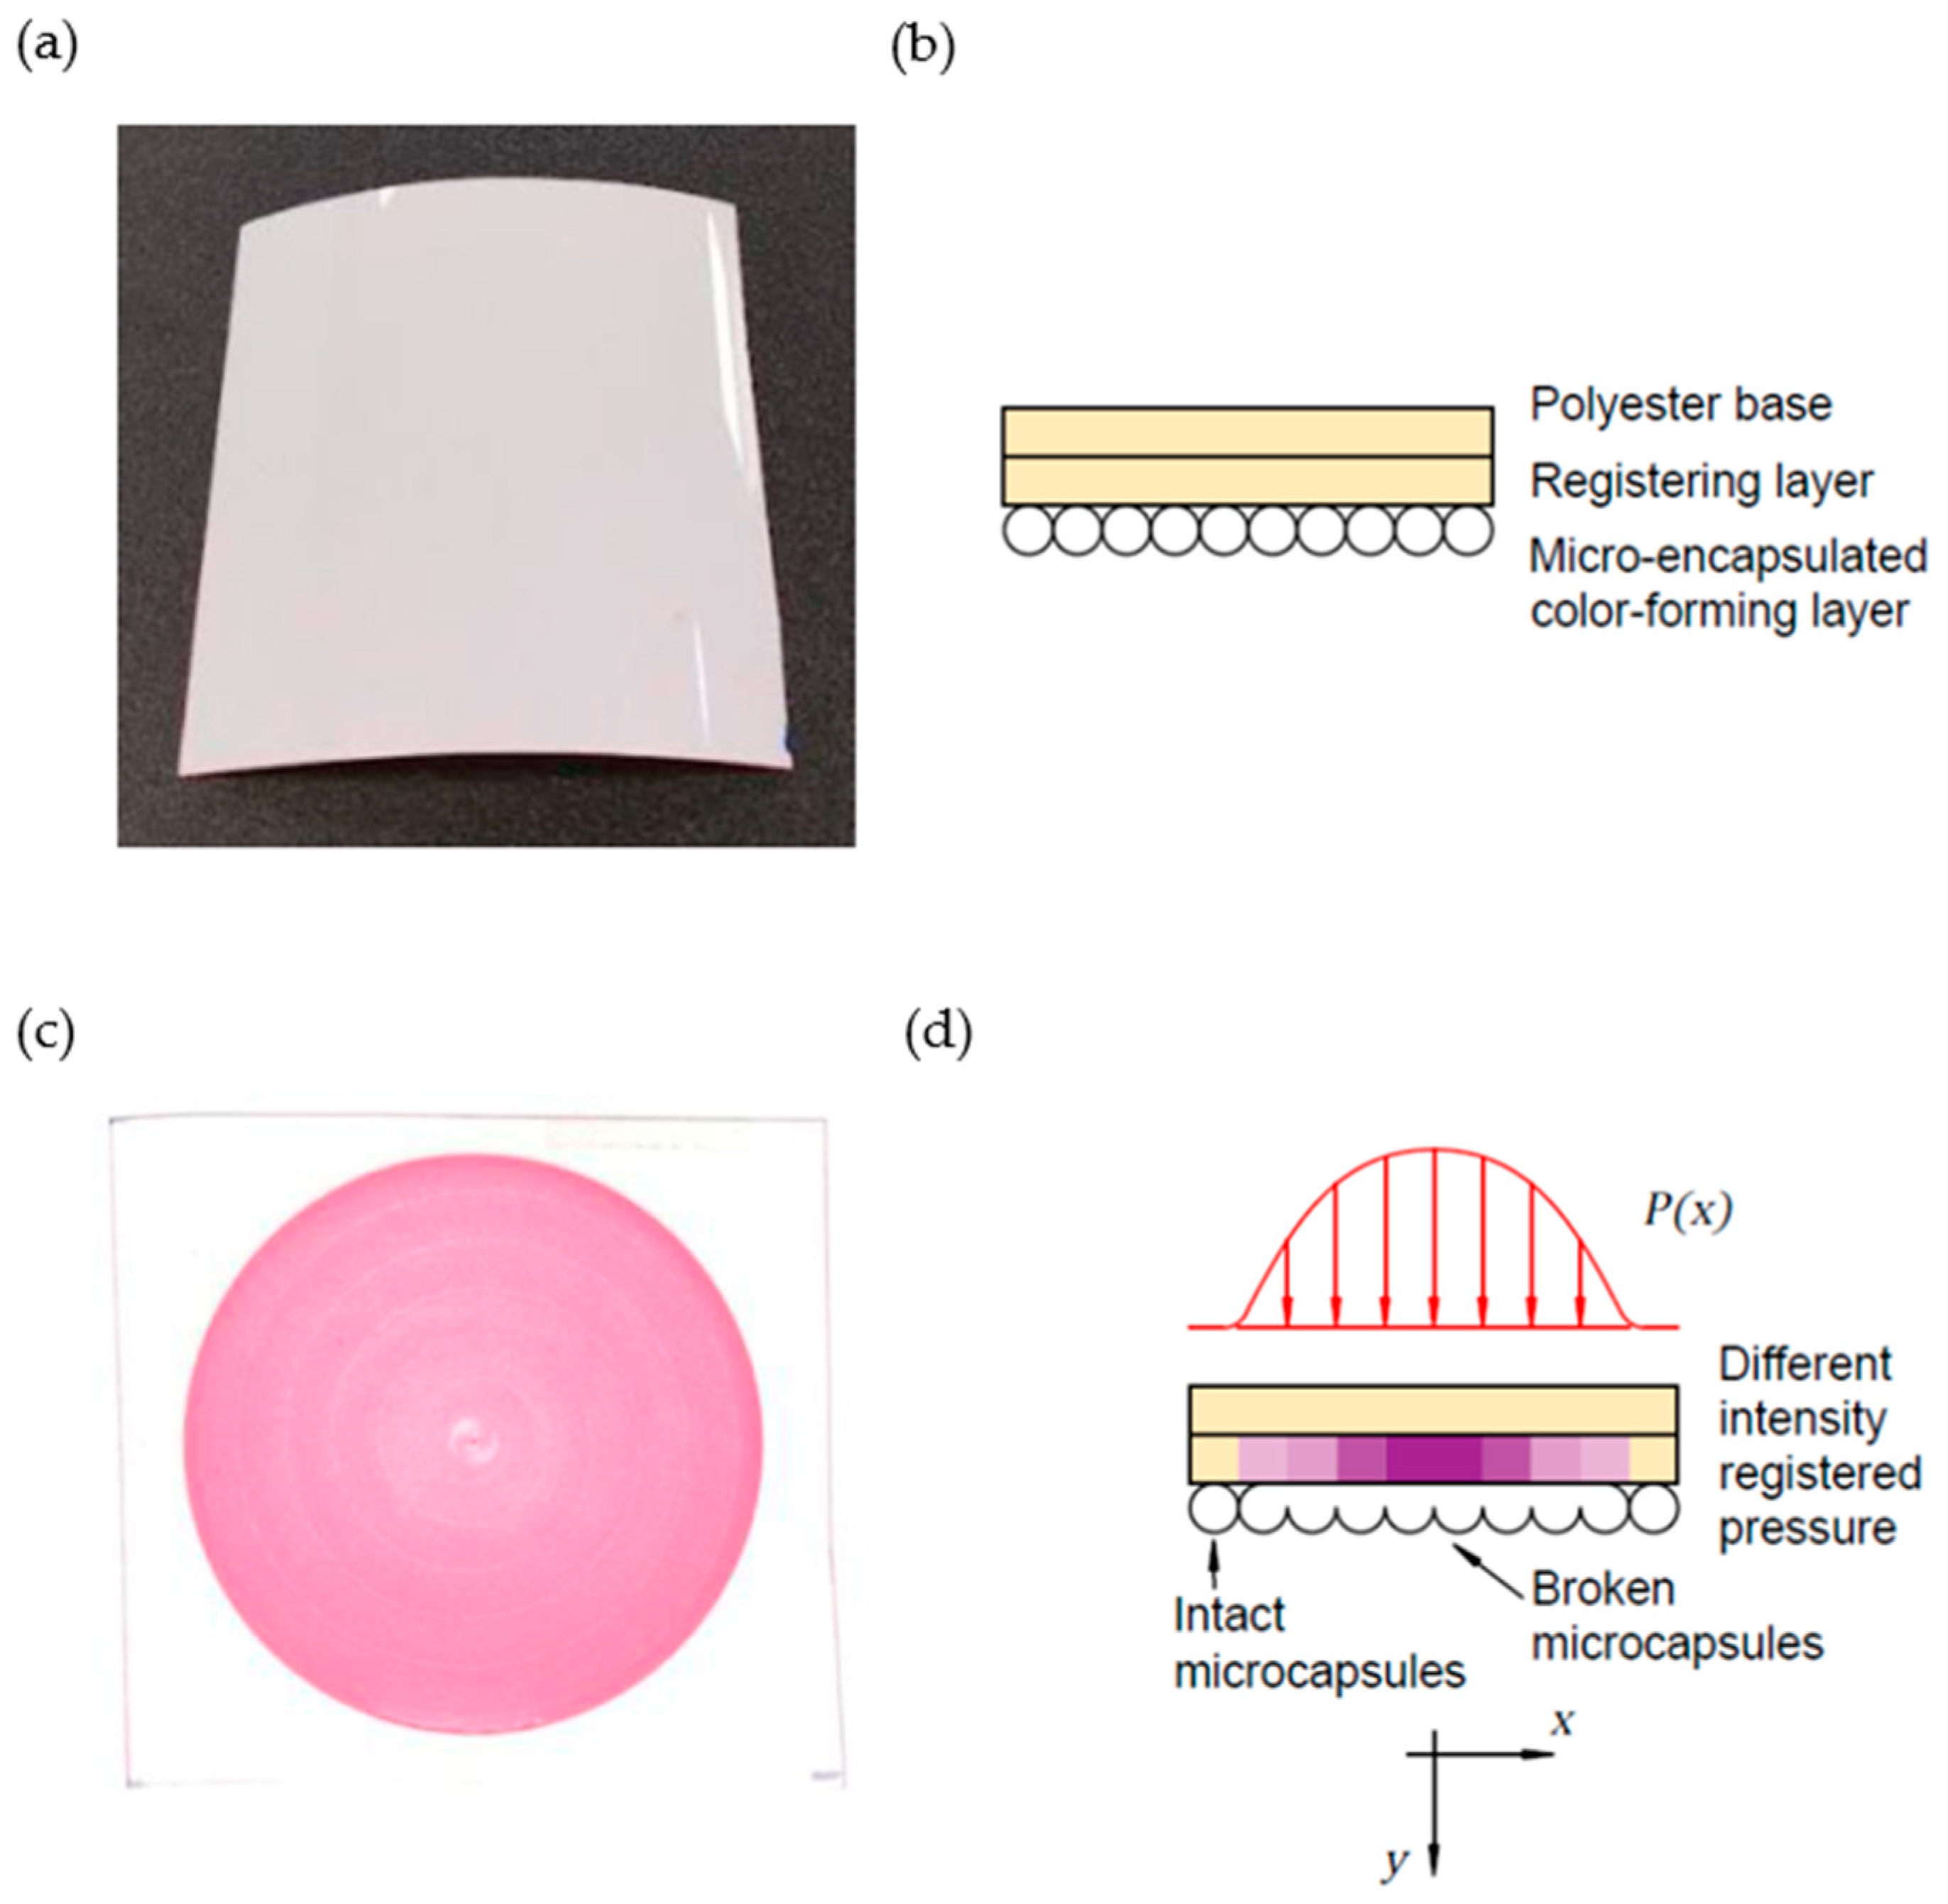
2. Testing Methodology
3. Test Results
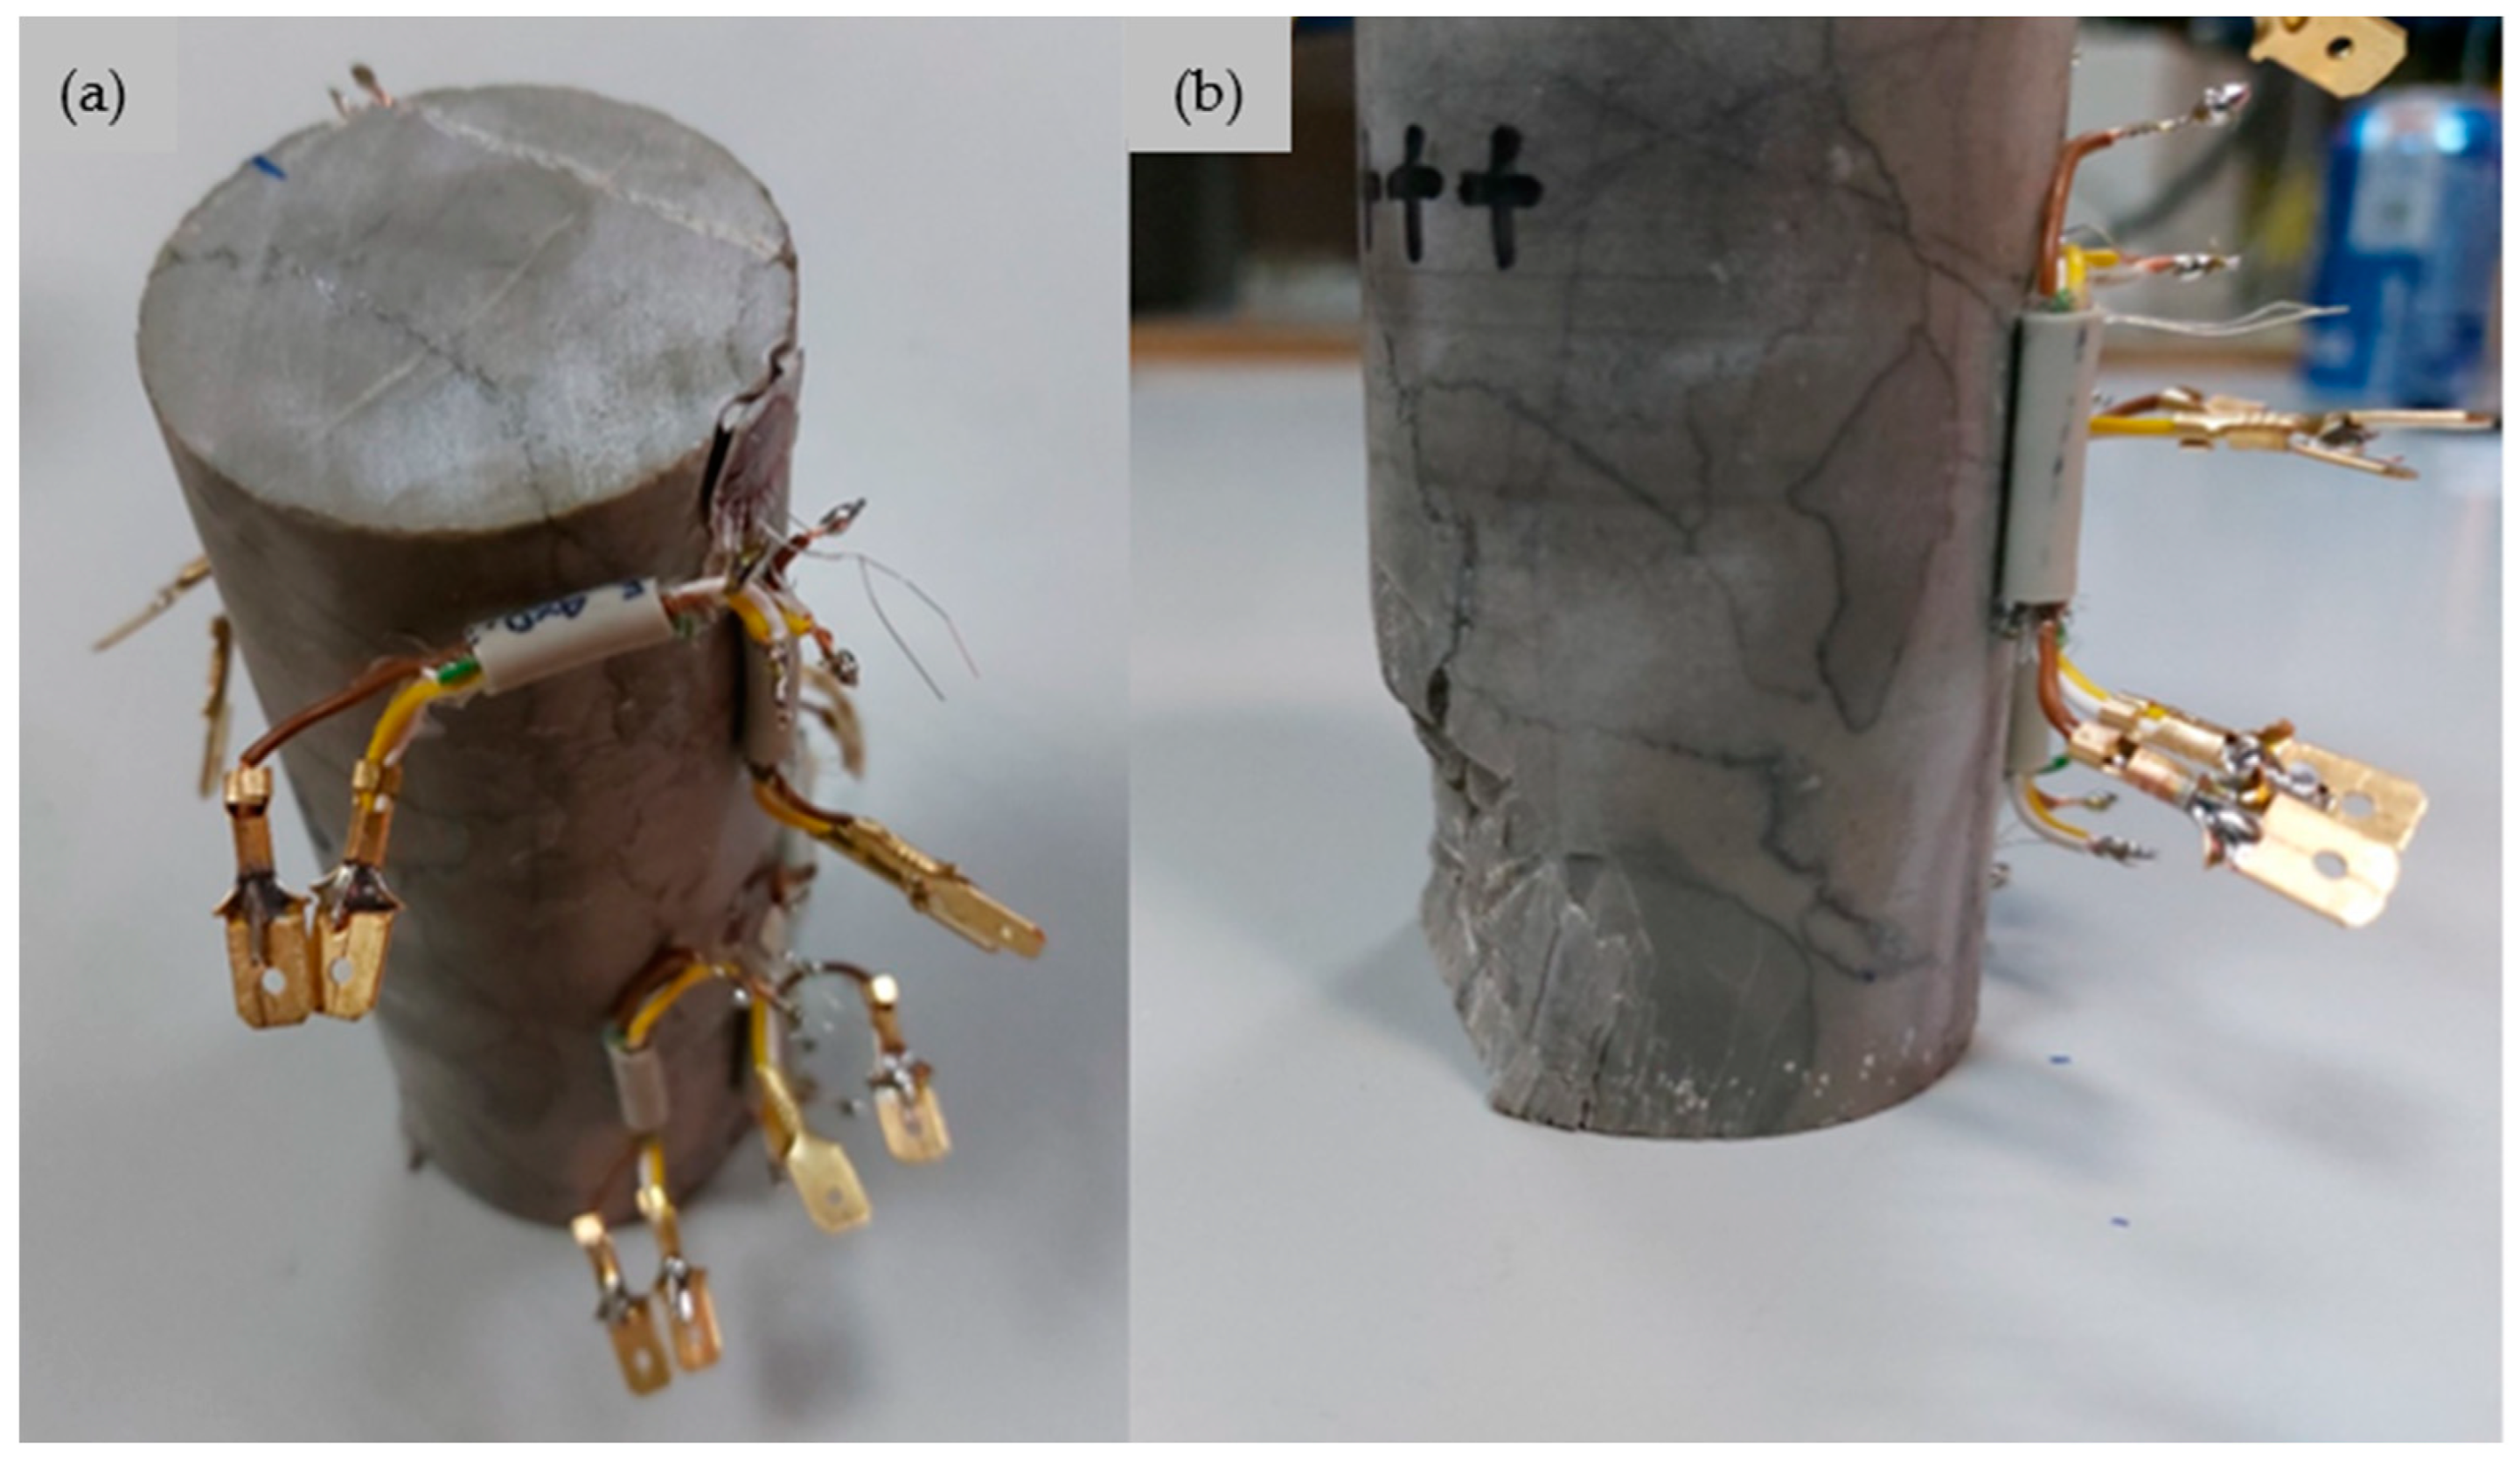
3.1. Steel Specimen Tests

| Steel Specimen | |||
|---|---|---|---|
| Platen | Steel | Aluminum | PMMA |
| Top End |  |  |  |
| Bottom End |  | 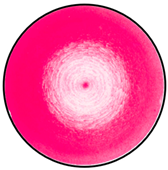 |  |
3.2. Aluminum Specimen Tests
| Aluminum Specimen | |||
|---|---|---|---|
| Platen | Steel | Aluminum | PMMA |
| Top End |  |  |  |
| Bottom End |  |  |  |
3.3. PMMA Specimen Tests
| PMMA Specimen | |||
|---|---|---|---|
| Platen | Steel | Aluminum | PMMA |
| Top End |  |  |  |
| Bottom End |  |  |  |
3.4. Case of Rock Materials
| Limestone Specimen | |||
|---|---|---|---|
| Platen | Steel | Aluminum | PMMA |
| Top End | 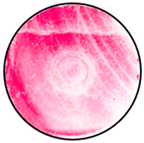 |  |  |
| Bottom End |  |  |  |
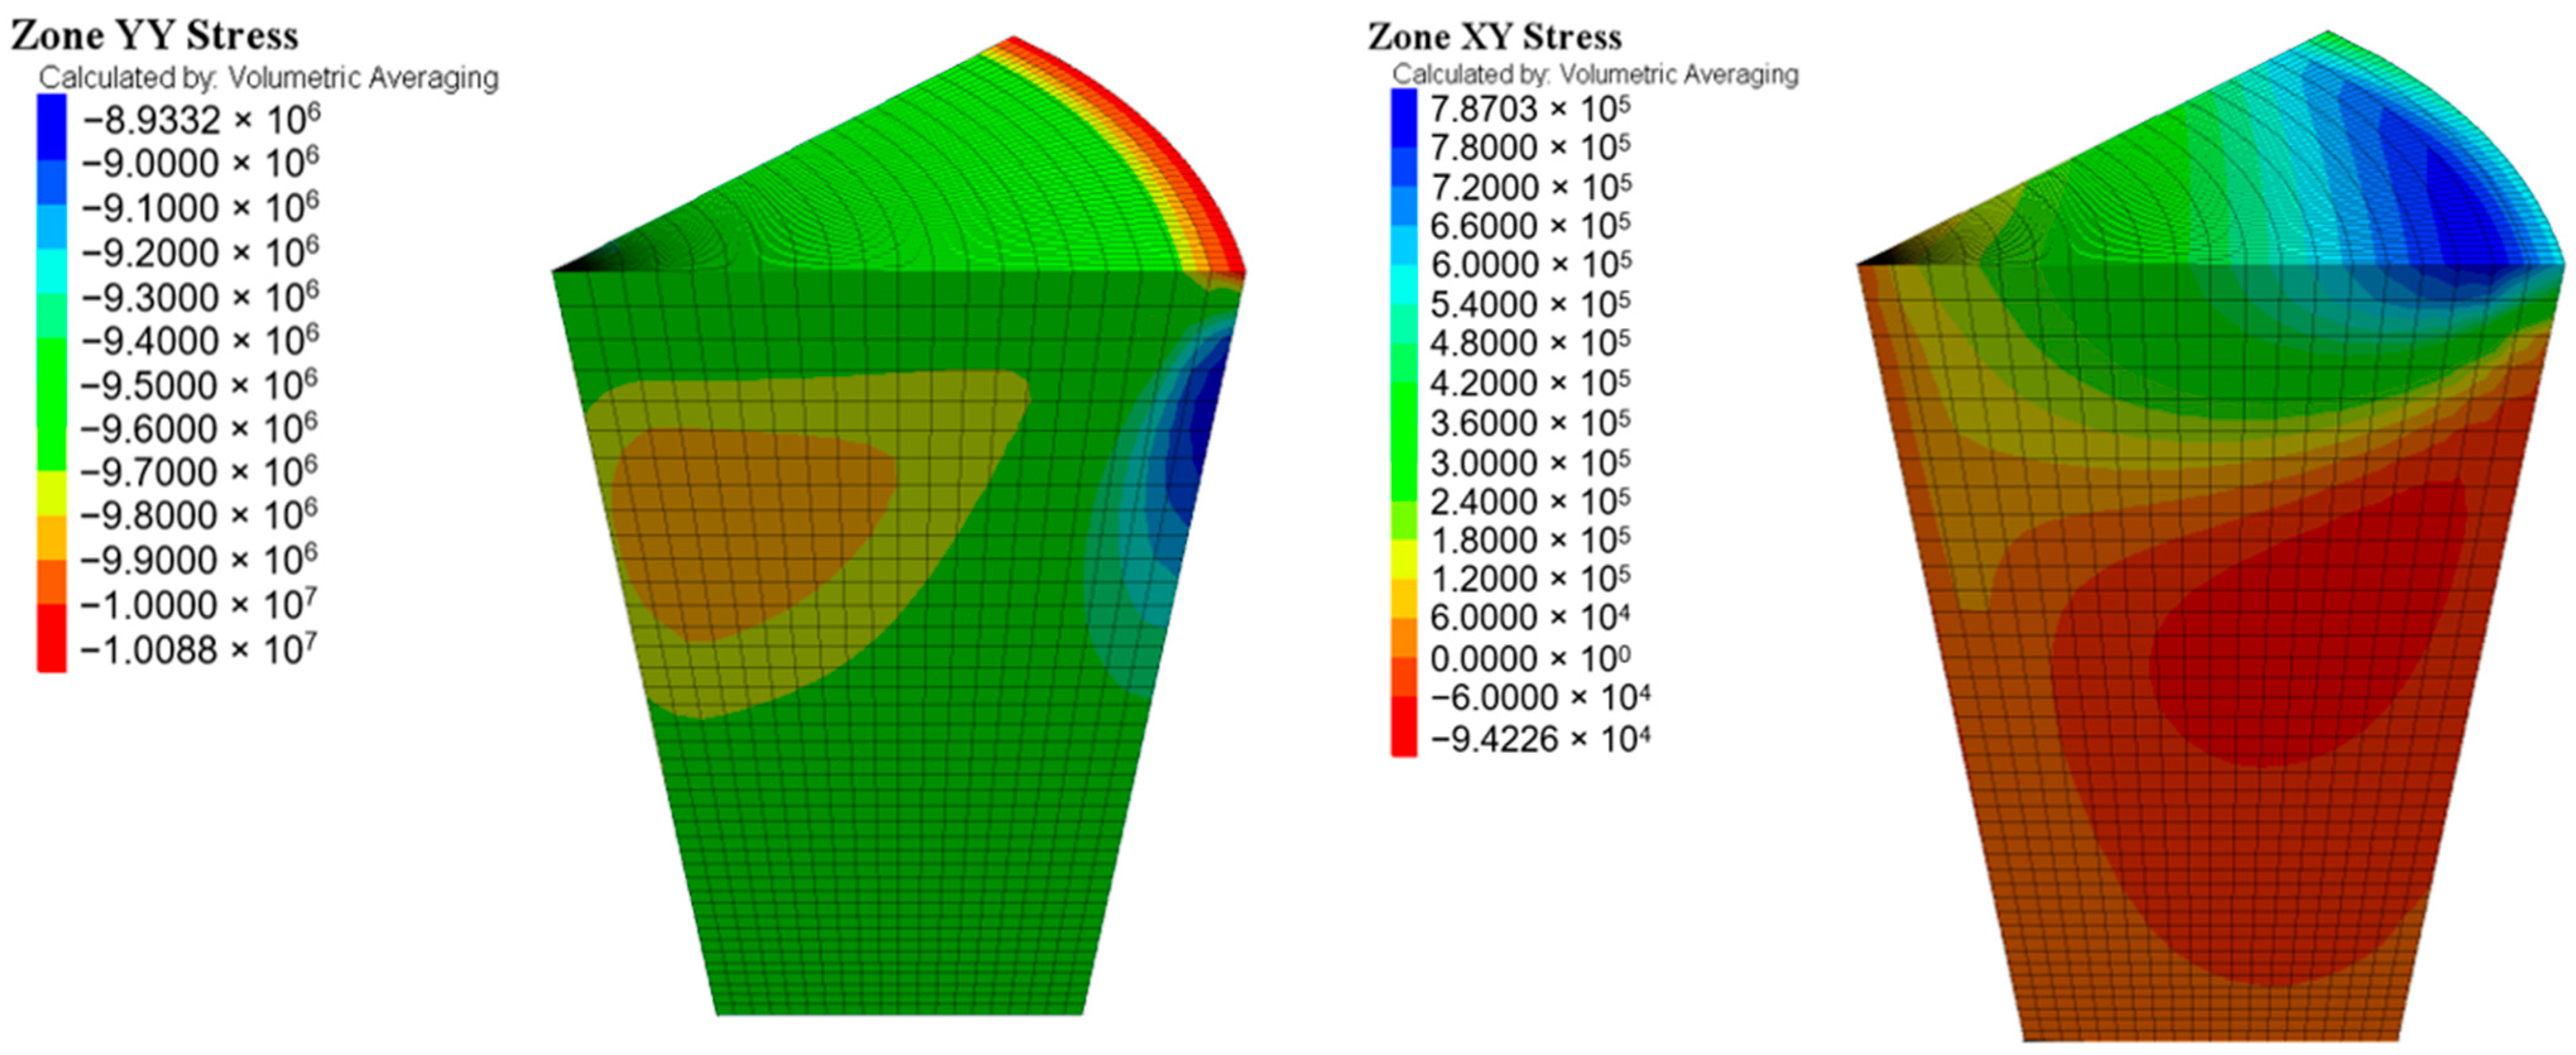
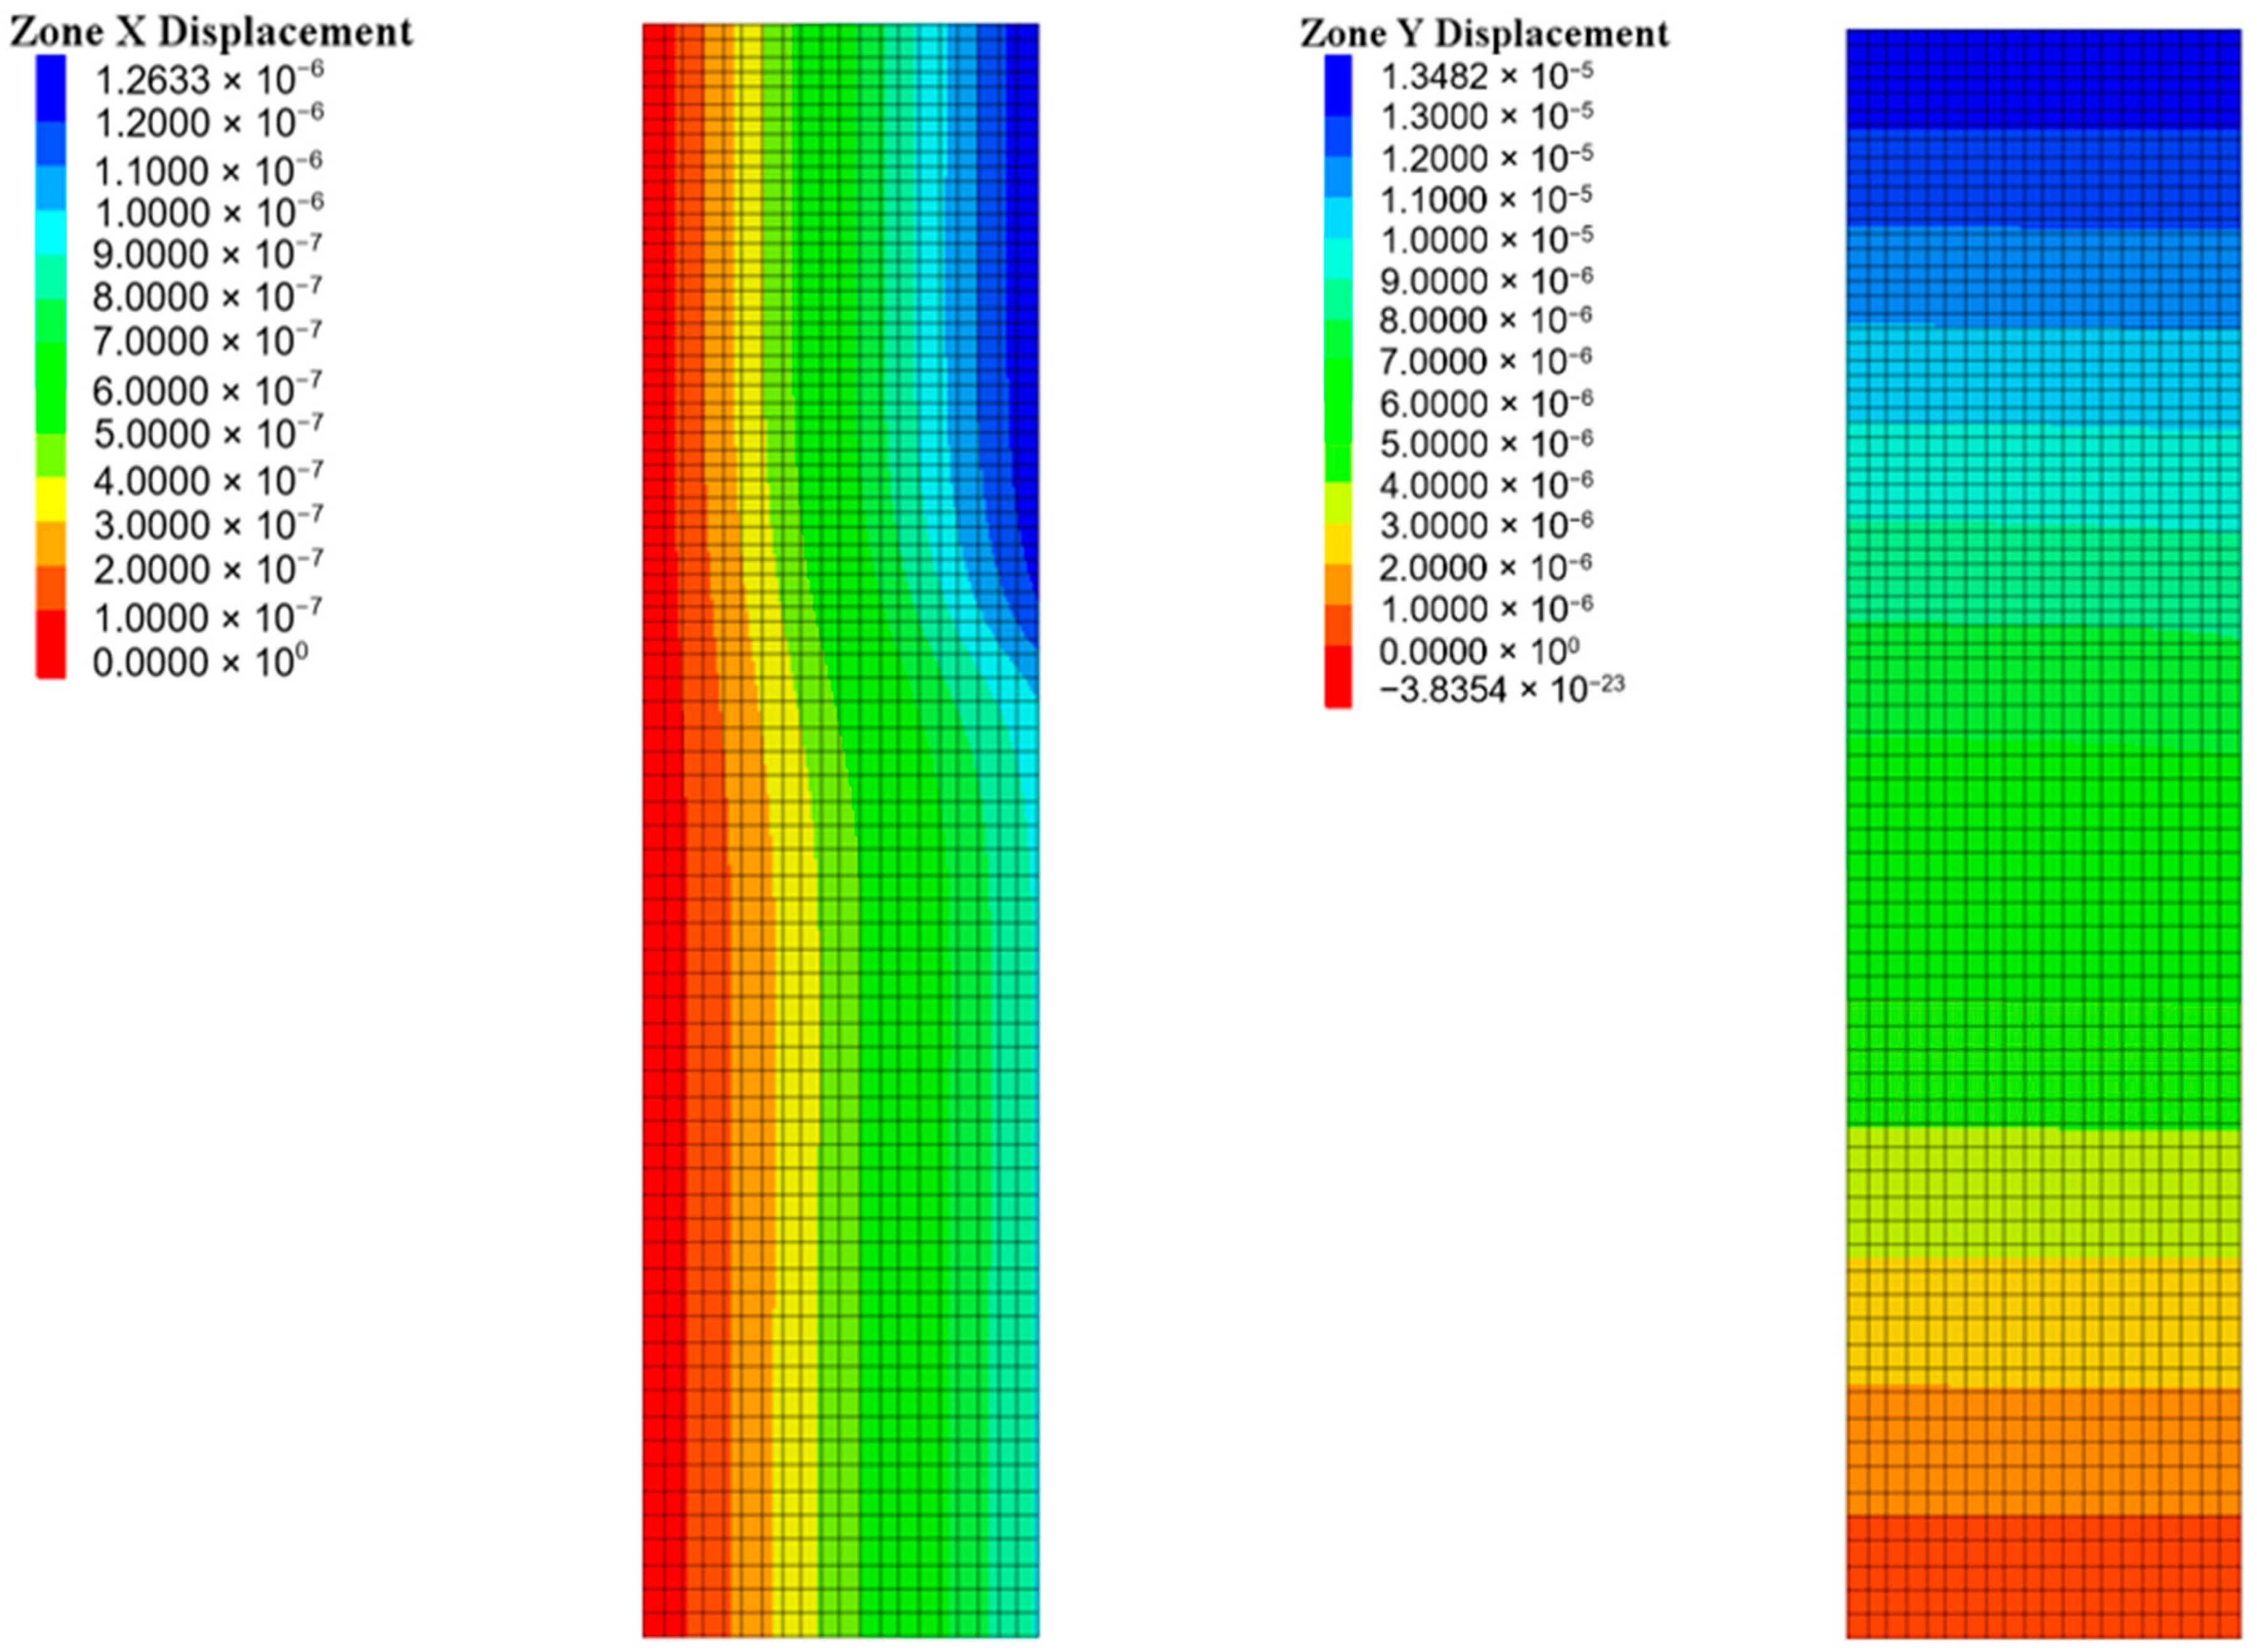
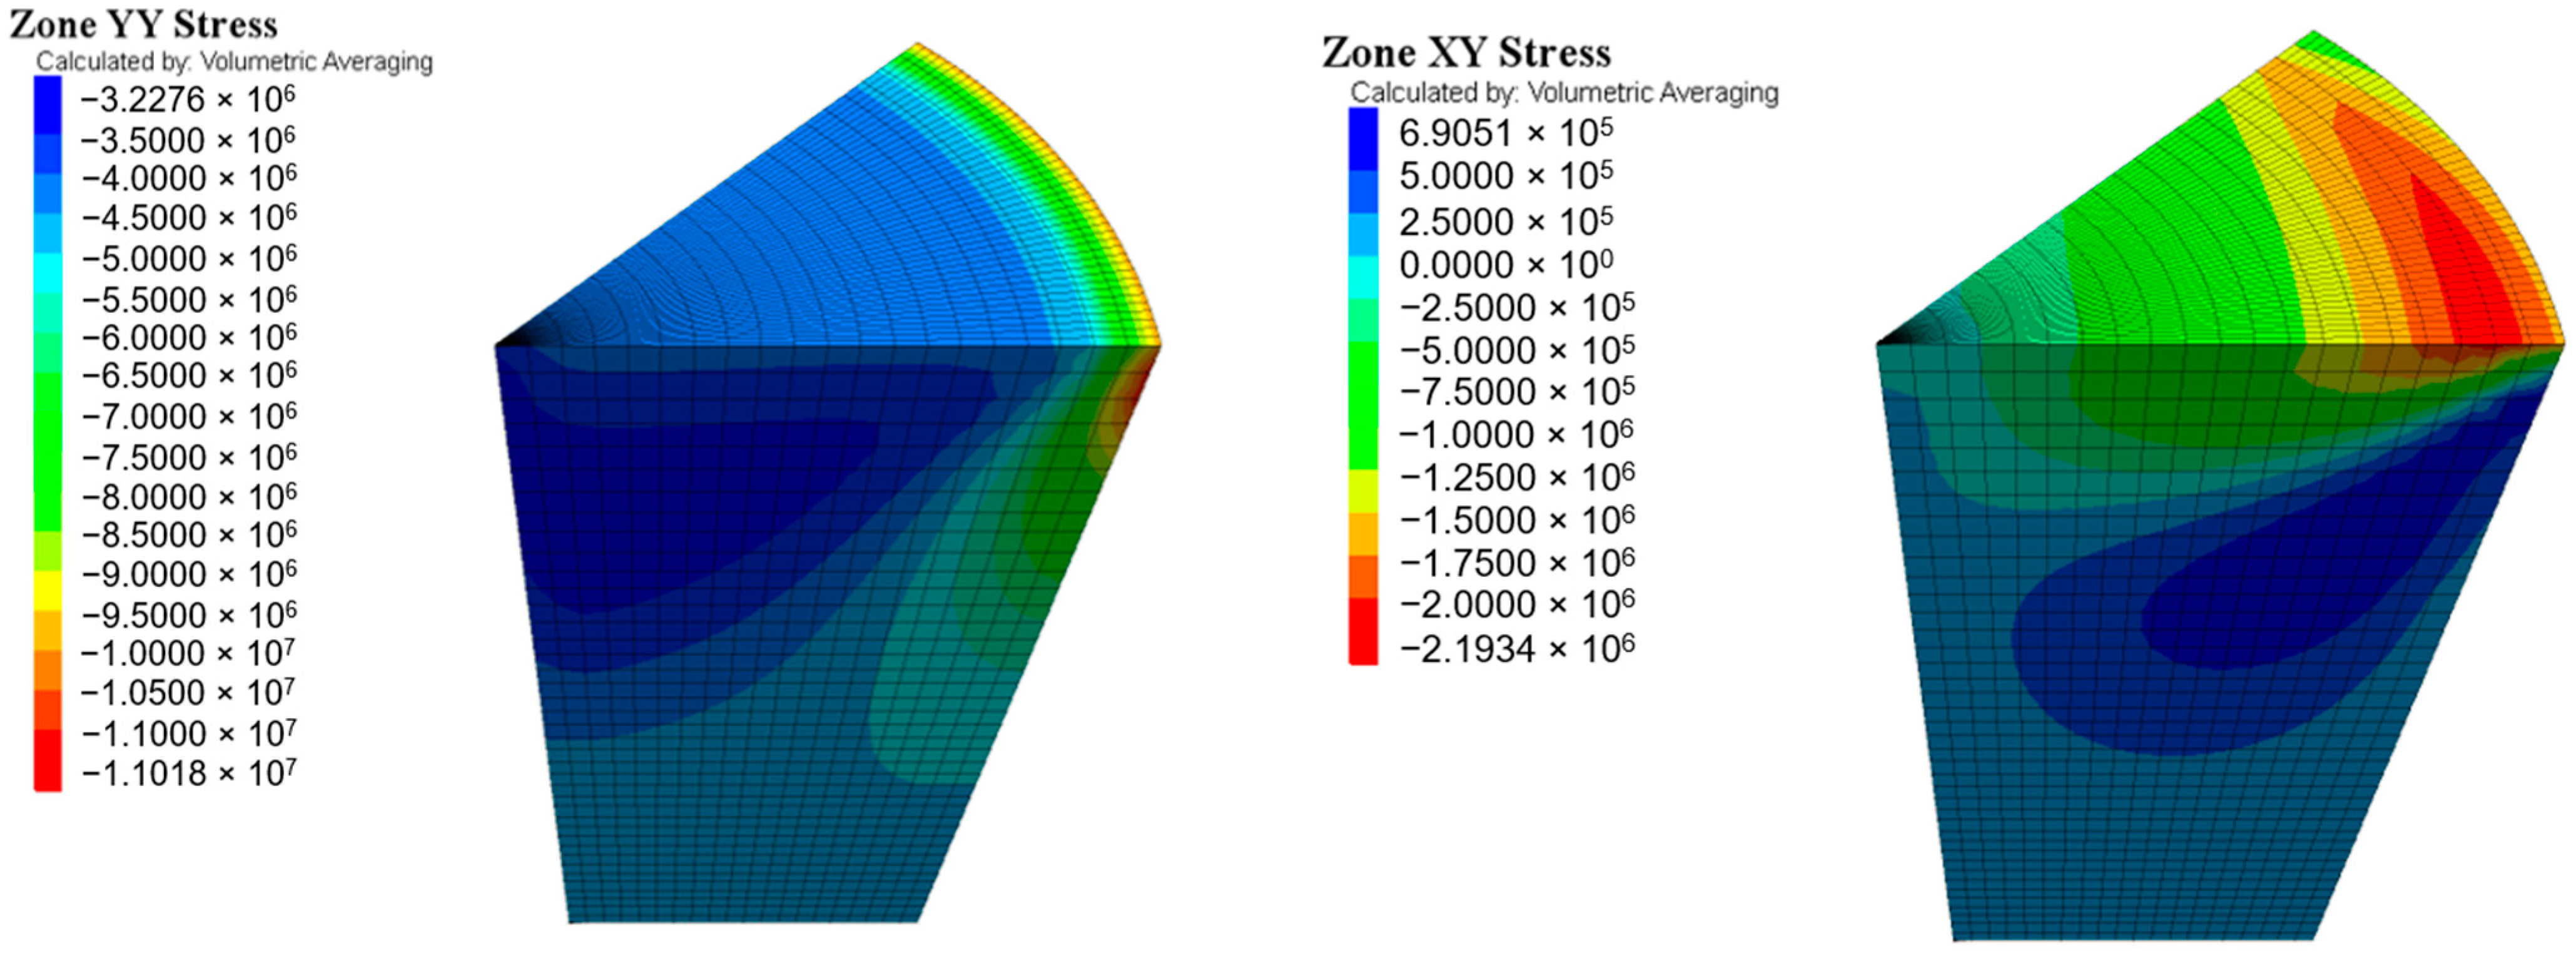
4. Numerical Verification of Contact Conditions
4.1. Steel Platen
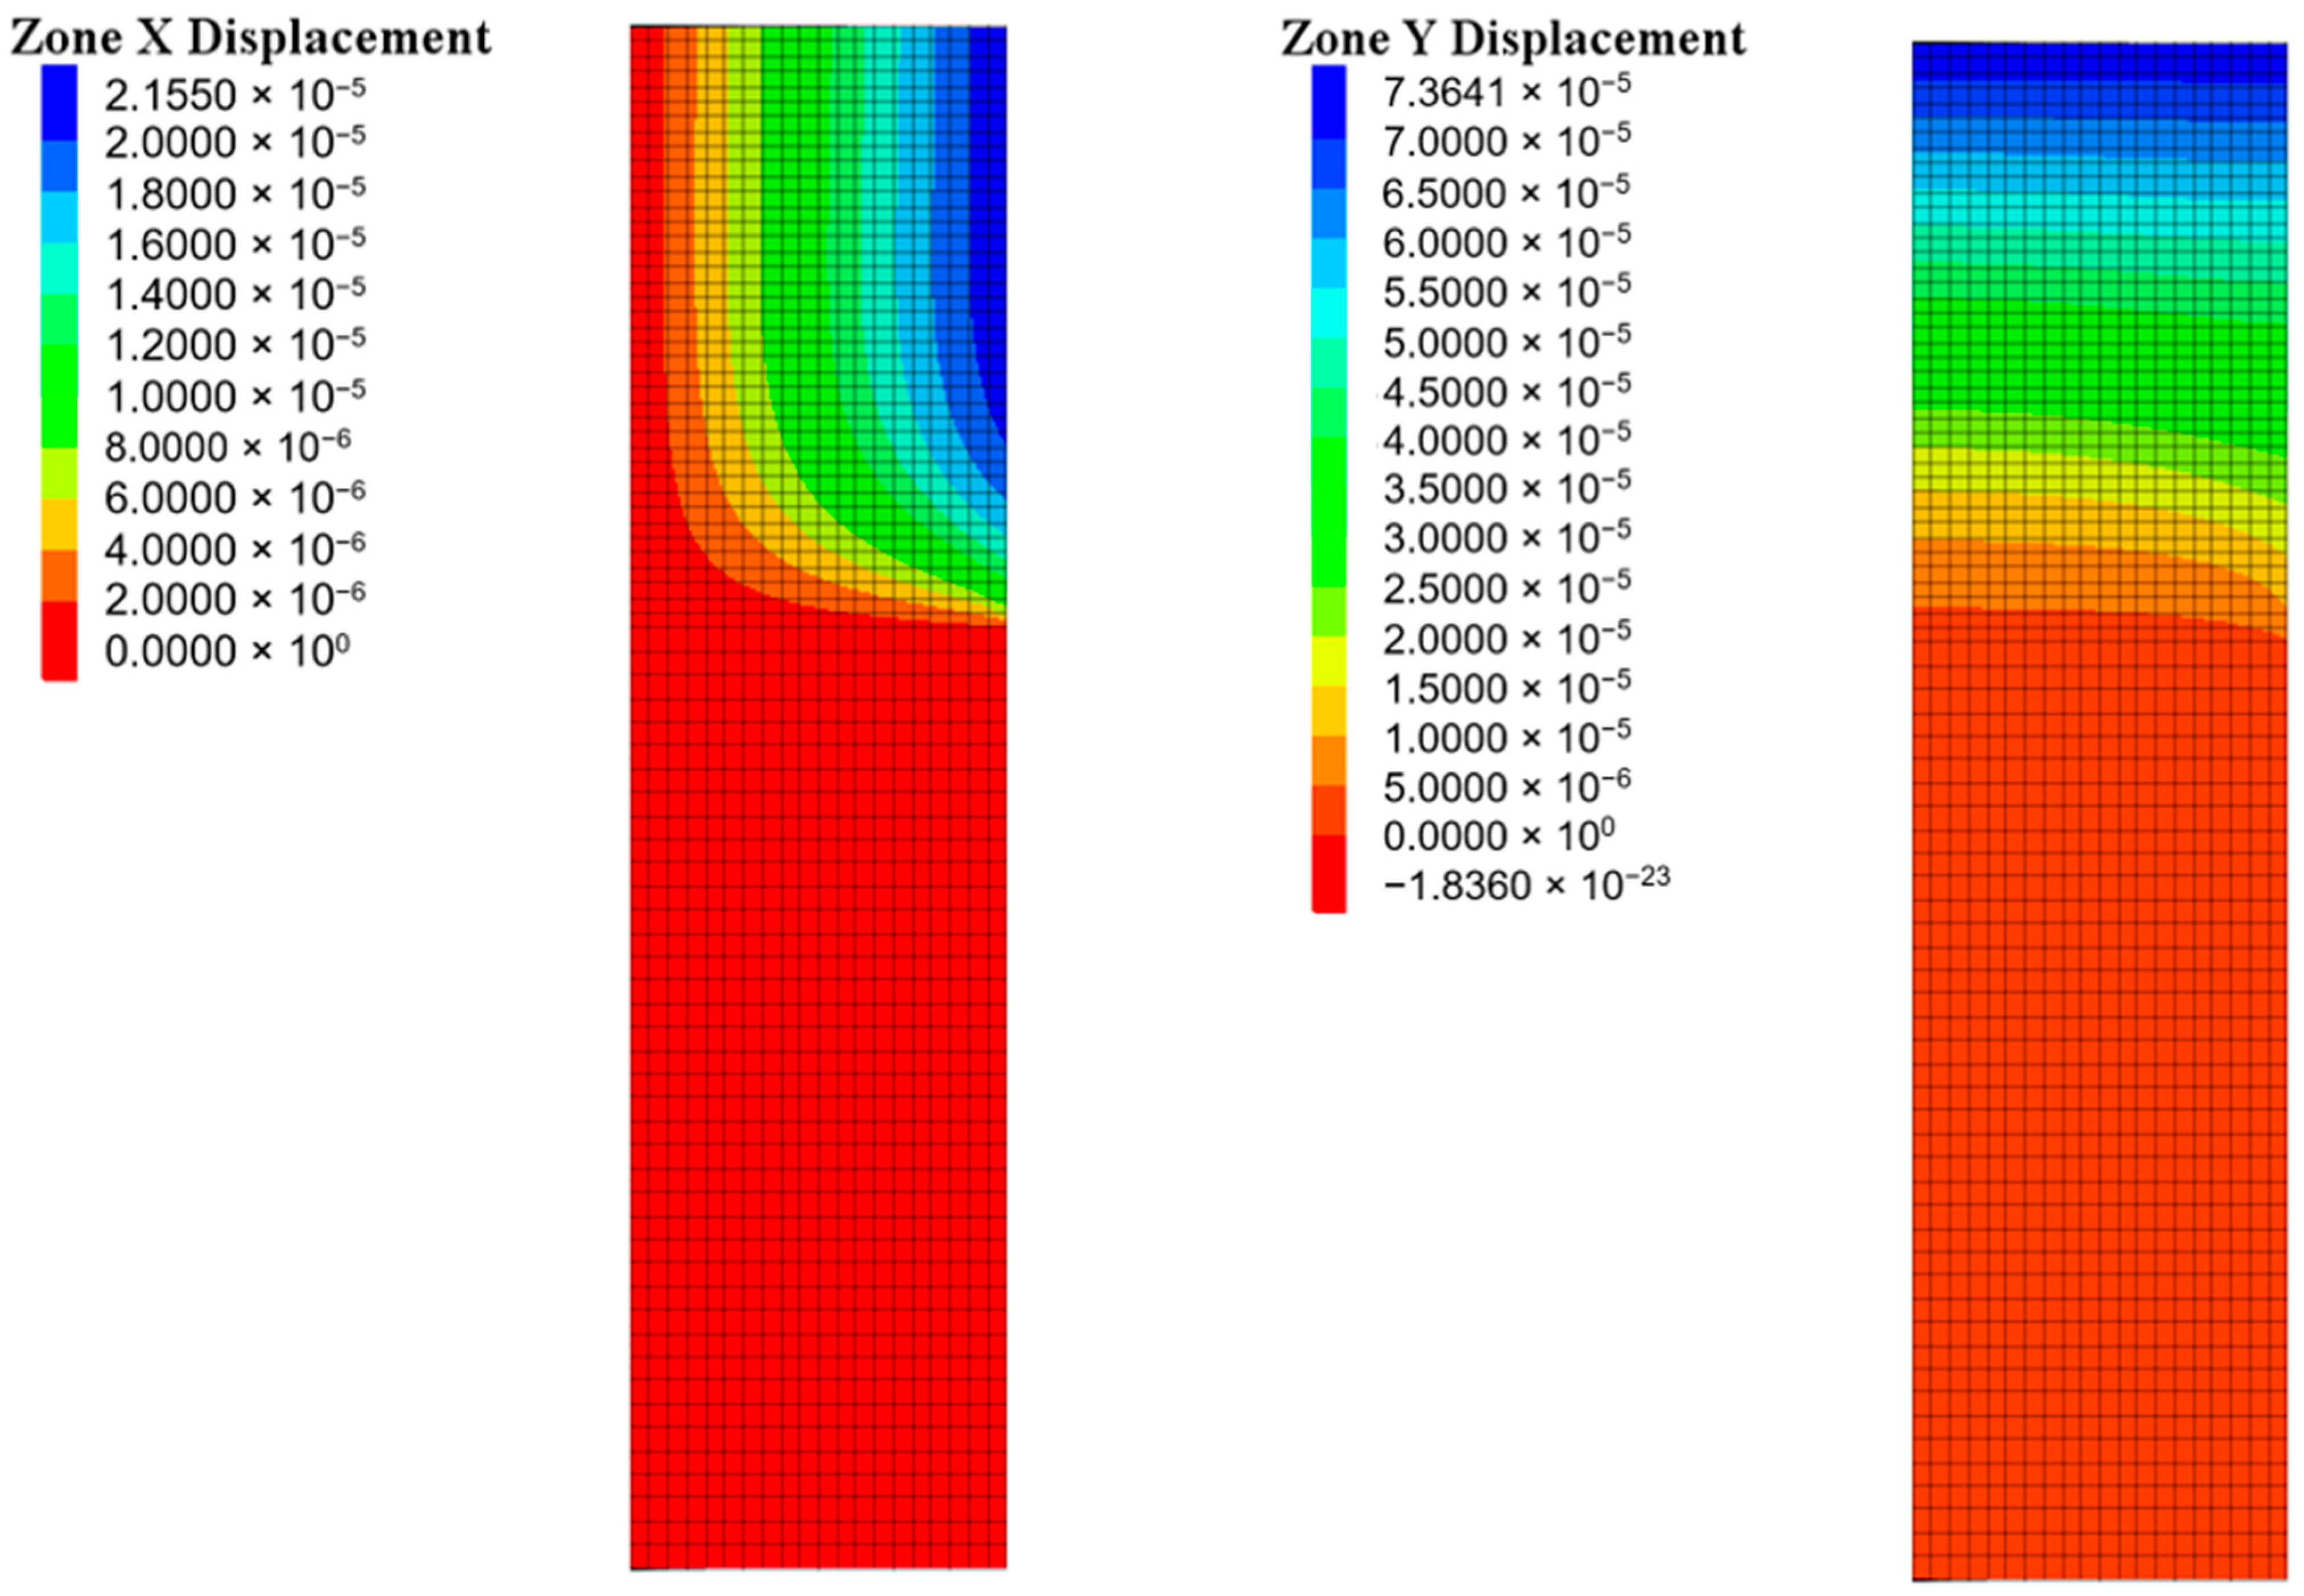
4.2. Aluminum Platen
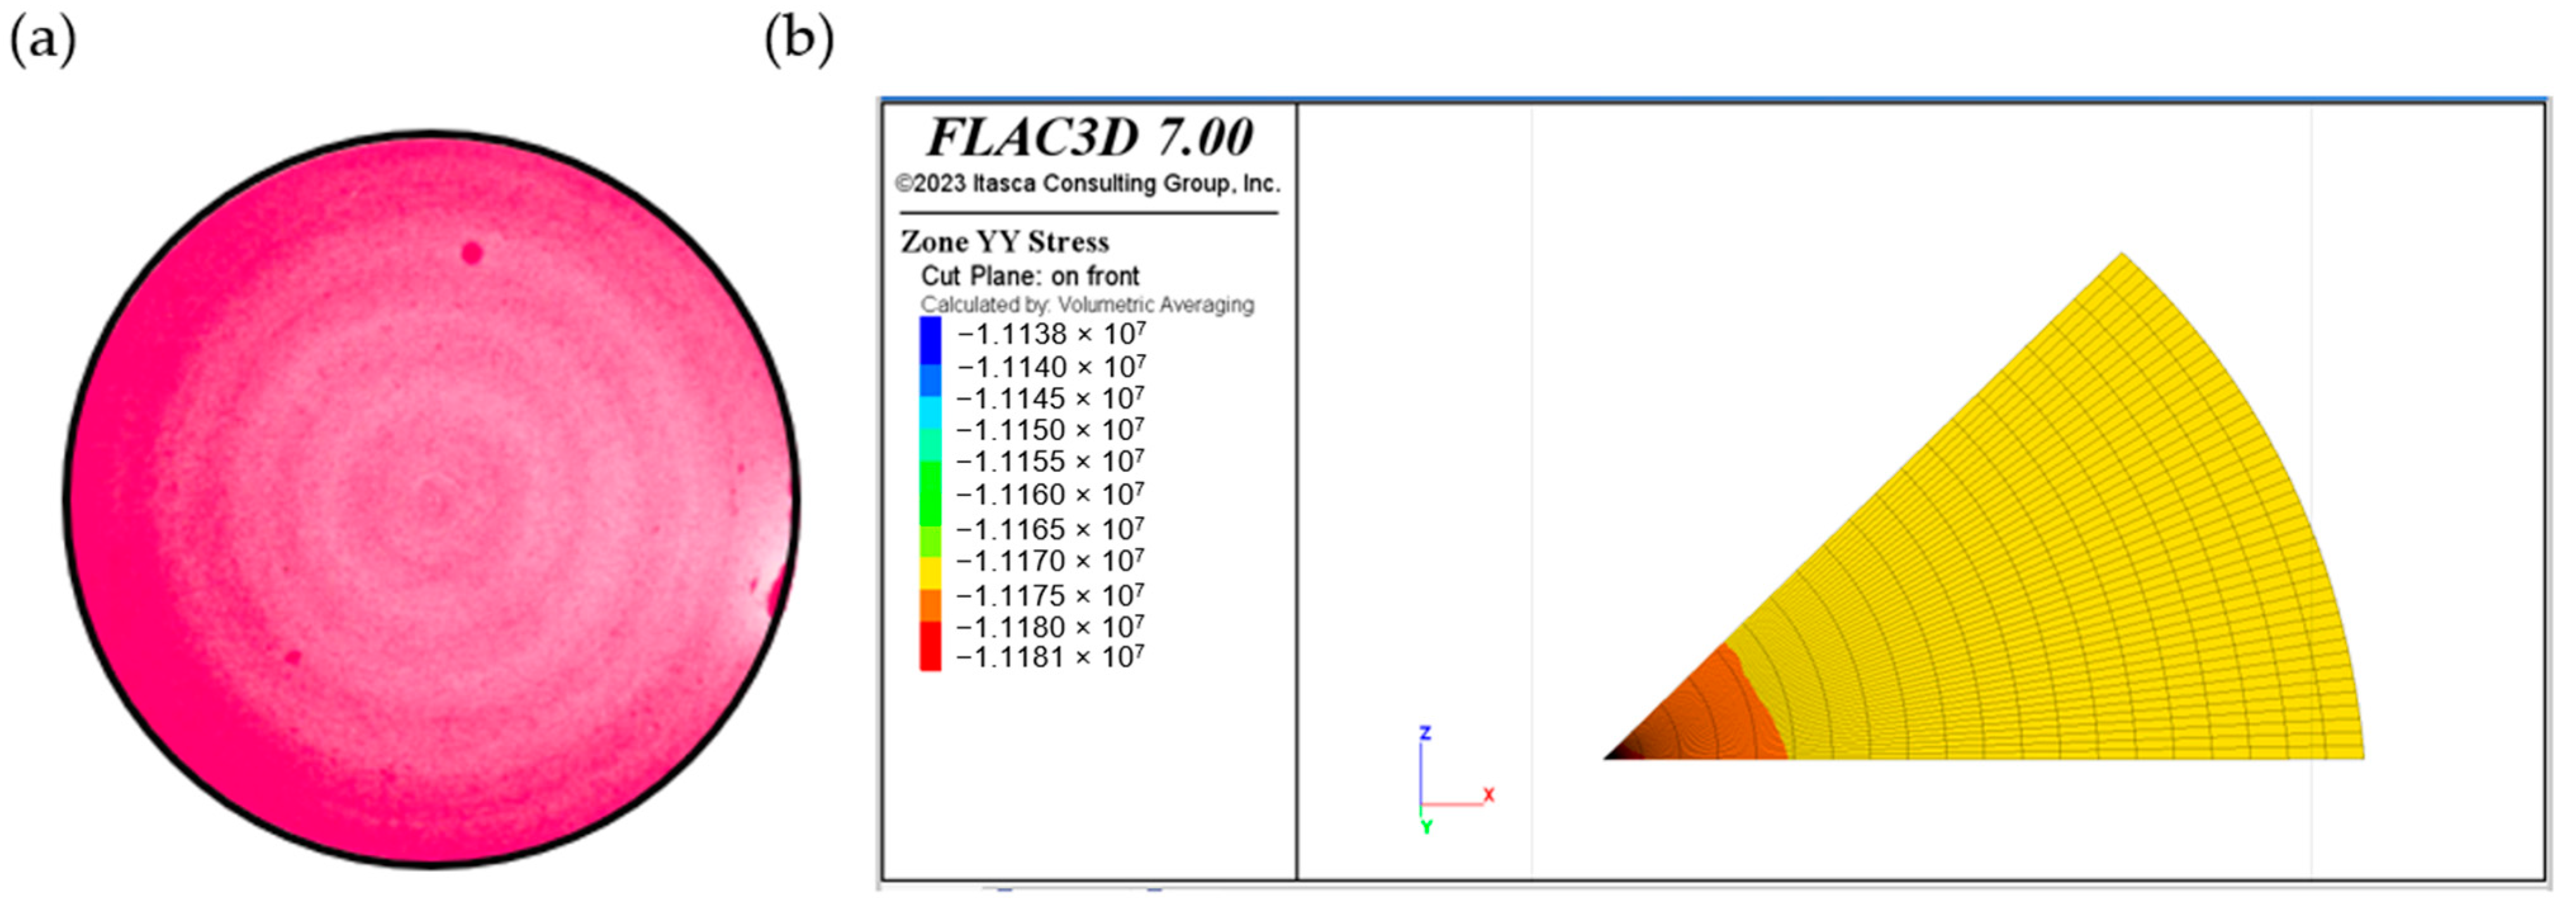
4.3. PMMA Platen
5. Discussion of Testing and Numerical Results
6. Conclusions
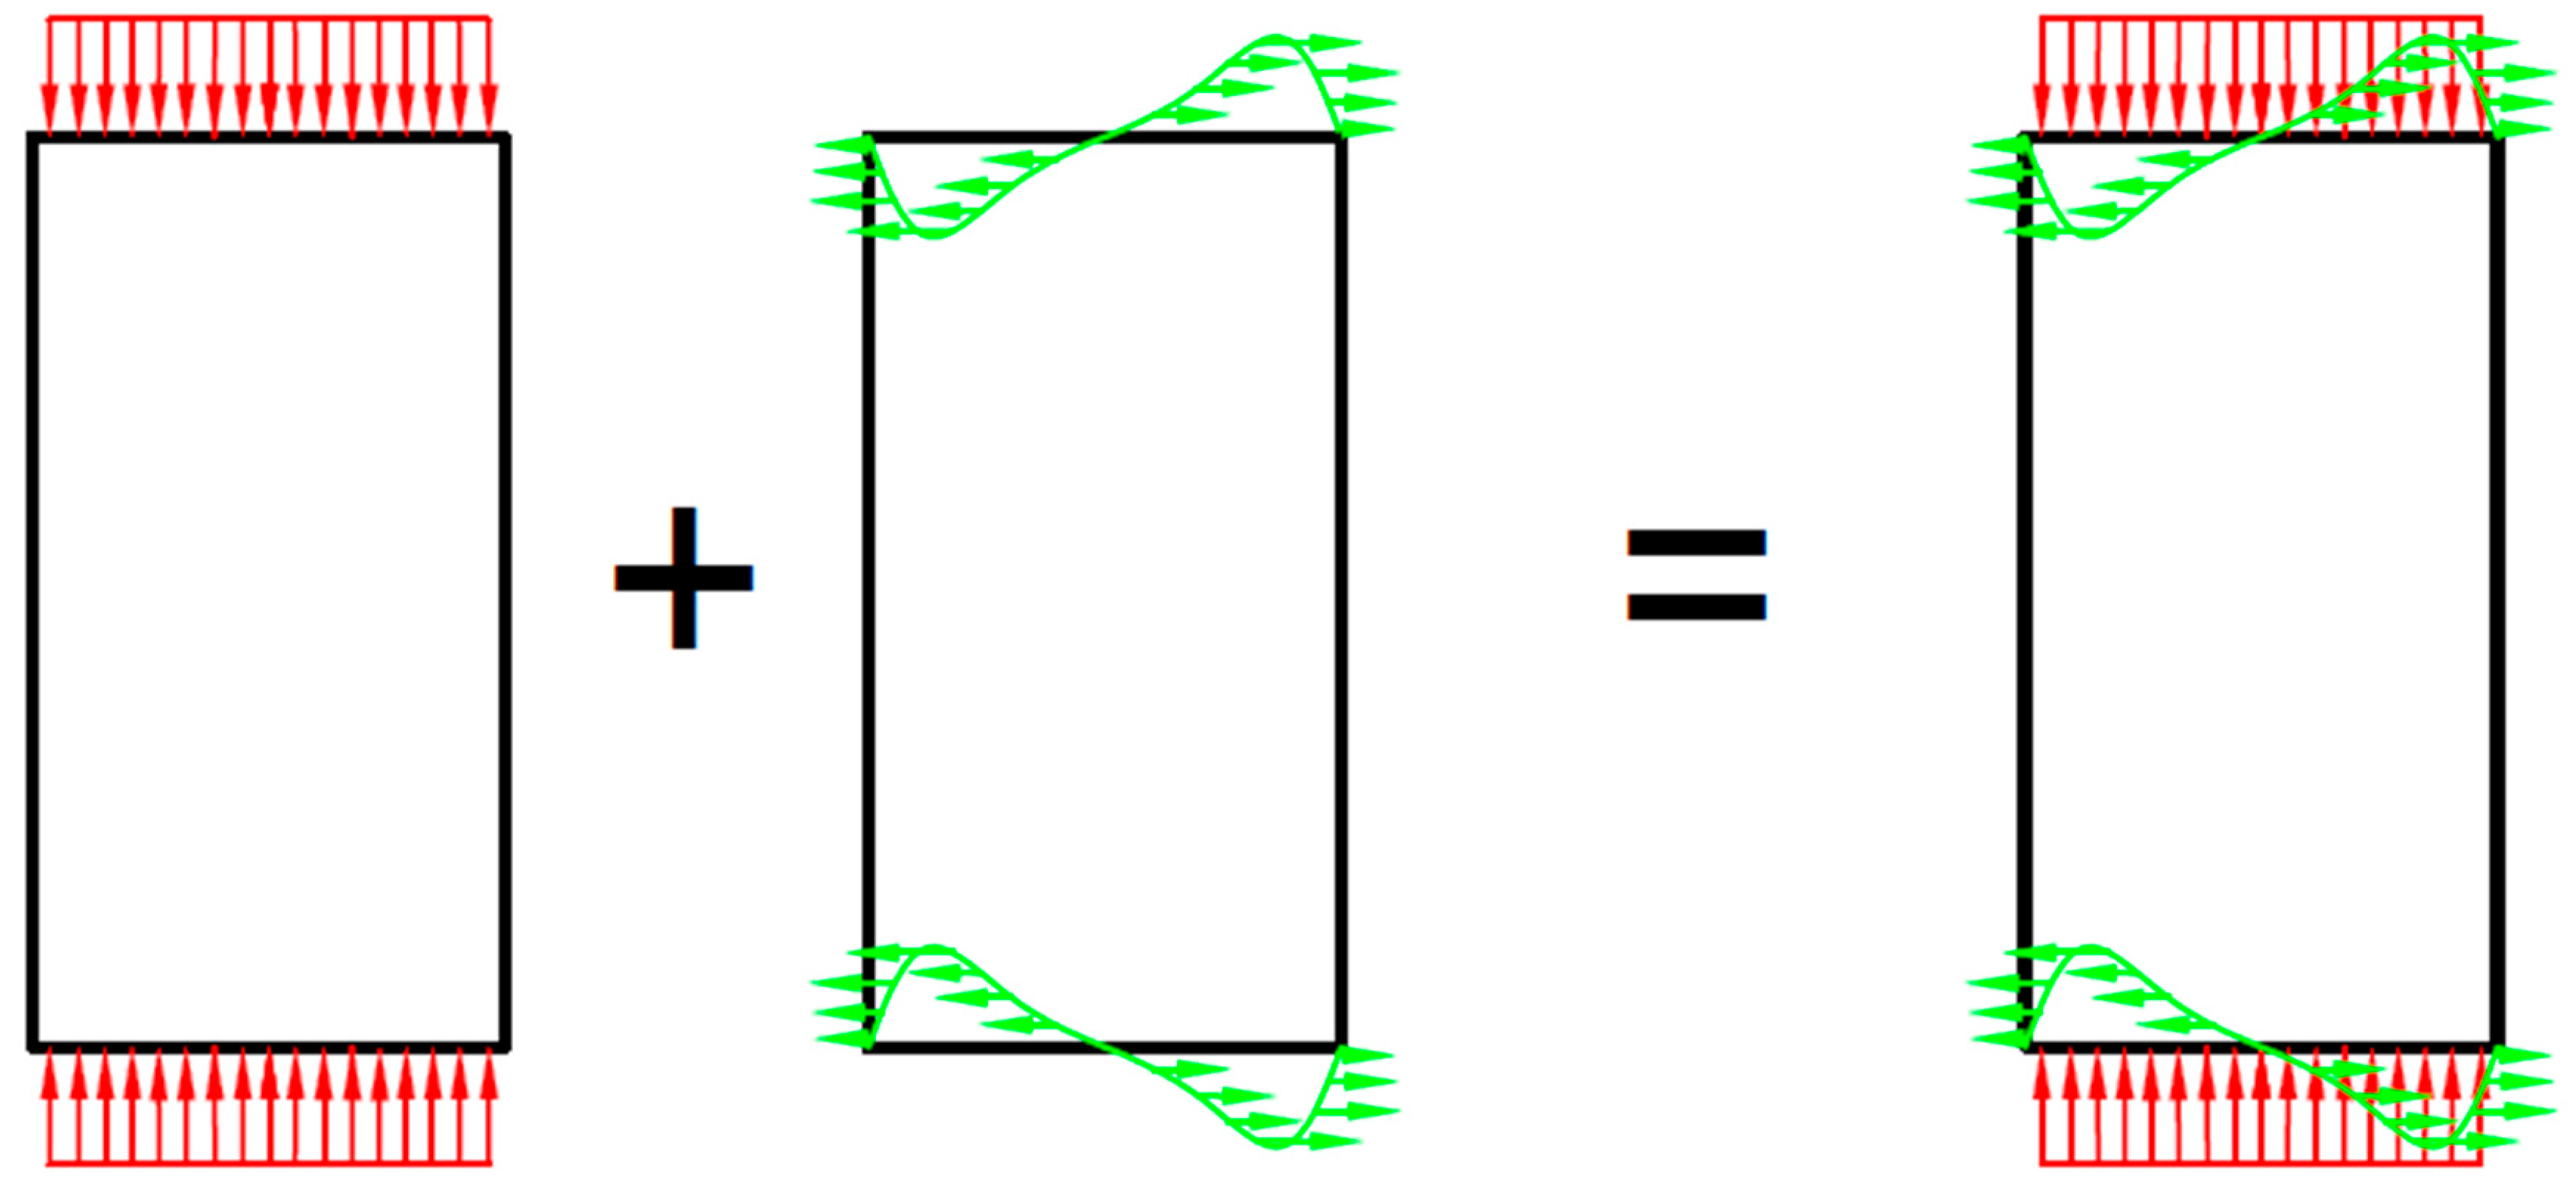
- The contact stress distribution using standardized steel platens is non-uniform, presenting higher stress values in the vicinity of the outer circumference of the ends of the specimen, decreasing towards its center.
- Uniformly distributed contact stresses are achieved using platens with elastic properties similar to those of the tested material, as only a slight impediment to the horizontal movement of specimen ends is imposed. Therefore, this is a case when experimental tests would have better correlation, from an elastic perspective, with its theoretical foundations.
- As a corollary of points 1 and 2, contact patterns strongly change with different loading conditions. Even for the same tested materials, contact patterns vary depending on the stiffness of the platen utilized.
- To determine the compressive strength of brittle materials, the usage of cushions as devices to avoid local stress concentration areas is recommended. Nevertheless, the stiffness of the cushions must be similar to that of the tested material, or undesired triaxial stress states would be generated in the vicinity of the contact.
- Aluminum platens and/or cushions, rather than steel platens, may be selected to test hard rocks, unless the stiffness of tested material is approximately equal to that of steel.
- PMMA platens and/or cushions are only recommendable to test soft rocks. Nevertheless, prior to their reuse, it must be ensured that these platens do not reach plastic behavior during the test execution.
- Tolerances specified by standards must be proposed, considering the elastic properties of the tested specimen, as greater deformation related to less stiff materials would compensate for some minor deviations in the contact surface. Furthermore, the stiffer the material to be tested, the more suitable it would be to impose some roughness tolerance on its ends to avoid local stress concentrations on the main asperities.
- Considering different acceptable materials for testing platens within the same standard may be recommended to cover the entire spectrum of all possible rock materials.
- Due to the inherent heterogeneity of rock materials, whose properties differ from those of the intact rock, the prediction of load distributions may be challenging, even when similar materials of similar stiffness are employed.
Author Contributions
Funding
Data Availability Statement
Conflicts of Interest
References
- Goodman, R.E. Introduction to Rock Mechanics, 2nd ed.; John Wiley & Sons Inc.: Hoboken, NJ, USA, 1981; Volume 18, ISBN 0471812005. [Google Scholar]
- Ulusay, R.; Hudson, J. (Eds.) The Complete ISRM Suggested Methods for Rock Characterization, Testing and Monitoring: 1974-2006; ISRM Turkish National Group and the ISRM: Ankara, Turkey, 2007. [Google Scholar]
- Broch, E.; Franklin, J.A. The Point-Load Strength Test. Int. J. Rock Mech. Min. Sci. 1972, 9, 669–697. [Google Scholar] [CrossRef]
- ASTM D5731-16; Standard Test Method for Determination of the Point Load Strength Index of Rock Application to Rock Strength Classifications. ASTM: West Conshohocken, PA, USA, 2016.
- UNE 22950-1:1990; Propiedades Mecánicas de Las Rocas. Ensayos Para La Determinación de La Resistencia. Parte 1: Resistencia a La Compresión Uniaxial. AENOR: Madrid, Spain, 1990.
- ASTM C1358-18; Standard Test Method for Monotonic Compressive Strength Testing of Continuous Fiber-Reinforced Advanced Ceramics with Solid Rectangular Cross Section Test Specimens at Ambient Temperatures. ASTM: West Conshohocken, PA, USA, 2018.
- ASTM D695-15; Standard Test Method for Compressive Properties of Rigid Plastics. ASTM: West Conshohocken, PA, USA, 2016.
- ASTM E9-19; Standard Test Methods of Compression Testing of Metallic Materials at Room Temperature. ASTM: West Conshohocken, PA, USA, 2019.
- UNE-EN 12390-3:2020; Ensayos de Hormigón Endurecido. Parte 3: Determinación de La Resistencia a Compresión de Probetas. AENOR: Madrid, Spain, 2020.
- ASTM C39/39M-21; Standard Test Method for Compressive Strength of Cylindrical Concrete Specimens. ASTM: West Conshohocken, PA, USA, 2021.
- ASTM D7012-23; Standard Test Method for Compressive Strength and Elastic Moduli of Intact Rock Core Specimens under Varying States of Stress and Temperatures. ASTM: West Conshohocken, PA, USA, 2023; Volume 04.09, pp. 1–10.
- ASTM D 4543-19; Standard Practices for Preparing Rock Core as Cylindrical Test Specimens and Verifying Conformance to Dimensional and Shape Tolerances. American Society For Testing and Materials: West Conshocken, PA, USA, 2019.
- UNE 22950-3:1990; Propiedades Mecánicas de Las Rocas. Ensayos Para La Determinación de La Resistencia. Parte 3: Determinación Del Módulo de Elasticidad (Young) y Del Coeficiente de Poisson. AENOR: Madrid, Spain, 1990.
- Timoshenko, S.; Goodier, J.N. Theory of Elasticity, 2nd ed.; McGraw-Hill: New York, NY, USA, 1951. [Google Scholar]
- Sadd, M.H. Elasticity, 2nd ed.; Elsevier: Amsterdam, The Netherlands, 2009; ISBN 9780123744463. [Google Scholar]
- Barber, J.R. Elasticity, 3rd ed.; Springer: Berlin/Heidelberg, Germany, 2010; ISBN 978-90-481-3809-8. [Google Scholar]
- Kumar, S.; Mukhopadhyay, T.; Waseem, S.A.; Singh, B.; Iqbal, M.A. Effect of Platen Restraint on Stress–Strain Behavior of Concrete Under Uniaxial Compression: A Comparative Study. Strength Mater. 2016, 48, 592–602. [Google Scholar] [CrossRef]
- Kotsovos, M.D. Effect of Testing Techniques on the Post-Ultimate Behaviour of Concrete in Compression. Matériaux Et Constr. 1984, 16, 3–12. [Google Scholar] [CrossRef]
- Sokolnikoff, I.S. Mathematical Theory of Elasticity; McGraw-Hill Book Co.: New York, NY, USA, 1956. [Google Scholar]
- Gustkiewicz, J. Uniaxial Compression Testing of Brittle Rock Specimens with Special Consideration given to Bending Moment Effects. Int. J. Rock Mech. Min. Sci. Geomech. Abstr. 1975, 12, 13–25. [Google Scholar] [CrossRef]
- Gustkiewicz, J. Strain Fluctuations in Heterogeneous Rocks. Int. J. Rock Mech. Min. Sci. Geomech. Abstr. 1975, 12, 181–189. [Google Scholar] [CrossRef]
- Gustkiewicz, J. Strain Fluctuations within Some Rock Specimens under Uniaxial Compression. Part I—Local Fluctuations. Acta Geophys. Pol. 1985, 23, 389–405. [Google Scholar]
- Gustkiewicz, J. Strain Fluctuations within Some Rock Specimens under Uniaxial Compression. Part II—Certain Probabilistic Characteristics of the Fluctuations. Acta Geophys. Pol. 1985, 23, 407–427. [Google Scholar]
- Xu, Y.H.; Cai, M.; Zhang, X.W.; Feng, X.T. Influence of End Effect on Rock Strength in True Triaxial Compression Test. Can. Geotech. J. 2017, 54, 862–880. [Google Scholar] [CrossRef]
- Bandeira, M.V.V.; La Torre, K.R.; Kosteski, L.E.; Marangon, E.; Riera, J.D. Influence of Contact Friction in Compression Tests of Concrete Samples. Constr. Build. Mater. 2022, 317, 125811. [Google Scholar] [CrossRef]
- Guerrero-Miguel, D.J.; Álvarez-Fernández, M.I.; Gutiérrez-Moizant, R.; Prendes-Gero, M.B.; González-Nicieza, C. The Influence of Platen Stiffness on a Specimen’s Failure Initiation Point and the Failure Pattern of Brittle Materials in the Standardized Uniaxial Compression Test. Mathematics 2024, 12, 907. [Google Scholar] [CrossRef]
- Pochhammer, L. Über Die Fortpflanzungsgeschwindigkeiten Kleiner Schwingungen in Einem Unbegrenzten Isotropen Kreiszylinder. Trans. Camb. Phil. Soc. 1876, 81, 324–336. [Google Scholar]
- Chree, C. The Equation of an Isotropic Elastic Solid in Porlar and Cylindrical Co-Ordinates. Trans. Camb. Philos. Soc. 1889, 14, 250–369. [Google Scholar]
- Dougall, J. An Analytical Theory of the Equilibrium of an Isotropic Elastic Rod of Circular Section. Trans. R. Soc. Edinb. 1914, 49, 895–978. [Google Scholar] [CrossRef]
- Power, L.D.; Childs, S.B. Axisymmetric Stresses and Displacements in a Finite Circular Bar. Int. J. Eng. Sci. 1971, 9, 241–255. [Google Scholar] [CrossRef]
- Moghe, S.R.; Neff, H.F. Elastic Deformations of Constrained Cylinders. J. Appl. Mech. 1971, 38, 393–399. [Google Scholar] [CrossRef]
- Benthem, J.P.; Minderhoud, P. The Problem of the Solid Cylinder Compressed between Rough Rigid Stamps; Pergamon Press: Oxford, UK, 1972; Volume 8. [Google Scholar]
- Al-Chalabi, M.; Huang, C.L. Stress Distribution within Circular Cylinders in Compression. Int. J. Rock Mech. Min. Sci. Geomech. Abstr. 1974, 11, 45–56. [Google Scholar] [CrossRef]
- Kim, Y.Y.; Steele, C.R. Static Axisymmetric End Problems in Semi-Infinite and Finite Solid Cylinders. J. Appl. Mech. 1992, 59, 69–76. [Google Scholar] [CrossRef]
- Wei, X.X.; Chau, K.T. Finite Solid Circular Cylinders Subjected to Arbitrary Surface Load. Part I—Analytic solution. Int. J. Solids Struct. 2000, 37, 5707–5732. [Google Scholar] [CrossRef]
- Wei, X.X.; Chau, K.T. Finite Solid Circular Cylinders Subjected to Arbitrary Surface Load. Part II—Application to Double-Punch Test. Int. J. Solids Struct. 2000, 37, 5733–5744. [Google Scholar] [CrossRef]
- Wei, X.X.; Chau, K.T. Analytic Solution for Finite Transversely Isotropic Circular Cylinders under the Axial Point Load Test. J. Eng. Mech. 2002, 128, 209–219. [Google Scholar] [CrossRef]
- Chau, K.T.; Wei, X.X. A New Analytic Solution for the Diametral Point Load Strength Test on Infinite Solid Circular Cylinders. Int. J. Solids Struct. 2001, 38, 1459–1481. [Google Scholar] [CrossRef]
- Wei, X.X.; Chau, K.T.; Wong, R.H.C. Analytic Solution for Axial Point Load Strength Test on Solid Circular Cylinders. J. Eng. Mech. 1999, 125, 1349–1357. [Google Scholar] [CrossRef]
- Chau, K.T.; Wei, X.X. A Three Dimensional Analytic Solution for the Brazilian Test. In Frontiers of Rock Mechanics and Sustainable Development in the 21st Century; CRC Press: Boca Raton, FL, USA, 2001; pp. 141–143. [Google Scholar]
- Wei, X.X.; Chau, K.T. Three Dimensional Analytical Solution for Finite Circular Cylinders Subjected to Indirect Tensile Test. Int J. Solids Struct. 2013, 50, 2395–2406. [Google Scholar] [CrossRef]
- Sburlati, R. Three-Dimensional Analytical Solution for an Axisymmetric Biharmonic Problem. J. Elast. 2009, 95, 79–97. [Google Scholar] [CrossRef]
- Meleshko, V.V.; Tokovyy, Y.V. Equilibrium of an Elastic Finite Cylinder under Axisymmetric Discontinuous Normal Loadings. J. Eng. Math. 2013, 78, 143–166. [Google Scholar] [CrossRef]
- Sirsat, A.V.; Padhee, S.S. Analytic Solution to Isotropic Axisymmetric Cylinder under Surface Loadings Problem through Variational Principle. Acta. Mech. 2024, 235, 2013–2027. [Google Scholar] [CrossRef]
- Meleshko, V.V. Equilibrium of an Elastic Finite Cylinder: Filon’s Problem Revisited. J. Eng. Math. 2003, 46, 355–376. [Google Scholar] [CrossRef]
- Zhao, B.S.; Gao, Y.; Zhao, Y.T.; Zhou, X.X. Boundary Conditions for an Axisymmetric Circular Cylinder. Comptes Rendus-Mec. 2010, 338, 255–259. [Google Scholar] [CrossRef]
- Rahnama, H.; Shokrieh, M.M. Axisymmetric Equilibrium of an Isotropic Elastic Solid Circular Finite Cylinder. Math. Mech. Solids 2019, 24, 996–1029. [Google Scholar] [CrossRef]
- Li, Z.X.; Fujii, Y.; Alam, A.K.M.B.; Li, Z.H.; Du, F.; Wei, W.J. Implementing a Simple 2D Constitutive Model for Rocks into Finite Element Method. Comput. Geotech. 2024, 167, 106095. [Google Scholar] [CrossRef]
- Hu, Y.; Lu, Y. Study on Soil-Rock Slope Instability at Mesoscopic Scale Using Discrete Element Method. Comput Geotech 2023, 157, 105268. [Google Scholar] [CrossRef]
- Sun, L.; Grasselli, G.; Liu, Q.; Tang, X.; Abdelaziz, A. The Role of Discontinuities in Rock Slope Stability: Insights from a Combined Finite-Discrete Element Simulation. Comput. Geotech. 2022, 147, 104788. [Google Scholar] [CrossRef]
- Xu, C.; Liu, Q.; Tang, X.; Sun, L.; Deng, P.; Liu, H. Dynamic Stability Analysis of Jointed Rock Slopes Using the Combined Finite-Discrete Element Method (FDEM). Comput. Geotech. 2023, 160, 105556. [Google Scholar] [CrossRef]
- Lak, M.; Fatehi Marji, M.; Yarahmadi Bafghi, A.R.; Abdollahipour, A. Discrete Element Modeling of Explosion-Induced Fracture Extension in Jointed Rock Masses. J. Min. Environ. 2019, 10, 125–138. [Google Scholar] [CrossRef]
- Du, K.; Li, X.; Su, R.; Tao, M.; Lv, S.; Luo, J.; Zhou, J. Shape Ratio Effects on the Mechanical Characteristics of Rectangular Prism Rocks and Isolated Pillars under Uniaxial Compression. Int. J. Min. Sci. Technol. 2022, 32, 347–362. [Google Scholar] [CrossRef]
- Jiang, H.; Meng, D. 3D Numerical Modelling of Rock Fracture with a Hybrid Finite and Cohesive Element Method. Eng. Fract. Mech. 2018, 199, 280–293. [Google Scholar] [CrossRef]
- Fu, J.; Haeri, H.; Sarfarazi, V.; Asgari, K.; Ebneabbasi, P.; Fatehi Marji, M.; Guo, M. Extended Finite Element Method Simulation and Experimental Test on Failure Behavior of Defects under Uniaxial Compression. Mech. Adv. Mater. Struct. 2022, 29, 6966–6981. [Google Scholar] [CrossRef]
- Yu, Q.; Zhu, W.; Ranjith, P.G.; Shao, S. Numerical Simulation and Interpretation of the Grain Size Effect on Rock Strength. Geomech. Geophys. Geo-Energy Geo-Resour. 2018, 4, 157–173. [Google Scholar] [CrossRef]
- Wang, H.; Dyskin, A.; Pasternak, E.; Dight, P. Possible Mechanism of Spallation in Rock Samples under Uniaxial Compression. Eng. Fract. Mech. 2022, 269, 108577. [Google Scholar] [CrossRef]
- Ghazvinian, E.; Diederichs, M.S.; Quey, R. 3D Random Voronoi Grain-Based Models for Simulation of Brittle Rock Damage and Fabric-Guided Micro-Fracturing. J. Rock Mech. Geotech. Eng. 2014, 6, 506–521. [Google Scholar] [CrossRef]
- Li, X.F.; Li, H.B.; Zhao, J. 3D Polycrystalline Discrete Element Method (3PDEM) for Simulation of Crack Initiation and Propagation in Granular Rock. Comput. Geotech. 2017, 90, 96–112. [Google Scholar] [CrossRef]
- Ma, G.; Zhou, W.; Regueiro, R.A.; Wang, Q.; Chang, X. Modeling the Fragmentation of Rock Grains Using Computed Tomography and Combined FDEM. Powder Technol. 2017, 308, 388–397. [Google Scholar] [CrossRef]
- Peng, J.; Wong, L.N.Y.; Teh, C.I. A Re-Examination of Slenderness Ratio Effect on Rock Strength: Insights from DEM Grain-Based Modelling. Eng. Geol. 2018, 246, 245–254. [Google Scholar] [CrossRef]
- Wang, Z.; Wang, M.; Zhou, L.; Zhu, Z.; Shu, Y.; Peng, T. Research on Uniaxial Compression Strength and Failure Properties of Stratified Rock Mass. Theor. Appl. Fract. Mech. 2022, 121, 103499. [Google Scholar] [CrossRef]
- Dyskin, A.V.; Sahouryeh, E.; Jewell, R.J.; Joer, H.; Ustinov, K.B. Influence of Shape and Locations of Initial 3-D Cracks on Their Growth in Uniaxial Compression. Eng. Fract. Mech. 2003, 70, 2115–2136. [Google Scholar] [CrossRef]
- Talaat, A.; Emad, A.; Tarek, A.; Masbouba, M.; Essam, A.; Kohail, M. Factors Affecting the Results of Concrete Compression Testing: A Review. Ain Shams Eng. J. 2021, 12, 205–221. [Google Scholar] [CrossRef]
- Alejano, L.R.; Arzúa, J.; Estévez-Ventosa, X.; Suikkanen, J. Correcting Indirect Strain Measurements in Laboratory Uniaxial Compressive Testing at Various Scales. Bull. Eng. Geol. Environ. 2020, 79, 4975–4977. [Google Scholar] [CrossRef]
- González-Fernández, M.A.; Estévez-Ventosa, X.; Alonso, E.; Alejano, L.R. Analysis of Size Effects on the Hoek-Brown Failure Criterion of Intact Granite Samples. In Proceedings of the IOP Conference Series: Earth and Environmental Science, Turin, Italy, 20–25 September 2021; IOP Publishing Ltd.: Bristol, UK, 2021; Volume 833. [Google Scholar]
- Alejano, L.R.; Estévez-Ventosa, X.; González-Fernández, M.A.; Walton, G.; West, I.G.; González-Molano, N.A.; Alvarellos, J. A Method to Correct Indirect Strain Measurements in Laboratory Uniaxial and Triaxial Compressive Strength Tests. Rock Mech. Rock Eng. 2021, 54, 2643–2670. [Google Scholar] [CrossRef]
- Li, L.; Guan, J.; Liu, Z. A Random Discrete Element Method for Modeling Rock Heterogeneity. Geomech. Geophys. Geo-Energy Geo-Resour. 2022, 8, 12. [Google Scholar] [CrossRef]
- Tang, C.A.; Tham, L.G.; Lee, P.K.K.; Tsui, Y.; Liu, H. Numerical Studies of the Infuence of Microstructure on Rock Failure in Uniaxial Compression Part II: Constraint, Slenderness and Size Effect. Int. J. Rock Mech. Min. Sci. 2000, 37, 571–583. [Google Scholar] [CrossRef]
- Khoei, A.R.; Vahab, M.; Haghighat, E.; Moallemi, S. A Mesh-Independent Finite Element Formulation for Modeling Crack Growth in Saturated Porous Media Based on an Enriched-FEM Technique. Int. J. Fract. 2014, 188, 79–108. [Google Scholar] [CrossRef]
- Jia, Z.M.; Zhou, X.P. Modelling Fracture of Rock Masses around Tunnels and Slopes by Field-Enriched Finite Element Method. Comput. Geotech. 2023, 163, 105756. [Google Scholar] [CrossRef]
- Bouchard, P.O.; Bay, F.; Chastel, Y. Numerical Modelling of Crack Propagation: Automatic Remeshing and Comparison of Different Criteria. Comput. Methods Appl. Mech. Eng. 2003, 192, 3887–3908. [Google Scholar] [CrossRef]
- Trädegård, A.; Nilsson, F.; Östlund, S. FEM-Remeshing Technique Applied to Crack Growth Problems. Comput. Methods Appl. Mech. Eng. 1998, 160, 115–131. [Google Scholar] [CrossRef]
- Hu, J.; Wu, J. Mechanical Properties and Uni-Axial Compression Stress-Strain Relation of Recycled Coarse Aggregate Concrete Subjected to Salt-Frost Cycles. Constr. Build. Mater. 2019, 197, 652–666. [Google Scholar] [CrossRef]
- Thirukumaran, S.; Oliveira, D. Innovative Design of Slender Rock Pillar Formed within Large Span Road Tunnels and Cavern Y-Junction in Hawkesbury Sandstone. Tunn. Undergr. Space Technol. 2023, 141, 105376. [Google Scholar] [CrossRef]
- Wang, Q.; Li, Z.; Lei, R.; Lu, P.; Han, H. Estimation of the Uniaxial Compressive Strength of Arctic Sea Ice during Melt Season. Cold Reg. Sci. Technol. 2018, 151, 9–18. [Google Scholar] [CrossRef]
- Jin, C.; Liu, S.; Xu, P.; Guo, C. Scale Effect Stress–Strain Model of Coal Containing Gas. J. Braz. Soc. Mech. Sci. Eng. 2019, 41, 147. [Google Scholar] [CrossRef]
- Zhao, C.; Zhang, R.; Zhang, Q.; Du, S.; Yang, C. Experimental Study on the Rift Plane of Granite under Uniaxial Compression. J. Appl. Geophy. 2022, 199, 104590. [Google Scholar] [CrossRef]
- Pero-Sanz Elorz, J.A. Ciencia e Ingeniería de Materiales: Estructura, Transformaciones Propiedades y Selección; CIE Inversiones editoriales-DOSSAT 2000: Madrid, Spain, 2000; ISBN 8495312182. [Google Scholar]
- Budynas, R.G.; Nisbett, J.K. Shigley’s Mechanical Engineering Design; McGraw-Hill: New York, NY, USA, 2011; ISBN 0073529281. [Google Scholar]
- Wang, H.; Chen, Z.; Zhang, D. Rock Slope Stability Analysis Based on FLAC3D Numerical Simulation. Appl. Mech. Mater. 2012, 170–173, 375–379. [Google Scholar]
- Vuong, P.M.; Walentek, A.; Waclawik, P.; Souńcek, K.; Antoniuk, M. Numerical Modelling of Uniaxial Compressive Strength Laboratory Tests. J. Sustain. Min. 2023, 22, 280–294. [Google Scholar] [CrossRef]
- Zhao, H.; Su, H.; Qin, X.; Zhang, K.; Jiang, Y.; Wang, W. Experiment and Numerical Simulation of Strength and Stress Distribution Behaviors of Anchored Rock Mass in a Roadway. Geofluids 2023, 2023, 9311206. [Google Scholar] [CrossRef]
- Sitharam, T.G.; Maji, V.B.; Verma, A.K. Practical Equivalent Continuum Model for Simulation of Jointed Rock Mass Using FLAC3D. Int. J. Geomech. 2007, 7, 389–395. [Google Scholar] [CrossRef]
- Lin, H.; Liu, T.; Li, J.; Cao, P. A Simple Generation Technique of Complex Geotechnical Computational Model. Math. Probl. Eng. 2013, 2013, 863104. [Google Scholar] [CrossRef]
- Guo, F.; Gu, W.; Tang, J.; Murong, M. Research on Deformation Stability of Soft Rock Slope under Excavation Based on FLAC3D. Appl. Mech. Mater. 2013, 275–277, 290–294. [Google Scholar] [CrossRef]
- Shim, J.; Shan, S.; Košmrlj, A.; Kang, S.H.; Chen, E.R.; Weaver, J.C.; Bertoldi, K. Harnessing Instabilities for Design of Soft Reconfigurable Auxetic/Chiral Materials. Soft Matter 2013, 9, 8198–8202. [Google Scholar] [CrossRef]
- Wang, F.; Li, D.M.; Yang, Y.R.; Wu, Z. Progressive Compaction of Soft Cellular Structures with Layer-Wisely Designed Gradient Porosity. Thin-Walled Struct. 2023, 185, 110634. [Google Scholar] [CrossRef]
- Zhang, X.; Gao, J.; Qiang, M.; Zhang, H.; Li, X.; Long, S.; Gao, Z.; Fan, H. Mechanical Characterization and Constitutive Modeling of Nano-Stabilized Soil under Uniaxial Compression. Materials 2023, 16, 1488. [Google Scholar] [CrossRef]


| Dimensional Measure Controlled | Standard | ||
|---|---|---|---|
| UNE | ASTM | ISRM | |
| Geometrical tolerance | |||
| UNE | ASTM | ISRM | |
| Flatness deviation (mm) | 0.005 | 0.025 | 0.005 |
| Dimensional Tolerance Controlled | Standard | ||||
|---|---|---|---|---|---|
| UNE | ASTM | ISRM | |||
10 times size of largest grain | 10 times size of largest grain | 10 times size of largest grain | |||
| Geometrical tolerance controlled | Standard | ||||
| UNE | ASTM | ISRM | |||
| Low deformability | Medium deformability | High deformability | |||
| Flatness deviation (mm) | 0.020 | 0.050 | 0.100 | 0.050 | 0.020 |
| Side straightness deviation (mm) | 0.30 | 0.40 | 0.50 | 0.50 | 0.30 |
| (minutes) | 10.0 | 20.0 | 30.0 | 15.0 | 3.5 |
| Specimen | Diameter (mm) | Length (mm) |
|---|---|---|
| Steel | 48.99 | 127.79 |
| Aluminum | 48.98 | 128.24 |
| PMMA | 48.97 | 126.03 |
| Rock | 50.69 | 131.67 |
| Specimen | Platen | ||
|---|---|---|---|
| Steel | Aluminum | PMMA | |
| Steel | HS | HS | HS |
| Aluminum | MS | MS | MS |
| PMMA | MS | MS | MS |
| Limestone | MS | MS | MS |
| Steel | Aluminum | PMMA | Limestone | |
|---|---|---|---|---|
| Young’s modulus (GPa) | 210 | 70 | 3.20 | 90 |
| Poisson’s ratio | 0.30 | 0.33 | 0.40 | 0.30 |
Disclaimer/Publisher’s Note: The statements, opinions and data contained in all publications are solely those of the individual author(s) and contributor(s) and not of MDPI and/or the editor(s). MDPI and/or the editor(s) disclaim responsibility for any injury to people or property resulting from any ideas, methods, instructions or products referred to in the content. |
© 2024 by the authors. Licensee MDPI, Basel, Switzerland. This article is an open access article distributed under the terms and conditions of the Creative Commons Attribution (CC BY) license (https://creativecommons.org/licenses/by/4.0/).
Share and Cite
Guerrero-Miguel, D.-J.; Álvarez-Fernández, M.-I.; Ramírez-Berasategui, M.; Prendes-Gero, M.-B.; González-Nicieza, C. Influence of Platen Stiffness on the Contact Stress Distribution in the Standardized Uniaxial Compression Test. Mathematics 2024, 12, 1943. https://doi.org/10.3390/math12131943
Guerrero-Miguel D-J, Álvarez-Fernández M-I, Ramírez-Berasategui M, Prendes-Gero M-B, González-Nicieza C. Influence of Platen Stiffness on the Contact Stress Distribution in the Standardized Uniaxial Compression Test. Mathematics. 2024; 12(13):1943. https://doi.org/10.3390/math12131943
Chicago/Turabian StyleGuerrero-Miguel, Diego-José, Martina-Inmaculada Álvarez-Fernández, María Ramírez-Berasategui, María-Belén Prendes-Gero, and Celestino González-Nicieza. 2024. "Influence of Platen Stiffness on the Contact Stress Distribution in the Standardized Uniaxial Compression Test" Mathematics 12, no. 13: 1943. https://doi.org/10.3390/math12131943