Article

Risk Transmission in Low-Carbon Supply Chains Considering Corporate Risk Aversion

1
School of Economics and Management, Nanjing Tech University, Nanjing 211816, China
2
School of Economics and Management, University of Chinese Academy of Sciences, Beijing 100190, China
*
Author to whom correspondence should be addressed.
Mathematics 2024, 12(13), 2009; https://doi.org/10.3390/math12132009
Submission received: 11 June 2024 / Revised: 24 June 2024 / Accepted: 26 June 2024 / Published: 28 June 2024

Abstract

:
In order to study the impact of risk aversion characteristics of enterprises on supply chain risk transmission, the risk aversion utility function is introduced, and the risk elasticity coefficient is used to construct a supplier-dominated low-carbon supply chain risk transmission model. Simulation analysis is conducted to investigate the transmission of emission reduction and revenue risks caused by internal and external contingent risk factors. The study reveals that under conditions of market demand uncertainty, the risk transmission effect is unaffected by the risk aversion characteristics of members in the low-carbon supply chain. While the risk-aversion characteristics of suppliers can decrease their own profit risk, they have a negative effect on the profit risk of manufacturers and the emission reduction risk of supply chain nodes. There exists a critical threshold for the impact of the risk-aversion degree of suppliers on their own emission reduction risk transmission effect. When this threshold is exceeded, the emission reduction risk decreases with increasing risk aversion intensity of suppliers, and vice versa. The risk aversion characteristics of manufacturers can weaken the negative effect of supplier risk aversion on the fluctuation risk of manufacturer profits, but they exacerbate the emission reduction risk transmission effect of manufacturers under asymmetric information influence. The findings have important theoretical and practical implications for supply chain risk management.

1. Introduction

According to data released by the International Energy Agency (IEA), global energy-related carbon dioxide emissions will total 37.4 billion tons in 2023, an incremental increase of 410 million tons over the previous year, representing an increase of 1.1%, and the road to green development still has a long way to go. Reducing carbon emissions through energy transformation and industrial restructuring is an important initiative to develop green and low-carbon industries and achieve the dual-carbon goal [1,2]. Supply chain activities have greater carbon emissions compared to other industrial activities [3]; according to the World Economic Forum (WEF), eight supply chains–food, construction, fashion, FMCG, electronics, automotive, professional services, and freight transport–account for more than 50 percent of global carbon emissions. Low-carbon development of the supply chain is an important requirement of low-carbon policy in the context of carbon neutrality. During the CATI index evaluation period in 2023, nearly 1000 suppliers set and disclosed carbon emission reduction targets, committing to carbon emission reductions totaling about 2.7 million tons to promote emission reduction actions. However, the research and development and innovation of emission reduction technologies can trigger chain reactions in low-carbon supply chains [4,5,6]; relying on the cooperation of other members will expose the whole low-carbon supply chain to the risk of uncertainty and dependence [7], which greatly increases the risk of benefits for low-carbon supply chain members [8]. In addition, members’ attitudes towards risk will also have an important impact on low-carbon supply chain decision-making and benefits, and how to effectively design supply chain carbon emission reduction risk management strategies on the basis of considering members’ risk avoidance characteristics is an important issue that needs to be solved at this stage.
When supply chain entities achieve their own development through cooperation and competition, the process of risk transmission along the supply chain structure to the upstream or downstream is the supply chain risk transmission. Currently, scholars are paying increasing attention to low-carbon supply chain risk research. For the research on the chain reaction of carbon emission reduction measures in the supply chain on the whole supply chain system, scholars mainly focus on the propagation mechanism [9,10] and disruption risk [11,12,13], etc. Taghavi et al. [11] proposed a multi-product two-stage risk aversion mixed integer stochastic linear programming for green elastic supplier selection and order allocation and considered the resilience strategy before disruption. Wang et al. [13] use the epidemiological model to study supply chain risk transmission, exploring the mechanism of risk transmission and its evolution in complex supply chain networks. A low-carbon transition of the supply chain will bring higher costs to firms, and mechanisms such as carbon pricing and carbon quotas affect the cost structure and production decisions of firms [14], increasing the risk of the whole supply chain. Especially when carbon information is not shared sufficiently, it can lead to different degrees of risk transfer in low-carbon supply chains [15,16]. If firms invest in abatement technologies under demand uncertainty, they may face significant financial pressure, which in turn creates a risk of disruption in the low-carbon supply chain [17].
Although these studies deal with risk transmission and management in supply chains, they are based on the premise that supply chain members are risk-neutral, but in reality, decision-makers are not fully rational and have various preferences such as altruistic, fair, and risk-averse preferences, which have a significant impact on the decision making of supply chain members [18,19,20]. In the current economic context of the low-carbon transition, low-carbon emission reduction constraints, green technological innovation, and market uncertainty bring high risks to the operation and management of supply chain enterprises, which strongly affects the decision-making of supply chain members and leads to the emergence of risk aversion characteristics in decision-making [21]. Supply chain node enterprises will try their best to avoid, weaken, or transfer risks when they recognize the possibility of risks, which also becomes a determining factor for the inevitable emergence and transmission of supply chain risks. Currently, the research on members’ risk aversion in the supply chain field mainly focuses on two aspects: first, considering the impact of risk aversion in the supply chain coordination contract [22,23,24]. For example, Raza and Govindaluri [25] developed a dual-channel supply chain (DCSC) coordination model for the more general situation where both manufacturers and retailers are risk-averse. Second, the impact of risk aversion is considered in supply chain pricing and optimization decisions [26,27]. For example, using a conditional value-at-risk approach to measure the degree of risk aversion, Zhou et al. [28] consider cooperative advertising and ordering in a two-tier supply chain in which risk-averse manufacturers sell their products through risk-averse retailers.
Most of the existing studies usually focus on low-carbon supply chain coordination under risk aversion and rarely extend to the impact of the irrational behavior of decision-makers on risk transfer in supply chains. For example, Zou et al. [29] discuss the optimal pricing decision process in supply chain systems under risk-neutral and risk-averse decision scenarios and analyze the impact of risk aversion coefficients on participants’ optimal strategies. Only some studies, such as Wang et al. [10], study supply chain risk transmission using the SIRS model, exploring multiple drivers such as corporate risk appetite. However, only the relationship between corporate risk preference and risk transmission threshold is briefly studied, and how the risk aversion characteristics of different firms in the supply chain trigger different degrees of risk transmission in the supply chain, as well as the impact of the degree of risk preference on risk transmission in the supply chain and the measurement of the degree of impact is not analyzed in depth. In summary, this paper is inspired by existing research on supplier-led low-carbon supply chains and introduces risk aversion factors into low-carbon supply chain risk transmission. The risk elasticity coefficient is used to solve the emission reduction risk and return risk in four supply chain scenarios in order to explore the impact of risk aversion characteristics on the emission reduction and return risk transmission effects of low-carbon supply chain firms.
The main innovations of this paper are as follows: (1) Previous scholars not only failed to extend the supply chain risk transmission to the field of the low-carbon supply chain but also failed to consider the irrational characteristics of individuals. In this paper, from the perspective of risk aversion, we consider that different members of the low-carbon supply chain have different risk aversion characteristics. Then, we study the risk transmission effect of the supply chain affected by internal and external unexpected factors. (2) Previous scholars solely concentrated on the impact of members’ risk aversion characteristics on the risk transfer effect of low-carbon supply chain enterprises. Instead of solely focusing on the impact of members’ risk aversion characteristics on the optimal decision-making and benefits of the supply chain, this paper constructs a risk aversion utility function and a risk elasticity coefficient, which can reveal the impact mechanism of enterprise risk aversion characteristics on the risk transmission of the whole low-carbon supply chain, and provide theoretical support for enterprises to formulate a more flexible and targeted risk management strategy. (3) The study in this paper yields some innovative and informative conclusions: under market demand uncertainty, the risk transmission effect is independent of supply chain members’ risk aversion characteristics, positively related to the degree of market demand volatility, and negatively related to market size. Manufacturers’ risk aversion characteristics can weaken the negative utility of suppliers’ risk aversion on the risk of manufacturers’ revenue volatility but exacerbate the risk transmission effect of manufacturers’ emission reductions under the influence of information asymmetry compared to the role of single-member risk aversion characteristics.

2. Low-Carbon Supply Chain Risk Transmission Modelling

2.1. Research Questions and Hypotheses

In a two-tier low-carbon supply chain system comprising suppliers and manufacturers, we investigate risk transmission within a low-carbon supply chain where node enterprises (supplier S and manufacturer M ) exhibit risk aversion characteristics. Against the backdrop of global carbon emission reduction efforts and the launch of China’s carbon trading market, manufacturers are incentivized to reduce carbon emissions in their production processes by investing in carbon reduction technologies transitioning towards green production in the supply chain. To encourage manufacturers to invest more costs in the manufacturing process for low-carbon transition, suppliers will share the carbon emission reduction costs invested by manufacturers.
Referring to the study of Wang et al. [30], joint carbon emission reduction in the supply chain consists of two phases: at the beginning of the joint emission reduction period, the supplier makes an emission reduction decision and decides on the proportion of the emission reduction cost to be shared by the manufacturer, denoted by λ ; in the second stage, given the sharing ratio, the manufacturer decides on the level of investment in carbon abatement technologies, denoted by k . It is assumed that both make decisions with the goal of maximizing their own interests. Internal and external emergencies in the supply chain take advantage of the vulnerability of the supply chain system to cause damage to the supply chain system, bringing losses to the upstream and downstream enterprises of the supply chain and the entire supply chain. When the supply chain’s internal and external unexpected risk factors act, it causes the product green goodwill and market demand fluctuation, and coupling with the supply chain structure triggers the risk. Fluctuations in market demand for low-carbon products will affect the emission reduction decisions of enterprises under different risk aversion characteristics, thus triggering changes in the level of suppliers’ emission reduction cost-sharing and leading to changes in the level of manufacturers’ emission reduction inputs. At the same time, there is uncertainty in the research and development and application of low-carbon technologies, and technological failure or failure to achieve the expected results will bring losses to enterprises. The links in a low-carbon supply chain are interdependent, and problems in one link can be transmitted to the entire supply chain. Fluctuations in the level of mitigation inputs will have an impact on low-carbon supply chain coordination, the process of driving carbon reductions, and business costs. Changes in this indicator will be of concern to investors, consumers, regulators, and other stakeholders, affecting the competitive position and long-term sustainability of enterprises. This process affects low-carbon supply chain coordination, the promotion of carbon emission reduction efforts, and overall enterprise costs, consequently altering the benefits accrued by both suppliers S and manufacturers M . The joint emission reduction decisions of enterprises and the risk transfer process of the low-carbon supply chain are shown in Figure 1.
In this study, the risk transfer effect of a low-carbon supply chain under the influence of risk factors is measured using the risk elasticity coefficient S y x . S y x denotes the risk elasticity coefficient of the risk point y with respect to x , i.e., the percentage change in point y in response to a 1 percent change in point x , all else being equal. Its positive or negative value indicates only the positive or negative impact of the risk factor, with a risk elasticity coefficient greater than zero indicating that a change in the initial risk point causes a change in the same direction as the associated risk point and a risk elasticity coefficient less than zero indicating that a change in the initial risk point causes a change in the opposite direction of the associated risk point. In this paper, we mainly consider the risk transmission caused by the level of carbon emission reduction technology research and development of manufacturers, the fluctuation of the quality of carbon emission information disclosure, and the uncertainty of the market demand, including the emission reduction risk and the return risk.
Drawing upon the risk aversion characteristics of system members, this paper initially examines the risk transmission within low-carbon supply chains from two perspectives. The first dimension is the optimal emission reduction decision and risk transmission of low-carbon supply chain members when suppliers have risk aversion characteristics and analyze the risk transmission utility of manufacturers’ risk preferences; the second dimension explores risk transmission when manufacturers possess risk aversion characteristics, elucidating the risk transmission utility of suppliers’ risk preferences. By integrating these two dimensions, we investigate the impact of risk transmission effects when members demonstrate risk aversion characteristics. The objective is to uncover the intrinsic mechanism of risk preferences among upstream and downstream nodes in low-carbon supply chains. In order to facilitate the study, this paper makes the following basic assumptions, and the main parameter settings are shown in Table 1.
Hypothesis 1.
Low-carbon manufacturers will selectively disclose information about the green quality of their products according to their own emission reduction. This information can enhance the good green image of the product, which is conducive to increasing the green goodwill of the product  G . Green goodwill is related to the disclosure accuracy  θ  of carbon emission information, i.e.,  G = θ k ,   θ [ 0 , 1 ] .
Hypothesis 2.
The market demand function of the product is  D = D 0 + α G β ( w + m ) + ε , where  D 0  represents the potential market demand;  α , β  represent the sensitivity coefficients of the market demand to the greenness of the product and the price ( α , β > 0 );  m  is the supplier’s price markup and  w  is the manufacturer’s price markup;  ε  denotes the uncertainty of the market demand, which obeys the normal distribution with a mean of 0 and a variance of  σ 2 , i.e.,  ε N ( 0 , σ 2 ) . This paper does not discuss the impact of sensitivity coefficients. To simplify the model, it is assumed that  α = β = 1 .
Hypothesis 3.
Assuming production costs are not considered, the upfront carbon abatement R&D cost ( C ) invested by the manufacturer exhibits a quadratic relationship with its abatement input level, denoted as  C = k r 2 / 2 . R&D input is a one-time input borne entirely by the manufacturer, where r is the carbon abatement R&D investment cost coefficient.
Hypothesis 4.
The mean-variance method is applied to measure the degree of risk aversion of system members, and the utility function of each member of the low-carbon supply chain is denoted as  U i = E ( π i ) η i V a r ( π i ) , where  π i ( i { m , s } )  denotes the benefit of the decision maker  i ;  η i  denotes the degree of the decision maker’s aversion to uncertain risk, where  η i = 0  denotes that the member is risk-neutral, and  η i > 0  denotes risk-averse, and the larger  η i  denotes that the member is more averse to risk.
Hypothesis 1 refers to the findings of Wang et al. [31], Cao et al. [32] and Wang [33] on information disclosure and green goodwill and assumes a positive correlation between the quality of carbon disclosure and product green goodwill. The product demand function and cost-input relationship function in Hypotheses 2 and 3 are consistent with existing supply chain production research settings [21,34,35], while linear price and greenness sensitivity are assumed along the lines of Raza and Govindaluri [25]. Hypothesis 4 is widely observed in most risk-averse supply chain coordination models [25,36,37].

2.2. Model Solution

2.2.1. Scenario 1: Low-Carbon Supply Chain Members Are Risk-Neutral

Firstly, consider the baseline scenario that all members of the low-carbon supply chain are risk-neutral. Both decision-making parties are rational individuals who are risk-neutral, with their utility functions being equal to their payoff functions, denoted as U ( π m ) = E ( π m ) . The payoff functions of the manufacturer and the supplier are as follows:
U 1 ( π m ) = w ( D 0 + G ( w + m ) + ε ) 1 2 ( 1 λ ) r k 2
U 1 ( π s ) = m ( D 0 + G ( w + m ) + ε ) 1 2 λ r k 2
The inverse induction method is used to solve the problem. Equation (1) for the first-order and second-order derivatives of w are U ( π m ) w = ε + D 0 m + θ k 2 w , 2 U ( π m ) w m 2 = 2 < 0 , so there is a unique optimal solution, according to the first-order condition U ( π m ) w = 0 to solve for: w 1 * = ε + D 0 m + θ k 2 . Substituting into Equation (2), the first-order and second-order derivatives of m are U ( π s ) m = ε + D 0 + θ k 2 m 2 and 2 U ( π s ) m 2 = 1 . Because of 2 U ( π s ) m 2 < 0 , there exists a unique optimal solution, and according to the first-order condition, it is m 1 * = ε + D 0 + θ k 2 . Substituting into Equation (1), the optimal level of carbon emission reduction inputs of the manufacturer is obtained, i.e., k 1 * = ( ε + D 0 ) θ 8 r ( 1 + λ ) + θ 2 . Substituting into Equation (2), the first-order condition is used to obtain the unique optimal abatement cost-sharing level of the supplier as λ 1 * = ( 24 r + θ 2 ) 40 r . Therefore, the final optimal carbon emission reduction input level of the manufacturer can be obtained as follows: k 1 * = 5 ( ε + D 0 ) θ 16 r 6 θ 2 . At this juncture, the optimal benefits for both the supplier and the manufacturer are as follows:
U 1 * ( π m ) = ( ε + D 0 ) 2 ( 16 r θ 2 ) 32 ( 8 r 3 θ 2 )
U 1 * ( π s ) = ( ε + D 0 ) 2 ( 64 r + θ 2 ) 64 ( 8 r 3 θ 2 )
To better illustrate the risk transmission dynamics stemming from emission reduction technology fluctuations, information disclosure, and other factors within the low-carbon supply chain, and to gauge the sensitivity of the manufacturer’s emission reduction input level, the supplier’s emission reduction cost-sharing level, and the system members’ benefits to these risk factors, we can once again obtain the risk elasticity coefficient, denoted as S k r 1 = k r r k = 8 r 8 r 3 θ 2 , S λ r 1 = λ r r λ = θ 2 θ 2 + 24 r ; S k θ 1 = k θ θ k = 8 r + 3 θ 2 8 r 3 θ 2 , S λ θ 1 = λ θ θ λ = 2 θ 2 θ 2 + 24 r , based on its definition. The risk elasticity coefficients for the benefits of the supplier and manufacturer with respect to r and θ are as follows:
S 1 π m r = π m r r π m = 40 r θ 2 128 r 2 56 r θ 2 + 3 θ 4
S 1 π s r = π s r r π s = 200 r θ 2 ( 8 r 3 θ 2 ) ( 64 r + θ 2 )
S 1 π m θ = π m θ θ π m = 80 r θ 2 128 r 2 56 r θ 2 + 3 θ 4
S 1 π s θ = π s θ θ π s = 400 r θ 2 ( 8 r 3 θ 2 ) ( 64 r + θ 2 )

2.2.2. Scenario 2: Only Suppliers Exhibit Risk Aversion Characteristics

When members lack risk aversion characteristics, their behavior is solely driven by self-interest aimed at maximizing their own benefits. However, when risk aversion characteristics are present, the objective shifts to maximizing utility. In this particular scenario, only the supplier is assumed to possess risk aversion characteristics, while the manufacturer’s utility function is equivalent to its benefit function, represented as U ( π m ) = E ( π m ) . Consequently, the benefit functions of the manufacturer and supplier are as follows:
U 2 ( π m ) = w ( D 0 + G ( w + m ) + ε ) 1 2 ( 1 λ ) r k 2
U 2 ( π s ) = m ( D 0 + G ( w + m ) + ε ) 1 2 λ r k 2 η s σ 2 m 2
The same inverse induction method is used to solve. Find the first-order derivative of Equation (9) with respect to w and make it equal to zero to obtain w 2 * = w 1 * = ε + D 0 m + θ k 2 . Substitute Equation (10) to obtain m 2 * = ε + D 0 + θ k 2 + 4 η s σ 2 . Substitute Equation (9) to obtain the optimal level of carbon emission reduction input of the manufacturer, k * , i.e., k 2 * = ( 1 + 4 η s σ 2 ) 2 ( ε + D 0 ) θ ( θ + 4 η s σ 2 θ ) 2 + 8 r ( 1 + 2 η s σ 2 ) 2 ( λ 1 ) . Substitute Equation (10) and use the first-order condition to obtain the optimal abatement cost-sharing level of the supplier, λ 2 * = ( 1 + 4 η s σ 2 ) 4 θ 2 8 r ( 1 + 2 η s σ 2 ) 2 ( 3 + 16 η s 2 σ 4 ) 8 r ( 1 + 2 η s σ 2 ) 2 ( 5 + 16 η s σ 2 + 16 η s 2 σ 4 ) . Therefore, we obtain the optimal level of carbon emission reduction input of the manufacturer when the manufacturer has the risk-averse characteristic as follows: k 2 * = ( 5 + 16 η s σ 2 + 16 η s 2 σ 4 ) ( ε + D 0 ) θ 16 r ( 1 + 2 η s σ 2 ) 2 2 ( 3 + 12 η s σ 2 + 16 η s 2 σ 4 ) θ 2 . At this time, the optimal benefits of the supplier and the manufacturer are as follows:
U 2 * ( π m ) = ( 1 + 4 η s σ 2 ) 2 ( ε + D 0 ) 2 ( 16 r ( 1 + 2 η s σ 2 ) 2 ( θ + 4 η s σ 2 θ ) 2 ) 32 ( 1 + 2 η s σ 2 ) 2 ( 8 r ( 1 + 2 η s σ 2 ) 2 ( 3 + 12 η s σ 2 + 16 η s σ 2 ) θ 2 )
U 2 * ( π s ) = ( ε + D 0 ) 2 ( 64 r ( 1 + 2 η s σ 2 ) 3 + ( 1 + 4 η s σ 2 ) 4 θ 2 ) 64 ( 1 + 2 η s σ 2 ) 2 ( 8 r ( 1 + 2 η s σ 2 ) ( 3 + 12 η s σ 2 + 16 η s 2 σ 4 ) θ 2 )
The risk elasticity coefficients of the supplier’s optimal abatement cost-sharing level and the manufacturer’s optimal abatement input level with respect to r and θ are as follows: S k θ 2 = 8 r ( 1 + 2 η s σ 2 ) 2 + ( 3 + 12 η s σ 2 + 16 η s 2 σ 4 ) θ 2 8 r ( 1 + 2 η s σ 2 ) 2 ( 3 + 12 η s σ 2 + 16 η s 2 σ 4 ) θ 2 , S k r 2 = 8 r ( 1 + 2 η s σ 2 ) 2 8 r ( 1 + 2 η s σ 2 ) 2 ( 3 + 12 η s σ 2 + 16 η s 2 σ 4 ) θ 2 ; S λ θ 2 = 2 ( 1 + 4 η s σ 2 ) 4 θ 2 ( 1 + 4 η s σ 2 ) 4 θ 2 8 r ( 1 + 2 η s σ 2 ) 2 ( 3 + 16 η s 2 σ 4 ) , S λ r 2 = ( 1 + 4 η s σ 2 ) 4 θ 2 8 r ( 1 + 2 η s σ 2 ) 2 ( 3 + 16 η s 2 σ 4 ) ( 1 + 4 η s σ 2 ) 4 θ 2 . The risk elasticity coefficients of supplier and manufacturer benefits with respect to θ and r are as follows:
S π s θ 2 = π s θ θ π s = 16 r ( 1 + 2 η s σ 2 ) 2 ( 5 + 16 η s σ 2 + 16 η s 2 σ 4 ) 2 θ 2 ( 64 r ( 1 + 2 η s σ 2 ) 3 + ( 1 + 4 η s σ 2 ) 4 θ 2 ( 8 r ( 1 + 2 η s σ 2 ) ( 3 + 12 η s σ 2 + 16 η s 2 σ 4 ) θ 2 )
S π m θ 2 = π m θ θ π m = 16 r ( 5 + 16 η s σ 2 + 16 η s 2 σ 4 ) 2 ( θ + 2 η s σ 2 θ ) 2 ( 16 r ( 1 + 2 η s σ 2 ) 2 ( θ + 4 θ η s σ 2 ) 2 ( 8 r ( 1 + 2 η s σ 2 ) ( 3 + 12 η s σ 2 + 16 η s 2 σ 4 ) θ 2 )
S π m r 2 = π m r r π m = 8 r ( θ + 2 θ η s σ 2 ) 2 ( 5 + 16 η s σ 2 + 16 η s 2 σ 4 ) ( 16 r ( 1 + 2 η s σ 2 ) 2 ( θ + 4 θ η s σ 2 ) 2 ( 8 r ( 1 + 2 η s σ 2 ) 2 θ 2 ( 3 + 12 η s σ 2 + 16 η s 2 σ 4 ) )
S π s r 2 = π s r r π s = 8 r θ 2 ( 1 + 2 η s σ 2 ) 2 ( 5 + 16 η s σ 2 + 16 η s 2 σ 4 ) 2 ( 64 r ( 1 + 2 η s σ 2 ) 3 + ( 1 + 4 η s σ 2 ) 4 θ 2 ( 8 r ( 1 + 2 η s σ 2 ) 2 θ 2 ( 3 + 12 η s σ 2 + 16 η s 2 σ 4 ) )

2.2.3. Scenario 3: Only the Manufacturer Exhibits Risk Aversion

In the scenario where the manufacturer demonstrates risk aversion, the benefit functions of the manufacturer and the supplier are as follows:
U 3 ( π m ) = w ( D 0 + G ( w + m ) + ε ) 1 2 ( 1 λ ) r k 2 η m σ 2 w 2
U 3 ( π s ) = m ( D 0 + G ( w + m ) + ε ) 1 2 λ r k 2
Treating the above problem, similar to Section 2.2.1, the analysis is carried out using the reverse induction method to obtain the equilibrium solutions of the above Stackelberg game, λ 3 * and k 3 * . Substituting the equilibrium solutions into Equations (17) and (18) yields the optimal utilities of the supplier and the manufacturer, respectively, as follows:
U 3 * ( π m ) = ( ε + D 0 ) 2 ( 16 r ( 1 + η m σ 2 ) θ 2 ) 32 ( 1 + η m σ 2 ) ( 8 r ( 1 + η m σ 2 ) θ 2 ( 3 + 4 η m σ 2 ) )
U 3 * ( π s ) = ( ε + D 0 ) 2 ( 64 r ( 1 + 3 η m σ 2 + 2 η m 2 σ 4 ) + θ 2 ) 64 ( 1 + η m σ 2 ) ( 8 r ( 1 + η m σ 2 ) ( 3 + 4 η m σ 2 ) θ 2 )
Similarly, the risk elasticity coefficients of the supplier’s optimal abatement cost-sharing level and the manufacturer’s optimal abatement input level with respect to the risk factors S k θ 3 = 8 r ( 1 + η m σ 2 ) + θ 2 ( 3 + 4 η m σ 2 ) 8 r ( 1 + η m σ 2 ) θ 2 ( 3 + 4 η m σ 2 ) , S k r 3 = 2 r ( 1 + η m σ 2 ) 8 r ( 1 + η m σ 2 ) θ 2 ( 3 + 4 η m σ 2 ) , S λ θ 3 = 2 θ 2 θ 2 + 8 r ( 3 + 11 η m σ 2 + 8 η m 2 σ 4 ) and S λ r 3 = θ 2 θ 2 + 8 r ( 3 + 11 η m σ 2 + 8 η m 2 σ 4 ) are calculated, and the risk elasticity coefficients of the supplier’s and manufacturer’s returns with respect to θ and r are as follows:
S π s θ 3 = 16 r ( 1 + η m σ 2 ) ( 5 + 8 η m σ 2 ) 2 θ 2 ( 64 r ( 1 + 3 η m σ 2 + 2 η m 2 σ 4 ) + θ 2 ) ( 8 r ( 1 + η m σ 2 ) ( 3 + 4 η m σ 2 ) θ 2 )
S π m θ 3 = 16 r θ 2 ( 1 + η m σ 2 ) ( 5 + 8 η m σ 2 ) ( 16 r ( 1 + η m σ 2 ) θ 2 ) ( 8 r ( 1 + η m σ 2 ) ( 3 + 4 η m σ 2 ) θ 2 )
S π m r 3 = 8 r θ 2 ( 1 + η m σ 2 ) ( 5 + 8 η m σ 2 ) ( 16 r ( 1 + η m σ 2 ) θ 2 ) ( 8 r ( 1 + η m σ 2 ) ( 3 + 4 η m σ 2 ) θ 2 )
S π s r 3 = 8 r ( 1 + η m σ 2 ) ( 5 + 8 η m σ 2 ) 2 θ 2 ( 64 r ( 1 + 3 η m σ 2 + 2 η m 2 σ 4 ) + θ 2 ) ( 8 r ( 1 + η m σ 2 ) ( 3 + 4 η m σ 2 ) θ 2 )

2.2.4. Scenario 4: Risk Aversion among All Members of the Low-Carbon Supply Chain

When all members of the low-carbon supply chain have risk aversion characteristics, their utility functions are modeled according to the mean-variance theory. The benefit functions of both manufacturers and suppliers are then defined as follows:
U 4 ( π m ) = w ( D 0 + G ( w + m ) + ε ) 1 2 ( 1 λ ) r k 2 η m σ 2 w 2
U 4 ( π s ) = m ( D 0 + G ( w + m ) + ε ) 1 2 λ r k 2 η s σ 2 m 2
Using the same backward induction method, we derive the equilibrium solutions λ 4 * and k 4 * for the Stackelberg game in this scenario. By substituting these equilibrium solutions into Equations (25) and (26), we can obtain the optimal utility of the supplier ( U 4 * ( π s ) ) and the optimal utility of the manufacturer ( U 4 * ( π m ) ), respectively. Following the methodology outlined in Section 2.2.1, we then determine the optimal level of abatement cost-sharing by the supplier and the optimal level of abatement inputs by the manufacturer. The risk elasticity coefficients for the supplier’s optimal abatement cost-sharing level and the manufacturer’s optimal abatement input level with respect to the risk factors r and θ are as follows: S k θ 4 , S k r 4 , S λ θ 4 , S λ r 4 . Additionally, the risk elasticity coefficients for the returns of both the supplier and the manufacturer to θ and r are as follows:
S π s θ 4 = 16 r ( 1 + 2 η s σ 2 ) 2 + η m σ 2 ) ( 5 + 8 η m σ 2 + 16 η s σ 2 + 16 η s 2 σ 4 ) 2 θ 2 ( 64 r ( ( 1 + 2 η s σ 2 ) 3 + 3 η m σ 2 + 2 η m 2 σ 4 ) + ( 1 + 4 η s σ 2 ) 4 θ 2 ) ( 8 r ( ( 1 + 2 η s σ 2 ) 2 + η m σ 2 ) ( 3 + 4 η m σ 2 + 12 η s σ 2 + 16 η s 2 σ 4 ) θ 2 )
S π m θ 4 = 16 r ( 1 + 2 η s σ 2 ) 2 + η m σ 2 ) ( 5 + 8 η m σ 2 + 16 η s σ 2 + 16 η s 2 σ 4 ) 2 θ 2 ( 16 r ( ( 1 + 2 η s σ 2 ) 2 + η m σ 2 ) ( 1 + 4 η s σ 2 ) 4 θ 2 ) ( 8 r ( ( 1 + 2 η s σ 2 ) 2 + η m σ 2 ) ( 3 + 4 η m σ 2 + 12 η s σ 2 + 16 η s 2 σ 4 ) θ 2 )
S π m r 4 = 8 r ( 1 + 2 η s σ 2 ) 2 + η m σ 2 ) ( 5 + 8 η m σ 2 + 16 η s σ 2 + 16 η s 2 σ 4 ) 2 θ 2 ( 16 r ( ( 1 + 2 η s σ 2 ) 2 + η m σ 2 ) ( 1 + 4 η s σ 2 ) 4 θ 2 ) ( 8 r ( ( 1 + 2 η s σ 2 ) 2 + η m σ 2 ) ( 3 + 4 η m σ 2 + 12 η s σ 2 + 16 η s 2 σ 4 ) θ 2 )
S π s r 4 = ( 8 r ( 1 + 2 η s σ 2 ) 2 + η m σ 2 ) ( 5 + 8 η m σ 2 + 16 η s σ 2 + 16 η s 2 σ 4 ) 2 θ 2 ) ( 64 r ( ( 1 + 2 η s σ 2 ) 3 + 3 η m σ 2 + 2 η m 2 σ 4 ) + ( 1 + 4 η s σ 2 ) 4 θ 2 ) ( 8 r ( ( 1 + 2 η s σ 2 ) 2 + η m σ 2 ) ( 3 + 4 η m σ 2 + 12 η s σ 2 + 16 η s 2 σ 4 ) θ 2 )

3. Risk Transfer Utility of Low-Carbon Supply Chain with Risk Aversion Characteristics

3.1. Abatement Risk Transfer Utility

Proposition 1.
When only the manufacturer in a low-carbon supply chain has the risk-averse characteristic,  S k r 1 < 1 < S k r 3 < 0 ,  1 < S k θ 1 < S k θ 3 ;  0 < S λ θ 3 < S λ θ 1 < 1 ,  1 < S λ r 1 < S λ r 3 < 0 .
Proof. 
From Section 2.2: S k r 3 S k r 1 = ( 8 r 3 θ 2 ) ( 1 + η m σ 2 ) 8 r ( 1 + η m σ 2 ) ( 3 + 4 η m σ 2 ) θ 2 , the 3 θ 2 ( 1 + η m σ 2 ) in the numerator part is less than the θ 2 ( 3 + 4 η m σ 2 ) in the denominator part, so after making the difference, the overall numerator part is greater than the denominator part, so S k r 1 S k r 3 > 1 , and because of S k r 1 , S k r 3 < 0 , so | S k r 3 | < | S k r 1 | . Similarly, it is easy to obtain S k θ 3 S k θ 1 = ( 8 r 3 θ 2 ) ( 8 r ( 1 + η m σ 2 ) + ( 3 + 4 η m σ 2 ) θ 2 ) ( 8 r + 3 θ 2 ) ( 8 r ( 1 + η m σ 2 ) ( 3 + 4 η m σ 2 ) θ 2 ) > 1 , so S k θ 3 > S k θ 1 . Furthermore, due to S λ θ 3 S λ θ 1 = S λ r 3 S λ r 1 = 24 r + θ 2 θ 2 + 8 r ( 3 + 11 η m σ 2 + 8 η m 2 σ 4 ) , where 24 r < 8 r ( 3 + 11 η m σ 2 + 8 η m 2 σ 4 ) , thus S λ θ 3 < S λ θ 1 , | S λ r 3 | < | S λ r 1 | . Hence, Proposition 1 is proven. □
Proposition 1 demonstrates that when the manufacturer exhibits risk-averse behavior, the transmission of abatement risk from the supplier is mitigated compared to when all members of the low-carbon supply chain are risk-neutral. Simultaneously, the volatility risk associated with the manufacturer’s abatement inputs is influenced by both disclosure quality and the cost factor of abatement technology. Manufacturers’ risk aversion tendencies are typically associated with a low tolerance for uncertainty. Consequently, manufacturers often opt for more stable abatement technologies to manage abatement inputs, thereby reducing the risk of input fluctuations driven by the cost coefficients of abatement technologies. The abatement cost to be borne by the suppliers upstream of the low-carbon supply chain will be reduced accordingly, reducing the risk of cost fluctuations. However, within a conservative emission reduction strategy framework, manufacturers tend to selectively disclose emission reduction information to their low-carbon supply chain partners. This selective disclosure can result in other enterprises having a limited understanding of the manufacturer’s emission reduction technology and its effectiveness, ultimately negatively impacting market response and brand reputation.
In addition to this, it can be seen from Section 2.2 that the values of the risk elasticity coefficients of the suppliers’ abatement cost-sharing levels are all in the interval (0, 1). The risk elasticity coefficients of the abatement input levels are greater than 1 when the manufacturer is risk-neutral and less than 1 when it is risk-averse, which indicates that the supplier abatement risk transmission effect caused by the fluctuation of the risk factor is weakening, i.e., a 1% change in the investment cost coefficient r and the quality of the disclosure θ is less than a 1% change in the level of the abatement cost-sharing, and the supplier abatement risk transmission effect caused by the fluctuation of the risk factor is increasing. The risk transfer effect of manufacturers’ emission reduction risk due to the fluctuation of risk factors is increasing, i.e., a 1% change in the investment cost coefficient r and disclosure quality θ will result in a greater than 1% change in the level of emission reduction inputs. At the same time, the risk aversion characteristic of manufacturers can greatly reduce the risk transmission effect of their own emission reduction input.
Proposition 2.
When only the suppliers in the low-carbon supply chain have the risk aversion property,  S k r 2 < S k r 1 < 1 ,  1 < S k θ 1 < S k θ 2 . In addition, there exist critical values of the risk aversion coefficients of the suppliers  η s *  ( η s * 1  and  η s * 2 ), when  η s < η s * ,  0 < S λ θ 1 < S λ θ 2 < 1 ,  1 < S λ r 2 < S λ r 1 < 0 ; when  η s > η s * ,  S λ θ 2 < 0 < S λ θ 1 < 1 ,  1 < S λ r 1 < 0 < S λ r 2 . Where  η s * 1  is the critical value of the risk aversion coefficient with respect to  S λ θ 1 , and  η s * 2  is the critical value of the risk aversion coefficient with respect to  S λ r 1 .
Proof. 
From Section 2.2.2 it is easy to achieve S k θ 2 > 1 , S k r 2 < 1 , S λ θ 2 and S λ r 2 are not always positive or always negative. Let ( 24 r 128 r η s 2 σ 4 ) ( 1 + 2 η s σ 2 ) 2 + ( 1 + 4 η s σ 2 ) 4 θ 2 = 0 , the calculation can achieve the critical value of the risk aversion coefficient η s * 1 of S λ θ 2 . Let 128 r η s 2 σ 4 ( 1 + 2 η s σ 2 ) 2 ( 24 r ( 1 + 2 η s σ 2 ) 2 + ( 1 + 4 η s σ 2 ) 4 θ 2 ) = 0 , the calculation can achieve the critical value of the risk aversion coefficient η s * 2 of S λ r 2 . Due to the complexity of the calculation results, they will not be listed in this part, and the validation can be seen in the simulation results in Section 5.2.
In addition, compared with the risk elasticity coefficient of emission reduction, where all members of the low-carbon supply chain are risk-neutral, it is easy to obtain S λ θ 2 S λ θ 1 = S λ r 2 S λ r 1 = ( 1 + 4 η s σ 2 ) 4 ( 24 r + θ 2 ) ( 1 + 4 η s σ 2 ) 4 θ 2 8 r ( 1 + 2 η s σ 2 ) 2 ( 3 + 16 η s 2 σ 4 ) . It can be seen that the 24 r ( 1 + 4 η s σ 2 ) 4 part of the numerator is greater than the 24 r ( 1 + 4 η s σ 2 ) 4 8 r ( 1 + 2 η s σ 2 ) 2 ( 16 η s 2 σ 4 ) part of the denominator, so the numerator is greater than the denominator, which is easily obtained: S λ θ 2 S λ θ 1 > 1 , so S λ θ 2 > S λ θ 1 , | S λ r 2 | > | S λ r 1 | . The same calculation yields S k θ 2 > S k θ 1 , | S k r 2 | > | S k r 1 | . The proof of Proposition 2 is complete. □
Proposition 2 indicates that the risk aversion characteristics of suppliers have a negative effect on the emission reduction risk of manufacturers. Specifically, the risk aversion characteristics of suppliers increase the fluctuation risk of manufacturers’ emission reduction inputs under the influence of risk factors. Additionally, the risk aversion characteristics of suppliers also increase the fluctuation risk of their own emission reduction inputs. Furthermore, when the risk aversion characteristics of suppliers exceed a certain threshold, it affects the fluctuation trend of their cost sharing for emission reduction under the influence of risk factors. In contrast to the scenario where all members of the low-carbon supply chain are risk-neutral, fluctuations in the emission investment cost coefficient cause suppliers’ cost sharing to change in the same direction, while fluctuations in information disclosure quality cause suppliers’ cost sharing to change in the opposite direction. In order to avoid the risks associated with market changes, risk-averse suppliers choose to reduce their share of abatement costs to manufacturers in order to remain competitive. This results in suppliers being more cost-conscious and less willing to invest in emissions reduction. Meanwhile, manufacturers will bear the entire carbon reduction task of the entire low-carbon supply chain. They need to strike a balance between environmental protection and cost to ensure the sustainability of their products, thereby facing increased pressure from emission reduction costs.
When the degree of risk aversion is low, as the abatement investment cost coefficient r increases, suppliers will be more inclined to reduce the abatement cost sharing and shift more costs to other low-carbon supply chain participants in the hope of realizing cost reductions in the long run. With the increased disclosure of carbon emissions information and growing public concern for environmental protection and sustainable development, the market demand for environmentally friendly products and companies is growing, and suppliers are able to gain a more comprehensive understanding of the carbon emission reduction challenges faced by the entire supply chain. In order to maintain market competitiveness and the sustainability of the entire low-carbon supply chain, suppliers are more willing to take responsibility for emissions reduction and tend to increase their efforts to meet consumer and market expectations. Meanwhile, more risk-averse suppliers tend to choose known and relatively stable abatement strategies in order to maintain long-term competitiveness and the sustainability of the supply chain and to increase the level of abatement cost-sharing to promote the green development of low-carbon supply chains, thereby avoiding business risks.
In addition, it can be observed that the risk elasticity coefficients of manufacturers’ abatement inputs are all greater than 1, suggesting that changes in manufacturers’ abatement investment cost coefficients and the quality of disclosure can cause enhanced abatement risk transmission effects. The risk elasticity coefficients of suppliers’ abatement inputs are located in the interval (0, 1), which is the same as the conclusion in Proposition 1, also indicating that changes in abatement investment cost coefficients and the quality of information disclosure will cause a weakened abatement risk transmission effect.
Proposition 3.
When both the supplier and the manufacturer have risk aversion characteristics,  S k r 2 < S k r 4 < 1 < S k r 3 < 0 ,  1 < S k θ 2 < S k θ 3 < S k θ 4 . There exists a critical value of the supplier’s risk aversion coefficient  η s *  ( η s * 1  and  η s * 2 ), when  η s < η s * ,  0 < S λ θ 3 < S λ θ 4 < S λ θ 2 < 1 ,  1 < S λ r 2 < S λ r 4 < S λ r 3 < 0 ; when  η s > η s * ,  S λ θ 2 < 0 < S λ θ 3 < S λ θ 4 < 1 ,  1 < S λ r 4 < S λ r 3 < 0 < S λ r 2 , where  η s * 1  is the critical value of the risk aversion coefficient with respect to  S λ θ 2  and  η s * 2  is the critical value of the risk aversion coefficient with respect to  S λ r 2 .
Proof. 
The proof is the same as Proposition 2. □
Proposition 3 indicates that when both suppliers and manufacturers exhibit risk aversion characteristics, the negative impact of supplier risk aversion on the transmission of abatement risk to manufacturers will be mitigated. However, it will exacerbate the effect of manufacturers’ abatement risk transmission under the influence of information asymmetry compared to the impact of a single member’s risk aversion characteristic. While the risk aversion of manufacturers has a positive effect on the transmission of abatement risk to suppliers, when the risk aversion coefficient of suppliers exceeds a certain level, it still worsens the risk of fluctuation of their own abatement inputs.
Risk aversion is an important behavioral factor in the financial and operational management of supply chains, and existing research suggests that risk aversion of members in supply chain coordination contracts will influence attitudes towards uncertainty and potential risks [38], leading supply chain members to adopt more flexible pricing strategies to adapt to market volatility and changes in risk [28,39]. Based on these studies, this paper enriches the existing findings by extending the supply chain risk aversion model and finding that the risk aversion characteristics of manufacturers have a certain inhibitory effect on risk transmission in the supply chain. In addition, suppliers, as node firms in the upstream of the supply chain, will play an important role in joint carbon emission reduction by their carbon emission reduction decisions [40]. In this paper, it is further found that the risk aversion characteristic of suppliers increases the risk of volatility of manufacturers’ emission reduction inputs under the influence of risk factors. At the same time, suppliers’ risk aversion also increases the volatility risk of their own emission reduction inputs.

3.2. Revenue Risk Transmission Utility

The previous section has analyzed the abatement risk transmission utility of risk aversion characteristics. This section explores the return risk transmission utility of risk aversion characteristics, investigating the relationship between return fluctuations caused by internal and external risk events and the risk aversion characteristics of low-carbon supply chain members.
Proposition 4.
When only suppliers in a low-carbon supply chain have the risk aversion characteristic in response to the firm’s return risk, there are  0 < S π m θ 1 < S π m θ 2 < 1 ,  1 < S π m r 2 < S π m r 1 < 0 ;  0 < S π s θ 2 < S π s θ 1 < 1 ,  1 < S π s r 1 < S π s r 2 < 0 .
Proof. 
Since S π m θ 1 S π m θ 2 = ( 128 r 2 56 r θ 2 + 3 θ 4 ) ( 1 + 2 η s σ 2 ) 2 ( 5 + 16 η s σ 2 + 16 η s 2 σ 4 ) 5 ( 16 r ( 1 + 2 η s σ 2 ) 2 ( θ + 4 θ η s σ 2 ) 2 ) ( 8 r ( 1 + 2 η s σ 2 ) 2 θ 2 ( 3 + 12 η s σ 2 + 16 η s 2 σ 4 ) ) = S π m r 1 S π m r 2 , and 128 r 2 ( 1 + 2 η s σ 2 ) 2 + 3 θ 4 ( 1 + 4 η s σ 2 + 16 3 η s 2 σ 4 ) > ( 128 r 2 + 3 θ 4 ) ( 1 + 16 5 η s σ 2 + 16 5 η s 2 σ 4 ) , it is easy to obtain S π m θ 1 S π m θ 2 < 1 , i.e., 0 < S π m θ 1 < S π m θ 2 < 1 , S π m r 2 < S π m r 1 < 0 . The same reasoning leads to S π s θ 1 S π s θ 2 = S π s r 1 S π s r 2 = ( 8 r 3 θ 2 ) ( 64 r + θ 2 ) ( 1 + 2 η s σ 2 ) 2 ( 5 + 16 η s σ 2 + 16 η s 2 σ 4 ) 2 25 ( 64 r ( 1 + 2 η s σ 2 ) 3 + θ 2 ( 1 + 4 η s σ 2 ) 4 ) ( 8 r ( 1 + 2 η s σ 2 ) 2 θ 2 ( 3 + 12 η s σ 2 + 16 η s 2 σ 4 ) ) > 1 , so 0 < S π s θ 2 < S π s θ 1 < 1 , S π s r 1 < S π s r 2 < 0 . The proof of Proposition 4 is complete. □
Proposition 4 demonstrates that compared to when all members of the low-carbon supply chain are risk-neutral, the risk aversion characteristics of suppliers can reduce the volatility ratio of their own returns under the influence of emission reduction technology and information disclosure quality. However, it has a negative utility on the return risk of manufacturers. If suppliers exhibit risk aversion characteristics, they will control the level of cost sharing for emission reduction with manufacturers in order to manage costs and mitigate their economic risks. By mitigating risks, suppliers can decrease their own return risk, ensuring relatively stable profits during the emission reduction process. As the leaders in jointly reducing emissions in the low-carbon supply chain, suppliers are more likely to pass on emission reduction costs to manufacturers, leading to increased economic pressure and greater emission reduction responsibilities for manufacturers, thereby amplifying their return risk. Considering that the upstream enterprises have risk aversion characteristics, in order to avoid excessive emission reduction cost loss, the manufacturer will appropriately reduce the level of emission reduction inputs ( k 1 * > k 3 * ), which reduces the enterprise’s green goodwill and increases the risk of revenue.
Proposition 5.
When only the manufacturer in the low-carbon supply chain has the risk aversion characteristic for the firm’s return risk, there is:  0 < S π m θ 1 < S π m θ 3 < 1 ,  1 < S π m r 3 < S π m r 1 < 0 ;  0 < S π s θ 1 < S π s θ 3 < 1 ,  1 < S π s r 3 < S π s r 1 < 0 .
Proof. 
Since S π m θ 3 S π m θ 1 = ( 128 r 2 56 r θ 2 + 3 θ 4 ) ( 1 + η m σ 2 ) ( 5 + 8 η m σ 2 ) 5 ( 16 r ( 1 + 2 η m σ 2 ) θ 2 ) ( 8 r ( 1 + η m σ 2 ) θ 2 ( 3 + 4 η m σ 2 ) ) = S π m r 3 S π m r 1 , and 128 r 2 ( 1 + 2 η m σ 2 ) 48 r θ 2 ( 1 + 4 3 η m σ 2 ) 8 r θ 2 > 128 r 2 ( 1 + 8 5 η m σ 2 ) 56 r θ 2 ( 1 + 8 5 η m σ 2 ) , it is easy to obtain S π m θ 3 S π m θ 1 < 1 , i.e., 0 < S π m θ 3 < S π m θ 1 < 1 , 0 < S π m r 3 < S π m r 1 < 1 . The same calculation gives S π s θ 2 S π s θ = S π s r 2 S π s r = ( 8 r 3 θ 2 ) ( 64 r + θ 2 ) ( 1 + η m σ 2 ) ( 5 + 8 η m σ 2 ) 2 25 ( 8 r ( 1 + η m σ 2 ) θ 2 ( 3 + 4 η m σ 2 ) ) ( θ 2 + 64 r ( 1 + 3 η m σ 2 + 2 η m 2 σ 4 ) ) > 1 , so 0 < S π s θ 1 < S π s θ 3 < 1 , 1 < S π s r 3 < S π s r 1 < 0 . The proof of Proposition 5 is complete. □
Proposition 5 suggests that the risk aversion characteristics of manufacturers increase the volatility risk of returns for low-carbon supply chain enterprises under the influence of risk factors. When manufacturers exhibit risk aversion characteristics, it implies they will adopt more conservative emission reduction strategies to mitigate potential cost risks, leading to delayed adoption of new technologies or implementation of environmental measures. The reduction in emission reduction inputs in the low-carbon supply chain will decrease the competitiveness of their products in the market, thereby impacting revenue. Moreover, manufacturers will more cautiously adjust procurement plans to mitigate market and environmental risks, resulting in greater fluctuations in supplier orders and hindering emission reduction cooperation in the low-carbon supply chain. Additionally, to adapt to the manufacturer’s risk aversion strategy and reduce their own risks, suppliers need to make corresponding adjustments when emission reduction technology and information disclosure quality fluctuate, leading to greater revenue volatility.
In addition, the values of the risk elasticity coefficients of suppliers’ and manufacturers’ earnings with respect to r and θ are within the interval (0, 1), indicating that the risk transmission effect of earnings due to volatility is weakening, i.e., a 1% change in the risk factor results in less than a 1% change in suppliers’ and manufacturers’ earnings. This means that even if there are fluctuations in the level of emission reduction technology and the quality of carbon emission information in the market, the change in the returns of suppliers and manufacturers is relatively small.
Proposition 6.
When both suppliers and manufacturers in a low-carbon supply chain have risk-averse characteristics, the risk to returns against firms is both:  0 < S π m θ 3 < S π m θ 4 < S π m θ 2 < 1 ,  1 < S π m r 3 < S π m r 2 < S π m r 4 < 0 ;  0 < S π s θ 2 < S π s θ 3 < S π s θ 4 < 1 ,  1 < S π s r 2 < S π s r 3 < S π s r 4 < 0 .
Proof. 
The proof process is the same as Proposition 4. □
Proposition 6 indicates that for manufacturers, their own risk aversion characteristics alleviate the negative utility of supplier risk aversion on the transmission of income risk to them. When both suppliers and manufacturers exhibit risk aversion characteristics, the negative utility of manufacturer risk aversion on the transmission of income risk to suppliers is mitigated, but it exacerbates the volatility risk of supplier income under the influence of information disclosure quality. While suppliers mitigate risk by adjusting their cost-sharing levels for manufacturer emission reduction costs, manufacturers with risk aversion characteristics also adjust emission reduction levels or production scales appropriately, thereby buffering the negative utility of risk from suppliers. However, in cases of information opacity, suppliers adopt more conservative risk aversion strategies, adjusting production inputs and emission reduction plans to mitigate market and environmental risks, resulting in greater income volatility.
Proposition 7.
The risk transmission utility of market demand uncertainty is not affected by the risk aversion characteristics of low-carbon supply chain members but is positively correlated with the fluctuation degree of market demand and negatively correlated with the market size.
Proof. 
The risk elasticity coefficients of suppliers’ and manufacturers’ returns to ε in the four scenarios can be obtained as follows: S π i ε = S π i ε j = π i ε ε π i = 2 ε ε + D 0 , where i = m , s ;   j = 1 , 2 , 3 , 4 , therefore, regardless of whether the members of the low-carbon supply chain have risk aversion characteristics or not, it does not affect the degree of impact of the market risk on returns. The partial derivatives of the above equation with respect to ε and D 0 , respectively, are calculated as S π ε ε = 2 D 0 ( ε + D 0 ) 2 > 0 , S π ε D 0 = 2 ε ( ε + D 0 ) 2 < 0 . Therefore, the degree of market volatility is positively related to its risk-transferring utility on returns, and market size is negatively related to its risk-transferring utility on returns. Thus, Proposition 7 is proved. □
Kazaz B and Webster [41] on the issue of supply uncertainty and risk aversion show that the concavity of the objective function remains unchanged with the introduction of risk aversion if the source of uncertainty is demand but does not necessarily retain the concavity of the objective function if the source of uncertainty is supply, and that the two types of uncertainty tend to make the directionality of risk aversion on optimal decision-making effects to cancel each other out. Proposition 7, on the other hand, extends this finding well by finding that the risk transmission effect of market fluctuations is not affected regardless of whether or not members of the low-carbon supply chain have risk aversion characteristics. This is because market demand fluctuations are often influenced by various factors, such as changes in consumer demand, economic conditions, and competitiveness. When facing market demand fluctuations, although suppliers and manufacturers can take some risk mitigation measures, the uncontrollability of external factors, asymmetric information, and the complexity of market demand makes it difficult for them to completely avoid income risk fluctuations caused by market demand fluctuations. However, a larger market scale may lead to lower emission reduction risks, and greater uncertainty in market demand may induce higher emission reduction risks. Increased uncertainty in market demand may lead to inventory backlogs or supply shortages, thereby affecting the operations and income of enterprises within the low-carbon supply chain. A larger market scale allows companies to better spread fixed costs, helping to alleviate risks caused by demand uncertainty.
Corollary 1.
The abatement risk and return risk transmission effects of low-carbon supply chain firms are both negatively related to the coefficient of abatement investment costs and positively related to the quality of disclosure. Fluctuations in market demand affect manufacturers’ abatement inputs, which in turn cause same-direction changes in the returns of low-carbon supply chain members and gradually amplify the effects during the transmission process.
Proof. 
The first-order derivatives of the abatement risk elasticity coefficients of suppliers and manufacturers with respect to the abatement investment cost coefficient and the quality of disclosure can be obtained, respectively: S k θ 1 θ = 96 r θ ( 8 r 3 θ 2 ) 2 > 0 , S λ θ 1 θ = 96 r θ ( 24 r + θ 2 ) 2 > 0 . Because S k r 1 = 8 r 8 r 3 θ 2 < 0 , S λ r 1 = θ 2 θ 2 + 24 r < 0 , and S k r 1 r = 24 θ 2 ( 8 r 3 θ 2 ) 2 > 0 , S λ r 1 r = 24 θ 2 ( 24 r + θ 2 ) 2 > 0 , according to the definition of risk elasticity coefficient, the larger the abatement investment cost coefficient is, the smaller the abatement risk elasticity coefficient of low-carbon supply chain enterprises is. The same calculation can be obtained from the correlation between the risk elasticity coefficient of an enterprise’s return and the risk factor.
The risk elasticity coefficients of suppliers’ and manufacturers’ returns with respect to ε are found for Equations (3) and (4) as: S π s ε 1 = S π m ε 1 = π s ε ε π s = 2 ε ε + D 0 . In addition, the optimal level of manufacturers’ abatement inputs k * = 5 ( ε + D 0 ) θ 16 r 6 θ 2 yields S k ε 1 = k ε ε k = ε ε + D 0 > 0 . Because of S k ε 1 < S π ε 1 , the impact of market demand fluctuation on the overall returns of low-carbon supply chain members is greater than the impact on the emission reduction inputs. The proof is complete. □
Corollary 1 reflects the correlation between r and θ on the abatement risk as well as the return risk of low-carbon supply chains. When information disclosure quality is at a higher level, the volatility of emission reduction inputs for both suppliers and manufacturers increases. This is because higher levels of carbon emission disclosure make green investments in the low-carbon supply chain more transparent, leading to increased uncertainty in product demand as other enterprises and consumers adjust their consumption needs based on manufacturers’ carbon emission results. Additionally, manufacturers showcase their carbon emissions status and reduction goals to stakeholders through carbon emission disclosure, attracting more attention and assessment from consumers, investors, and governments. In such circumstances, any non-compliance or changes in emission reduction within the supply chain will receive greater scrutiny, requiring manufacturers to adjust strategies flexibly, thus increasing volatility risk. A higher emission reduction investment cost coefficient indicates that enterprises are more willing to engage in higher-quality, long-term, and stable emission reduction investments to ensure the sustainability of emission reduction goals. A higher emission reduction investment cost coefficient also suggests that enterprises are more inclined to diversify investments rather than rely too heavily on a specific emission reduction measure, which helps reduce risks associated with specific emission reduction projects.

4. Risk Transfer Utility of Low-Carbon Supply Chain with the Degree of Risk Aversion

Proposition 8.
The greater the degree of risk aversion among manufacturers, the greater the income volatility risk for enterprises within the low-carbon supply chain. Specifically, as the intensity of risk aversion among manufacturers increases, the emission reduction risk for suppliers decreases while the emission reduction risk for manufacturers themselves increases.
Proof. 
The first-order derivative of the manufacturer’s risk aversion coefficient can be obtained for the elasticity coefficients of the manufacturer’s and supplier’s abatement risks, respectively: S k θ 3 η m = 16 r θ 2 σ 2 ( 8 r ( 1 + η m σ 2 ) + θ 2 ( 3 + 4 η m σ 2 ) ) 2 > 0 , S λ θ 3 η m = 16 r θ 2 σ 2 ( 11 + 16 η m σ 2 ) ( 8 r ( 3 + 11 η m σ 2 + 8 η m 2 σ 4 ) + θ 2 ) 2 < 0 .
Also due to S k r 3 < 0 , S λ r 3 < 0 , and S k r 3 η m = 2 r θ 2 σ 2 ( 8 r ( 1 + η m σ 2 ) + θ 2 ( 3 + 4 η m σ 2 ) 2 < 0 , S λ r 3 η m = 512 r θ 2 σ ( ε + D 0 ) ( ( ε + D 0 ) ( 24 r + θ 2 ) + σ η m ( 56 r 19 θ 2 ) ) 2 > 0 , according to the definition of the risk elasticity coefficient, the greater the degree of risk aversion of the manufacturer, the smaller the risk elasticity coefficient of abatement of the supplier, and the greater the risk elasticity coefficient of abatement of the manufacturer. The same calculation can be obtained from the correlation between the risk elasticity coefficient of the enterprise’s earnings and the manufacturer’s degree of risk aversion. □
Proposition 9.
When the degree of risk aversion among suppliers is higher, the income volatility risk for suppliers decreases, while the emission reduction risk and income risk for manufacturers continue to increase. Additionally, when the degree of risk aversion among suppliers is lower, the emission reduction risk for manufacturers themselves increases gradually as the intensity of risk aversion among suppliers increases, with the magnitude of the increase gradually amplifying. Conversely, when the degree of risk aversion among suppliers is higher, the emission reduction risk for suppliers decreases as the intensity of risk aversion among suppliers increases.
Proof. 
The first-order derivative of the manufacturer’s abatement risk elasticity coefficient with respect to the supplier risk aversion coefficient can be obtained: S k θ 2 η s = 128 r η s θ 2 σ 4 ( 1 + 2 η s σ 2 ) ( 8 r ( 1 + 2 η s σ 2 ) 2 + θ 2 ( 3 + 12 η s σ 2 + 16 η s 2 σ 4 ) ) 2 > 0 , S k r 2 η s = 64 r η s θ 2 σ 4 ( 1 + 2 η s σ 2 ) ( 8 r ( 1 + 2 η s σ 2 ) 2 + θ 2 ( 3 + 12 η s σ 2 + 16 η s 2 σ 4 ) ) 2 < 0 . And S k r 2 < 0 , according to the definition of risk elasticity coefficient, the greater the supplier’s risk aversion, the greater the manufacturer’s abatement risk elasticity coefficient.
From Proposition 2 can be obtained, the supplier’s risk aversion coefficient there is a critical value η s * ( η s * 1 and η s * 2 ), when η s < η s * , S λ θ 2 > 0 , S λ r 2 < 0 ; when η s > η s * , S λ θ 2 < 0 , S λ r 2 > 0 . And because S λ r 2 η s = 32 r θ 2 σ 2 ( 1 + 4 η s σ 2 ) 3 ( 9 + 38 η s σ 2 + 40 η s 2 σ 4 ) ( 8 r ( 1 + 2 η s σ 2 ) 2 ( 3 + 16 η s 2 σ 4 ) + θ 2 ( 1 + 4 η s σ 2 ) 4 ) 2 < 0 , S λ θ 2 η s = 64 r θ 2 σ 2 ( 1 + 4 η s σ 2 ) 3 ( 9 + 38 η s σ 2 + 40 η s 2 σ 4 ) ( 8 r ( 1 + 2 η s σ 2 ) 2 ( 3 + 16 η s 2 σ 4 ) + θ 2 ( 1 + 4 η s σ 2 ) 4 ) 2 > 0 , according to the definition of risk elasticity coefficients, when the risk aversion coefficient of suppliers is less than the critical value, the emission reduction risk elasticity coefficient increases as the degree of risk aversion among suppliers increases. Conversely, when the risk aversion coefficient of suppliers is greater than the critical value, the emission reduction risk elasticity coefficient decreases as the degree of risk aversion among suppliers increases. Similarly, it can be deduced that the income risk elasticity coefficient of manufacturers is positively correlated with the risk aversion coefficient of suppliers, while the income risk elasticity coefficient of suppliers is negatively correlated with the risk aversion coefficient of suppliers. □
Wang et al. [42] showed that firms’ risk preferences are negatively related to the risk transmission threshold and positively related to the scale of risk transmission. Through further research, this paper shows from Propositions 8 to 9 that a higher degree of risk aversion of low-carbon supply chain members has a negative utility on both the manufacturer’s abatement risk and the revenue risk, whereas a higher degree of risk aversion of suppliers, who are the upstream nodes of the supply chain, reduces the impact of risk transmission on themselves. Non-neutral risk attitudes do not always lead to bad outcomes [43], and higher levels of risk aversion by suppliers have a positive utility on both their own abatement risk and revenue risk, while lower levels of risk aversion exacerbate the abatement risk transmission effect of the suppliers themselves. Emission reduction typically involves the adoption of new technologies and production methods, and if these technologies fail to achieve the expected results, suppliers and manufacturers will face the risk of technological innovation, leading to damage to their reputation in the market. Manufacturers, as one-time investors in green emission reduction in the low-carbon supply chain, tend to reduce their level of emission reduction inputs to mitigate the risks associated with emission reduction projects. This will result in the low-carbon supply chain’s emission reduction efforts failing to meet the expectations of the public or stakeholders, causing income volatility for low-carbon supply chain enterprises and increasing income risk. As the degree of risk aversion increases, suppliers will further exacerbate the emission reduction risk for manufacturers by spreading their own emission reduction risk among downstream manufacturers through cooperation within the low-carbon supply chain.

5. Numerical Simulation

Given the complexity of the analytical expressions for various variables, in order to visually demonstrate the impact of risk aversion characteristics of low-carbon supply chain members on emission reduction risk and income risk, according to the existing research methods of supply chain risk transfer models [39,42], correlation analyses will be carried out through numerical examples. This study utilizes MATLAB R2022a software for simulation analysis. Through numerical analysis, the risk elasticity of emission reduction and income of low-carbon supply chain to r and θ is observed under the condition that suppliers and manufacturers have risk aversion characteristics, respectively.

5.1. Risk Transfer Utility of Risk Aversion Degree

Based on the assumptions in the preceding text and referencing the settings by scholars such as Xia and Niu [44] and Wang et al. [23], specific parameters of the model are assumed to be: θ = 0.8 , σ = 1 , r = 1.5 , and the simulation of the changes in suppliers’ and manufacturers’ emission reduction and revenue risks with their own degree of risk aversion in Scenarios 2 and Scenarios 3. The results are depicted in Figure 2 and Figure 3.
As shown in Figure 2, when η s increases, both S k θ 2 and S k r 2 increase and S k θ 2 > 1 , S k r 2 < 1 . That is, as the intensity of supplier risk aversion increases, the manufacturer’s risk of volatility in abatement inputs is increasing based on scenario 1, but the increase is becoming progressively smaller. Suppliers with higher risk aversion are more concerned about their own economic stability and sustainability. To reduce the uncertainty and risk associated with emission reduction inputs, they tend to lower the level of cost sharing for emission reduction, ensuring a more stable economic return in the short term. In this scenario, the uncertainty and risk of carbon emission reduction are transferred to the manufacturer, constraining the manufacturer’s ability to achieve more innovative and efficient emission reduction goals and increasing the fluctuation risk of emission reduction inputs. Additionally, risk-averse suppliers, by reducing support for emission reduction inputs, require manufacturers to rely on their own resources and capabilities to achieve emission reduction goals in the low-carbon supply chain, increasing the uncertainty and risk faced by manufacturers in the emission reduction process.
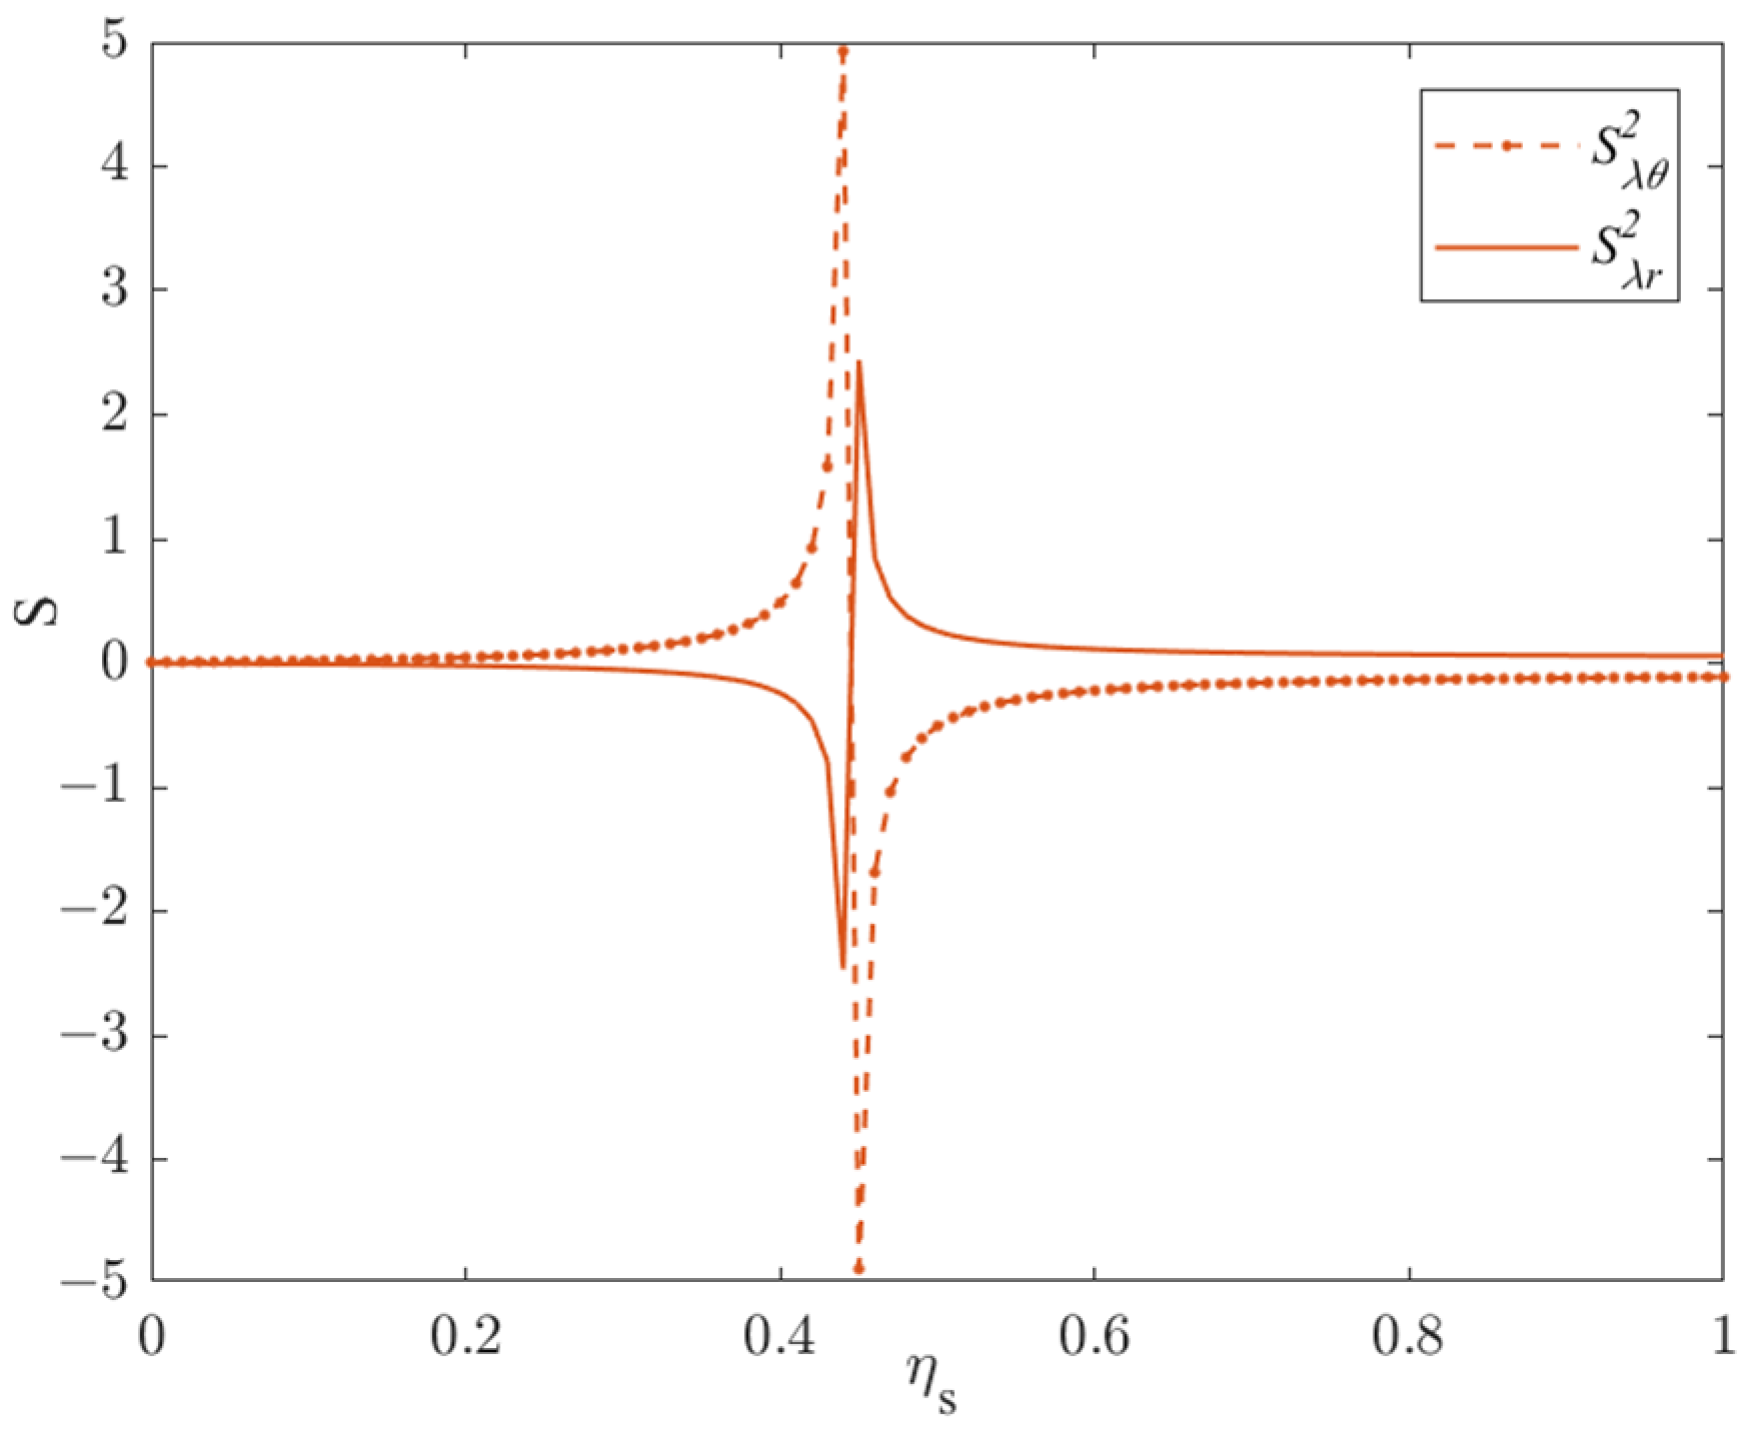
As can be seen from Figure 3, when the supplier risk aversion coefficient is less than a certain value, S λ θ 2 and S λ r 2 gradually increase with the increase of η s . When the supplier risk aversion coefficient is greater than this value, S λ θ 2 and S λ r 2 gradually decrease with the increase of η s . As the intensity of supplier risk aversion increases, the supplier’s own risk of fluctuations in abatement inputs increases, and the increase becomes larger over time. However, when the supplier’s risk aversion is greater than a certain level, the supplier’s risk of abatement inputs decreases with the increase in the supplier’s risk aversion intensity, and the increase gradually becomes smaller. This implies that the impact of supplier risk aversion characteristics on their own emission reduction risk transmission effect has a critical threshold, providing strong support for the conclusion in Proposition 2. When the supplier’s risk aversion level is below a certain threshold, changes in emission reduction investment cost coefficients cause opposite-direction changes in emission reduction cost-sharing levels, while changes in the level of information disclosure cause same-direction changes in emission reduction cost-sharing levels. When the supplier’s risk aversion characteristics exceed a certain threshold, unlike the risk transmission effect of other risk factors on corporate emission reduction investment in other scenarios, changes in the quality of information disclosure result in opposite-direction fluctuations in emission reduction risk transmission effects, and changes in investment cost coefficients result in same-direction fluctuations in emission reduction risk transmission effects.
Assuming θ = 0.6 , σ = 1 , η s = 0.5 , r = 3 , the simulation analyses of the abatement input risk of low-carbon supply chain members with the change of manufacturer risk aversion coefficient are carried out. As shown in Figure 4, as η m increases, the values of S k θ 3 and S k r 3 both increase, and the values of S λ θ 3 and S λ r 3 both gradually decrease. The implication is that as the intensity of risk aversion of manufacturers increases, the abatement risk of suppliers decreases, and the abatement risk of manufacturers increases, with the increase diminishing and stabilizing. On the one hand, highly risk-averse manufacturers may focus more on performance and cash flow in the short term while relatively ignoring the potential profitability and competitive advantage of long-term abatement investments, resulting in a stronger negative utility for abatement risk. On the other hand, as risk aversion levels increase, manufacturers become more concerned about the uncertainties associated with emission reduction investments, leading them to reduce their investment in emission reduction costs or adopt more conservative emission reduction strategies to mitigate uncertain economic and technological risks. Suppliers also correspondingly reduce the level of cost sharing for emission reduction, controlling costs within a reasonable range, thereby significantly reducing the fluctuation risk of emission reduction investments. Manufacturers with high levels of risk aversion may focus more on short-term performance and cash flow, potentially overlooking the potential profits and competitive advantages that long-term emission reduction investments may bring, thereby strengthening the negative utility of emission reduction risks.
Assuming that θ = 0.6 , σ = 1 , η s = 0.5 , η m = 0.5 , r = 3 , the simulation analysis of the low-carbon supply chain members’ return risk with the change of risk factors is carried out, and the results are as follows.
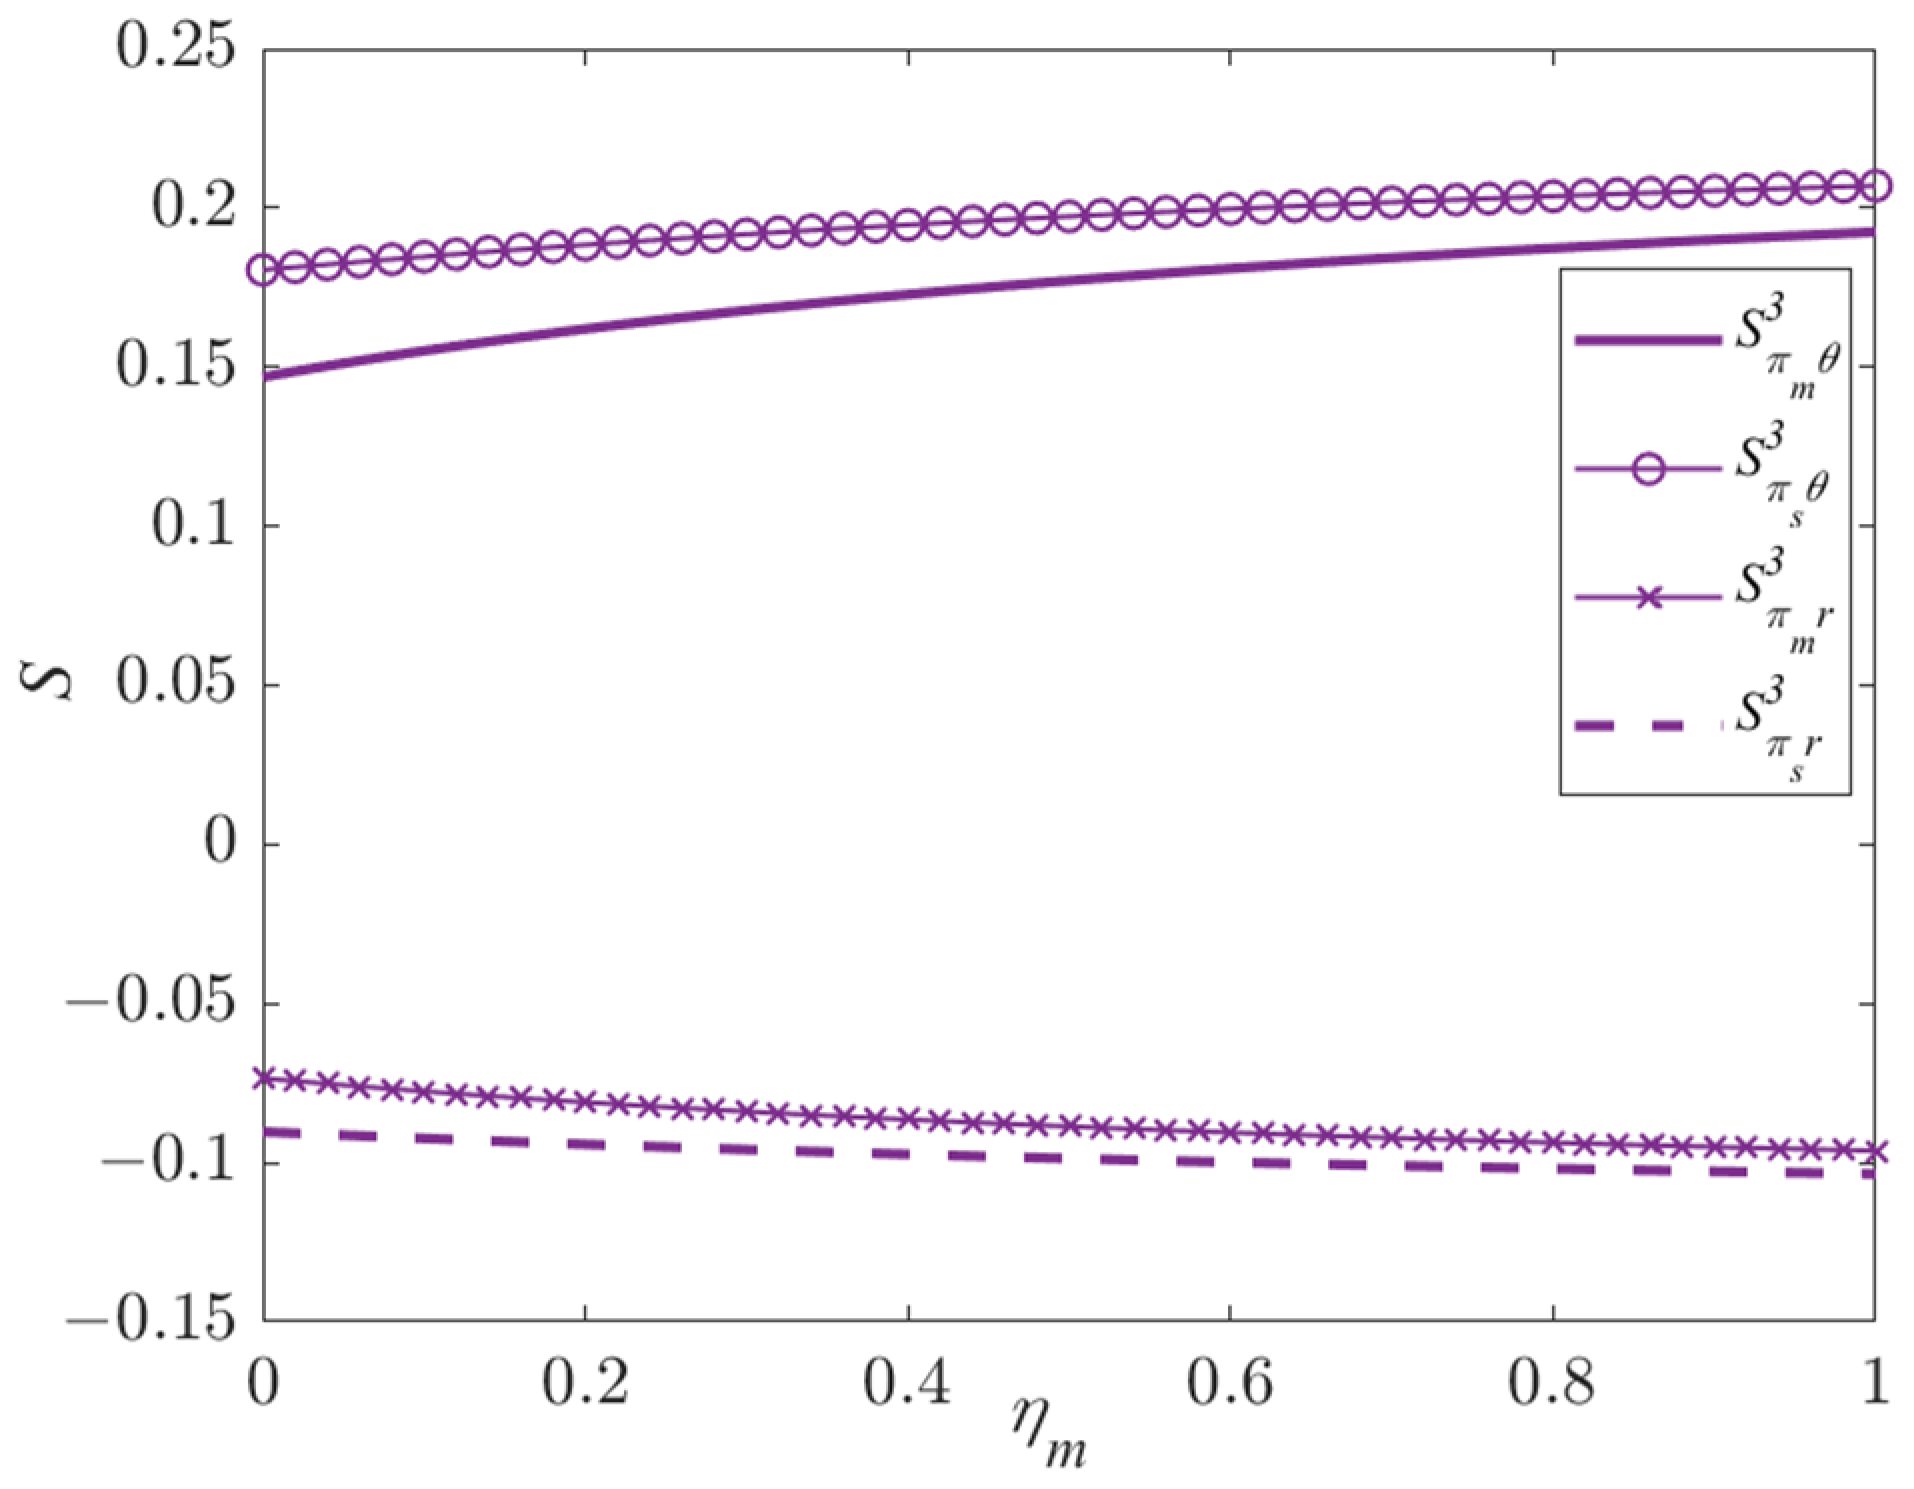
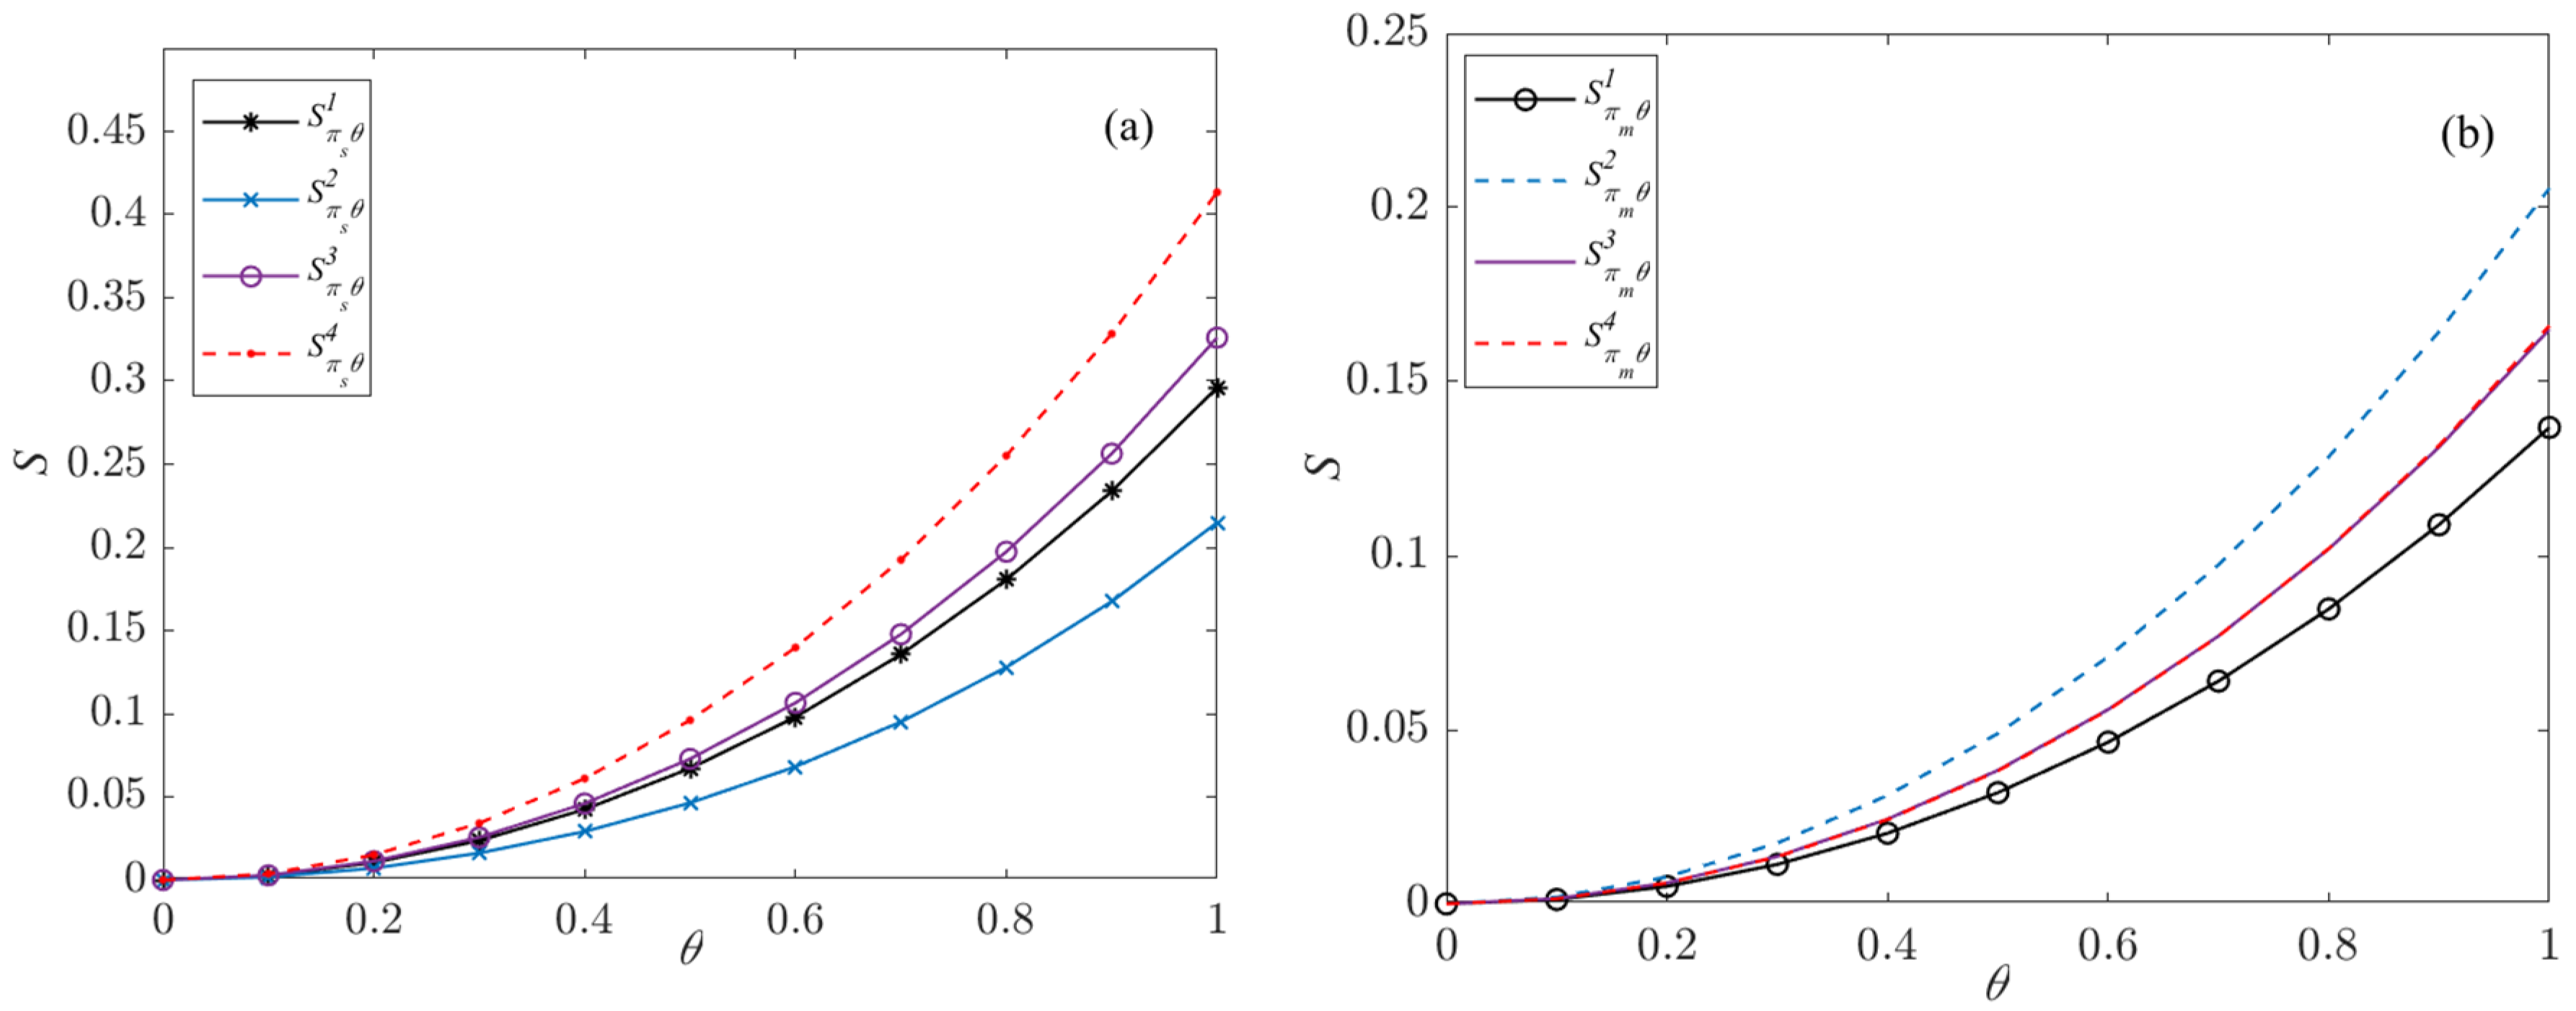
Figure 5 and Figure 6 better verify the conclusions in Proposition 8 and Proposition 9. As η m increases, the earnings risk elasticity coefficients ( S π s θ 3 and S π s r 3 ) for suppliers and ( S π m θ 3 and S π m r 3 ) for manufacturers also increase. With the increase in the risk aversion coefficient ( η s ) of suppliers, S π s θ 2 and S π s r 2 decrease, while S π m θ 2 and S π m r 2 increase. In other words, the greater the risk aversion level of manufacturers, the higher the volatility risk of earnings for the low-carbon supply chain nodes. Conversely, the higher the risk aversion level of suppliers, the lower the volatility risk of earnings for suppliers but the higher the volatility risk of earnings for manufacturers. This is because suppliers with higher risk aversion levels tend to adopt a more conservative stance, avoiding participation in high-risk or high-cost emission reduction measures. As leaders in joint emission reduction within the low-carbon supply chain, suppliers are more likely to shift emission reduction responsibilities to manufacturers, increasing the emission reduction costs for manufacturers and consequently causing earnings volatility. If manufacturers are more risk-averse, firms will appropriately reduce emissions reduction inputs to control the cost risks associated with technological uncertainty. Inadequate green outputs in the supply chain result in manufacturers losing sustainable competitiveness and facing problems such as tarnished brand image, leading to limited revenue growth. At the same time, the risk aversion of manufacturers will lead to issues such as reduced orders and business instability for suppliers, thereby increasing the earnings risk for suppliers.
.
In the following, the risk transmission effect of emission reduction and revenue of low-carbon supply chain members under the influence of market factors will be simulated and analyzed, assuming that D 0 = 50 , σ = 1 , r = 3 , and the results are shown in Figure 7 and Figure 8.
Figure 7 and Figure 8 better validate the analyses of Proposition 7 and Corollary 1. Combining Figure 7a and Figure 8a, it is evident that market demand uncertainty ( ε ) is linearly positively correlated with both the emission risk elasticity coefficient ( S k ε ) and the profit risk elasticity coefficient ( S π i ε ) of enterprises. This implies that as market demand uncertainty ( ε ) increases, the emission fluctuation of low-carbon supply chain enterprises gradually amplifies, thereby exacerbating profit volatility. Moreover, as market size ( D 0 ) increases, values of S k ε and S π i ε decrease. This indicates that higher demand uncertainty intensifies profit volatility for low-carbon supply chain enterprises, while larger market size effectively mitigates profit risk, enhancing enterprises’ ability to cope with risks. Further analysis reveals that enterprises, when facing demand uncertainty, need to adjust production scale and transportation methods, affecting their carbon footprint and increasing emission risk. Larger-scale markets typically offer more resources and opportunities, making it easier for enterprises to invest in carbon emission reduction and adopt advanced measures, thus reducing emission risk. Additionally, larger market sizes often enable better cost-sharing of carbon emission reduction investments among enterprises, thereby helping to alleviate risks caused by demand uncertainty. According to Figure 7b,c and Figure 8b,c, it can be observed that the interaction between market demand and market size with the risk aversion coefficient of low-carbon supply chain enterprises ( η s for suppliers and η m for manufacturers) does not affect the emission risk elasticity coefficient ( S k ε ) and profit risk elasticity coefficient ( S π i ε ) of enterprises. This implies that whether low-carbon supply chain enterprises possess risk aversion characteristics or not, market demand uncertainty does not influence the risk transmission effect of low-carbon supply chains.

5.2. Risk Transmission Utility of Risk Aversion Characteristics

The previous section analyzed the impact of suppliers’ and manufacturers’ risk aversion levels on the transmission effect of their own emission reduction and profit risks. In order to further compare the changes in emission reduction investment and profit across the four scenarios as risk factors vary, it is assumed that: θ = 0.6 , r = 3 , σ = 1 , η s = 0.5 , η m = 0.5 , and the results are as follows.
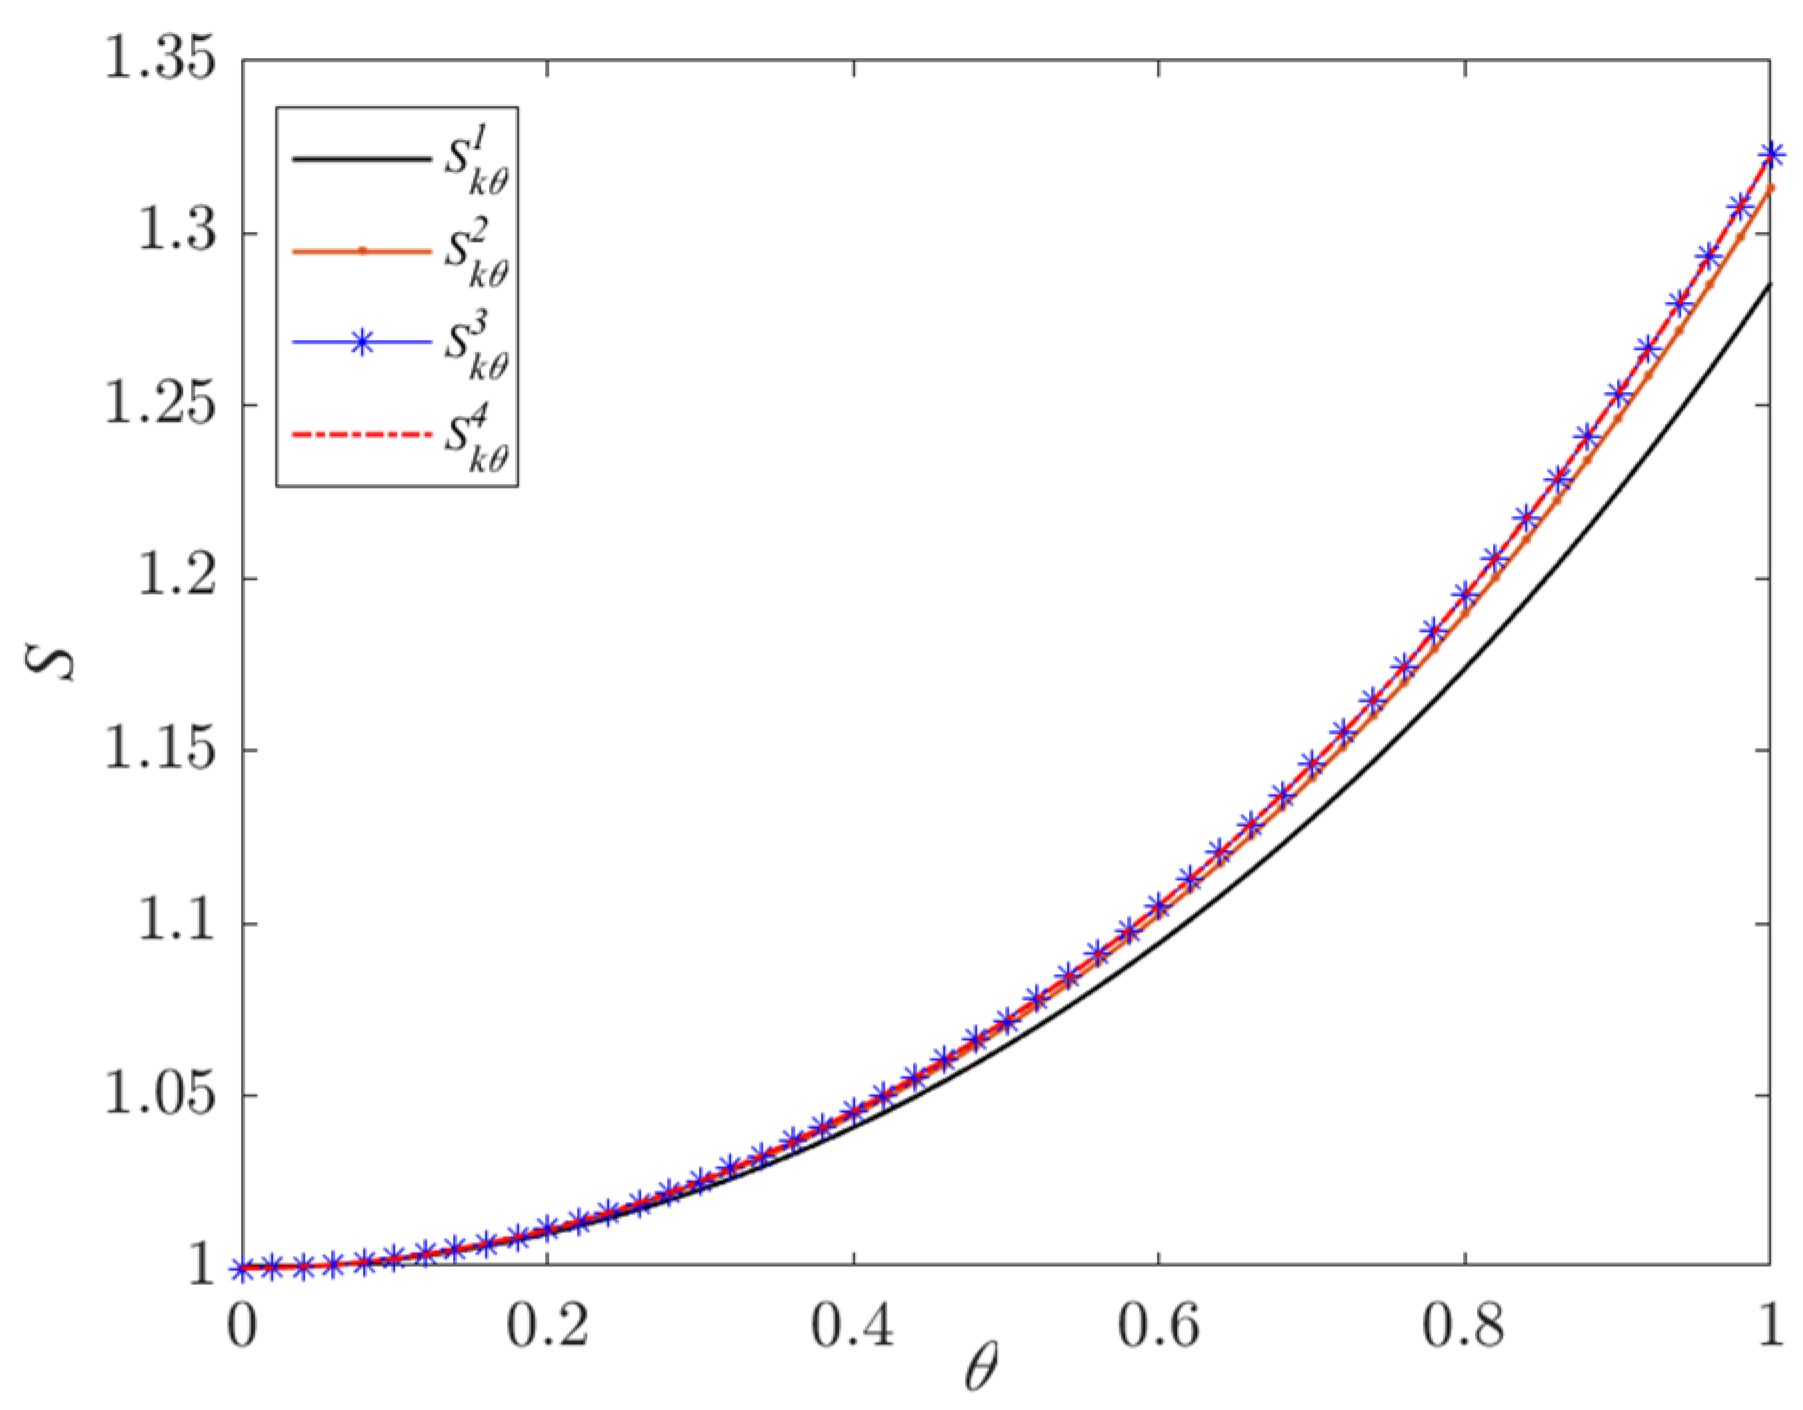
From Figure 9 and Figure 10, it can be seen that when only the supplier has risk aversion characteristics, the manufacturer’s abatement risk elasticity coefficient S k θ 2 and S k r 2 are greater than the case where all members are risk neutral; when only the manufacturer has risk aversion characteristics, the manufacturer’s abatement risk elasticity coefficient S k θ 3 is greater than the case where all members are risk-neutral and S k r 3 is smaller than the case where all members are risk-neutral. This implies that supplier risk aversion increases the risk of volatility of the manufacturer’s abatement inputs and that manufacturer risk aversion has a negative effect on the risk transmission of the level of information disclosure and a positive effect on the risk transmission of the level of carbon abatement technology. When both suppliers and manufacturers have risk aversion characteristics, S k r 2 < S k r 4 < 1 < S k r 3 < 0 , 1 < S k θ 2 < S k θ 3 < S k θ 4 , better verifies the conclusion in Proposition 3. At the same time, according to the definition of risk elasticity coefficients, changes in information disclosure quality lead to a positively correlated and gradually strengthening transmission effect of emission reduction risk, while changes in carbon emission reduction technology level lead to a negatively correlated and enhanced transmission effect of emission reduction risk. Additionally, the risk aversion characteristics of manufacturers significantly reduce the fluctuation risk of their own emission reduction investment caused by changes in the level of carbon emission reduction technology, thereby buffering the transmission of emission reduction risk.
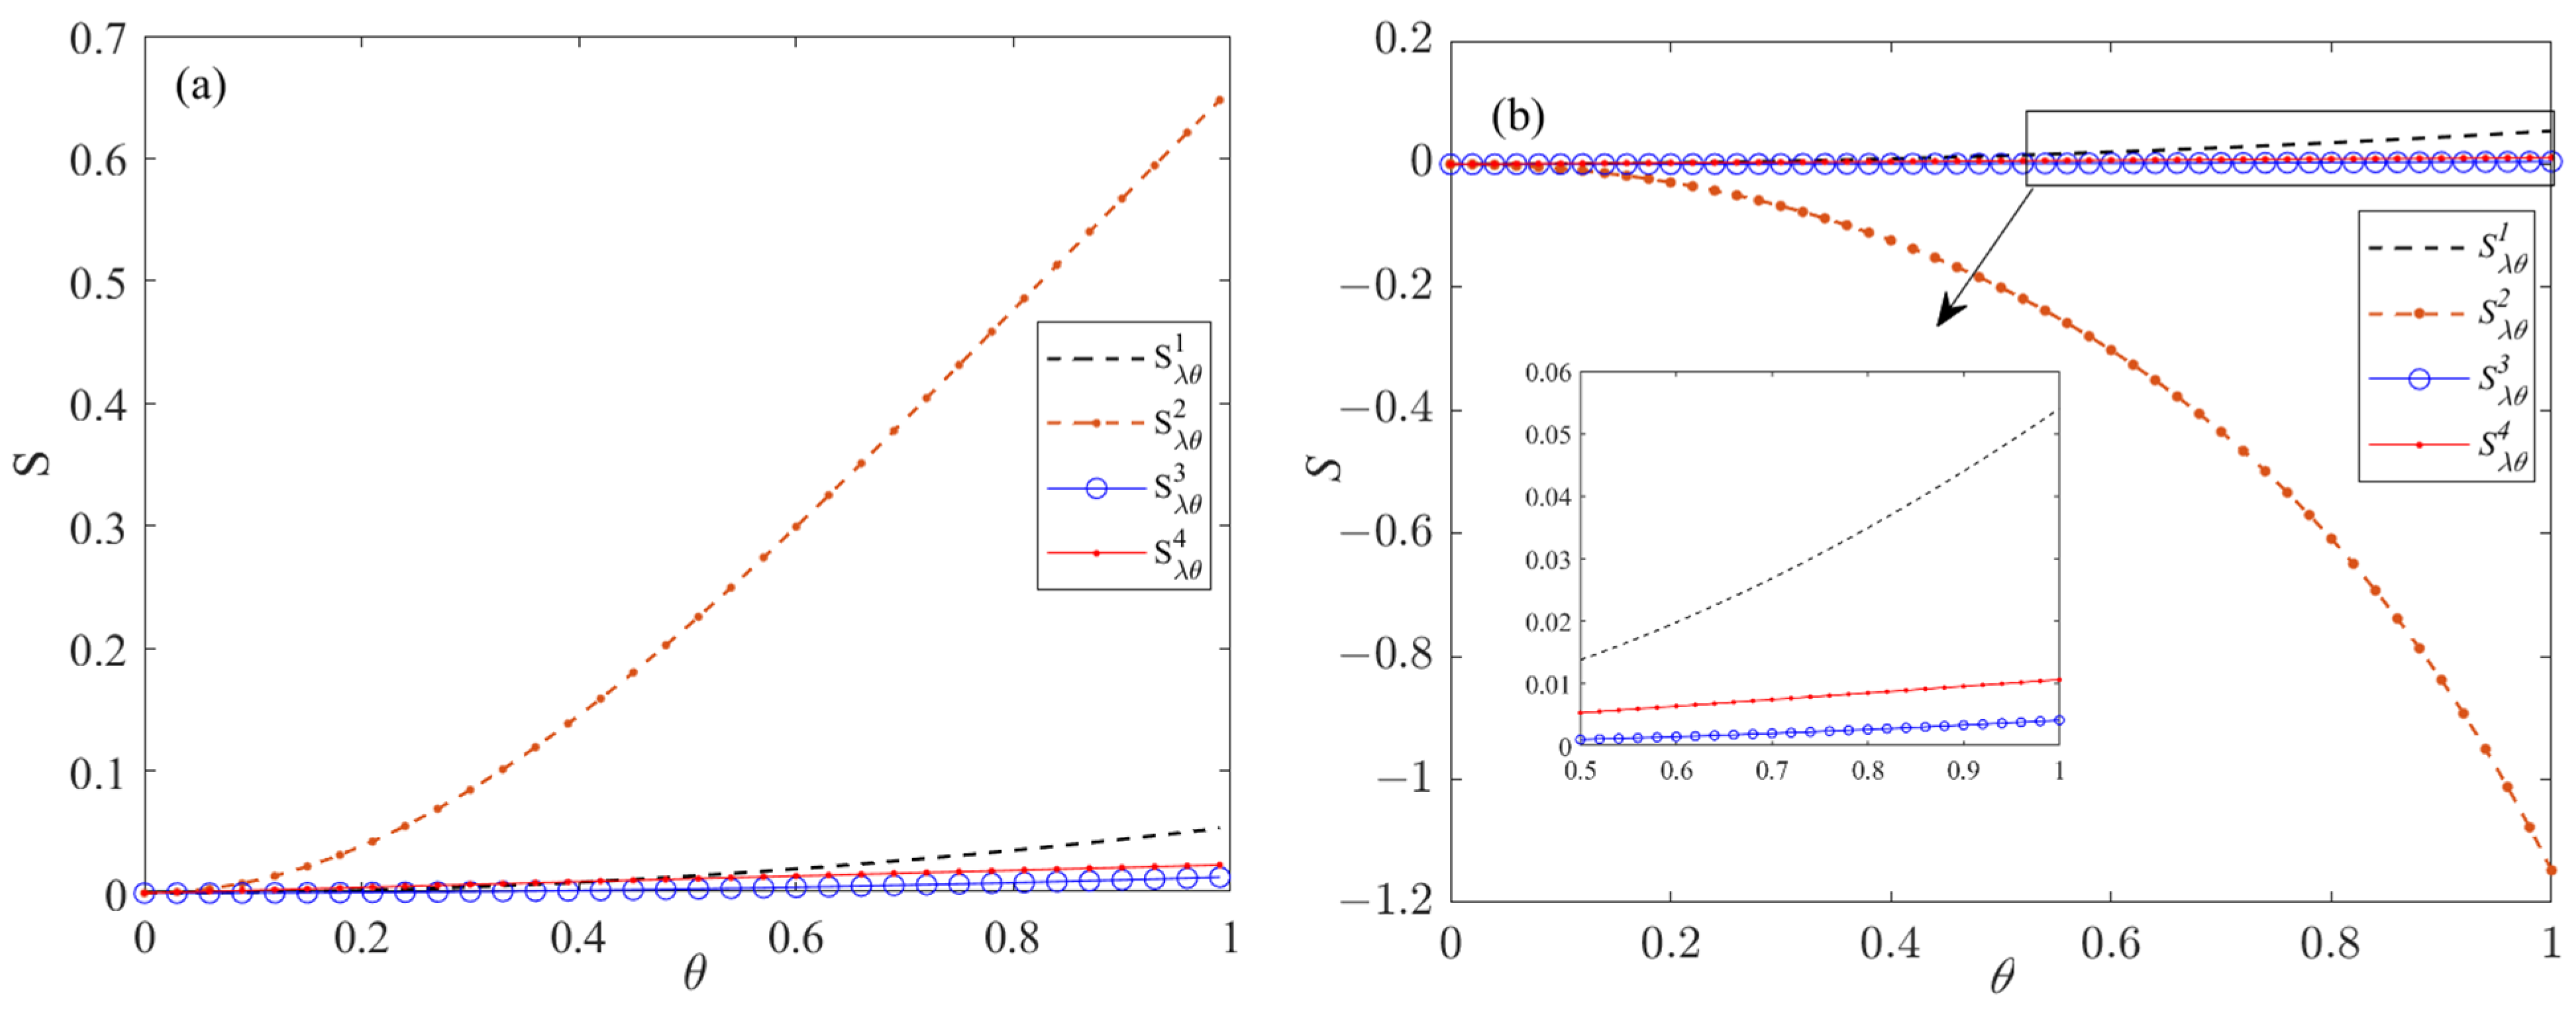
Since there exists a critical value of suppliers’ risk aversion characteristics that has different impacts on low-carbon supply chain members, according to the analyses in Proposition 2, Proposition 3, and Section 5.1, simulation analyses are conducted to analyze the changes in the risk of abatement cost sharing under the four scenarios by assuming that η s = 0.3 (Figure 11a and Figure 12a), η s = 0.8 (Figure 11b and Figure 12b), θ = 0.8 , r = 3 , σ = 1 , η m = 0.5 , respectively, and the results are as follows.
Figure 11 and Figure 12 better validate the conclusions in Propositions 1 to 3. Moreover, it can be seen that the abatement risk elasticity coefficients S λ θ 2 and S λ r 3 of suppliers when only manufacturers have risk aversion characteristics are smaller than the case when all members of the low-carbon supply chain are risk-neutral, and the abatement risk elasticity coefficients S λ θ 2 and S λ r 2 of suppliers when only suppliers have risk aversion characteristics are larger than the case when all members of the low-carbon supply chain are risk-neutral. This suggests that manufacturer risk aversion reduces the volatility risk of supplier abatement cost sharing, while supplier risk aversion has a negative effect on its own abatement risk transmission. In addition, it can be obtained from Figure 11 and Figure 12 that when η s < 0.45 , S λ r 2 < 0 ; when η s > 0.45 , S λ r 2 > 0 . When η s < 0.44 , S λ θ 2 > 0 ; when η s > 0.44 , S λ θ 2 < 0 . That is to say, there exists a critical value of the supplier’s risk aversion coefficient on its own abatement risk, and when it is larger than this value, the abatement risk elasticity coefficient will change in the opposite direction to the other scenarios under the influence of the carbon abatement technology level and the quality of the information disclosure.
Assuming that θ = 0.6 , σ = 1 , η s = 0.5 , η m = 0.5 , r = 3 , the simulation analysis of the four scenarios of low-carbon supply chain members’ return risk with the change of risk factors is carried out, and the results are as follows.
Figure 13 and Figure 14 provide strong evidence supporting the conclusions drawn in Propositions 4–6. Combining these figures reveals that when only the supplier exhibits risk aversion characteristics, the elasticity coefficient of the supplier’s income risk is lower than the scenario where all members of the low-carbon supply chain are risk-neutral. Conversely, the elasticity coefficient of the manufacturer’s income risk is higher than that of the scenario where all members of the low-carbon supply chain are risk-neutral. Conversely, when only the manufacturer exhibits risk aversion characteristics, both the supplier’s and the manufacturer’s elasticity coefficients of income risk are higher than in the scenario where all members of the low-carbon supply chain are risk-neutral. This indicates that the risk aversion of the supplier reduces its own income risk but has a negative effect on the transmission of income risk to the manufacturer. As the main driving force behind emissions reduction in the low-carbon supply chain, the risk aversion characteristics of the manufacturer exacerbate the income risk of the low-carbon supply chain node enterprises. Changes in carbon emission reduction technology levels lead to attenuated transmission effects of income risk that are inversely correlated and weakened for low-carbon supply chain enterprises, while changes in information disclosure levels lead to weakened transmission effects of income risk that are positively correlated and weakened for low-carbon supply chain enterprises. Moreover, the changes in income risk elasticity coefficients of low-carbon supply chain enterprises under the influence of carbon emission reduction technology levels and information disclosure levels are consistent across different scenarios, indicating that the risk aversion characteristics of low-carbon supply chain members do not alter the changes in joint emissions reduction and income under the influence of risk factors but do affect the degree of income fluctuation.

6. Conclusions

This study addresses the risk transmission issues in the joint emissions reduction process of a supplier-led low-carbon supply chain. Focusing on a two-tier, low-carbon supply chain system comprising suppliers and manufacturers, four scenarios with different risk aversion characteristics for suppliers and manufacturers are constructed. Utilizing risk elasticity coefficients, the study investigates the influence of low-carbon supply chain members’ risk aversion characteristics on the risk transmission effects of emissions reduction technology levels, carbon emission disclosure quality, and market demand volatility. Finally, numerical examples are used to analyze the risk transmission effects of emissions reduction and income under the influence of risk factors for different members with varying degrees of risk aversion. The main conclusions of the study are as follows:
(1) Both abatement risk and return risk are negatively related to the coefficient of abatement investment cost and positively related to the quality of disclosure. The risk transmission effect of market demand uncertainty is not affected by the risk aversion characteristics of low-carbon supply chain members but is positively related to the degree of market demand volatility and negatively related to market size;
(2) In the scenario where only suppliers in a low-carbon supply chain have risk aversion, suppliers’ risk aversion reduces their own revenue risk but increases manufacturers’ abatement risk and revenue risk. Additionally, there exists a critical value for the risk aversion coefficient of suppliers. When it is less than this value, the emissions reduction risk of suppliers increases continuously with the increase in the risk aversion intensity of suppliers. Conversely, when it is greater than this value, the emissions reduction risk of suppliers decreases continuously with the increase in the risk aversion intensity of suppliers;
(3) In a scenario where only the manufacturer in a low-carbon supply chain has risk aversion, the manufacturer’s risk aversion reduces the risk transmission effect of the level of carbon abatement technology on abatement inputs but exacerbates the risk transmission effect of the quality of information disclosure on abatement inputs. The greater the manufacturer’s risk aversion, the greater the risk of fluctuations in its own abatement inputs and the returns of the low-carbon supply chain firms, and the lower the abatement risk of its suppliers;
(4) In the scenario where all members of the low-carbon supply chain are risk-averse, the negative utility of supplier risk aversion on the volatility risk of manufacturers’ returns is dampened, but it exacerbates the transmission effect of manufacturers’ abatement risk under the influence of information asymmetry compared to the effect of a single member’s risk aversion. Manufacturer risk aversion reduces the negative utility of supplier risk aversion on the volatility risk of supplier returns due to the level of abatement technology, but it exacerbates the negative utility of supplier risk aversion on the volatility risk of supplier returns due to the quality of information disclosure.
The results of the study not only provide a new theoretical perspective for the risk transfer of enterprises in the process of low-carbon emission reduction but also help to reveal the influence mechanism of enterprise risk aversion characteristics on the risk transfer in the whole supply chain and also provide theoretical support for enterprises to formulate more flexible and targeted risk management strategies, which is of great theoretical and practical significance for promoting sustainable development and improving the risk-resistant capability of the supply chain. Based on the above findings, and with reference to the findings of Paul et al. [45] and Jermsittiparsert [46], this paper obtains the following managerial insights with regard to preventing and controlling the emission reduction and revenue risk transmission effects of low-carbon supply chain members: Firstly, alongside enhancing emission reduction technologies, effective risk monitoring and management should be implemented. Governments and industry associations can provide incentives such as tax breaks and subsidies to encourage businesses to invest in green technology innovation, thereby improving the overall emission reduction efficiency of the low-carbon supply chain and reducing emission reduction risks for businesses. Secondly, tailored information disclosure strategies should be formulated based on the risk aversion characteristics of businesses to prevent deviations in joint emission reduction decisions within low-carbon supply chains due to information asymmetry. Governments and relevant regulatory bodies can promote the establishment and implementation of industry standards, encouraging businesses to share information on emission reduction achievements, risk identification, and management to enhance the transparency of the entire low-carbon supply chain. Thirdly, recognizing that businesses possess varying risk aversion characteristics, risk management should adopt a holistic perspective rather than solely focusing on internal risks. Businesses need to weigh the pros and cons of collaboration versus independently managing risks, incorporating the low-carbon supply chain into risk management considerations. This involves devising corresponding strategies to mitigate, alleviate, and share risks, thereby reducing risk transmission effects and ensuring the stability of the entire low-carbon supply chain. Lastly, governments can develop and implement a risk assessment system for low-carbon supply chains, utilizing mechanisms such as reward systems and insurance to balance the emission reduction risks borne by businesses. This can mitigate the negative effects of risk transmission resulting from risk-averse behaviors among companies, thereby reducing risks within the low-carbon supply chain.
The research in this paper has certain limitations. Firstly, only the risk transmission effect on a single low-carbon supply chain is considered in the study, whereas in the real supply chain, the links will form a complex network system, and the factors and links interact with each other. Secondly, the degree of risk transmission influence of risk aversion characteristics was not further measured. Therefore, in the next research, it is necessary to establish a theoretical model that is more in line with the real decision-making environment, to study in depth the risk transmission effect in the complex associated low-carbon supply chain, and then better reveal the phenomena and laws in the economy and society.

Author Contributions

Conceptualization: T.C. and R.Z.; methodology: T.C., L.W. and R.Z.; writing—original draft: R.Z.; writing—review and editing: T.C., L.W. and R.Z.; translation: R.Z.; T.C., R.Z. and L.W. contributed equally to this work. They are co-first authors. All authors have read and agreed to the published version of the manuscript.

Funding

We wish to express our gratitude to the referees for their invaluable comments. This work was supported by the Major projects of the National Social Fund [No. 22&ZD122].

Data Availability Statement

The method in this article is computer mathematical simulation. Numerical simulation analysis is the most effective way to test real-time dynamic data without a large number of empirical validations. The authors simulate and analyze the risk transmission effects of emissions reduction and income under the influence of risk factors for different members with varying degrees of risk aversion by using Matlab2022a software. This paper does not have the data that can be obtained because they directly use the plot function of Matlab2022a software to make the images and tables.

Acknowledgments

Thank you to the reviewer for providing insightful feedback, which greatly benefited us.

Conflicts of Interest

The authors declare no conflicts of interest.

References

  1. Erdoğan, S.; Yıldırım, S.; Yıldırım, D.Ç.; Gedikli, A. The Effects of Innovation on Sectoral Carbon Emissions: Evidence from G20 Countries. J. Environ. Manag. 2020, 267, 110637. [Google Scholar] [CrossRef] [PubMed]
  2. Liu, M.; Li, Z.; Anwar, S.; Zhang, Y. Supply Chain Carbon Emission Reductions and Coordination When Consumers Have a Strong Preference for Low-Carbon Products. Environ. Sci. Pollut. Res. 2021, 28, 19969–19983. [Google Scholar] [CrossRef] [PubMed]
  3. Karuppiah, K.; Sankaranarayanan, B.; Ali, S.M. A Novel Quality Function Deployment Based Integrated Framework for Improving Supply Chain Sustainability. Eng. Manag. J. 2023, 35, 285–298. [Google Scholar] [CrossRef]
  4. Moshood, T.D.; Nawanir, G.; Mahmud, F.; Sorooshian, S.; Adeleke, A. Green and Low Carbon Matters: A Systematic Review of the Past, Today, and Future on Sustainability Supply Chain Management Practices Among Manufacturing Industry. Clean. Eng. Technol. 2021, 4, 100144. [Google Scholar] [CrossRef]
  5. Pourjavad, E.; Shahin, A. A Hybrid Model for Analyzing the Risks of Green Supply Chain in a Fuzzy Environment. J. Ind. Prod. Eng. 2020, 37, 422–433. [Google Scholar] [CrossRef]
  6. Chen, T.; Hou, Y.; Wang, L.; Li, Z. Counterparty Risk Contagion Model of Carbon Quota Based on Asset Price Reduction. Sustainability 2023, 15, 11377. [Google Scholar] [CrossRef]
  7. Titman, S. Risk Transmission Across Supply Chains. Prod. Oper. Manag. 2021, 30, 4579–4587. [Google Scholar] [CrossRef]
  8. Zong, S.; Huang, N. Optimal Financing Decision with Financial Constraints for a Manufacturer in a Low-Carbon Supply Chain. Environ. Sci. Pollut. Res. 2023, 30, 86998–87015. [Google Scholar] [CrossRef]
  9. Zhang, Q.; Li, W. Carbon Reduction Initiatives in Supply Chains: A System Dynamics Approach to Assessing Risk Contagion. J. Oper. Manag. 2021, 30, 451–468. [Google Scholar]
  10. Wang, J.; Zhou, H.; Jin, X. Risk Transmission in Complex Supply Chain Network with Multi-Drivers. Chaos Solitons Fractals 2021, 143, 110259. [Google Scholar] [CrossRef]
  11. Taghavi, S.M.; Ghezavati, V.; Bidhandi, H.M.; Al-E-Hashem, S.M.J.M. Green-Resilient Supplier Selection and Order Allocation Under Disruption by Utilizing Conditional Value at Risk: Mixed Response Strategies. Process Integr. Optim. Sustain. 2023, 7, 359–380. [Google Scholar] [CrossRef]
  12. Birge, J.R.; Capponi, A.; Chen, P.C. Disruption and Rerouting in Supply Chain Networks. Oper. Res. 2023, 71, 750–767. [Google Scholar] [CrossRef]
  13. Wang, J.; Zhou, H.; Zhu, Y. Behavior Evolution of Supply Chain Networks Under Disruption Risk—From Aspects of Time Dynamic and Spatial Feature. Chaos Solitons Fractals 2022, 158, 112073. [Google Scholar] [CrossRef]
  14. Dewaelheyns, N.; Schoubben, F.; Struyfs, K.; Van Hulle, C. The Influence of Carbon Risk on Firm Value: Evidence from the European Union Emission Trading Scheme. J. Environ. Manag. 2023, 344, 118293. [Google Scholar] [CrossRef] [PubMed]
  15. Zhang, W.; Lee, L.H.; Chan, F.T.; Zhang, Y. Modelling the Impacts of Low Carbon Supply Chain Collaboration on Carbon Emission Reduction. Int. J. Prod. Econ. 2019, 216, 259–271. [Google Scholar]
  16. Lemma, T.T.; Azmi Shabestari, M.; Freedman, M.; Lulseged, A.; Mlilo, M. Corporate Carbon Risk, Voluntary Disclosure and Debt Maturity. Int. J. Account. Inf. Manag. 2020, 28, 667–683. [Google Scholar] [CrossRef]
  17. Bimpikis, K.; Candogan, O.; Ehsani, S. Supply Disruptions and Optimal Network Structures. Manag. Sci. 2019, 65, 5504–5517. [Google Scholar] [CrossRef]
  18. Zhou, X.; Wu, X. Decisions for a Retailer-Led Low-Carbon Supply Chain Considering Altruistic Preference Under Carbon Quota Policy. Mathematics 2023, 11, 911. [Google Scholar] [CrossRef]
  19. Guan, Z.; Mou, Y.; Zhang, J. Incorporating Risk Aversion and Time Preference into Omnichannel Retail Operations Considering Assortment and Inventory Optimization. Eur. J. Oper. Res. 2024, 314, 579–596. [Google Scholar] [CrossRef]
  20. Sun, H.; Zhong, Y. Carbon Emission Reduction and Green Marketing Decisions in a Two-Echelon Low-Carbon Supply Chain Considering Fairness Concern. J. Bus. Ind. Mark. 2023, 38, 905–929. [Google Scholar] [CrossRef]
  21. Zhu, B.; Wen, B.; Ji, S.; Qiu, R. Coordinating a Dual-Channel Supply Chain with Conditional Value-at-Risk Under Uncertainties of Yield and Demand. Comput. Ind. Eng. 2020, 139, 106181. [Google Scholar] [CrossRef]
  22. Choi, T.M.; Ma, C.; Shen, B.; Sun, Q. Optimal Pricing in Mass Customization Supply Chains with Risk-Averse Agents and Retail Competition. Omega 2019, 88, 150–161. [Google Scholar] [CrossRef]
  23. Wang, Y.H.; Sheng, X.Q.; Xie, Y.D. The Coordination Mechanism of a Risk-Averse Green Supply Chain. Chin. Manag. Stud. 2024, 18, 174–195. [Google Scholar] [CrossRef]
  24. Gupta, V.; Ivanov, D. Dual Sourcing Under Supply Disruption with Risk-Averse Suppliers in the Sharing Economy. Int. J. Prod. Res. 2020, 58, 291–307. [Google Scholar] [CrossRef]
  25. Raza, S.A.; Govindaluri, S.M. Pricing Strategies in a Dual-Channel Green Supply Chain with Cannibalization and Risk Aversion. Oper. Res. Perspect. 2019, 6, 100118. [Google Scholar] [CrossRef]
  26. Ma, Y.; Zhang, M.; Zhao, J. Pricing Decision of Dual-Channel Supply Chain with Members’ Risk-Aversion Under the Participation of E-Commerce Platform. Procedia Comput. Sci. 2023, 221, 138–145. [Google Scholar] [CrossRef]
  27. Mou, Y.; Guan, Z.; Zhang, J. Integrated Optimization of Assortment, Inventory and Pricing Considering Omnichannel Retailer’s Risk Aversion and Customer’s Time Preference. Expert Syst. Appl. 2024, 237, 121479. [Google Scholar] [CrossRef]
  28. Zhou, Y.W.; Li, J.; Zhong, Y. Cooperative advertising and ordering policies in a two-echelon supply chain with risk-averse agents. Omega 2018, 75, 97–117. [Google Scholar] [CrossRef]
  29. Zou, H.; Qin, J.; Long, X. Coordination Decisions for a Low-Carbon Supply Chain Considering Risk Aversion Under Carbon Quota Policy. Int. J. Environ. Res. Public Health 2022, 19, 2656. [Google Scholar] [CrossRef]
  30. Wang, Z.; Brownlee, A.E.I.; Wu, Q. Production and Joint Emission Reduction Decisions Based on Two-Way Cost-Sharing Contract Under Cap-and-Trade Regulation. Comput. Ind. Eng. 2020, 146, 106549. [Google Scholar] [CrossRef]
  31. Wang, M.; Zhang, Y.; Dong, Y.; Zou, G.; Zhao, W. Interactive Information Disclosure and Non-Penalty Regulatory Review Risk. J. Manag. Sci. Eng. 2023, 8, 149–166. [Google Scholar] [CrossRef]
  32. Cao, Q.; Zhou, Y.; Du, H.; Ren, M.; Zhen, W. Carbon Information Disclosure Quality, Greenwashing Behavior, and Enterprise Value. Front. Psychol. 2022, 13, 892415. [Google Scholar] [CrossRef] [PubMed]
  33. Wang, J. Green Finance and the Relationship with Goodwill: A Study Based on the Perspectives of Accounting Information Quality and Financing Constraints. Int. Rev. Econ. Financ. 2024, 93, 833–846. [Google Scholar] [CrossRef]
  34. Liu, M.; Cao, E.; Salifou, C.K. Pricing Strategies of a Dual-Channel Supply Chain with Risk Aversion. Transp. Res. Part E Logist. Transp. Rev. 2016, 90, 108–120. [Google Scholar] [CrossRef]
  35. Song, H.; Wang, Y.; Mao, X.; Wang, C. Decision-Making in a Low-Carbon Supply Chain Considering Consumers’ Fairness Concerns. Expert Syst. Appl. 2024, 237, 121606. [Google Scholar] [CrossRef]
  36. Wang, Q.; He, L. Managing Risk Aversion for Low-Carbon Supply Chains with Emission Abatement Outsourcing. Int. J. Environ. Res. Public Health 2018, 15, 367. [Google Scholar] [CrossRef]
  37. Liu, J.; Li, C. Dynamic Game Analysis on Cooperative Advertising Strategy in a Manufacturer-Led Supply Chain with Risk Aversion. Mathematics 2023, 11, 512. [Google Scholar] [CrossRef]
  38. Feng, Y.; Hu, Y.; He, L. Research on Coordination of Fresh Agricultural Product Supply Chain Considering Fresh-Keeping Effort Level Under Retailer Risk Avoidance. Discret. Dyn. Nat. Soc. 2021, 2021, 5527215. [Google Scholar] [CrossRef]
  39. Adhikari, A.; Bisi, A.; Avittathur, B. Coordination Mechanism, Risk Sharing, and Risk Aversion in a Five-Level Textile Supply Chain Under Demand and Supply Uncertainty. Eur. J. Oper. Res. 2020, 282, 93–107. [Google Scholar] [CrossRef]
  40. Xing, Y.; Zhao, L. The Impact of Supply Chain Structure on the Promotion of Maritime Green Energy Consumption Under Carbon Emission Regulation. J. Ind. Manag. Optim. 2024. [Google Scholar] [CrossRef]
  41. Kazaz, B.; Webster, S. Price-Setting Newsvendor Problems with Uncertain Supply and Risk Aversion. Oper. Res. 2015, 63, 807–811. [Google Scholar] [CrossRef]
  42. Wang, H.; Zhang, X. Research on Supply Chain Risk Transmission Mechanism Based on Improved SIRS Model. Math. Probl. Eng. 2022, 2022, 9502793. [Google Scholar] [CrossRef]
  43. Song, Z.; Tang, W.; Zhao, R.; Zhang, G. Inventory Strategy of the Risk Averse Supplier and Overconfident Manufacturer with Uncertain Demand. Int. J. Prod. Econ. 2021, 234, 108066. [Google Scholar] [CrossRef]
  44. Xia, J.; Niu, W. Carbon-Reducing Contract Design for a Supply Chain with Environmental Responsibility Under Asymmetric Information. Omega 2021, 102, 102390. [Google Scholar] [CrossRef]
  45. Paul, S.K.; Karuppiah, K.; Sankaranarayanan, B.; Ali, S.M. Barriers for Sustainable Supply Chain Management and Their Overcoming Strategies in Context of the Indian Automobile Industry. In Data Analytics for Supply Chain Networks; Springer International Publishing: Cham, Switzerland, 2023; pp. 129–165. [Google Scholar]
  46. Jermsittiparsert, K. Examining the Sustainable Energy and Carbon Emission on the Economy: Panel Evidence from ASEAN. Int. J. Econ. Financ. Stud. 2021, 13, 405–426. [Google Scholar]
Figure 1. Low-carbon supply chain enterprises’ joint decision-making model and risk shock transmission process.
Mathematics 12 02009 g001
Figure 2. Correlation between manufacturers’ emission reduction risk and risk aversion coefficient η s . The sub-diagrams indicated by arrows are enlarged detail drawings of the parts framed by rectangles, the same below.
Mathematics 12 02009 g002
Figure 3. Correlation between supplier abatement risk and risk aversion coefficient η s .
Mathematics 12 02009 g003
Figure 4. Correlation between risk aversion coefficient η m and emission reduction risk of the low-carbon supply chain.
Mathematics 12 02009 g004
Figure 5. Correlation between enterprise revenue risk and manufacturer risk aversion factor η m .
Mathematics 12 02009 g005
Figure 6. Correlation between enterprise revenue risk and supplier risk aversion coefficient η s .
Mathematics 12 02009 g006
Figure 7. Correlation between the risk transmission effect of emission reduction and market factor. (ac) refer to the interaction effect of market noise ε refers to with market demand D 0 , supplier risk aversion coefficient η s , and manufacturer risk aversion coefficient η m , respectively, on firms’ abatement risk.
Mathematics 12 02009 g007
Figure 8. Correlation between the risk transmission effect of revenue and market factors. (ac) refer to the interaction effects of market demand D 0 and market noise ε , supplier risk aversion coefficient η s , and manufacturer risk aversion coefficient η m on firms’ earnings risk, respectively.
Mathematics 12 02009 g008
Figure 9. Correlation between manufacturers’ emission reduction risk and r under four risk aversion scenarios.
Mathematics 12 02009 g009
Figure 10. Correlation between manufacturers’ emission reduction risk and θ under four risk aversion scenarios.
Mathematics 12 02009 g010
Figure 11. Correlation between supplier abatement risk and r under the four risk aversion scenarios. (a,b) refer to the impact of the investment cost coefficient r on the supplier’s risk of abatement when the supplier’s risk aversion coefficient η s is less than a critical value and greater than a critical value, respectively.
Mathematics 12 02009 g011
Figure 12. Correlation between supplier abatement risk and θ under the four risk aversion scenarios. (a,b) refer to the impact of the investment cost coefficient θ on the supplier’s risk of abatement when the supplier’s risk aversion coefficient η s is less than a critical value and greater than a critical value, respectively.
Mathematics 12 02009 g012
Figure 13. Correlation between return risk and r under four risk aversion scenarios. (a,b) refer to the effect of the investment cost coefficient r on the return risk of suppliers and manufacturers, respectively.
Mathematics 12 02009 g013
Figure 14. Correlation between return risk and θ under four risk aversion scenarios. (a,b) refer to the effect of disclosure quality θ on supplier and manufacturer return risk, respectively.
Mathematics 12 02009 g014
Table 1. Variables and parameters.
SymbolMeaningRange of Values
w Price markup of manufacturer w > 0
w j * Manufacturer’s optimal price mark-up in scenario j w j * > 0 , j = 1 , 2 , 3 , 4
m Price markup of supplier m > 0
m j * Supplier‘s optimal price mark-up in scenario j m j * > 0 , j = 1 , 2 , 3 , 4
k Manufacturer’s emission reduction investment level k > 0
k j * Optimal level of mitigation investment by manufacturers in scenario j k j * > 0 , j = 1 , 2 , 3 , 4
λ Supplier’s abatement cost-sharing level 0 < λ < 1
λ j * Optimal level of mitigation investment by suppliers in scenario j λ j * > 0 , j = 1 , 2 , 3 , 4
θ Quality of carbon emissions disclosure 0 < θ < 1
D 0 Potential market demand D 0 > 0
α , β Market demand sensitivity factor α = β = 1
ε Uncertainty of market demand ε N ( 0 , σ 2 )
η i Level of risk aversion η i 0 ,   i = m , s where m denotes the manufacturer and s denotes the supplier
r Carbon emission reduction investment cost coefficient r > 1
U j * ( π m ) Optimal benefits for manufacturers in scenario j U j * ( π m ) > 0 , j = 1 , 2 , 3 , 4
U j * ( π s ) Optimal benefits for suppliers in scenario j U j * ( π s ) > 0 , j = 1 , 2 , 3 , 4
S y x j Risk elasticity coefficient of risk point y with respect to x in scenario j j = 1 , 2 , 3 , 4
Disclaimer/Publisher’s Note: The statements, opinions and data contained in all publications are solely those of the individual author(s) and contributor(s) and not of MDPI and/or the editor(s). MDPI and/or the editor(s) disclaim responsibility for any injury to people or property resulting from any ideas, methods, instructions or products referred to in the content.