Article

The Potential Changes and Stereocilia Movements during the Cochlear Sound Perception Process

1
School of Mechanics and Engineering Science, Shanghai University, Shanghai 200072, China
2
Shanghai Institute of Applied Mathematics and Mechanics, Shanghai University, Shanghai 200072, China
3
Genomic Medicine Institute, Lerner Research Institute, Cleveland Clinic Foundation, Cleveland, OH 44106, USA
4
Department of Prosthodontics, Shanghai Ninth People’s Hospital, Shanghai Jiao Tong University School of Medicine, Shanghai 200011, China
*
Authors to whom correspondence should be addressed.
Mathematics 2024, 12(16), 2470; https://doi.org/10.3390/math12162470 (registering DOI)
Submission received: 22 June 2024 / Revised: 7 August 2024 / Accepted: 8 August 2024 / Published: 10 August 2024

Abstract

:
Sound vibrations generate electrical signals called cochlear potentials, which can reflect cochlear stereocilia movement and outer hair cells (OHC) mechanical activity. However, because the cochlear structure is delicate and complex, it is difficult for existing measurement techniques to pinpoint the origin of potentials. This limitation in measurement capability makes it difficult to fully understand the contribution of stereocilia and transduction channels to cochlear potentials. In view of this, firstly, this article obtains the stereocilia movement generated by basilar membrane (BM) vibration based on the positional relationship between the various structures of the organ Corti. Secondly, Kirchhoff’s law is used to establish an electric field model of the cochlear cavity, and the stereocilia movement is embedded in the electric field by combining the gated spring model. Finally, a force-electric coupling mathematical model of the cochlea is established. The results indicated that the resistance variation between different cavities in the cochlea leads to a sharp tuning curve. As the displacement of the BM increased, the longitudinal potential along the cochlea continued to move toward the base. The decrease in stereocilia stiffness reduced the deflection angle, thereby reducing the transduction current and lymphatic potential.
MSC:
92-10; 92B05

1. Introduction

Up to now, the mechanism of active sound amplification in the cochlea has been a major biomedical challenge. Cochlear potentials are an important product of cochlear outer hair cells (OHC) activity and play an important role in the active sound-sensing mechanism [1]. The movement of the basilar membrane (BM) induced by sound stimulation drives the motion of the stereocilia at the tops of the hair cells. The tallest stereocilia on the OHC extend into the tectorial membrane. The relative motion between the tectorial membrane and the BM generates a shearing force that deflects the stereocilia. The deflection of the stereocilia opens the mechanoelectrical transducer (MET) channels, and under the effect of voltage between the inside and outside of the hair cell, K+ cations flow into the hair cell through the MET channels, forming a transduction current. The hair cell converts the mechanical movement of the stereocilia into electrical activity on the cell membrane, a process known as MET [2]. The transduction current causes a change in the intracellular voltage of the OHC, resulting in electromotility driven by the motor protein prestin, which rapidly changes the length of the OHC. This is known as the electromotility of the OHC [3]. Electrodynamics itself does not directly lead to amplification. Amplification depends on the phase of the force coupled into the hydromechanical system by the movement of the OHC [4]. OHC movement can provide negative (damping) or positive (amplification) feedback to the system. A key factor in determining whether feedback is positive or negative is the difference between the resonance frequencies of the tectorial membrane and the BM. The components, such as OHC, inner hair cells, the tectorial membrane, stereocilia, and the stria vascularis, work together to enhance and tune the sound signals entering the cochlea and are described as the cochlear amplifier [5]. In contrast, the tallest stereocilia on the inner hair cells do not contact the tectorial membrane, and their deflection depends on the movement of the cochlear partition and the endolymphatic fluid in the scala media. The transducing current enters the inner hair cells to depolarize them, and the inner hair cells convert the physical properties of sound into neural signals and transmit the neural signals to the brain via auditory nerve fibers. The inflow of transducing currents into the cells leads to changes in the extracellular currents and produces cochlear microphonics (CM), and the currents produced by the OHC are the main contributors to CM [6]. The cochlear lymphatic system includes the perilymph found in the scala tympani and scala vestibuli, the endolymph found in the scala media, and the cortilymph around the hair cells. The endolymph has a high concentration of K+ cations, primarily produced by the stria vascularis [7]. Therefore, the interaction between macro-microstructures in the mammalian cochlea is an important component of the hearing perception process (cf. Figure 1), and an understanding of the electrical motions within the cochlea and the changes in the electrical field of the lymphatic fluid is crucial to unraveling the mechanisms of cochlear hearing.
However, due to the precise and complex structure of the cochlea, the existing experimental techniques make it extremely difficult to detect the movement and potential changes of the stereocilia in the cochlea. In the study of the mechanical behavior of the cochlear microstructure, researchers usually use the method of establishing mathematical models for analysis. Howard et al. [8] proposed a two-state model for MET channels, describing the opening and closing motion of the channels as well as the movement of hair bundles. Later, Markin and Hudspeth [9] further established a three-state gated spring model to solve the problem of the decline of hair bundle stiffness and better describe the movement of hair bundles. Nadrowski described the spontaneous motion of the hair bundles [10]. Furness et al. [11] conducted a two-dimensional (2D) dynamic analysis on the relative motion of stereocilia and obtained the effect of stereocilia deflection shear displacement on the mechano-electrical conduction channel. Zates et al. [12] established a multi-degree of freedom linear motion equation based on the fluid-solid coupling effect of stereocilia and obtained the variation of stereocilia displacement with frequency. Matsui et al. [13] used a 3D model to study the dynamic characteristics of stereocilia and found that the lateral links protected the channels for force electric conversion. Although there have been many studies focusing on the kinematic and mechanical properties of stereocilia, the role of the process of opening and closing of MET channels induced by stereocilia deflection in the electrical field of the lymphatic fluid remains to be investigated.
In addition, the change in electric field inside the cochlea has also attracted widespread attention from researchers. Davis et al. [14] modeled the power grid characteristics and potential distribution in the cochlea as battery and variable resistance models, which have been widely used. In the second half of the 20th century, Strelioff et al. [15] proposed a network model of resistors and batteries to simulate the generation and distribution of cochlear potentials. At the beginning of the 21st century, Ramamoorthy et al. [16] developed a mechano-electro-acoustical multi-physical field model of the cochlea, and the simulation results showed that the cell body and the movement of hair bundles could play a cooperative role in the cochlear active amplification mechanism. Ku et al. [17] used a classical lumped element model to study the cochlea and simulate click-induced and spontaneous otoacoustic emissions, but the electric field was partially ignored. Mistrík et al. [7] simulated the 3D distribution of electric currents in the mammalian cochlea using a computer, as well as the effect of the electro-dynamic mechanism of outer hair cells on sound amplification, to investigate the potential cyclic distribution of potassium ions, but did not consider the movement of stereocilia. Ayat et al. [18] established a cochlear electro-mechanical model to observe the effect of the cochlear amplifier on CM and explained the difference between the tuning curves of BM and CM. Teal et al. [19] developed a numerical model of cochlear electrical coupling using the finite element method, simulated the distribution of current and potential in the cochlea, and analyzed the range of potential influence.
Cochlear models developed by previous authors do not take into account the effect of the process of opening and closing MET channels caused by stereocilia when calculating cochlear potentials. In fact, the transduction currents generated by the microstructures in the cochlea are closely related to the stereocilia movements induced by the vibration of the BM, the macrostructure of the cochlea. The phase of the vibrations of the BM and the tectorial membrane is crucial for the amplification process [20]. The movement of the tectorial membrane can facilitate the deflection of the stereocilia, thereby enhancing the electromotility of the OHC and amplifying the vibrations of the BM. This is an important mechanism that affects the cochlear amplifier. Through this amplification, the mechanical response of the cochlear partition is enhanced, resulting in higher sensitivity and precise frequency resolution [21]. However, without amplification, the mechanical response of the cochlear partition becomes more linear, thus reducing sensitivity to low-intensity sounds and weakening frequency selectivity [22]. This indicates that the movement of the stereocilia plays a key role in the cochlear amplification process. Considering the influence of stereocilia on the calculation of cochlear potentials, this paper, firstly, started with the kinematic relationship of the organ of Corti, which can be obtained from the movement of the BM to obtain the stereocilia displacement and conduction current of the cochlea; secondly, based on Kirchhoff’s law, the equation of the cochlear lymphatic fluid circuit was established, and the potentials at different locations of the cochlea were solved. Finally, a cochlear model integrating stereocilia movement and lymphatic fluid potential changes was developed. Compared to the study of hair bundles by Ramamoorthy et al. [16], this model integrates the nonlinear motion of the stereocilia into the cochlear circuit. This allows for the observation of how changes in hair bundles affect the MET channels and how the MET channels influence the electric field. It fully considers the impact of stereocilia deflection on the opening of MET channels within the electric field.
The modeling of the cochlear macro-microstructure, including stereocilia and electrical parameters, allows a better understanding of the physiological basis of the auditory system as well as the generation and transmission of bioelectrical signals. By simulating CM potentials, the physiological mechanisms of the cochlea, especially the electrical activity of the OHC and the inner hair cells, can be studied in depth. By incorporating the stereocilia of inner hair cells into the model, we can better distinguish the contributions of OHC stereocilia and inner hair cell stereocilia to cochlear potentials. This allows us to gain a deeper understanding of how the intracellular potential in OHC drives their movement and how the deflection of stereocilia affects the generation of receptor potentials in inner hair cells. Receptor potentials trigger synaptic chemical transmission and action potential firing, which are crucial for sound perception and are key to understanding auditory sensitivity and frequency selectivity.
By analyzing the changes in CM potentials caused by the structural parameters of stereocilia, we can understand the potential variations in inner hair cells and OHC and how these variations affect auditory signals. This can improve electrode configuration and optimize design, facilitating the transmission of electrical signals. It provides a basis for designing more precise cochlear implant electrodes and signal processing algorithms, enabling more accurate simulation of cochlear functions. Additionally, it allows for personalized adjustments of cochlear implants according to individual characteristics, thereby enhancing sound resolution and frequency discrimination capabilities.

2. Model

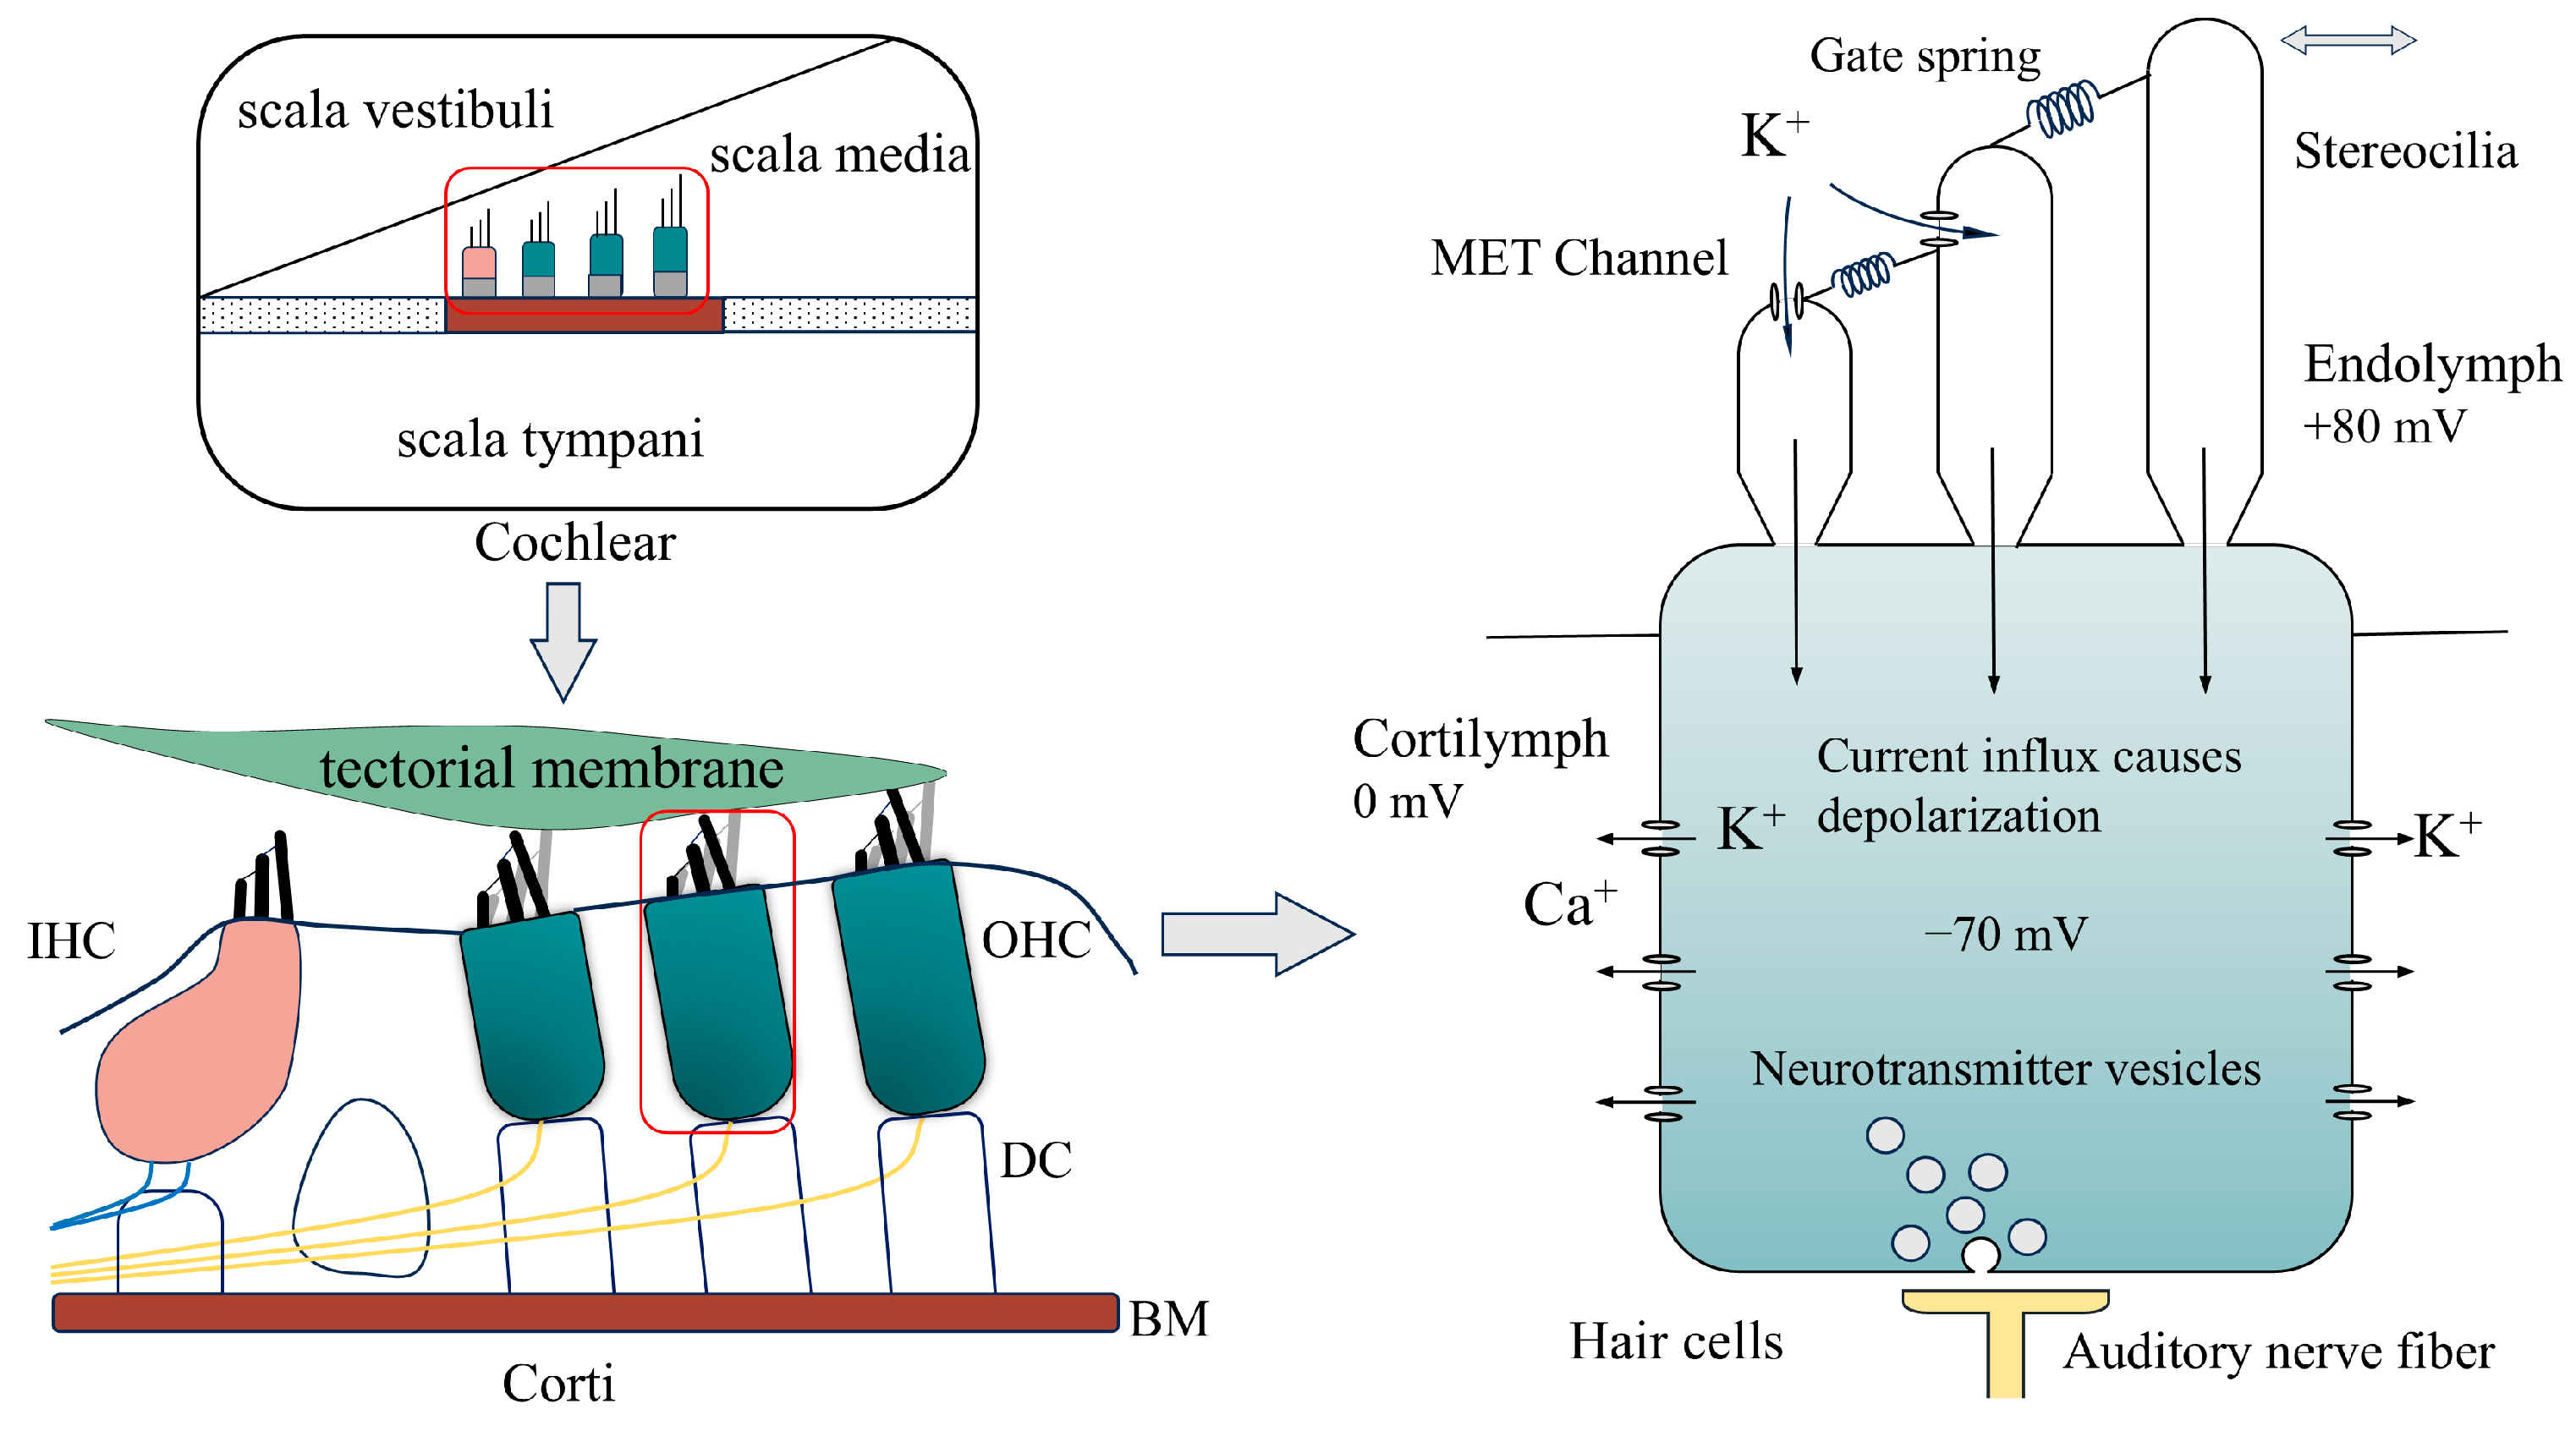
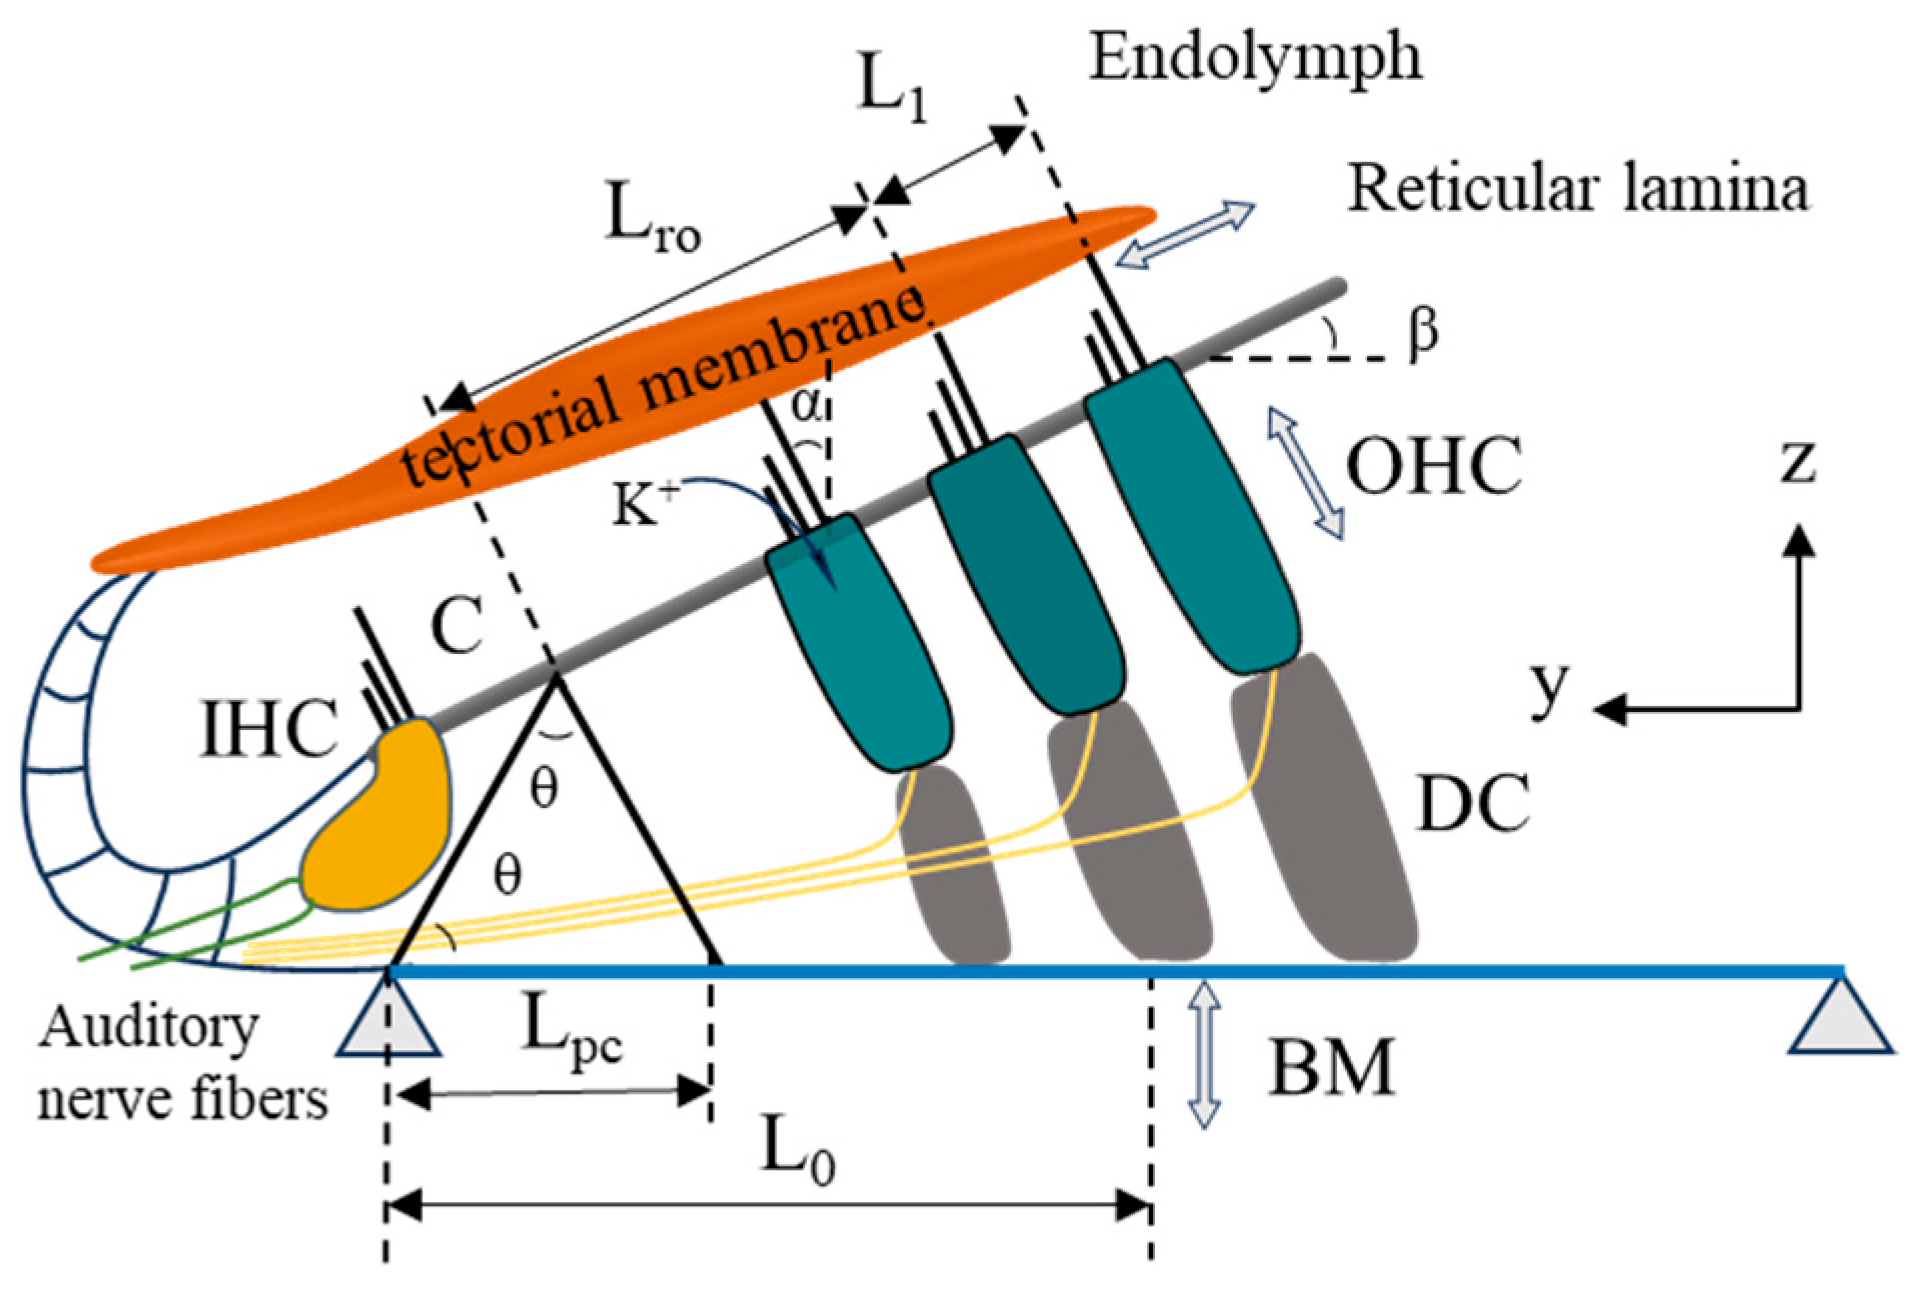
2.1. The Movement of the Organ of Corti

The organ of Corti is located on the BM of the cochlea and consists of the inner hair cells, OHCs, the tectorial membrane, and other supporting cells. The tectorial membrane is a gelatinous membrane located above the organ of Corti. The cochlear partition consisting of the BM and osseous spiral lamina is different in different mammals and is described here as a model of the human cochlea. The structure of the organ of Corti is shown in Figure 2, assuming that both sides of the BM are fixed constraints and vibrate only in the z direction [16]. The arched structure is regarded as rigid, and the three inclined OHCs are located at the center of the BM. Due to the much higher stiffness of the Deiter cells at the lower end of OHCs compared to OHCs, the movement of the Deiter cells is ignored, and the bottom of OHCs is regarded as a fixed constraint. The top of OHCs is connected into a structure of reticular lamina, which can be regarded as a massless rigid rod [16]. The bottom of the three bundles of stereocilia are embedded into the top of the three OHCs, respectively, and it is assumed to be connected to an angle spring [16]. The top of the stereocilia is embedded into the tectorial membrane, ignoring the effect of fluid on the stereocilia, and treating them as rigid rods. Considering the tectorial membrane as a fixed constraint on the side near the cochlear axis, the vibration of the tectorial membrane is not considered due to its large mass. Reticular lamina and tectorial membrane may not necessarily remain parallel, and the top of the stereocilia is embedded in the tectorial membrane, which can be considered that the stereocilia are fixed on the tectorial membrane and deflected around its top.
For the structure of the organ of Corti in Figure 2, the BM is hinged at both ends with only one degree of freedom of motion. It is assumed that the motion of the organ of the Corti structure is a minor motion. The movement of OHCs, stereocilia, arched structures, and reticular lamina can all be represented by the movement of the BM. The internal angle of the arched structures is θ. The angle between OHCs and z-axis is β, and the angle between stereocilia and z-axis is α. The distance from the second OHC along the y-axis to the base of the BM near the cochlear axis is L0. The x represents the longitudinal distance from the base of the cochlea along the cochlea.
Considering only the first mode of the BM vibration, the vibration of the BM can be expressed as [16]:
u b m ( x , y ) = u b m ( x ) ψ 1 ( y )
ψ 1 ( y ) = s i n ( π ( y + b / 2 ) / b ) , b / 2 y b / 2
where u b m ( x ) is the vibration amplitude of the first mode, ψ 1 ( y ) is the mode type function of the first mode, and b is the width of the BM. Assuming that the arched structure is a rigid body, the vibration of the BM drives the arched structure to rotate around the left fulcrum, and the left fulcrum is used as the base point. The projection distance of the displacement of vertex C and the vibration displacement of BM is the same on the line between the two. The displacement of vertex C is expressed as [16]:
u c ( x ) = u b m ( x ) ψ 1 ( b / 2 L p c ) 2 c o s ( θ )
The L p c is the distance from the left point to the right point of the arched structures. The relative displacement between the bottom and top of OHCs can indicate the deformation of OHCs. The top displacement of OHCs in the middle row is represented as [16]:
u o h c 2 a ( x ) = u b m ( x ) ψ 1 ( b / 2 L p c ) 2 c o s ( θ ) ( c o s ( β α ) + c o s ( θ α ) )
The bottom displacement of OHCs in the middle row is the amplitude projection of the middle position of BM, expressed as:
u o h c 2 b ( x ) = u b m ( x ) c o s ( β )
Without considering the motion of the tectorial membrane, the relative shear displacement of stereocilia is the motion of reticular lamina relative to the tectorial membrane, and the relative shear motion of stereocilia in the middle row is expressed as:
u h b 2 ( x ) = u b m ( x ) ψ 1 ( b / 2 L p c ) 2 c o s ( θ ) s i n ( θ β )

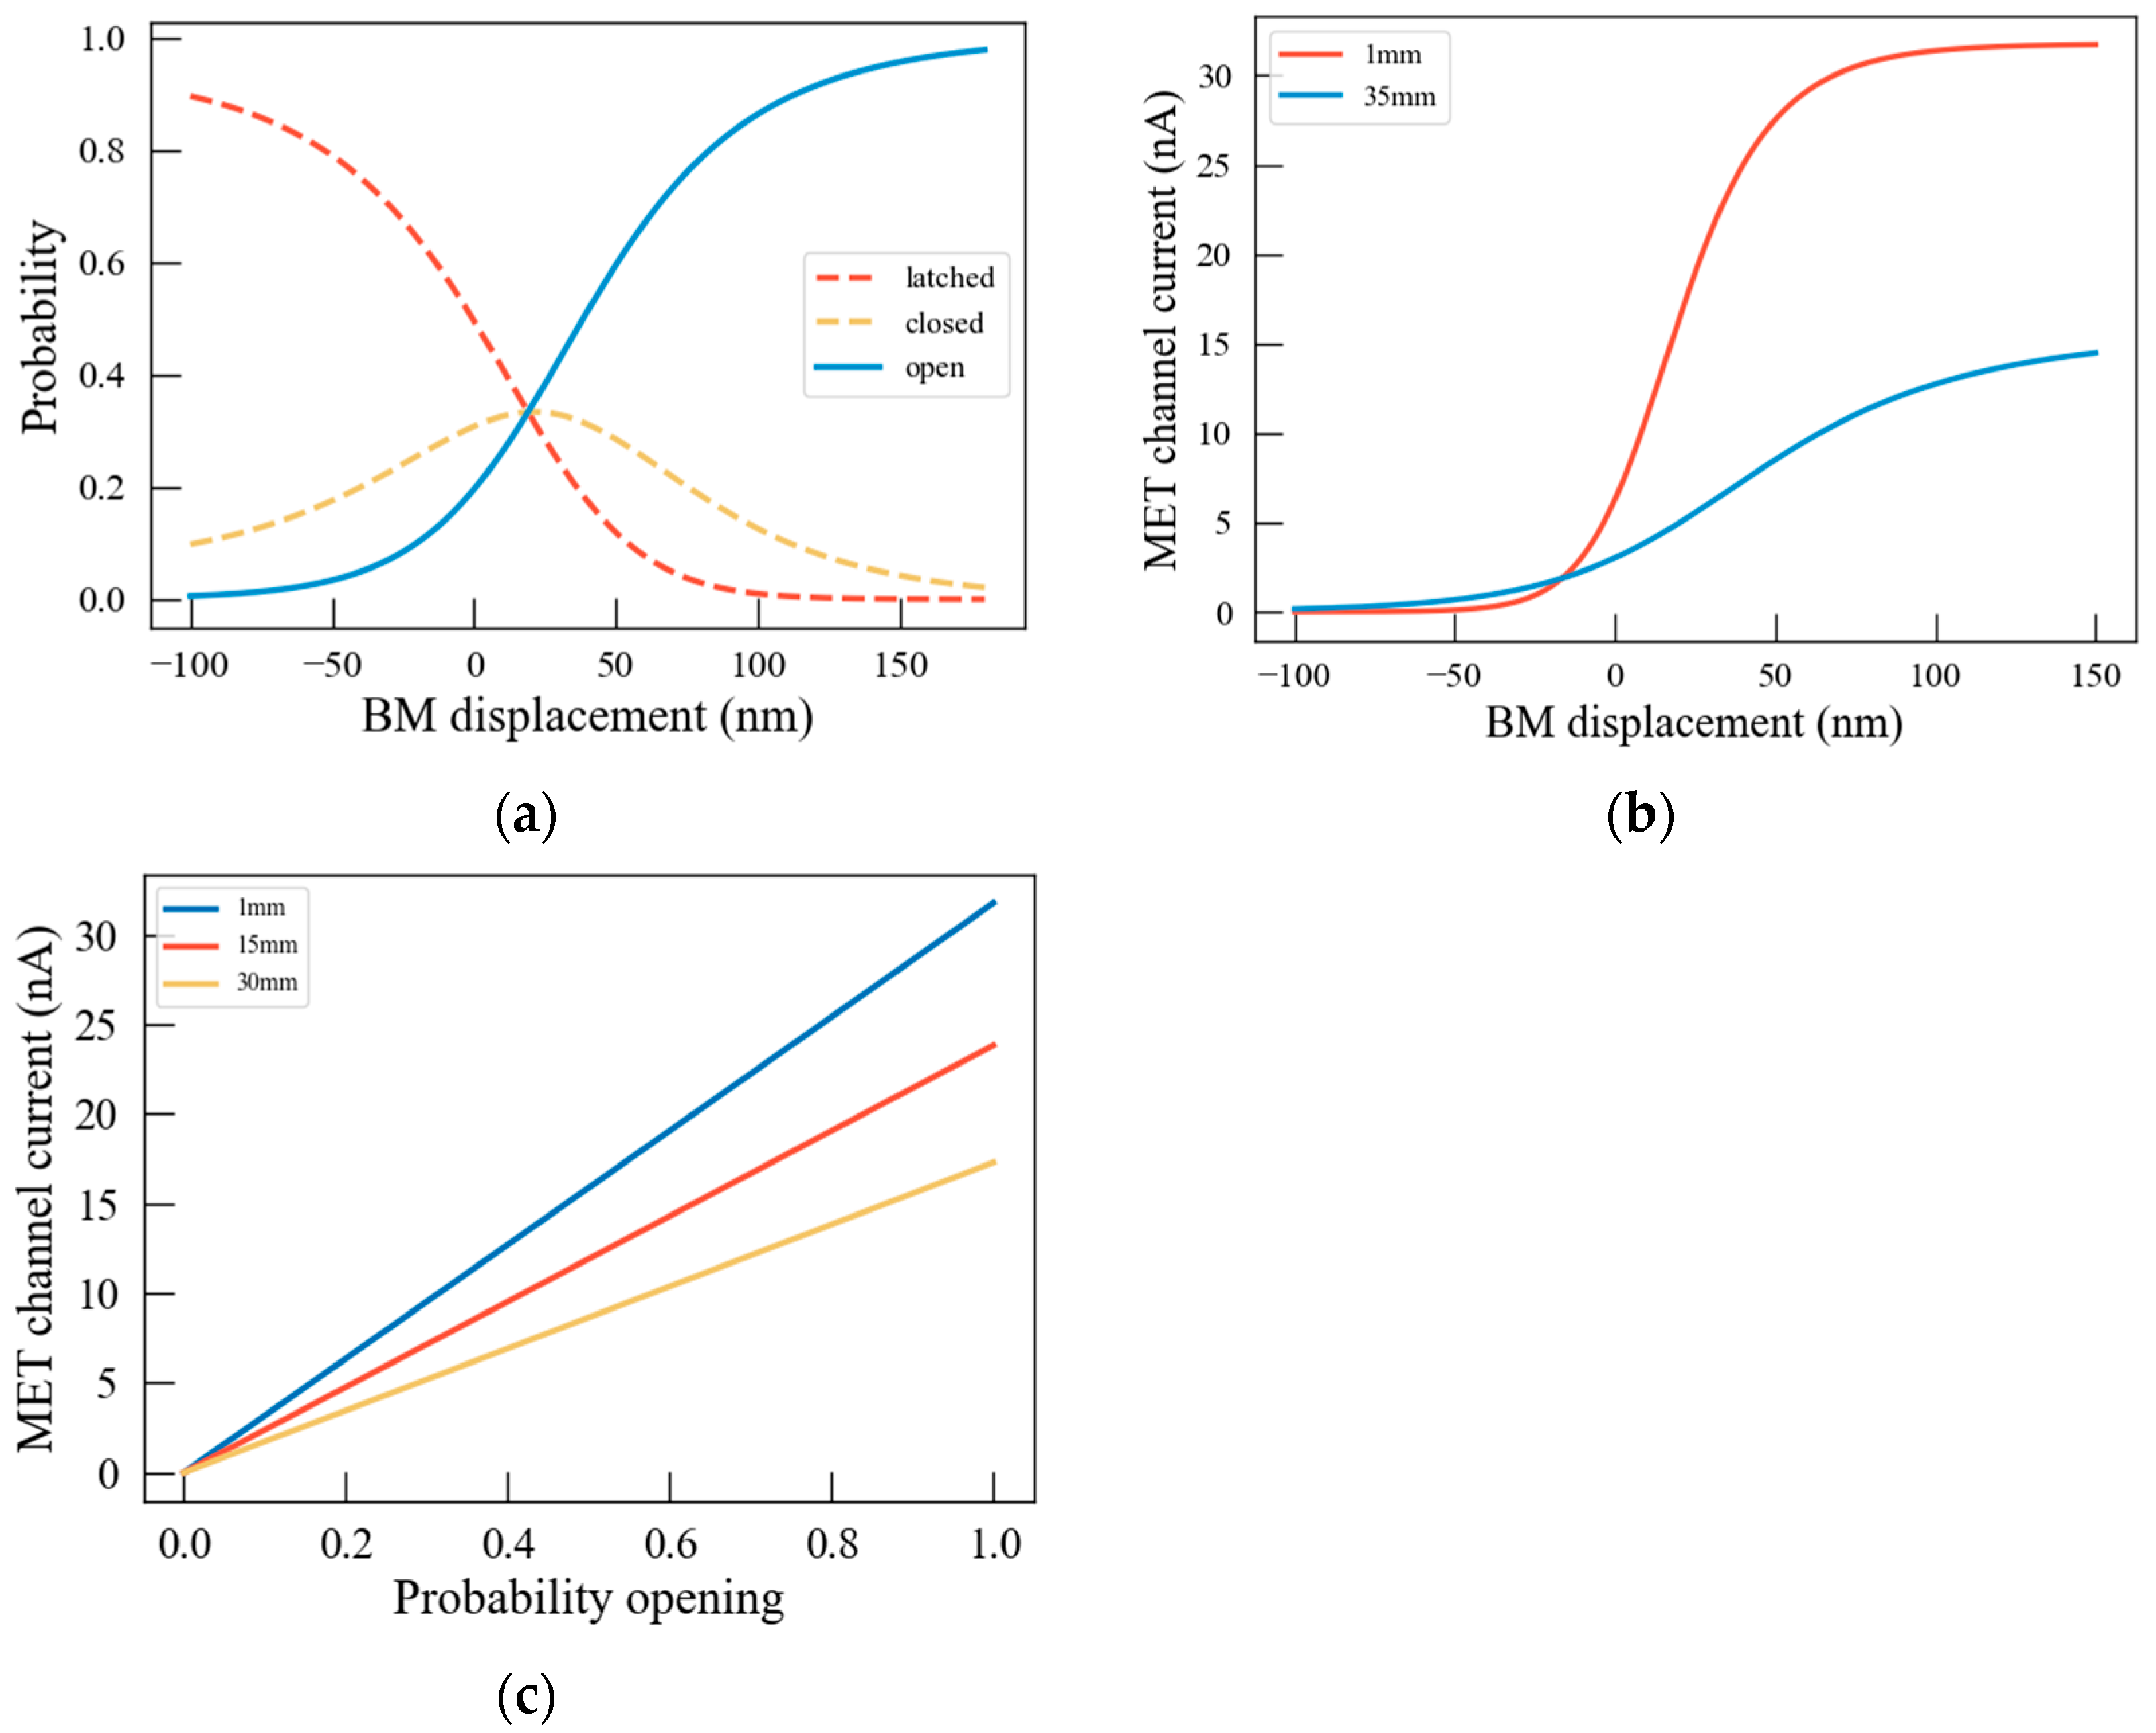
2.2. The Opening and Closing Characteristics of MET Channels and Electromechanical Characteristics of OHCs

Deflection of stereocilia on OHCs alters the opening and closing of MET channels embedded in stereocilia, which affects transduction currents and induces changes in intracellular voltage and alters the driving electrodynamics of OHCs [23,24]. The ion influx depends heavily on the electrical gradient provided by the positive endocochlear potential and the negative resting potential of the OHC. The change of intracellular voltage to the change of the length of OHCs, which provides the active force on the BM and tectorial membrane, results in a sharp tuning of the BM [25]. According to the gating-spring theory [9], the channels can be described as nonlinear channels with three states of the latched, closed, and open. The probability of MET channels opening is expressed by the Boltzmann function as:
P o ( u h b ) = 1 / 1 + Δ X × e x p f g s γ ( u h b X 23 ) k B T
where the Δ X is:
Δ X = 1 + e x p f g s γ ( u h b X 12 ) + Δ K ( u h b 2 X 12 2 ) / ( 2 N ) k B T
where X 12 and X 23 respectively represent the shear displacement of stereocilia from locked to closed state and from closed to open state, Δ K represent the stiffness change of stereocilia from locked to closed state, and N represents the number of channels. According to gating-spring theory, the k B represents the Boltzmann constant, T stands for temperature, γ represents the geometric amplification factor, which is the ratio of the vertical displacement of stereocilia to the lateral displacement of the top. f g s is the horizontal control force along the top of the stereocilia, denoted as f g s = k G d , where k G represents the stereocilia stiffness and d represents the gated swing.
It is assumed that the conductance of the MET channels is directly proportional to the probability of channels opening, which can be expressed as:
G h b = G h b max P o
where G h b is the variable conductance and G h b max is the maximum saturated conductance of the stereocilia. Changes in the number of stereocilia and the number of transduction channels can also cause changes in conductivity [26]. The current source generated by the opening and closing characteristics of the stereocilia can be obtained by multiplying the variable conductance by the potential difference between scala media and OHCs, and I s 1 is expressed as:
I s 1 = ( V s m V o h c ) G h b
where the V s m and V o h c voltages in the scala media and OHCs cables are static, respectively. I s 2 is the current generated by three OHCs piezoelectric characteristics, expressed as:
I s 2 = i ω ε m j = 1 3 φ h b j ( u o h c j a u o h c j b )
where ε m is the electromechanical coupling coefficient.

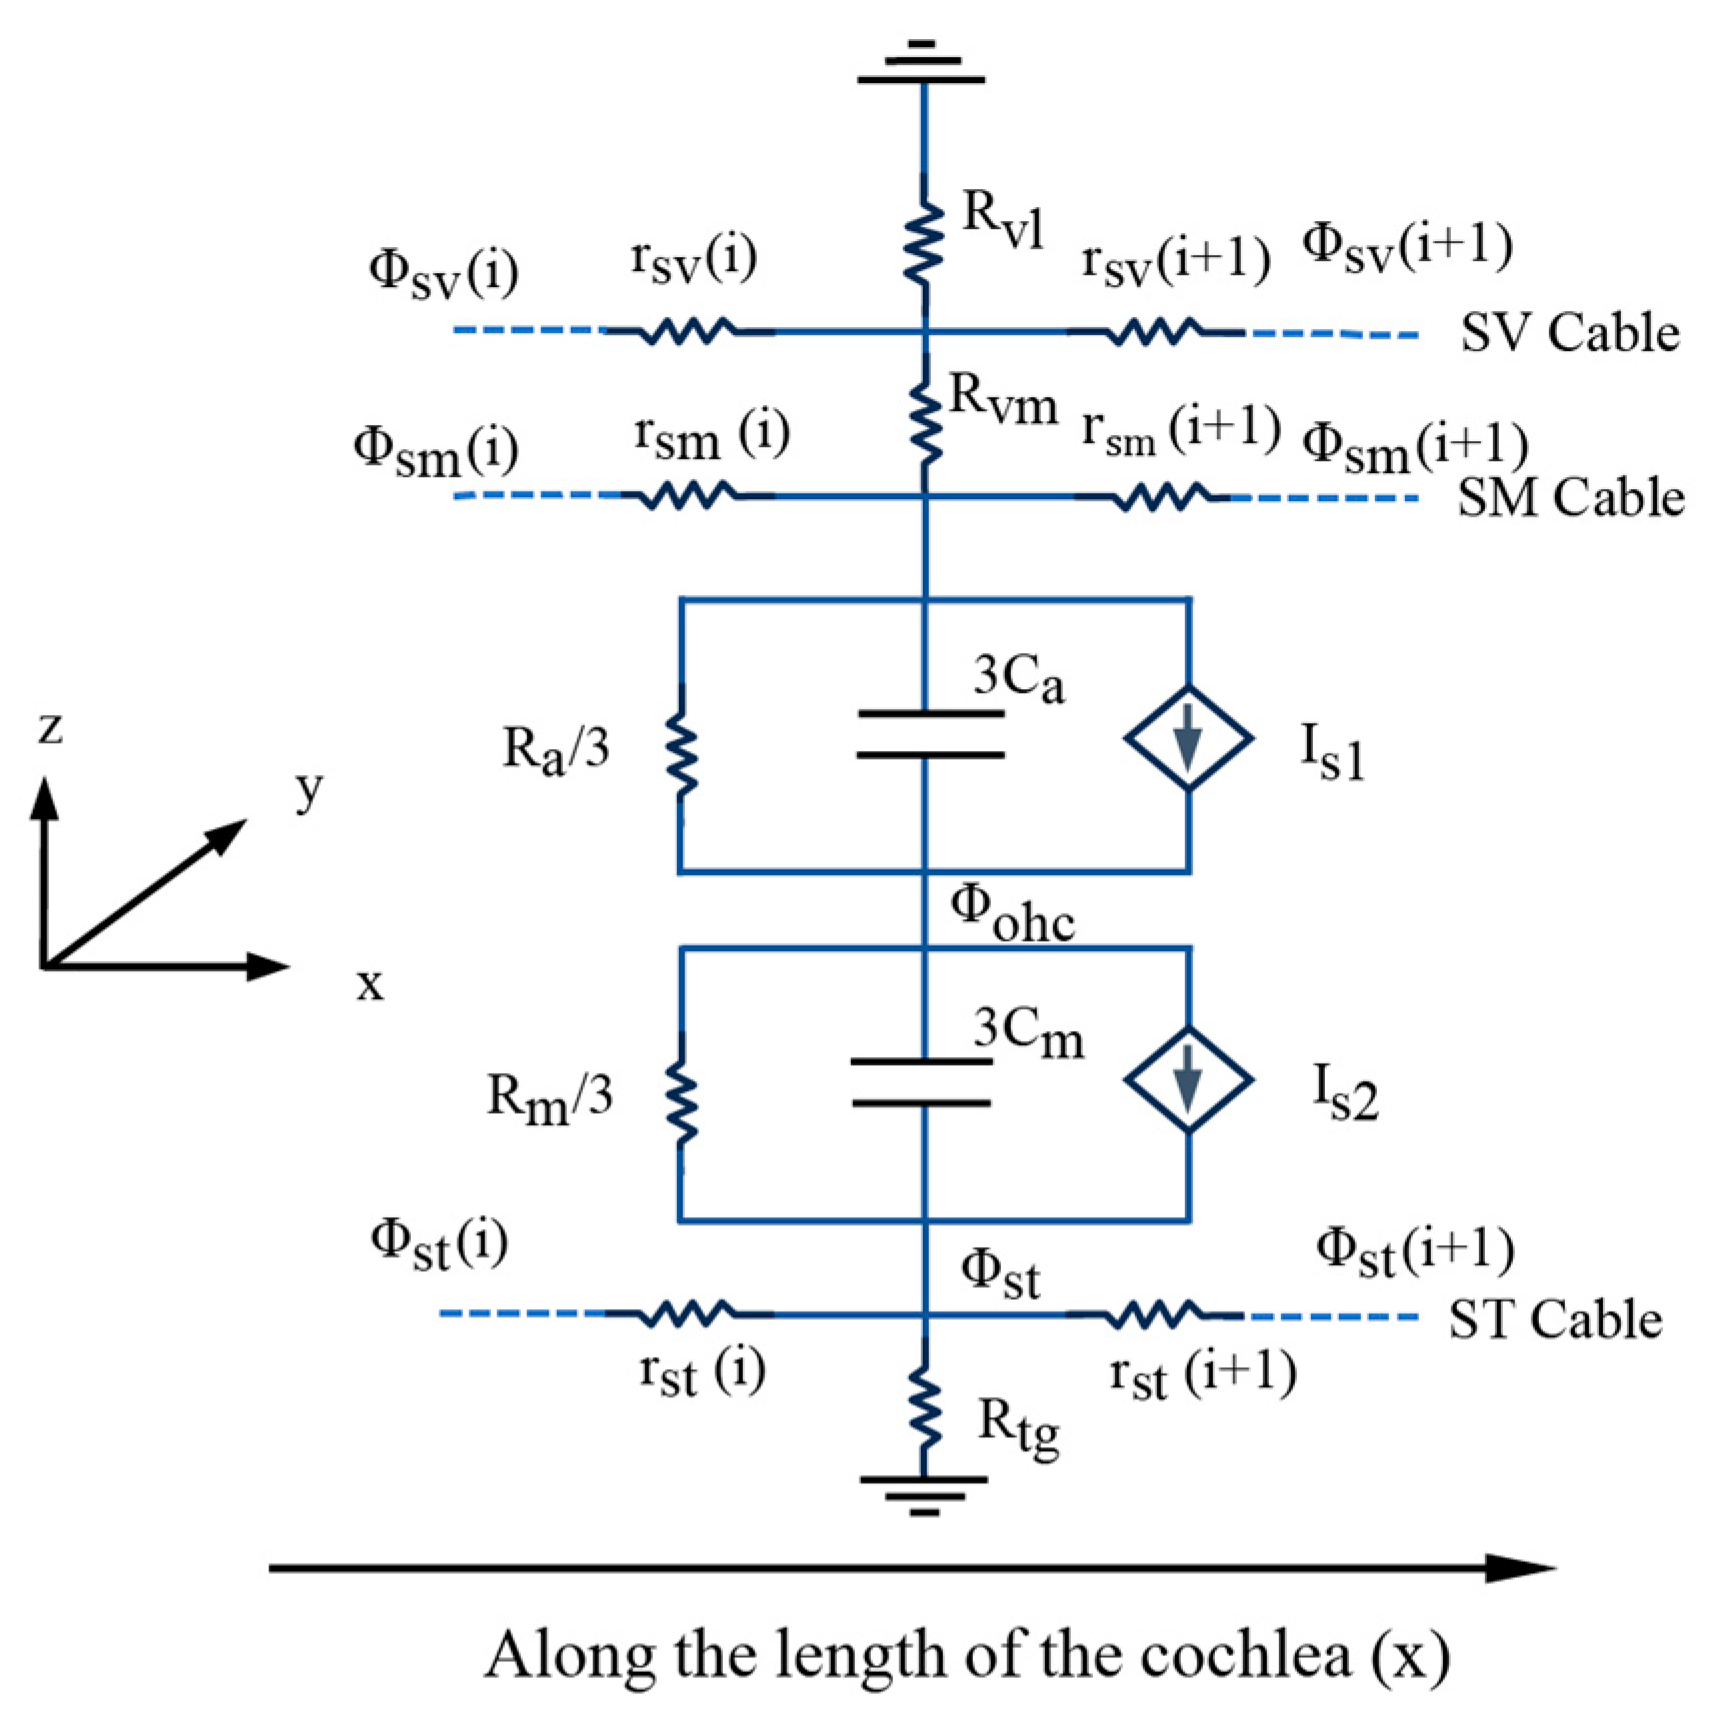
2.3. Electrical Environment of the Cochlear Cavity

The current propagating along the longitudinal direction in the cochlear cavity was modeled using Kirchhoff’s law. As shown in Figure 3, the cochlear cross-sectional circuit consists of three longitudinal cables: the scala vestibuli, the scala media, and the scala tympani. Among them, the scala tympani potential is considered as the potential near the BM. r s v , r s m , and r s t represents the resistance per unit length along the scala vestibuli cable, scala media cable, and scala tympani cable, respectively. The resistivity between the cable scala vestibuli and the cable scala media is expressed as R v m . The resistivity between the cable scala vestibuli and the surrounding cavity wall (ground) is expressed as R v g . The resistivity between cable scala tympani and the surrounding cavity wall (ground) is expressed as R t g . R a and C a represent the resistance and capacitance at the top of the OHC, respectively. R m and C m represent the lateral resistance and capacitance at the base of the OHC, respectively. I s 1 represents the current generated by the closing and opening of the MET channels. I s 2 represents the current generated by the piezoelectric properties of OHC. ϕ s v , ϕ s m , ϕ o h c , and ϕ s t represents the cable pulsation potentials on scala vestibuli, scala media, OHC, and scala tympani, respectively. According to Kirchhoff’s law, the electric field of the lymphatic environment is described as consisting of a circuit along a longitudinal cable and a radial cross section (cf. Figure 3), and the circuit equation is as follows [16]:
1 r s v 2 ϕ s v x 2 ( 1 R v l + 1 R v m ) ϕ s v + 1 R v m ϕ s m = 0
1 r s m 2 ϕ s m x 2 + 1 R v m ϕ s v ( 1 R v m + 3 Y a ) ϕ s m + 3 Y a ϕ o h c I s 1 = 0
3 Y a ϕ s m 3 ( Y a + Y m ) ϕ o h c + 3 Y m ϕ s t + I s 1 I s 2 = 0
1 r s t 2 ϕ s t x 2 + 3 Y m ϕ o h c ( 1 R t g + 3 Y m ) ϕ s t + I s 2 = 0
where Y a = 1 / R a + i ω C a and Y m = 1 / R m + i ω C m , which are the admittance at the top and bottom of the OHC, respectively. Equations (9) and (11) are added to the Equations (12)–(15) to solve for the potential change of each cable in the cochlea.

2.4. Active Force Feedback

The OHCs are inclined toward the base of the cochlea in the helical direction, thus affecting the angle of the active force of the OHCs on the BM. The angle of the OHCs with respect to the vertical direction is denoted by ψ . The top and bottom forces of the OHC are denoted by F o h c j a and F o h c j b . F o h c j a ( x ) denotes the force from x to x + dx. dx denotes the projection distance of the OHCs. Thus expressed as [16]:
F o h c j a ( x ) = ( K o h c ( u o h c j a + u o h c j b + ) + ε 3 ( ϕ o h c ϕ s t + ) ) c o s ( ψ )
F o h c j b ( x ) = ( K o h c ( u o h c j a + u o h c j b ) + ε 3 ( ϕ o h c ϕ s t ) ) c o s ( ψ )
where + and − represent the top and bottom positions of the OHC, respectively. Due to the small projection distance of the OHCs, their Taylor series was expanded, and a first-order approximation was taken [16]:
u ohc j b + = u ohc j b ( x + δ x ) = u ohc j b ( x ) + d u ohc j b ( x ) d x δ x
u ohc j a = u ohc j a ( x δ x ) = u ohc j a ( x ) d u ohc j a ( x ) d x δ x
ϕ st + = ϕ st ( x + δ x ) = ϕ st ( x ) + d ϕ st ( x ) d x δ x
ϕ ohc = ϕ ohc ( x δ x ) = ϕ ohc ( x ) d ϕ ohc ( x ) d x δ x

2.5. Material Properties

The main geometric dimensions of Corti and stereocilia are listed in Table 1. Table 2 shows the parameters related to the electric field, with reference to Strelioff’s article as much as possible [15]. Due to the different parameters at the base and apex of the cochlea, some parameters are given in the form of ranges.

2.6. Control Equations and Boundary Conditions for Numerical Models

A three-dimensional spiral cochlear model was reconstructed based on CT images [27]. The length of the cochlea was about 35 mm. The Young’s modulus of the BM was 1.2 × 10⁷ Pa~2 × 10⁶ Pa from the base to the apex, Poisson’s ratio was 0.3, and the density was 1200 kg/m3. The oval window, circular window, and BM were coupled to the fluid. The lymphatic fluid is assumed to be an incompressible viscous fluid. The governing equation in the frequency domain is expressed as:
1 ρ c p t q d = k eq 2 p t ρ c p t = p + p b k e q 2 = ω c c 2 c c = c 1 + i ω δ c 2 0.5 , ρ c = ρ c 2 c c 2 , δ = 1 ρ 4 μ 3 + μ B
where μB denotes the bulk viscous coefficient, c denotes the speed of sound, ω denotes the angular frequency, and ρc denotes the density. pt denotes the total sound pressure, pb denotes the background sound pressure, keq denotes the number of waves, and δ denotes the diffusivity of sound in the fluid. There are in the solid domain in the frequency domain:
ρ ω 2 u = σ + F v e i ϕ
where u represents the structural displacement vector, v is the displacement component, and ϕ denotes the phase. The oval and circular windows are assumed to be fixed boundary conditions, and the basal and apical ends of the BM are assumed to be fixed boundary conditions. The effect of the equivalent external ear canal sound pressure on the oval window is chosen as the input to the cochlea of the human ear.
Fluid-solid coupling relates fluid motion in the fluid domain to structural deformation, with equal displacements of fluid and solid at the interface. Acoustic pressure induces an applied fluid load on the solid domain, while the acceleration of the structure continuously excites the fluid domain. At the interface there is
n 1 ρ c p t q d = n u tt σ n = p t n
where n represents the unit normal vector on the boundary surface, and utt represents the acceleration of the structure.
Based on the fluid-solid coupled finite element model [27], the BM displacement under the equivalent sound pressure in the external ear canal was calculated in the frequency domain. The BM displacements are brought into the Corti equations of motion, the MET channel equations, and the OHCs piezoelectric effect equations to obtain the currents Is1 and Is2. The cochlear cable potentials are solved by the Kirchhoff’s law circuit equations, and the active forces acting on the BM from the OHCs are solved according to the OHCs active feedback relationship. The displacement of the BM under the active force is calculated by combining the active force acting on the nodes of the BM unit and the acoustic pressure of the cochlear oval window. The displacement of the BM under the action of the active force is reintroduced into the equation of motion of the Corti, the equation of the MET channels, and the equation of the piezoelectric effect of the OHCs, and the cochlear cable potential is solved in the circuit equation.

3. Results

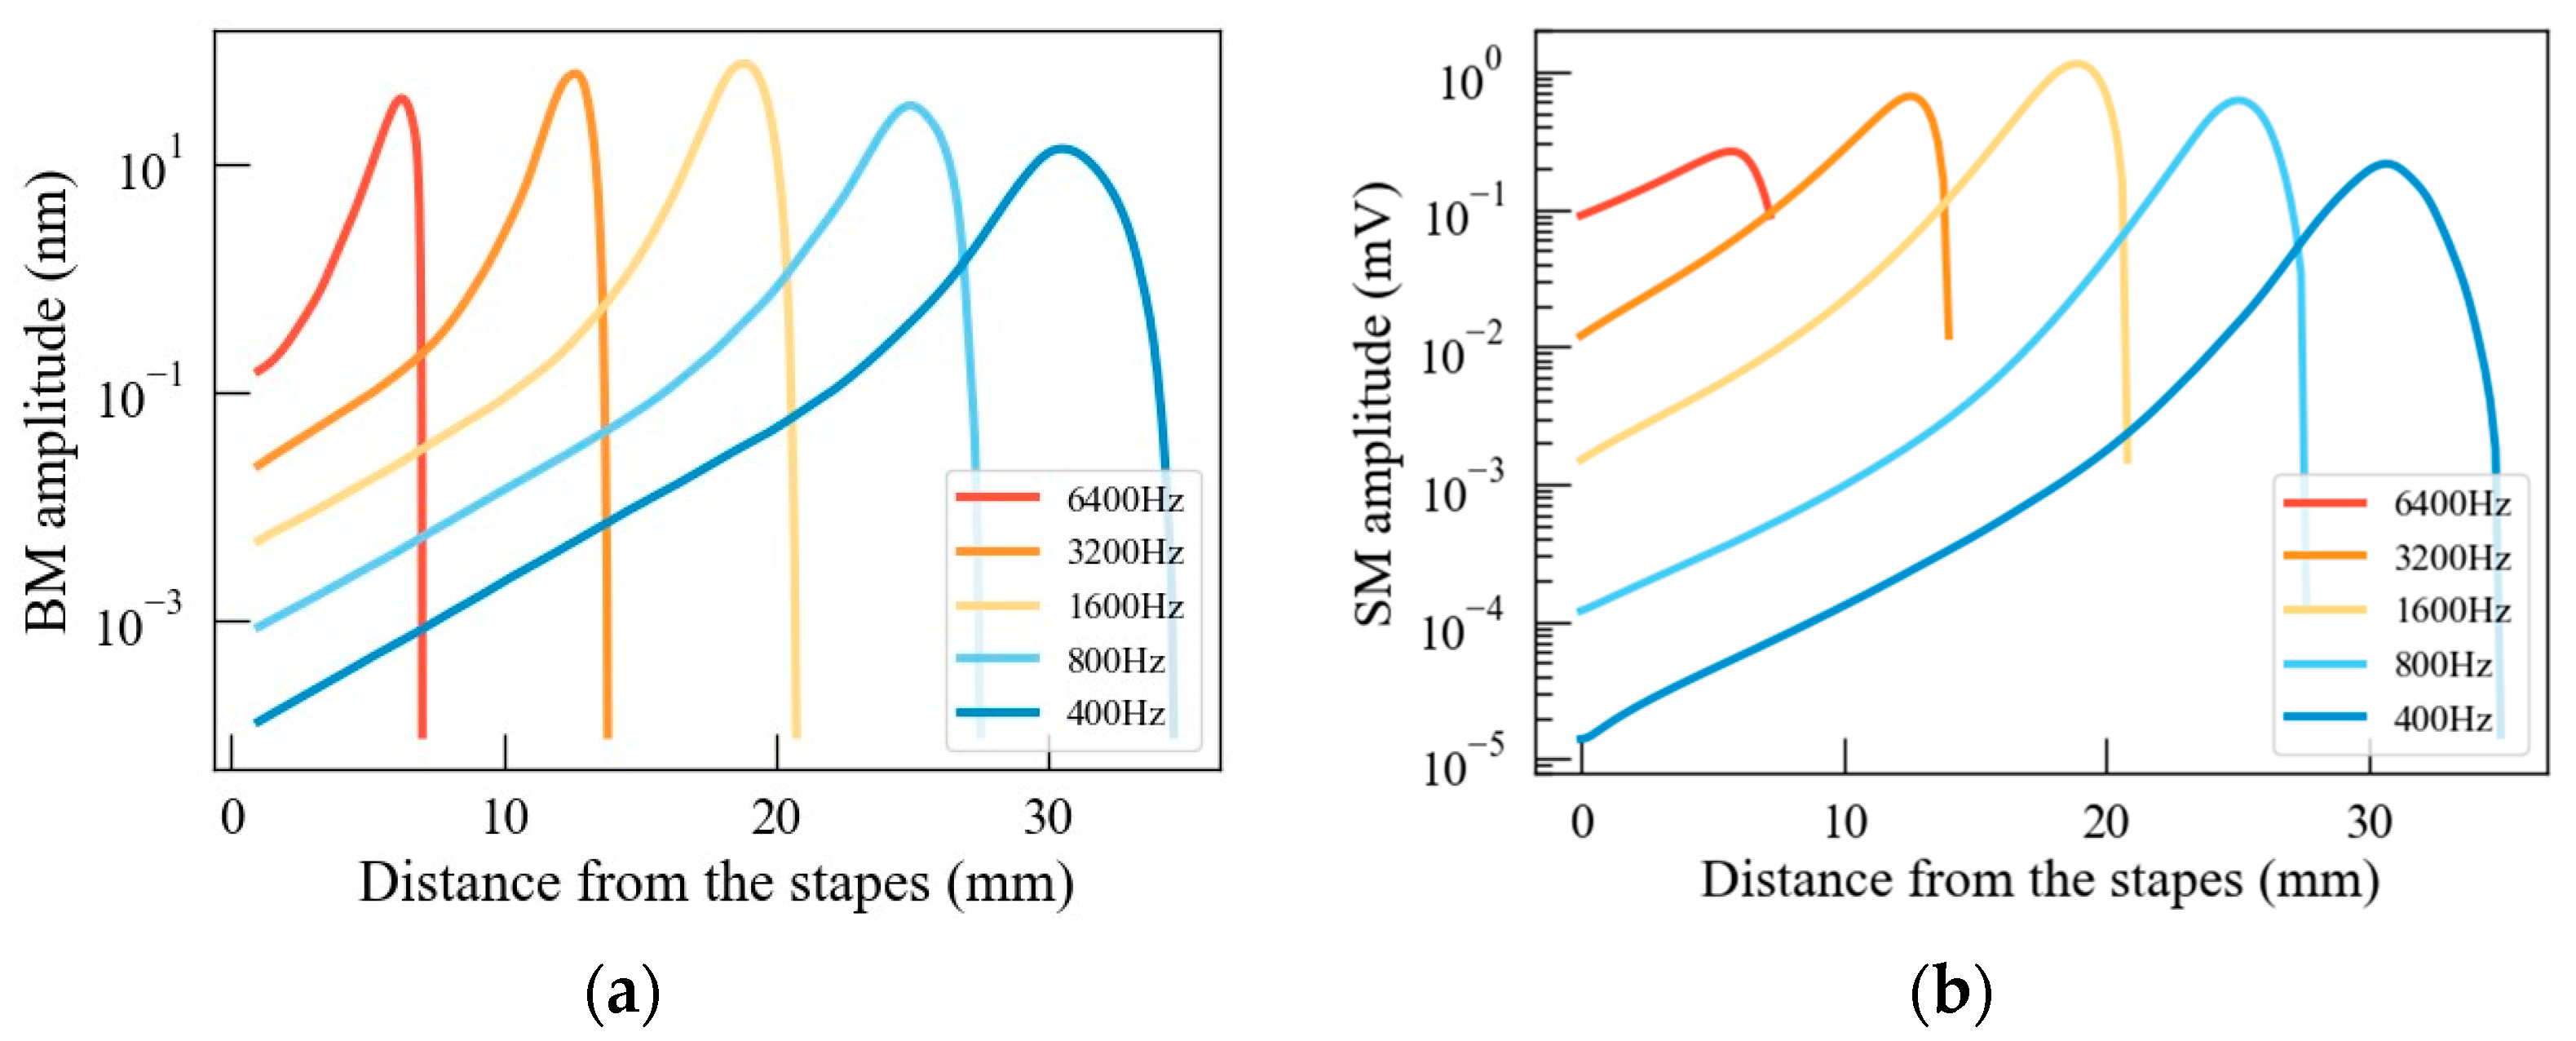
3.1. Model Validation

Through the self-programmed finite element program, the obtained BM displacement [27] under the action of the active force is substituted into the Formulas (12)–(15) as the excitation to solve, and the scala media potential at different frequencies of the human cochlea is obtained. There is a large variation in the lengths of human cochlea, ranging from 2.5 to 2.75 turns. The cochlear model in this paper assumed a cochlear length of 35 mm. As shown in Figure 4, the frequencies selected from left to right are 6400 Hz, 3200 Hz, 1600 Hz, 800 Hz, and 400 Hz, respectively.
The CM in the mammalian cochlea is generated by receptor currents flowing through the cochlear partition, and a major part of this current is generated by the OHC [28], with a small contribution of currents from the inner hair cells, so that the cochlear scala media potential can be considered as the CM. Figure 4 shows the inputs and outputs of the cochlear model, and as can be seen from the figure, high-frequency stimulation elicits vibrations near the base, and low-frequency stimulation elicits vibrations near the apex. Along the longitudinal position of the cochlea, the magnitude of the cochlear potential amplitude calculated by the model showed the same pattern as the BM displacement amplitude. The maximum voltages of mammals all show a lower response at both high and low frequencies than at middle frequencies, and the maximum voltage amplitudes are close to each other, the main difference being the different ranges of sensitivity to sound frequencies in different species. Since the frequency range and sensitivity range of hearing in rhesus monkeys and humans are similar, the scala media potential of this model is compared with the maximum voltage of the CM response of rhesus monkeys, as shown in Figure 5. Although there are certain differences between this model and the experimental recordings at low frequencies [29], the overall change patterns are consistent, demonstrating the validity of this model. In addition, the potential amplitude is largely constrained by the BM vibration amplitude, with some variations observed between different species. Additionally, the voltage has a wide tuning curve, similar to that in the references [30,31].

3.2. The Transduction Current of Hair Bundles

The hair bundles are located at the top of hair cells, consisting of 20–300 stereocilia ladder arrays with heights ranging from a few micrometers to tens of micrometers. Its top is covered by a tectorial membrane, and the movement of BM drives the hair bundles to deflect. The tip connection extends the tip of a stationary stereocilia along the axis of symmetry of the bundle to one side of its adjacent higher stationary stereocilia and connects them together. Transduction channels may be located at either end of the tip connection, with more than 200 channels. When the deviation of the hair bundles causes the elastic element (gate spring) to tighten, the transduction channels will open. The single-channel gating force is close to values in the literature on mammalian cochlear hair cells [32,33].
As shown in Figure 6a, the opening probability of transduction channels presents an S-shaped distribution, and the dotted lines represent the latched and closed probabilities, respectively. The higher the gating sensitivity, the steeper the displacement response relationship, and the higher the current sensitivity. The conductance of the OHC transduction channels is regulated by the gating spring. The current of the transduction channels is proportional to the opening probability of the gating spring, and the conduction current also shows an S-shaped distribution. When the BM displacement is 0, the probability of the transduction channel opening is 0.2, allowing a certain degree of transduction current to pass through. When the BM displacement is greater than 0, the probability of the transduction channel opening increases, and the transduction current also increases. The sensitivity of the transduction channels is highest when the BM displacement is between 0 and 50 nm, which is close to a linear relationship with the BM displacement. When the BM displacement is greater than 50 nm, the probability of open transduction channels increases while the sensitivity also decreases. Finally, the open probability of the transduction channels is infinitely close to 1, and the transduction current is close to its maximum. When the BM displacement is less than 0, the degree of closure of the transduction channels gradually increases, and the transduction current gradually approaches 0. Figure 6b shows the S-shaped distribution of conduction currents at the base (1 mm) and apex (35 mm) of the cochlea, respectively. The range of BM activity and the magnitude of change in the size of the transduction current at the base of the cochlea and at the apex of the cochlea in the present model are closer to the experiments of David et al. [26] and well simulate the pattern of change of the MET channels along the longitudinal direction of the cochlea. Due to some differences between species, the transduction currents in this model were slightly larger than those measured by David et al. Figure 6c shows the conduction current distribution varying with the opening probability of MET channels.

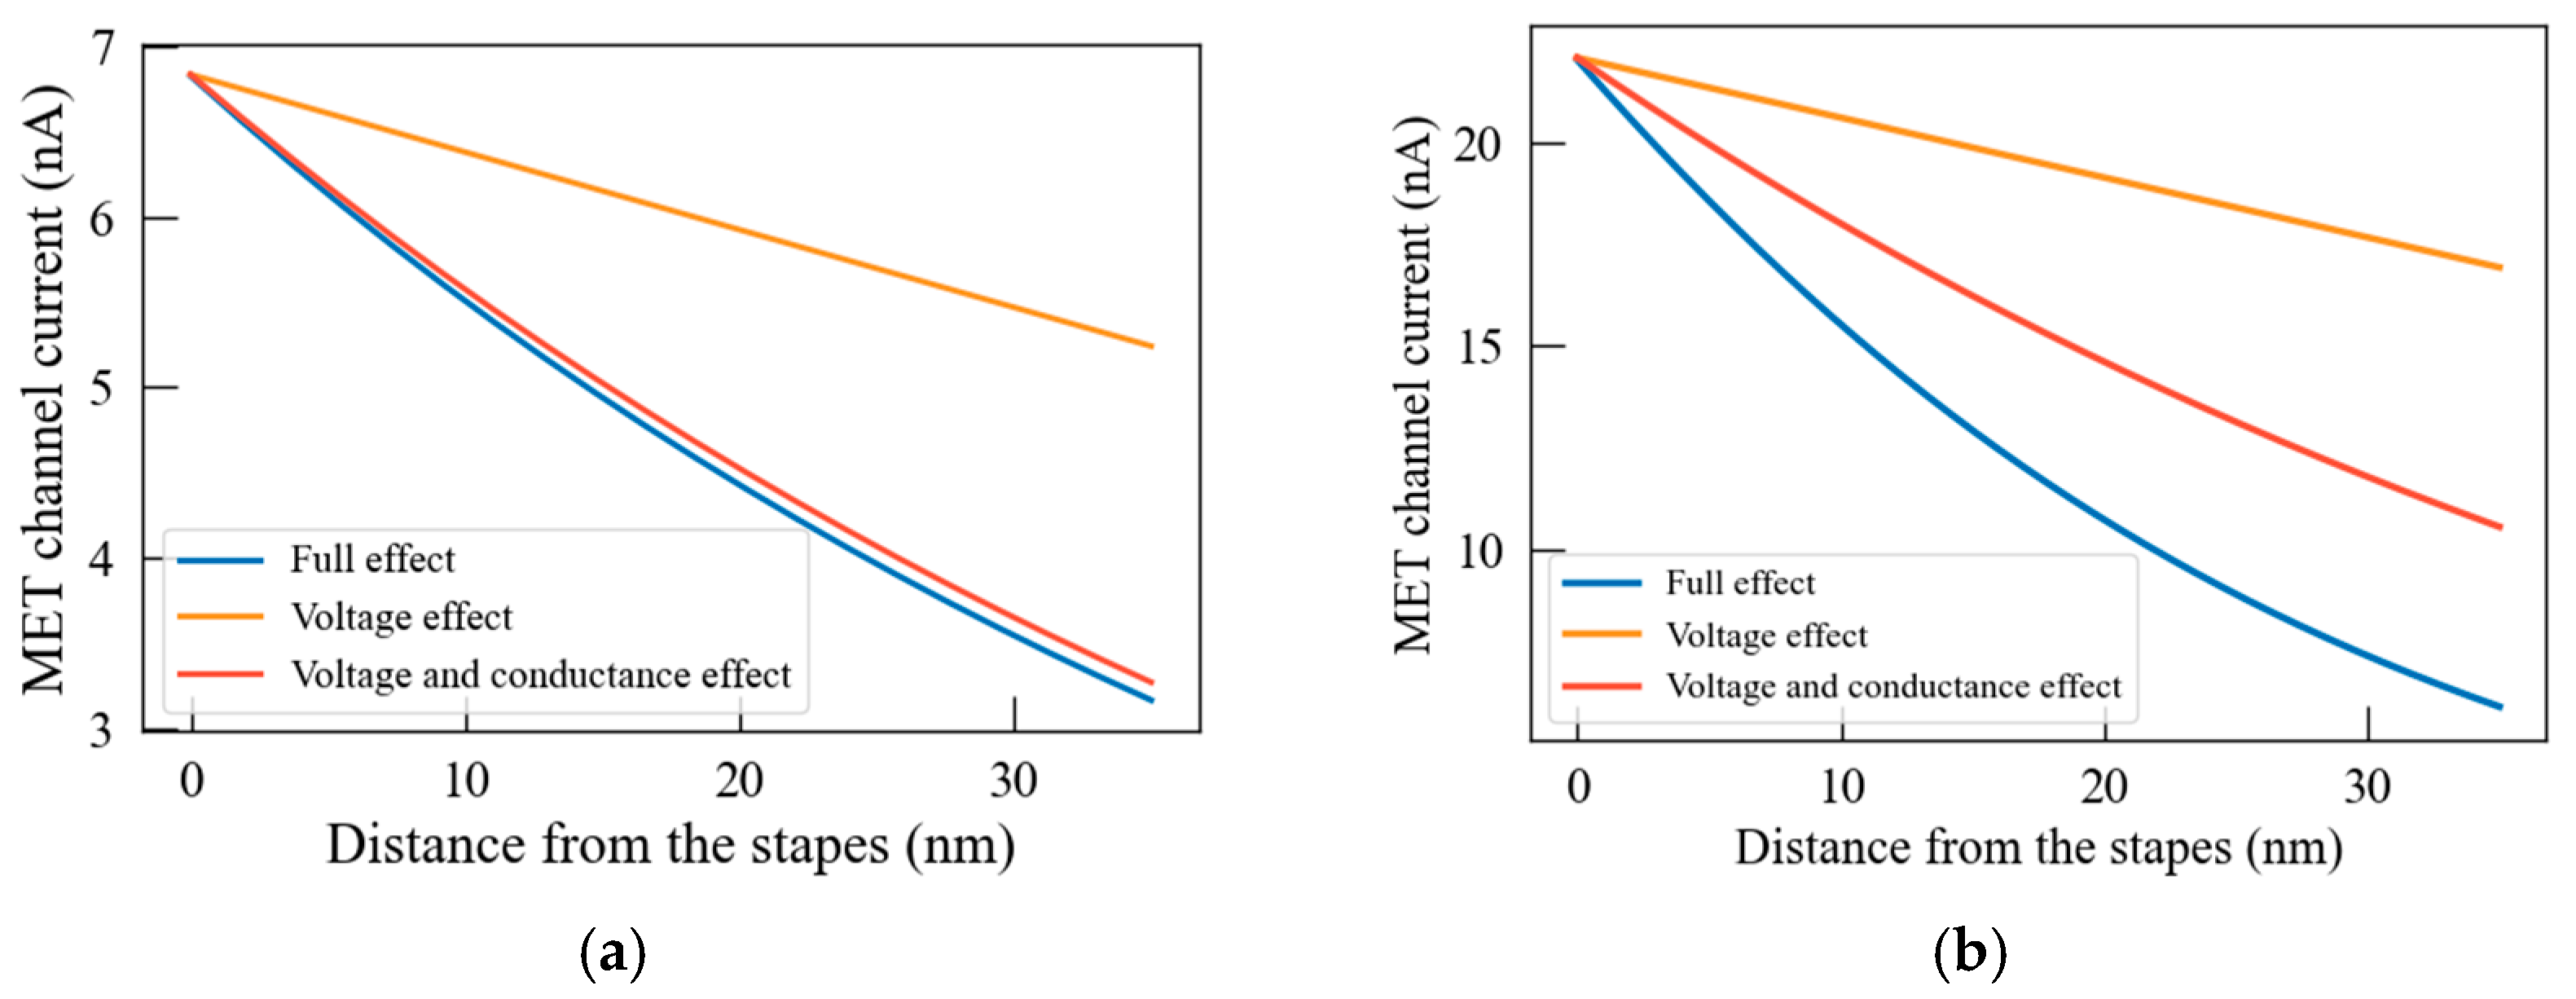
3.3. The Effect of Stereocilia Structure on Longitudinal Conduction Current

Figure 7 compares the transduction current under 1 nm and 30 nm BM displacement. Along the longitudinal direction of the cochlea, the voltage between scala media and OHCs gradually decreases with the increase in distance from the base of the cochlea. The yellow line indicates the current change only under the influence of voltage. At the same time, the length of the longitudinal stereocilia of the cochlea increased nonlinearly, and the shear displacement of the stereocilia increased nonlinearly. However, due changes in stereocilia number and height in hair bundles, conductivity, and geometric magnification factor γ, the conduction current of MET channels decreases nonlinearly. The red line in Figure 7 indicates the voltage and conductivity change between scala media and OHCs. In addition, the MET channel probability of the cilia in the low-frequency region is smaller under the same BM displacement. Finally, under the joint action of multiple factors, the cochlear conduction current shows a nonlinear downward trend from fast to slow along the longitudinal direction of the cochlea, as shown by the blue line in Figure 7.

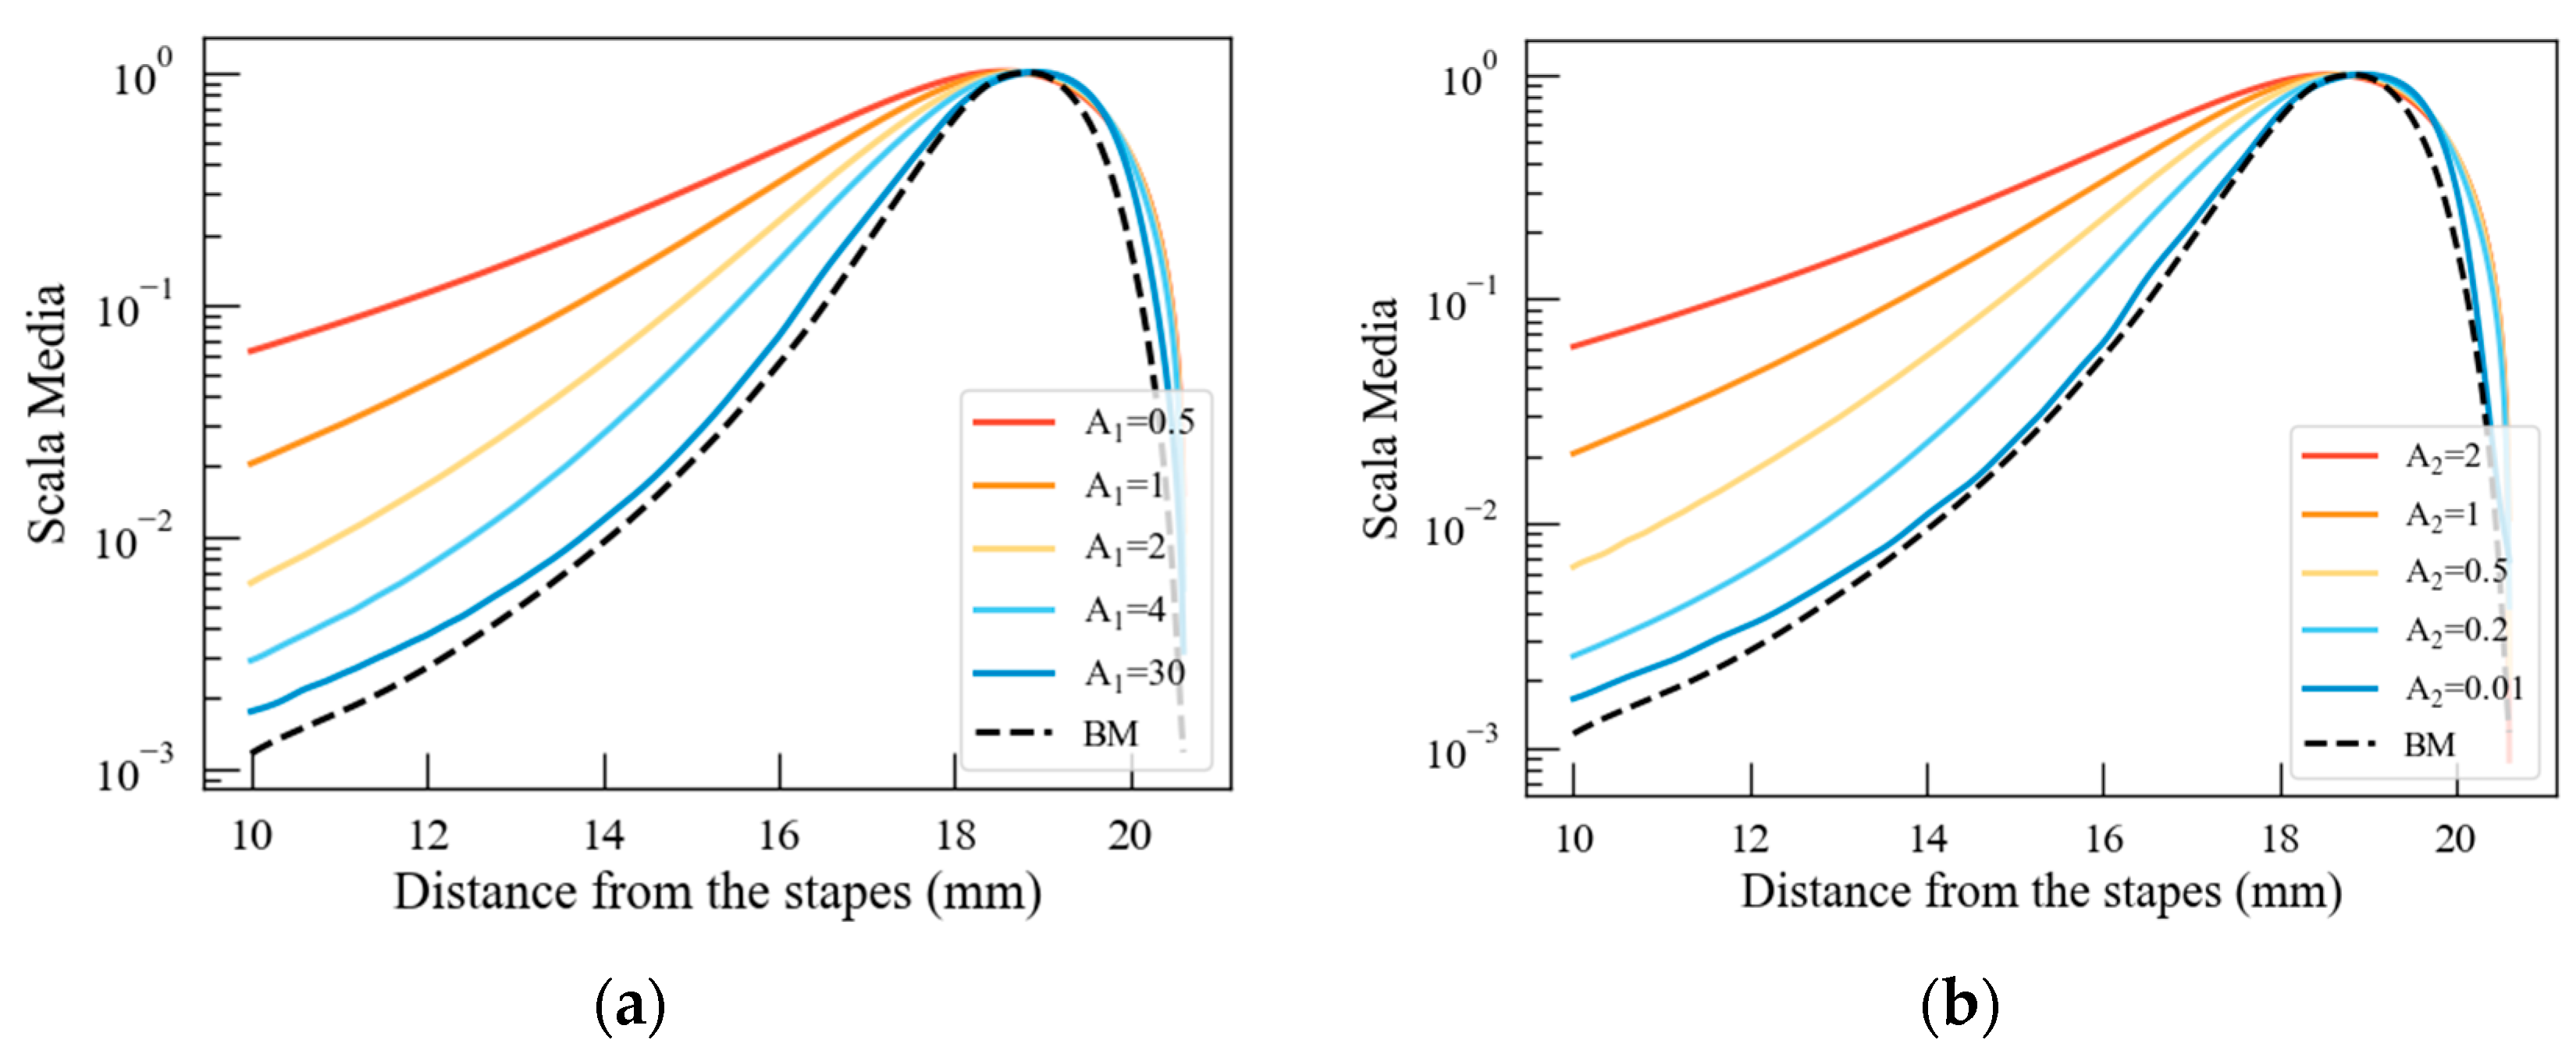
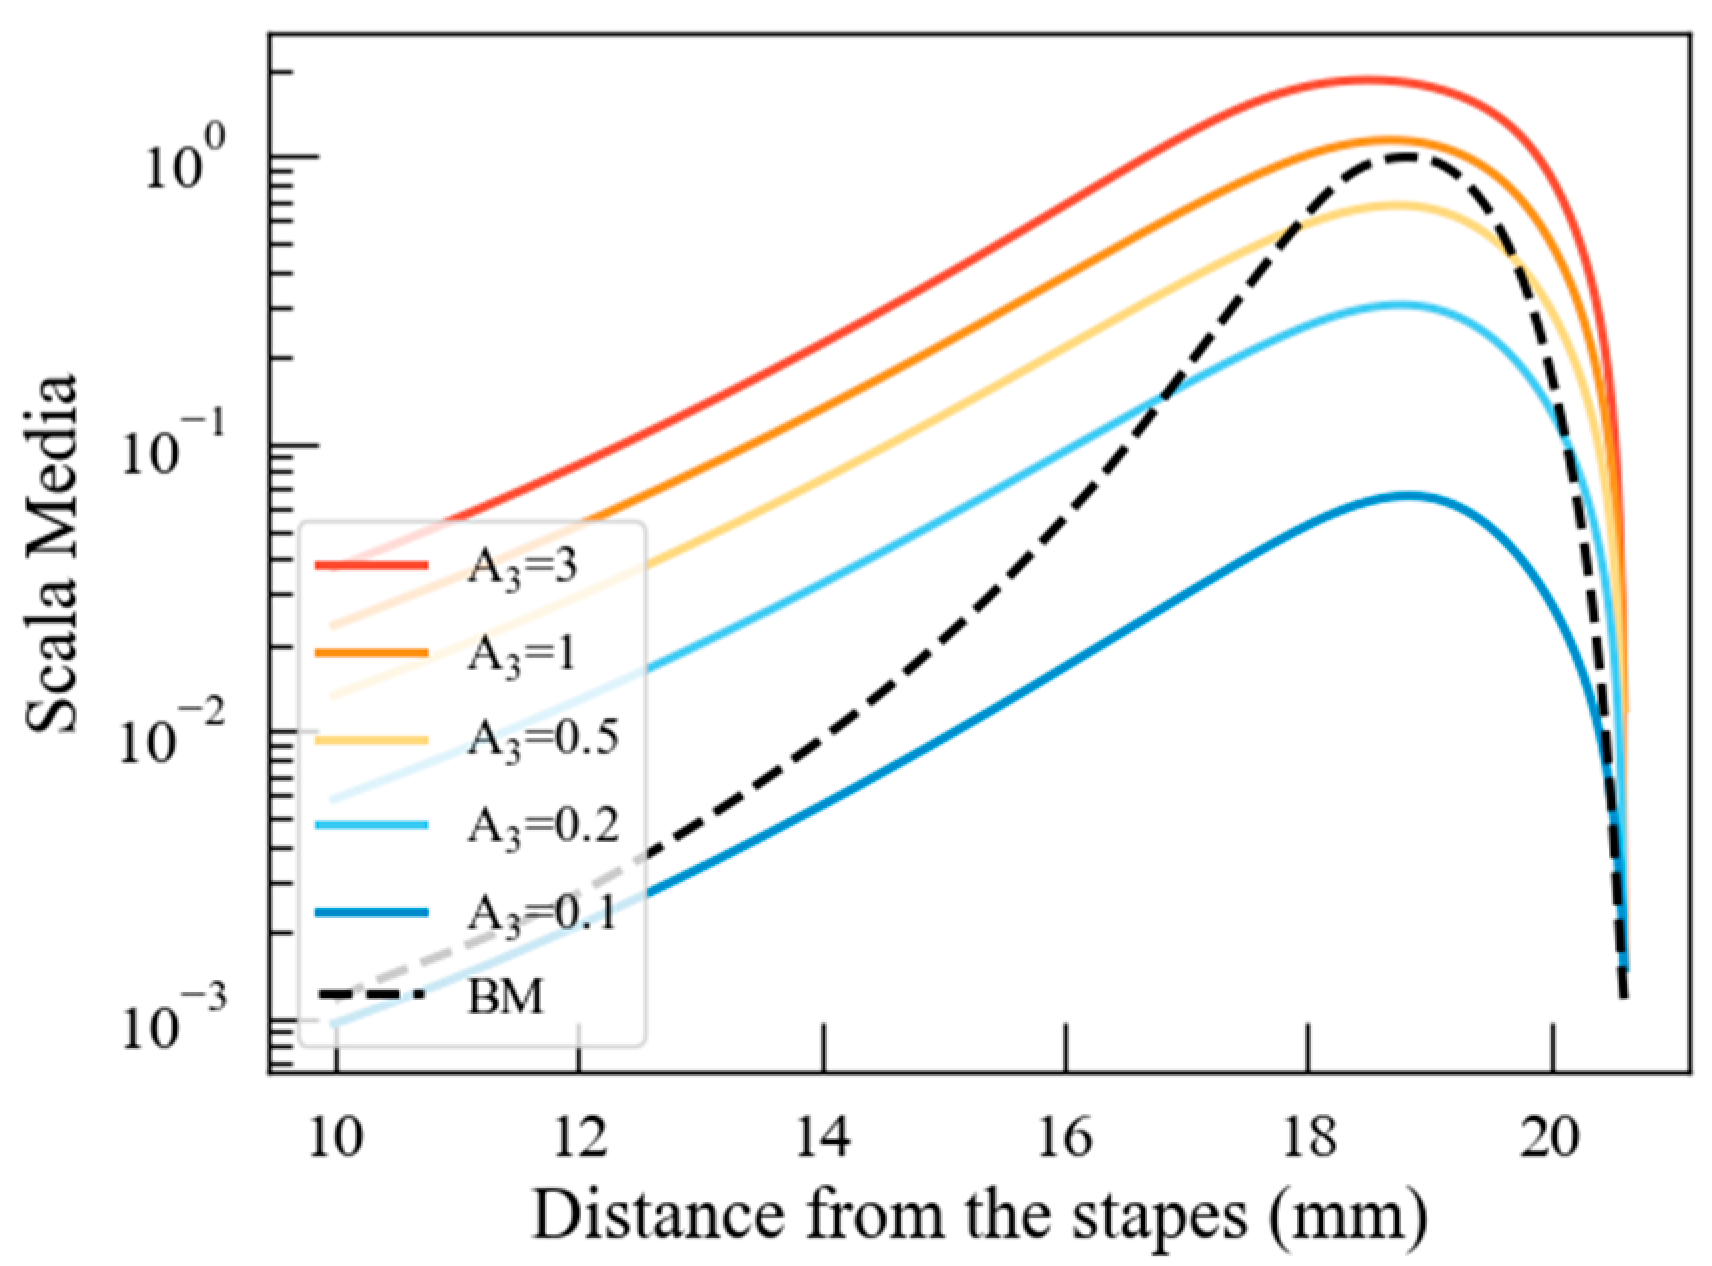
3.4. The Effect of Resistance on CM Potential

The CM tuning curve reflects the amplitude of the distribution of current generated by hair cells at different positions outside the cell. The mutual interference between the potentials generated by OHC at different positions is considered to be the reason for the wide tuning curve of CM [34]. However, Ayat [35] indicates that the longitudinal coupling of OHC only slightly changes the width of the tuning curve, and a wide tuning curve can be achieved without longitudinal coupling. On the contrary, this wide tuning curve is caused by the offset of the phase difference between the OHC and the hair bundles potential. The phase difference between the OHC and the hair bundle potential is caused by the longitudinal resistance.
In order to investigate the effect of resistance parameters on the electric field, the longitudinal resistance values r s v , r s m , and r s t are simultaneously multiplied by the longitudinal resistance amplification factor A1 for scaling, and the resistance values R v m , R t g , and R v g between different cables are simultaneously scaled by the amplification factor A2. As shown in Figure 8a, varying the amplification factor A1 significantly changes the sharpness of the tuning curve. The larger the longitudinal resistance amplification factor A1, the wider the sharpness of the tuning curve, and vice versa. The results confirmed the finding of Ayat et al. that the longitudinal resistance affects the sharpness of the tuning curve. In addition, it is found that the resistance between different cables also has a significant effect on the clarity of the tuning curve. The scaling amplification factor A2 leads to a significant change in the magnitude of the potential and the sharpness of the tuning curve. In order to observe the impact of these values on the clarity of the CM tuning curve, it was normalized. It can be observed from Figure 8b that when the scaling amplification factor A2 is greater than 1, the sharpness of the tuning curve becomes wider, and the potential amplitude increases. The resistance between different cables represents the difficulty of ion movement between the inner and outer lymph nodes. Stereocilia movement causes potassium ion efflux, and the increased resistance between cables hinders the ion movement from the outer lymph to the inner lymph, resulting in an increase in the CM potential. On the contrary, the sharpness of the tuning curve becomes narrower, and the amplitude decreases. In addition, the electric field is almost equally sensitive to the amplification factors A1 and A2, with a significant change in the potential at smaller amplification factors. This means that tissues such as vascular stripes also play a crucial regulatory role in the tuning curve by transporting ions. The ion movement between different cavities keeps the inner lymphatic fluid in a steady state, and the sharpness of the tuning curve to some extent reflects the regulatory results of tissues such as vascular folds, reflecting the health status of the cochlea.

4. Discussion

4.1. Potential Distribution Pattern

Along the longitudinal position of the cochlea, the results of this model show that the amplitude of the cochlear potentials follows a similar distribution pattern to the amplitude of BM displacement, as shown in Figure 8, which differs from that reported by Ramamoorthy et al. [16]. The Corti model developed by Ramamoorthy et al. assumes that the conductivity varies linearly with the deflection of the hair bundle and does not take into account the effect of the nonlinear motion of the hair bundle on the potential, thus showing considerable differences in the pattern of the BM displacement and the scala tympani voltage at a particular location. The model developed in the present study, which takes into account the nonlinear motion of the hair bundle. Additionally, Ramamoorthy et al. studied the amplitude-frequency response curves of BM displacement and scala tympani voltage at a point within the cochlea, while the model in this paper calculates the amplitude distribution curves of BM displacement and cochlear potential along the cochlea spiral direction from the base to the apex, both of which are different. Therefore, the two papers show different results.
The scala media potential amplitudes predicted by Ayat et al. [18] at different locations along the cochlea have a similar trend to the distribution pattern of scala media potential amplitudes in this paper (combined with Figure 4), but the scala media potentials in this paper have a higher degree of tuning. Compared to the analytical model by Ayat et al., the three-dimensional finite element model established in this paper more accurately reflects actual physiological conditions, thus reflecting the stronger tuning ability of the BM in the model calculations, which further influences the degree of tuning of the scala media potential. The model developed by Strelioff [15] used a three-dimensional network of resistors and batteries to simulate the electrical impedance of the cochlear tissues and the bioelectric batteries in the stria vascularis and the organ of Corti, and the results show the distribution of scala media potentials along the longitudinal direction of the cochlea at a frequency of 1000 Hz. Compared to the scala media potential distribution calculated by the model in this paper, the results in both cases show scala media potentials along the longitudinal direction of the cochlea following the BM displacement, with peak responses near the characteristic frequency. However, the scala media potential distribution calculated by Strelioff [15] showed a secondary peak near the apical portions of the amplitude envelopes for the scala media. This is because Strelioff’s model calculates that the phase change in resistance with distance causes the potential cancellation at the apical portions, resulting in a secondary peak.
The longitudinal resistance and the resistance between different cables will cause differences in the voltage distribution of the scala media and the scala tympani. These two types of resistance play a crucial regulatory role in the voltage distribution patterns.

4.2. The Effect of Stereocilia Stiffness on Cochlear Potential

The stereocilia are located on the top surface of the OHC, and the stereocilia stiffness changes the transduction current by affecting the deflection angle of the stereocilia, ultimately affecting the lymphatic potential. In order to analyze the effect of stereocilia stiffness on the potential, the stereocilia stiffness is multiplied by the amplification factor A3, and the results of different amplification factors are plotted in Figure 9. Under the same BM displacement, the decrease in stereocilia stiffness does not affect the relative displacement at both ends of stereocilia. On the contrary, it leads to a decrease in the deflection angle of the stereocilia and a decrease in the gating force at the top of the stereocilia, resulting in a decrease in the transduction channel current, which ultimately leads to a decrease in the lymphatic potential and a sharper tuning curve, as shown in Figure 9 when A3 < 1. As shown in Figure 9, when A3 > 1, the deflection angle of the stereocilia increases as the stereocilia stiffness increases. Due to the S-type distribution pattern of the transduction channel current, the excessive stereocilia deflection angle leads to a small increase in the transduction channel current and a decrease in the peak current discrimination, which eventually causes the lymphatic potential to increase and the tuning curve to widen.
During the process of increasing the stiffness amplification factor A3 from 0.1 to 3, the deflection angle of the stereocilia changes from small to large, the transduction channel currents are gradually saturated, and the lymphatic fluid potential maximum corresponds to a constant movement of the transverse coordinate toward the base of the cochlea. In the case of only increasing the stimulation level without changing the stereocilia stiffness, the same saturation of the transduction channel current occurs, which further causes the maximum potential coordinate to move toward the base of the cochlea, and the phenomenon is the same as that also recorded in the experiment [31]. Since this model does not consider the movement of the tectorial membrane, the change in hair bundle stiffness has a minimal effect on the characteristic frequency of potentials in the scala media. The increase in hair bundle stiffness may significantly affect the movement of the tectorial membrane, leading to changes in the characteristic frequency of BM displacement. The characteristic frequency of BM displacement is very close to the characteristic frequency of potentials in the scala media. This suggests that the change in the characteristic frequency of BM displacement is likely caused by hair bundle stiffness affecting the phase difference between the tectorial membrane and the BM, rather than a direct effect of hair bundle stiffness on OHC and the BM. The increase in stiffness and displacement of the BM mostly leads to an increase in the degree of opening of transduction channels. When the degree of transduction channel opening is high, the probability of MET channel opening is close to 1, and the position near the base of the cochlea has a greater conductivity and voltage, which will generate a larger potential. Therefore, the maximum potential coordinate continuously moves towards the base of the cochlea.

5. Conclusions

In this study, a mechano-electrical coupled mechanical model of the cochlea is developed by embedding a nonlinear mechanical model of the stereocilia of the OHCs into the electric field of the organ of Corti constructed by the cable equations. Using this model, the role of different factors on the sharpness of the cochlear potential tuning curve is discussed, and the effects of different frequencies on the cochlear MET channel current as well as the stereocilia shear force are analyzed. The following conclusions were obtained:
The cochlear potential has a wide tuning curve, and the resistance between different cables can have a significant impact on the sharpness of the tuning curve. This means that tissues such as vascular striations also play a crucial regulatory role in transporting ions to the tuning curve.
The transduction current shows a non-linear decreasing trend with the position of the BM, mainly due to the decrease in voltage between scala media and OHCs and changes in the hair bundle structure. The decrease in hair bundle stiffness will reduce the deflection angle of the hair bundle, thereby controlling the decrease in MET channels current and ultimately causing a decrease in potential. The increase in displacement of the BM will cause the MET channel to gradually saturate.
Due to the voltage and conductivity at the base of the cochlea, a larger current is generated, ultimately causing the coordinate of the maximum potential at the base of the cochlea to shift towards the base of the cochlea.
This model can increase people’s understanding of the changes in cochlear potential during the auditory process of the cochlea. By extending the inner hair cell stereocilia to the model, we can better distinguish the contribution of OHC stereocilia and inner hair cell stereocilia to cochlear potential and the impact of hearing loss. Our research may help to more accurately diagnose the type and degree of hearing loss, thereby leading to the development of more effective treatment plans.

Author Contributions

B.L.: Formal analysis, investigation, writing—original draft; J.L.: methodology, software; W.Y.: conceptualization; C.X.: review, editing. All authors have read and agreed to the published version of the manuscript.

Funding

This work was supported by the Key Project of the National Natural Science Foundation of China (Grant No. 11932010).

Data Availability Statement

The data presented in this study is available on request from the corresponding authors, and the dataset was jointly completed by the team, so the data is not publicly available.

Conflicts of Interest

The authors declare no conflicts of interest.

References

  1. Dallos, P.; Cheatham, M.A. Production of cochlear potentials by inner and outer hair cells. J. Acoust. Soc. Am. 1976, 60, 510–512. [Google Scholar] [CrossRef] [PubMed]
  2. Furness, D.N.; Hackney, C.M.; Evans, M.G. Localisation of the mechanotransducer channels in mammalian cochlear hair cells provides clues to their gating. J. Physiol. 2010, 588, 765–772. [Google Scholar] [CrossRef] [PubMed]
  3. Robles, L.; Ruggero, M.A. Mechanics of the mammalian cochlea. Physiol. Rev. 2001, 81, 1305–1352. [Google Scholar] [CrossRef] [PubMed]
  4. Dallos, P. Cochlear amplification, outer hair cells and prestin. Curr. Opin. Neurobiol. 2008, 18, 370–376. [Google Scholar] [CrossRef] [PubMed]
  5. Gummer, A.W.; Hemmert, W.; Zenner, H.P. Resonant tectorial membrane motion in the inner ear: Its crucial role in frequency tuning. Proc. Natl. Acad. Sci. USA 1996, 93, 8727–8732. [Google Scholar] [CrossRef] [PubMed]
  6. Cheatham, M.A.; Naik, K.; Dallos, P. Using the Cochlear Microphonic as a Tool to Evaluate Cochlear Function in Mouse Models of Hearing. J. Assoc. Res. Otolaryngol. 2011, 12, 113–125. [Google Scholar] [CrossRef]
  7. Mistrik, P.; Mullaley, C.; Mammano, F.; Ashmore, J. Three-dimensional current flow in a large-scale model of the cochlea and the mechanism of amplification of sound. J. R. Soc. Interface 2009, 6, 279–291. [Google Scholar] [CrossRef]
  8. Howard, J.; Roberts, W.M.; Hudspeth, A.J. Mechanoelectrical transduction by hair cells. Annu. Rev. Biophys. Biophys. Chem. 1988, 17, 99–124. [Google Scholar] [CrossRef]
  9. Markin, V.S.; Hudspeth, A.J. Gating-Spring models of mechanoelectrical transduction by hair cell of the internal ear. Annu. Rev. Biophys. Biomol. Struct. 1995, 24, 59–83. [Google Scholar] [CrossRef]
  10. Nadrowski, B.; Martin, P.; Julicher, F. Active hair-bundle motility harnesses noise to operate near an optimum of mechanosensitivity. Proc. Natl. Acad. Sci. USA 2014, 101, 12195–12200. [Google Scholar] [CrossRef]
  11. Furness, D.N.; Zetes, D.E.; Hackney, C.M.; Steele, C.R. Kinematic analysis of shear displacement as a means for operating mechanotransduction channels in the contact region between adjacent stereocilia of mammalian cochlear hair cells. Proc. R. Soc. B-Biol. Sci. 1997, 264, 45–51. [Google Scholar] [CrossRef] [PubMed]
  12. Zetes, D.E.; Steele, C.R. Fluid-structure interaction of the stereocilia bundle in relation to mechanotransduction. J. Acoust. Soc. Am. 1997, 101, 3593–3601. [Google Scholar] [CrossRef]
  13. Matsui, T.; Nakajima, C.; Yamamoto, Y.; Andoh, M.; Iida, K.; Murakoshi, M.; Kumano, S.; Wada, H. Analysis of the dynamic behavior of the inner hair cell stereocilia by the finite element method. JSME Int. J. Ser. C-Mech. Syst. Mach. Elem. Manuf. 2006, 49, 828–836. [Google Scholar] [CrossRef]
  14. Davis, H. A model for transducer action in the cochlea. Cold Spring Harb. Symp. Quant. Biol. 1965, 30, 181–190. [Google Scholar] [CrossRef] [PubMed]
  15. Strelioff, D. A computer simulation of the generation and distribution of cochlear potentials. J. Acoust. Soc. Am. 1973, 54, 620–629. [Google Scholar] [CrossRef] [PubMed]
  16. Ramamoorthy, S.; Deo, N.V.; Grosh, K. A mechano-electro-acoustical model for the cochlea: Response to acoustic stimuli. J. Acoust. Soc. Am. 2007, 121, 2758–2773. [Google Scholar] [CrossRef]
  17. Mayon Ku, E. Modelling the human cochlea. J. Acoust. Soc. Am. 2009, 126, 3373. [Google Scholar] [CrossRef]
  18. Ayat, M.; Teal, P.D.; McGuinness, M. An integrated electromechanical model for the cochlear microphonic. Biocybern. Biomed. Eng. 2014, 34, 206–219. [Google Scholar] [CrossRef]
  19. Teal, P.D.; Ni, G. Finite element modelling of cochlear electrical coupling. J. Acoust. Soc. Am. 2016, 140, 2769–2779. [Google Scholar] [CrossRef]
  20. Lamb, J.S.; Chadwick, R.S. Phase of Shear Vibrations within Cochlear Partition Leads to Activation of the Cochlear Amplifier. PloS ONE 2014, 9, 85969. [Google Scholar] [CrossRef]
  21. Dong, W.; Olson, E.S. Detection of Cochlear Amplification and Its Activation. Biophys. J. 2013, 105, 1067–1078. [Google Scholar] [CrossRef] [PubMed]
  22. Oghalai, J.S. The cochlear amplifier: Augmentation of the traveling wave within the inner ear. Curr. Opin. Otolaryngol. Head Neck Surg. 2004, 12, 431–438. [Google Scholar] [CrossRef] [PubMed]
  23. Kennedy, H.J.; Crawford, A.C.; Fettiplace, R. Force generation by mammalian hair bundles supports a role in cochlear amplification. Nature 2005, 433, 880–883. [Google Scholar] [CrossRef] [PubMed]
  24. Nam, J.-H.; Fettiplace, R. A Cochlear Partition Model Incorporating Realistic Electrical and Mechanical Parameters for Outer Hair Cells. In Proceedings of the AIP Conference Proceedings, Williamstown, MA, USA, 16–22 July 2011. [Google Scholar]
  25. Watts, L. Cochlear Mechanics: Analysis and Analog VLSI. Ph.D thesis, California Institute of Technology, Pasadena, CA, USA, 1993.
  26. He, D.Z.Z.; Jia, S.; Dallos, P. Mechanoelectrical transduction of adult outer hair cells studied in a gerbil hemicochlea. Nature 2004, 429, 766–770. [Google Scholar] [CrossRef] [PubMed]
  27. Ma, J.; Yao, W.; Hu, B. Simulation of the Multiphysical Coupling Behavior of Active Hearing Mechanism within Spiral Cochlea. J. Biomech. Eng. 2020, 142, 091005. [Google Scholar] [CrossRef]
  28. Dallos, P. Some electrical circuit properties of the organ of Corti. II. Analysis including reactive elements. Hear. Res. 1984, 14, 281–291. [Google Scholar] [CrossRef]
  29. Fernández, C.; Butler, R.; Konishi, T.; Honrubia, V.; Tasaki, I. Cochlear Potentials in the Rhesus and Squirrel Monkey. J. Acoust. Soc. Am. 1962, 34, 1411–1417. [Google Scholar] [CrossRef]
  30. Fridberger, A.; de Monvel, J.B.; Zheng, J.; Hu, N.; Zou, Y.; Ren, T.; Nuttall, A. Organ of Corti Potentials and the Motion of the Basilar Membrane. J. Neurosci. 2004, 24, 10057–10063. [Google Scholar] [CrossRef]
  31. Honrubia, V.; Ward, P.H. Longitudinal Distribution of the Cochlear Microphonics inside the Cochlear Duct (Guinea Pig). J. Acoust. Soc. Am. 1968, 44, 951–958. [Google Scholar] [CrossRef]
  32. Tinevez, J.Y.; Jülicher, F.; Martin, P. Unifying the Various Incarnations of Active Hair-Bundle Motility by the Vertebrate Hair Cell. Biophys. J. 2007, 93, 4053–4067. [Google Scholar] [CrossRef]
  33. Saunders, T.J.C. Actin filaments, stereocilia, and hair cells of the bird cochlea. I. Length, number, width, and distribution of stereocilia of each hair cell are related to the position of the hair cell on the cochlea. J. Cell Biol. 1983, 96, 807–821. [Google Scholar]
  34. Patuzzi, B.R. A model of the generation of the cochlear microphonic with nonlinear hair cell transduction and nonlinear basilar membrane mechanics. Hear. Res. 1987, 30, 73–82. [Google Scholar] [CrossRef] [PubMed]
  35. Ayat, M.; Teal, P.D.; Searchfield, G.D.; Razali, N. Cochlear microphonic broad tuning curves. In Proceedings of the AIP Conference Proceedings, Cape Sounio, Greece, 23–29 June 2014. [Google Scholar]
Figure 1. The dynamic sound perception process of the macro-micro structures of the cochlea.
Mathematics 12 02470 g001
Figure 2. The cross-section schematic diagram of the organ of Corti.
Mathematics 12 02470 g002
Figure 3. Electric circuit of the cochlear cavity cross-section [16].
Mathematics 12 02470 g003
Figure 4. Excitation and response of the model: (a) The amplitude of BM displacement; (b) The amplitude of scala media potential.
Mathematics 12 02470 g004
Figure 5. Comparison between this model results and experiments. The figure shows the CM potential of this model and the maximum voltage of the CM response in the cochlea of rhesus monkeys.
Mathematics 12 02470 g005
Figure 6. (a) The probability of MET channels opening; (b) Conducted current at different positions; (c) Variation of conduction current with opening probability of MET channels.
Mathematics 12 02470 g006
Figure 7. The variation of MET channels current with the position of BM: (a) 1 nm; (b) 30 nm.
Mathematics 12 02470 g007
Figure 8. (a) The influence of longitudinal resistance amplification factor A1 on the spatial tuning curve of CM; (b) The effect of the scaling amplification factor A2 of the resistance between cables on the CM spatial tuning curve.
Mathematics 12 02470 g008
Figure 9. The CM spatial tuning curve under 1600 Hz excitation, A3 is the stereocilia stiffness magnification.
Mathematics 12 02470 g009
Table 1. Mechanical properties of Corti microstructure.
ParametersParametric DescriptionValue
bBM width100 nm~400 nm
L 0 The distance from the second OHC to the cochlear axisBM width/2
L p c Width of the arcuate structureBM width/3
θIncluded angle of the arcuate structure60 deg
βThe angle between OHC and the z axis60 deg
αThe angle between the stereocilia and the z axis25 deg~45 deg
L h b Stereocilium length1 µm
f g s Single-channel horizontal gating force3 pN
γGeometric magnification factor 0.2 ~ 0.1
TAbsolute ambient temperature300 K
k B Boltzmann constant 1.38 · 10 23 J/K
Table 2. Electrical properties for the model.
ParametersParametric DescriptionValue
r s v Resistance of scala vestibuli cable 0.2   M Ω / m ~ 0.1 MΩ/m
r s m Resistance of scala media cable 0.4   M Ω / m ~ 0.2 MΩ/m
r s t Resistance of scala tympani cable 200   Ω / m ~ 100 Ω/m
R v m Resistivity between scala vestibuli cable and scala media cable5 Ωm
R v g Resistivity between scala vestibuli cable to ground10 Ωm
R t g Resistivity between scala tympani cable to ground10 Ωm
1 / R a Resistance at the top of the OHC100 µS/m
C a Capacitance at the top of the OHC50 nF/m
1 / R m Resistance at the bottom of the OHC5100 µS/m~360 µS/m
C m Capacitance at the bottom of the OHC1800 nF/m~4200 nF/m
ε m Mechanical electrical coupling coefficient−1.04·(10−5 + x·10−6) N/m/mV
G h b max Stereocilia saturated conductance72exp(−13.5x) nS
Disclaimer/Publisher’s Note: The statements, opinions and data contained in all publications are solely those of the individual author(s) and contributor(s) and not of MDPI and/or the editor(s). MDPI and/or the editor(s) disclaim responsibility for any injury to people or property resulting from any ideas, methods, instructions or products referred to in the content.

