Abstract
In this paper, we present research results that extend and supplement our article recently published by MDPI. We derive the closed-form relations among the queue-length probabilities observed in the pre-arrival, random, and post-departure epochs for a complex, bulk-service, multi-server queueing system GI/M/c.
MSC:
60-08; 60J27; 90-10
1. Introduction
Bulk-service queueing systems are widely used in numerous real-life situations. Examples include shuttle bus services, freight trains, express elevators, tour operators, and batch servicing in manufacturing processes. Queueing systems with multiple servers constitute a vital category of queueing processes, providing extensive practical applications across various fields. These systems are characterized by their ability to serve a group (or a batch) of customers simultaneously using multiple servers. One example of this process is performance analysis of blood testing procedures for detecting viruses like HIV, HBV, HCV, and COVID-19, where the expected outcomes are either positive or negative. In these procedures, blood samples from multiple individuals are combined and tested together. If the test result is negative, all the individuals in the pool are considered clear. However, if the result is positive, each member of the pool is subsequently tested individually [1]. A multi-server bulk-service queue with bounded batch sizes of “a” and “b” and an arbitrary inter-arrival time distribution would be an appropriate model for such pandemic situations. Here, we use a standard notation, GI/M/c, developed primarily by Kendall [2], to describe this queueing process. In general, the queue model notation consists of four sections, such as where A indicates the pattern of arrivals to the system, B the pattern of service times, C the number of parallel service channels, and D the system capacity (which we omit if no restriction is imposed, . X and Y (which we omit if the group size is fixed at 1) represent the patterns of the arrival group size and the service group size, respectively. Common symbols for A and B are GI (or G), M, Ek, and D, representing the probability distributions. The symbol GI (or G) represents an arbitrary distribution, M is used for a Markovian or exponential distribution, Ek for the type-k Erlang distribution, and D for a deterministic distribution. For a more detailed description of a multi-server bulk-service GI/M/c queue, see the next page.
Compared to well-established single-server queueing systems, multi-server queueing systems are more complex and challenging to manage, particularly when the inter-arrival time distributions are arbitrary. The introduction of quorum “a” further increases the complexity of the model. Chaudhry and Gai [3] investigated a GI/M/c queueing system using a two-dimensional embedded Markov chain. They derived the queue-length distributions in three different epochs: the pre-arrival epoch (p.a.e.), a random epoch (r.e.), and the post-departure epoch (p.d.e.). However, the relations among these probabilities in different epochs were not addressed. These relations are important in queueing theory because they offer deeper theoretical insights into the behavior of stochastic processes and a comprehensive understanding of the system. Additionally, they simplify the calculations of key performance metrics such as the average waiting time, queue length, and system utilization.
This paper investigates the relations among the queue-length probabilities in the pre-arrival, random, and post-departure epochs in a GI/M/c queue, considering both busy and idle system states of the servers. Similar results have been studied for simpler queueing systems, by Takacs [4] for a multi-server, single-service queue GI/M/c and by Chaudhry and Madill [5] for a single-server, multi-service queue GI/M/1. The relations established in this study generalize the above works. By selecting specific values for the parameters , and c, as well as the inter-arrival time distributions, these relations can also be applied to simpler models that are special cases of GI/M/c. These include models such as M/Ma/1 [6], GI/Mb/c [7], M/M/c [8], and E/M/c [9], for which such relations have not previously been available.
2. Model Description
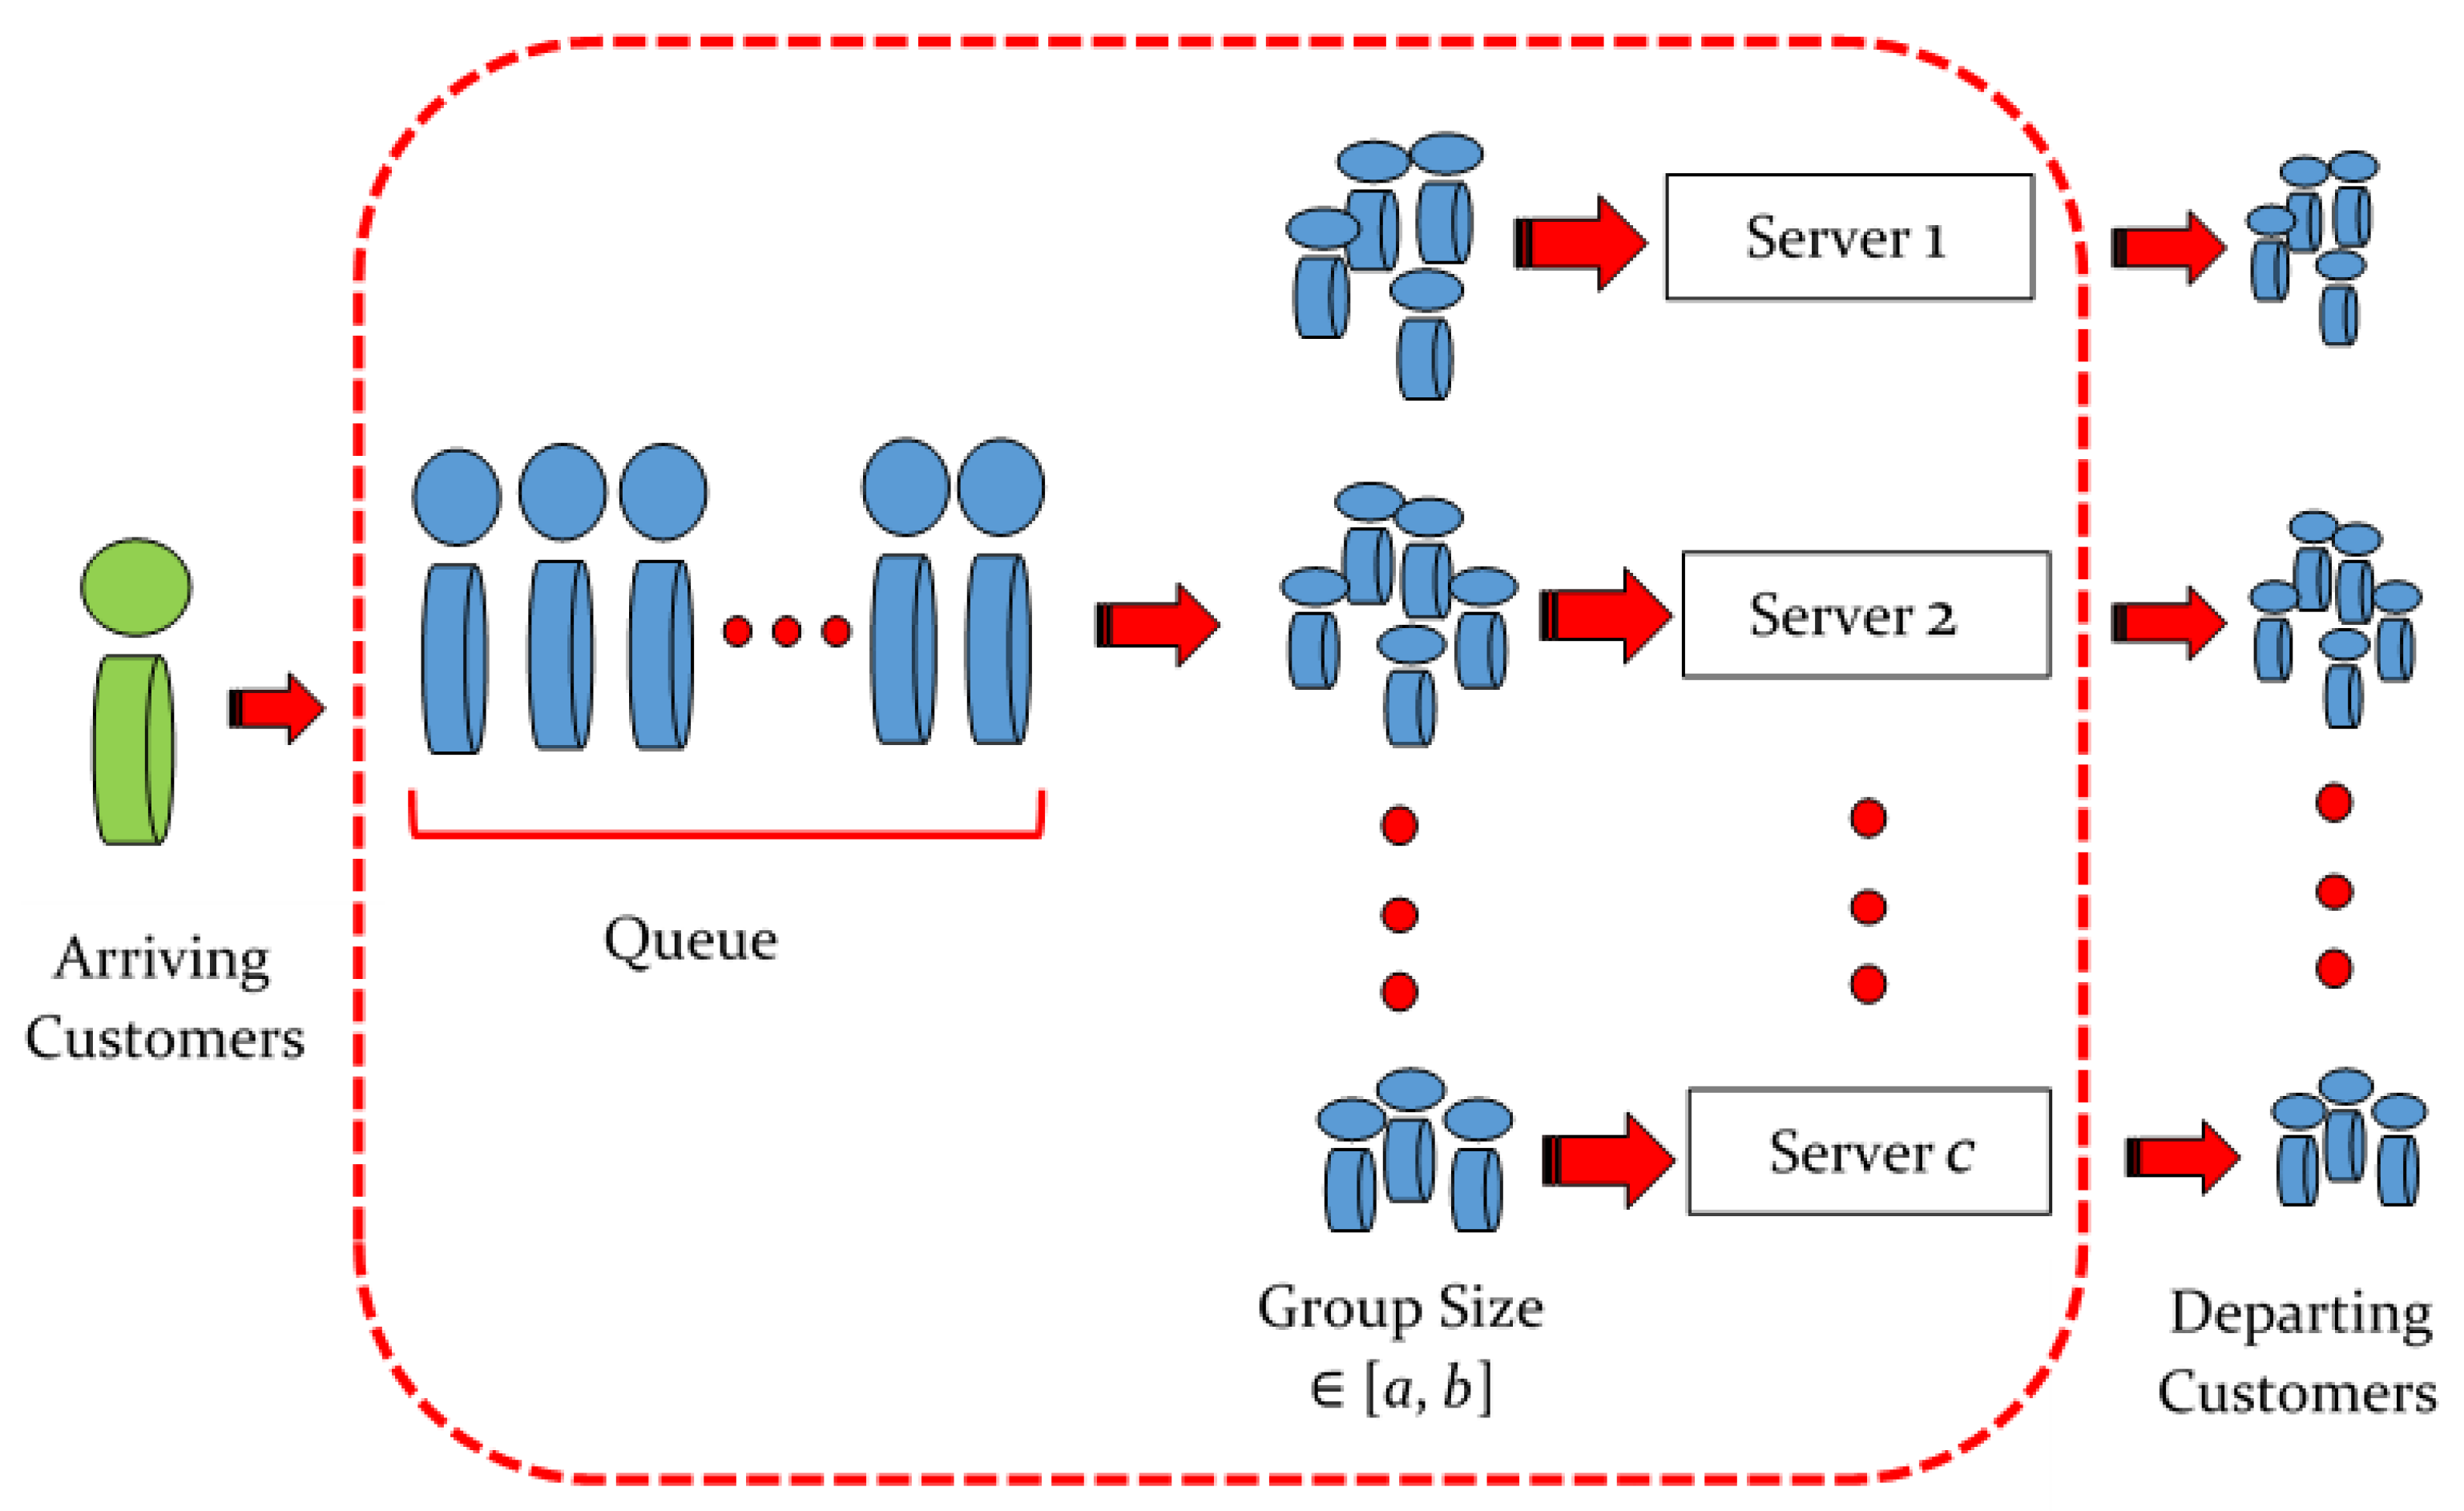
This continuous-time queueing system GI/M/c (see Figure 1) has c independent servers, each of which can serve up to b customers simultaneously. The service times are independently and identically distributed random variables with exponential distributions with a mean of . If a server completes a service and finds fewer than ”a” customers in the queue, it will remain idle until quorum ”a” is reached. Customers arrive individually at a rate of according to a renewal process with an arbitrary inter-arrival time distribution . The system is considered to be in a steady state with a traffic intensity , using first-come, first-serve (FCFS) queue discipline by batch.

Figure 1.
GI/M/c queueing model.
The states that occur immediately before arrivals form an embedded Markov chain (E.M.C.). The state seen by an arriving customer can be described by , where represents the queue length, and is a supplementary flag defined as follows:
We define the system as busy if all the servers are occupied () and idle when at least one server is free (, where denotes the number of idle servers). The queue length n can be expressed as , and q is the greatest integer less than or equal to n/b. This represents the number of full-size batches (with a batch size b) waiting in the queue for service.
3. Relations among Queue-Length Probabilities at the p.a.e., r.e., and p.d.e.
We define , , and as the busy-server probability where the queue length is n in the p.a.e., r.e., and p.d.e., respectively. Similarly, we define , , and as the idle-server probability of the queue length in the p.a.e., r.e., and p.d.e., respectively, where k is the number of idle servers, and n is the queue length, . In this section, we derive the relations among these probabilities.
3.1. The Idle-Server System
We use the level-crossing technique to establish the relations among the queue-length probabilities in the p.a.e., r.e., and p.d.e. when the system is idle (at least one of c servers is idle). The level-crossing technique is an essential method used in queueing theory to derive the steady-state queue-length distribution. At certain ”levels”, in a steady-state system, the rate at which the customers move upward must equal the rate at which they move downward. This balance helps in establishing relations between various states of the system. For more details, refer to Brill [10].
Let be the rate of transitions in the stable state where k servers are idle and be the rate where k servers are busy, . The rate of crossing upward, to and through any level, k, must be equal to the rate of downward crossing, such that
The rate of transition upward from level k (k idle servers) to and through level ( servers are idle, so servers are busy) is
Meanwhile, the rate at which one of busy servers ends the service is given by the product of the effective service rate and the probability that a server is idle after a service completion,
Since this transition requires that at least one of the c servers is busy (implying a real departure will occur), the effective service rate can be evaluated by . Combining Equations (2)–(4), we have the following relations containing the queue-length probabilities in the p.a.e., r.e., and p.d.e.
It is assumed that no time elapses between the completion of one service and the start of a new service by a server. The p.d.e. occurs immediately after a server has either reduced the queue or has become idle. We define , , and , , as the probabilities that there are n customers in the queue, k of c servers are idle, and all servers are busy before a real departure occurs, respectively. Using the following Equations (6) and (7) which were proven in [3],
and
we have
Plugging Equation (8) into Equation (5), we have the following relation between the probabilities of the queue length in the p.a.e. and r.e.:
Remark 1.
The relations of in terms of can be found in Corollary 1 from [3].
- Special cases:
- GI/M/c:Setting , Equations (5) and (8) can be simplified into
If quorum , the number of customers waiting in the queue must be zero when the system is idle. We define , and as the probabilities of having n customers in the system (including those in service and in the queue) in the pre-arrival, random, and post-departure epochs, respectively. Let : we have the following equivalent form of Equation (10) showing the number of customers in the system:
where implies the probability that at least one server is busy in the random epoch. The relation in Equation (11) matches the results presented in [4].
- GI/M/1:Set and (if , the server must be busy. This case will be discussed in the next subsection.). Using the result of (see [3]) and the fact ofEquation (11) can be further simplified into
3.2. The Busy-Server System
We define as the conditional probability that m batches complete service in a random period of time with duration t since the last p.a.e. given that all c servers are busy at the start of the period (p.a.e.) and remain busy at the end of the period (r.e.). From renewal theory, the probability associated with the random period of time R is given by , where is the inter-arrival time distribution. The number of batches served in time t is distributed as a Poisson process with a rate of :
Then, the probabilities of the queue length in the r.e. can be evaluated in terms of the probabilities in the p.a.e.,
and
The right-hand side of Equation (15) can be simplified as follows using Equation (14) and Theorem 1 from [3], which states , where w is a real root inside the unit circle of the equation and is a normalizing constant:
where is the Laplace–Stieltjes transform (L.–S.T.) of . It was proven in [3] that Therefore, we have the following relation between the queue length in the r.e. and p.a.e.:
Next, we derive the relation between the probabilities of the queue length in the r.e. and p.d.e. Since the post-departure epoch occurs immediately after the server has completed service, the probabilities of the queue length in the p.d.e. can be predicted based on the distribution of the probabilities for the system in the pre-service completion epoch (p.s.e.), the instant in time immediately before real service completion takes place. The following relations then apply:
Combining the results from Equations (6) and (7), we have the following relations between the probabilities of the queue length between the r.e. and p.d.e.:
- Special cases:
In both GI/M/c and GI/M/1 systems, , the relations presented in (17) and (19) can be further simplified as
The equivalent form of Equation (20) showing the number of customers in the system is
where , were defined in Equation (11).
For GI/M/1, we can replace with (see Equation (12)); then, we have
For GI/M/1, set , and Equations (17) and (19) match the results obtained in [5] for a busy system state of the servers.
Remark 2.
- Using Equation (11) and (21),This result matches Equation (26) in [4], page 153.
- Combining Equations (11) and (21), we have the relations among , , and for the GI/M/c queue for both busy and idle servers:This result matches those obtained in [4].
4. Discussion
The queue-length probability distributions in different epochs offer unique metrics that contribute to a detailed performance profile. We may wish to use any or all of them for a particular purpose. For instance, an arriving customer in the p.a.e. may be mainly interested in congestion trends and in the corresponding waiting-time distribution, while a departing customer in the p.d.e. may be interested in the service efficiency and system utilization. A management decision could occur in any of the epochs. Finding the relations among different epochs in queueing theory is important for performance analysis, predictive modelling, system stability, resource allocation, customer satisfaction, theoretical insights, and practical applications.
A GI/M/c queueing system is new to the queueing literature, and there is still much to be explored. Due to its complexity and the arbitrariness of the inter-arrival time, some of the results that we have obtained for the probability distributions of the queue length [3], particularly related to the waiting time, are too complex to use. Typically, approximations are applied to manage such situations. The relations that we explored in the previous section are essential for deriving simpler and closed-form formulas for various performance metrics. This is our original intention of this research, and some important progress on this subject has been achieved by using these relations.
One application of these relations is to predict the expected waiting time using Little’s formula. Little’s formula, , and its generalizations have been studied by many researchers. In this formula, represents the expected queue length in the r.e., the waiting time expected by an arriving customer in the p.a.e., and the arrival rate. An algorithm for efficiently and accurately determining the probability distribution of the queue length in the p.a.e., , was well established in [3]. By using the relations presented in Equation (17) and Corollary 1 in [3], the probability distribution of the queue length in the r.e., P, can be obtained. From this, the expected value of the queue length, , can be calculated. Finally, using Little’s formula, the expected waiting time, , can be determined.
We are also very interested in applying this queueing model to blood testing procedures. Various queueing models have been applied to analyzing the blood testing procedures for virus detection. A comprehensive review in this field can be found in [1]. Bar-Lev et al. [1] addressed this issue using an M /M/c queueing model with impatient customers, but their group testing size ”b” was restricted to 2, and the inter-arrival time was restricted to an exponential distribution. Tamrakar and Banerjee [11] explored the MX/G/1 queue with optional service- and queue-length-dependent single (or multiple) vacation, but it was confined to a single-server system. These models may not be well suited to extensive scenarios, such as large influenza pandemics like COVID-19. In our study, the GI/M/c model demonstrates versatility by accommodating an arbitrary inter-arrival time distribution with multiple parallel working servers. This makes our model better suited to handling such situations. However, this model needs to be adjusted to handle longer waiting times, as aging or expired samples must be discarded (leaving the system) before they enter the service process. This will be the focus of one of our future works to enhance the model’s suitability for real-world scenarios.
5. Conclusions
We successfully investigated the relations among the queue-length probabilities in the pre-arrival, random, and post-departure epochs in a GI/M/c queue, considering both busy and idle system states of the servers. The relations established in this study extend and generalize those presented in previous works, such as GI/M/c, GI/M/1, and GI/M/1. Additionally, these relations can be applied to simpler models that are included as special cases of GI/M/c, such as M/Ma/1, GI/Mb/1, GI/M/1, GI/Mb/c, M/M/c, and E/M/c, where such relations are partially or completely unestablished. As a computational check, the numerical results obtained for a GI/M/c queue in [3] satisfy all the relations we established in this paper.
Author Contributions
Conceptualization, methodology, funding acquisition, J.G. and M.C.; software, validation, formal analysis, derivations, writing, J.G. All authors have read and agreed to the published version of the manuscript.
Funding
This research was supported by the Royal Military College of Canada Professional Development Allocation.
Data Availability Statement
No new data were created or analyzed in this study. Data sharing is not applicable to this article.
Conflicts of Interest
The authors declare no conflicts of interest.
References
- Bar-Lev, S.K.; Boxma, O.; Kleiner, I.; Perry, D.; Stadje, W. Recycled Incomplete identification procedures for blood screening. Eur. J. Oper. Res. 2017, 259, 330–343. [Google Scholar] [CrossRef]
- Kendall, D.G. Stochastic processes occurring in the theory of queues and their analysis by the method of imbedded Markov chains. Ann. Math. Stat. 1953, 24, 338–354. [Google Scholar] [CrossRef]
- Chaudhry, M.; Gai, J. Analytic and Computational Analysis of GI/Ma,b/c Queueing System. Mathematics 2022, 10, 3445. [Google Scholar] [CrossRef]
- Takacs, L. Introduction to the Theory of Queues; Oxford University Press: New York, NY, USA, 1962. [Google Scholar]
- Chaudhry, M.; Madill, B. Probabilities and some measures of efficiency in the queueing system GI/Ma,b/1. Sel. Stat. Can. 1987, 7, 53–75. [Google Scholar]
- Gross, D.; Shortle, J.; Thompson, J.; Harris, C. Fundamentals of Queueing Theory; John Wiley and Sons: Hoboken, NJ, USA, 2008. [Google Scholar]
- Shyu, K. On the queueing processes in the system GI/M/n with bulk service. Acta Math. Sin. 1960, 10, 182–189. [Google Scholar]
- Sim, S.; Templeton, J. Steady state results for the M/Ma,b/c batch-service system. Eur. J. Oper. Res. 1985, 21, 260–267. [Google Scholar] [CrossRef]
- Sim, S. On Multi-Vehicle Transportation Systems with Queue-Dependent Dispatching Policies. Ph.D. Thesis, University of Toronto, Toronto, ON, Canada, 1982. [Google Scholar]
- Brill, P.H. Level Crossing Methods. In Encyclopedia of Operations Research and Management Science; Springer: Boston, MA, USA, 2013. [Google Scholar]
- Tamrakar, G.K.; Banerjee, A. On Steady state analysis of an infinite capacity Mx/Ma,y/1 queue with optional service and queue length dependent single (multiple) vacation. Queueing Model. Serv. Manag. 2022, 6, 27–61. [Google Scholar]
Disclaimer/Publisher’s Note: The statements, opinions and data contained in all publications are solely those of the individual author(s) and contributor(s) and not of MDPI and/or the editor(s). MDPI and/or the editor(s) disclaim responsibility for any injury to people or property resulting from any ideas, methods, instructions or products referred to in the content. |
© 2024 by the authors. Licensee MDPI, Basel, Switzerland. This article is an open access article distributed under the terms and conditions of the Creative Commons Attribution (CC BY) license (https://creativecommons.org/licenses/by/4.0/).