Article

Approximate Closed-Form Solutions for Pricing Zero-Coupon Bonds in the Zero Lower Bound Framework

by
Jae-Yun Jun
* and
Yves Rakotondratsimba
LyRIDS, ECE Paris, Graduate School of Engineering, 10 Rue Sextius Michel, 75015 Paris, France
*
Author to whom correspondence should be addressed.
Deceased.
Mathematics 2024, 12(17), 2690; https://doi.org/10.3390/math12172690
Submission received: 31 July 2024 / Revised: 23 August 2024 / Accepted: 25 August 2024 / Published: 29 August 2024
(This article belongs to the Special Issue Optimization Methods in Engineering Mathematics)

Abstract

:
After the 2007 financial crisis, many central banks adopted policies to lower their interest rates; the dynamics of these rates cannot be captured using classical models. Recently, Meucci and Loregian proposed an approach to estimate nonnegative interest rates using the inverse-call transformation. Despite the fact that their work is distinguished from others in the literature by their consideration of practical aspects, some technical difficulties still remain, such as the lack of analytic expression for the zero-coupon bond (ZCB) price. In this work, we propose novel approximate closed-form solutions for the ZCB price in the zero lower bound (ZLB) framework, when the underlying shadow rate is assumed to follow the classical one-factor Vasicek model. Then, a filtering procedure is performed using the Unscented Kalman Filter (UKF) to estimate the unobservable state variable (the shadow rate), and the model calibration is proceeded by estimating the model parameters using the Particle Swarm Optimization (PSO) algorithm. Further, empirical illustrations are given and discussed using (as input data) the interest rates of the AAA-rated bonds compiled by the European Central Bank ranging from 6 September 2004 to 21 June 2012 (a period that concerns the ZLB framework). Our approximate closed-form solution is able to show a good match between the actual and estimated yield-rate values for short and medium time-to-maturity values, whereas, for long time-to-maturity values, it is able to estimate the trend of the yield rates.
MSC:
68W50; 90C59; 91-08; 91-10; 91B70; 91G30; 91G60

1. Introduction

After the 2007 financial crisis, several central banks (the US Federal Reserve System, the European Central Bank and the Bank of England) adopted policies that pushed their interest rates to unprecedentedly low levels for an extended period of time. Further, the European sovereign debt crisis in 2011 led central banks to even develop the negative interest rate policy (NIRP) to increase the economic growth and the inflation, despite the fact that some financial markets arguably view the NIRP as a desperate and damaging move causing financial and economic instabilities.
On the other hand, the classical models are not suitable to describe the behavior of negative interest rates. Given the economic uncertainty caused by the NIRP with its unclear impact on the economic growth and on the inflation, for the moment it seems to be more logical to first understand the zero lower bound (ZLB) framework alone rather than including the NIRP in our analyses yet, where the ZLB is a macroeconomic problem for which the short-term nominal interest rate is at or near zero. Hence, finding models that can reliably explain the implication of low interest rates for an extended period of time is desired. However, the classical models such as the Gaussian models [1] fail to model the ZLB framework because these models can return negative interest-rate values, an aspect that is not desirable for the ZLB framework. In order to overcome this problem, other approaches such as the Gaussian quadratic models [2] and the stochastic volatility models with square-root processes (e.g., Cox-Ingersoll-Ross (CIR)) [3,4] could be used. However, these models are not suitable for interest rates that remain constant for a long period of time, as for these models the probability of having a constant interest rate is zero. Further, the CIR model [3] has a problem that it can be stuck to zero interest rate value without being able to return to other positive values.
In contrast, in the literature, there exist models that are consistent to the ZLB framework. These are the interest rate models based on the usage of the short rate, which is defined in turn as the maximum value between zero and the so-called shadow rate [5,6,7,8,9]. Hence, even though the shadow rate is modeled as a Gaussian process, the associated interest rate remains nonnegative and can hold zero-valued interest rate for a long period of time. Moreover, the interest rate is not stuck to zero value, contrary to the case of the CIR model. However, a drawback for these models is that no closed-form expression is available for the zero-coupon bond (ZCB) price.
Among the models that are based on the short rate, the work of Meucci and Loregian [10] seems to be (to the best of our knowledge) the only one that takes into account common practical issues, unlike many works that only consider the macroeconomic aspect. These practical aspects are the application of risk management and the projection of the distribution of the whole term structure of interest rates to arbitrary horizons. However, they do not provide a closed-form solution for the ZCB price but suggest a numerical technique to obtain the ZCB price from a partial differential equation. We refer to their approach as the MeLo model, because we often recall it in the sequel.
In the present work, we propose novel approximate closed-form solutions for the ZCB price in the ZLB framework, which can be immediately applicable from the practical point of view. To this end, we reconsider the MeLo model to express the ZCB price in the ZLB framework with the shadow rate assumed to follow the one-factor Vasicek model [11]. In the sequel, we call such a combination of models the MeLo-1-V (Meucci-Loregian one-factor Vasicek) model.
The Vasicek model is a well-known benchmark reference model (both in theory and practice) for which there exist closed formulae for the ZCB price and for other important basic interest rate products. Under the Vasicek model, the ZCB price depends essentially on three parameters: speed mean reversion, long mean term, and volatility.
In the present work, we propose approximate closed-form solutions for the ZCB price that are specifically applicable to the ZLB framework, exploring the fundamental theorem of asset pricing [1] with the Monte-Carlo simulation and with the Gauss-Hermite Quadrature [12]. Further, the MeLo-1-V model has only few parameters and is attractive for capturing: (1) the ZCB pricing, (2) the interest rate projection at future time horizons, (3) the price sensitivity determination, and (4) the shadow-rate estimation. Among the aforementioned four aspects, the first and fourth aspects are addressed in the present work, leaving other aspects for future work. Moreover, the proposed approach is in accordance to the pricing audit requirement, in the sense that this approach can guarantee obtaining the same results by fixing a seed for the pseudo-random number generator for the Gaussian shock used in the model.
On the other hand, as the MeLo-1-V model depends on the non-observable shadow rate, this non-observable variable is estimated using the Unscented Kalman Filter (UKF) algorithm [13] (for its ability to deal with nonlinear dynamical systems), and the MeLo-1-V model parameters are calibrated using the Particle Swarm Optimization (PSO) algorithm [14] (for its outperformance in searching for optimal parameter values).
Finally, the performance of the proposed model is evaluated using (as input data) synthetically generated interest rate data and the interest rates of AAA-rated bonds compiled by the European Central Bank ranging from 6 September 2004 to 21 June 2012 [15], which is a period that concerns the ZLB framework.
The present work is organized as follows. Section 2.1 describes the procedures for modeling interest rates by using the inverse-call transformation in a manner like in [10]. Then, the ZCB price under the Vasicek model is recalled in Section 2.2. In Section 2.3, the novel MeLo-1-V model is introduced, which includes the two approximate closed-form solutions for the ZCB price in the ZLB framework. Afterwards, the procedure for estimating the unobservable state (the shadow rate), using the UKF, and the procedure for MeLo-1-V model calibration, using the PSO, are described in Section 2.4. Further, the MeLo-1-V model performance is evaluated in Section 3. Moreover, the obtained results are discussed in Section 4, and a summary of main contributions with some remarks for future work are given in Section 5.

2. Methodology

In this section, we first recall the procedure of modeling interest rates using the inverse-call transformation and one-factor Vasicek model that characterizes the dynamics of shadow rate, with the purpose to introduce the novel MeLo-1-V model for the ZCB price in the ZLB framework. Afterwards, we introduce two approximate closed-form solutions for the ZCB price in the ZLB framework. We conclude this section by describing how to estimate the unobservable state variable (shadow rate) from the observable variable (yield rate) and by describing a procedure to calibrate the MeLo-1-V model parameters.

2.1. Modeling Interest Rates Using the Inverse-Call Transformation

2.1.1. Inverse-Call Transformation

Inspired by a Black’s work [5], Meucci and Loregian proposed in [10] the price profile of a zero-strike perpetual call option as
c s ( M e L o ) ( x ) s exp x s 1 I { x < s } + x I { s x } ,
where s is a fixed nonnegative constant which may be viewed as a time volatility (smoothing) parameter. x can be viewed as a risk driver and can take positive or negative values. I { · } is an indicator function, which indicates whether the condition that is expressed inside the curly brackets is true or false. If it is true, it returns 1 as its value, and otherwise, it returns 0 as its value. The arithmetic Brownian motion was used in this formula because of its simplicity and because, while shadow rates can become negative, the resulting price profile is always nonnegative. The relevance of (1) is in the fact that
lim s 0 c s ( M e L o ) ( x ) = max x ; 0 ,
while the mapping x ( , ) c s ( M e L o ) ( x ) ( 0 , ) defines a strictly increasing function (never being negative) and behaves like an exponential function in the left tail and like the identity function in the right tail. In a previous work of Meucci and Loregian [10], they defined the price profile of a zero-strike call option linked to the standard normal distribution as
c s ( n o r m ) ( x ) s x s Φ x s + ϕ x s = x Φ u s d u ,
where ϕ and Φ are, respectively, the probability density function and the cumulative distribution function. The two transformations
x ( , ) c s ( n o r m ) ( x ) ( 0 , )
and
x ( , ) c s ( M e L o ) ( x ) ( 0 , )
share the same increasing properties and the limit property shown in (2). Among the advantages of the transformation c s ( M e L o ) is that its inverse can be explicitly written as   
c s ( M e L o ) 1 ( y ) s 1 + ln y s I { y < s } + y I { s y } .
In contrast, an explicit expression for the inverse of the transformation c s ( n o r m ) is not available. For convenience, in the sequel, we use the notation c s to denote any suitable transformation, such as c s ( M e L o ) or c s ( n o r m ) .

2.1.2. Shadow Rates and Instantaneous Interest Rates

Inspired by the work of [10], the stochastic process r u ( · ) u 0 associated with the instantaneous interest rate may be defined from the zero-strike call option as
r u c s x u
or equivalently x u = c s 1 r u , where x u ( · ) u 0 is a universal risk driver which applies to both high rates and low rates. We use the notation of ( · ) next to variables in order to indicate that they are random variables. The instantaneous rate r u in (4) is constrained to be positive in contrast to the shadow rate x u , which can take any real number. The key point is that instead of modeling the short rate evolution to be restricted to take only positive values, which in general leads to complex models [8,16,17], it seems more natural and easier to model the shadow rate by some unrestricted process, such as the Ornstein–Uhlenbeck process [18].
In this work, we focus on the shadow rate x t ( · ) t 0 governed by the famous one-factor Vasicek model. Hence, the shadow-rate dynamics can be described using the following stochastic differential equation:
d x t ( · ) = κ θ x t d t + σ d W t ( Q ) ( · ) ,
where real numbers κ , θ , and σ represent, respectively, mean reversion factor, long run equilibrium, and volatility term. In particular, κ and σ are nonnegative constants, and W represents a Brownian motion. The shadow-rate dynamics shown in (5) is given under some risk neutral probability measure Q , which is assumed to exist.
On the other hand, by approximating the differential Equation (5) by a difference equation, d x t ( · ) can be rewritten as the difference x t + ( · ) x t , where t is the current time and is a time-step. Notice that the dot notation (e.g., y ( · ) ) is used to emphasize the uncertainty on a given quantity (e.g., y). Though it is possible to consider more general models to represent the shadow rate (such as the G2++ [1] and the AFDNS’s models [19]), the well-known Vasicek model is used in this work for its simplicity. In the sequel, we call the interest rate model defined in (4) with the shadow rate represented by the Vasicek model as the MeLo-1-V model.
Next, the ZCB price at time t for maturity T = t + τ can be defined using the fundamental theorem of asset pricing as
P ( t , t + τ ) E Q [ exp t t + τ r u ( · ) d u F t ,
where t 0 , the time to maturity τ > 0 , and the expectation is with respect to the risk-neutral probability measure Q conditioned by all information F available up to time t. In other words, P ( t , t + τ ) represents the value of a currency unit paid at maturity T as seen from t.
Despite the simplicity of the shadow-rate model (5), the computation of the ZCB price P ( t , t + τ ) can be cumbersome due to the non-linearity present in the transformation c x ; s . One way to compute the ZCB price is by using a partial differential equation (PDE) approach, as it is applied in [10]. In this work, instead of using the PDE approach, the Monte-Carlo simulation and the Gaussian quadratures are used to find approximate closed-form solutions for the ZCB price. In this way, one can obtain further insights on the results obtained from these expressions.

2.2. The ZCB Price under the Vasicek Model

In this section, the definition of the ZCB price introduced in [11] is recalled with the purpose to compare our results to those of classical models. By using the well-known Itô’s lemma to the stochastic process in (5), one has
x u ( · ) = exp κ ( u t ) x t + κ θ b u t ; κ + σ b 1 2 u t ; 2 κ Z u ( · | t ) for t < u ,
where
b u ; κ 1 κ 1 exp κ u ,
and
Z u ( · | t ) Z u ( · ; κ | t ) = b 1 2 u t ; 2 κ exp κ u t u exp κ v d W v ( Q ) ( · ) .
The random variable Z u ( · | t ) is a conditioned standard Gaussian such that
E Q [ Z u ( · | t ) F t = 0 and V Q [ Z u ( · | t ) F t = 1 .
Moreover, the time-t Vasicek ZCB price is
P ( V a s ) ( t , t + τ ) E Q [ exp t t + τ x u ( · ) d u F t ,
which depends on the shadow rate x u . Notice that, by integrating (7), one can obtain
t t + τ x u ( · ) d u = b τ ; κ x t + θ τ b τ ; κ + σ t t + τ b t + τ u ; κ d W u ( Q ) ( · ) .
This last identity shows that t t + τ x u ( · ) d u is a Gaussian random random variable. Notice also that
E Q exp X ( · ) = exp E Q X ( · ) + 1 2 V Q X ( · )
is valid for any Gaussian random variable X ( · ) . Then, one can derive the following explicit formula for the ZCB price, using (11) and (12) in (10):
P ( V a s ) ( t , t + τ ) = exp b τ ; κ x t σ 2 4 κ b 2 τ ; κ θ σ 2 2 κ 2 τ b τ ; κ .

2.3. The ZCB Price under the MeLo-1-V Model

In the previous sections, we only considered one instance of time to maturity ( τ ), but in general, the ZCB price is computed for an ensemble of time-to-maturity values such as
P ( t , t + τ 1 ) , , P ( t , t + τ m ) , , P ( t , t + τ M ) ,
where the time-to-maturity values are ascendingly ordered as
0 τ 0 < τ 1 < < τ m < < τ M ,
with M being a nonnegative integer. Without loss of generality, one can assume that all time-to-maturity values satisfy the condition  
τ m τ m 1 τ m τ m 1 , for all m , m { 1 , , M } with m < m .

2.3.1. The Monte-Carlo Price

Under the Monte-Carlo approach, the exact ZCB price P ( t , t + τ m ) is approximated as an average of J realizations of the expectation computation given in (10).
Then, an approximate closed-form solution for the ZCB price using the MeLo-1-V model can be stated as follows.
Theorem 1.
Let Θ be a vector formed by mean reversion factor (κ), long-run equilibrium (θ), volatility term (σ), and time volatility (s). Let x t for t = 0 be the initial shadow rate. Consider independent realizations ε [ j , m ] j { 1 , , J } , m { 1 , , M } of a standard Gaussian random variable, where J is the total number of realizations, and M is the total number of considered maturities. Assume also that the Legendre abscissas and weights in the Gaussian quadrature setting a i , w i i = 1 I are given, where I represents the total number of Legendre components (represented by pairs of abscissas and weights). Then, the ZCB price for the time to maturity τ m with m { 1 , , M } can be approximated as
P ( t , t + τ m ) P m ε [ j , k ] 1 j J , 1 k m ; a i , w i i = 1 I ; x t ; τ k k = 0 m ; Θ = 1 J j = 1 J F m z [ j , 1 ] , , z [ j , m ] ,
where
F m u 1 , , u m exp k = 1 m 1 2 τ k τ k 1 i = 1 I c s α i , k x t + β i , k + V i , k u k w i .
The ( J × M ) -dimensional matrix z [ j , m ] j { 1 , , J } , m { 1 , , M } is defined as
z [ j , m ] = l = 1 m η ( m , l ) ε [ j , l ] .
ε [ j , m ] j { 1 , , J } , m { 1 , , M } are independent realizations of a standard Gaussian random variable. The entry η ( m ; m ) is defined as
η m ; m = exp κ ζ i , m ζ i , m b ζ i , m ; 2 κ b 1 2 ζ i , m ; 2 κ b 1 2 ζ i , m ; 2 κ ,
where m { 1 , , M 1 } , m { m + 1 , , M } , and ( I × M ) -dimensional matrices are also defined as
ζ i , m 1 2 τ m τ m 1 1 + a i + τ m 1 , α i , m exp κ ζ i , m , β i , m κ θ b ζ i , m ; κ , V i , m σ b 1 2 ζ i , m ; 2 κ ,
with
b u ; κ 1 κ 1 exp κ u .
The proof for Theorem 1 is provided in Appendix A. On the other hand, one can expect that the integers I and J must be large enough for a thorough approximation. Hence, the efficiency for approximating the ZCB price using Theorem 1 can be poor. To remedy this problem, we present in the next section another approximate closed-form solution to efficiently estimate the ZCB price in the ZLB framework but with less accuracy.

2.3.2. The ZCB-Price Approximation Using the Gauss-Hermite Quadrature

The problem of efficiency due to the usage of the Monte-Carlo approach can be improved by approximating the integral for the computation of the expectation given in (6) using the Gauss-Hermite Quadrature instead. We formulate this statement in the following Theorem.
Theorem 2.
Let Θ be a vector formed by mean reversion factor (κ), long-run equilibrium (θ), volatility term (σ), and time volatility (s). Let x t for t = 0 be the initial shadow rate. Assume that the Legendre abscissas and weights L ( I ) a i ( L ) , w i ( L ) i = 1 I and Hermite abscissas and weights H ( J ) a j ( H ) , w j ( H ) j = 1 J are given. Let I and J represent the number of Legendre components and the number of Hermite components, respectively. Then, the ZCB price at time t with the time to maturity τ can be approximately defined as
P ( t , t + τ ) P x t ; τ ; Θ ; L ( I ) , H ( J ) = 1 π j = 1 J exp H 2 a j ( H ) ; x t ; τ ; Θ ; L ( I ) w j ( H ) ,
where
H z ; x t ; τ ; Θ ; L ( I ) τ 2 i = 1 I c s h τ 2 1 + a i ( L ) , z ; x t ; Θ w i ( L ) ,
with
h y , z ; x t ; Θ exp κ y x t + κ θ b y ; κ + σ b 1 2 y ; 2 κ z ,
c s ( x ) = c s ( M e L o ) s exp x s 1 I { x < s } + x I { s x } ,
and
b u ; κ 1 κ 1 exp κ u .
The proof for Theorem 2 is provided in Appendix B. As (21) indicates, our approximate closed-form solution for the ZCB price depends on the choice of the Legendre and Hermite abscissa weights: L ( I ) and H ( J ) . Once these integration set-ups are defined, then the (approximate) ZCB price is uniquely defined in contrast to any other Monte-Carlo approach used in the literature. The analytic expression given in (21) can be used to efficiently compute the ZCB price. In Section 3, we show that by heuristically choosing the values for I and J, we can reliably and efficiently estimate the ZCB price using the approximate closed-form solution shown in (21).

2.4. Estimation of Unobservable State Variable and Model-Parameter Calibration

The two theorems introduced in Section 2.3 make use of the MeLo-1-V model parameters (i.e., κ , θ , σ , and s), as well as the shadow rate x t , which is usually unobservable. Notice that, although the shadow rate is usually unobservable, it is commonly approximated by the available yield rate corresponding to the shortest time to maturity. In this section, we describe procedures to infer the hidden state (the shadow rate) from observations (yield rates) using the Unscented Kalman Filter (UKF) [13] and to calibrate the model parameters (i.e., Θ ) to properly estimate the hidden state and to accurately predict the observable state using the Particle Swarm Optimization (PSO) algorithm [14].

2.4.1. State-Space Model

The shadow-rate notation that we previously used ( x t ) can be viewed as a realization of the shadow-rate random variable X t ( · ) . The dynamics of the shadow rate under the risk-neutral probability Q can be described as (5), where the model parameters are Θ = ( κ , θ , σ , s ) . This probability is needed in order to make the pricing as described by the asset pricing theorem (6). In this work, dealing with the model estimation, we actually make use of the physical probability P under which the shadow rate X t ( · ) t 0 takes the form of
d X t ( · ) = κ ( P ) θ ( P ) X t d t + σ d W t ( P ) ( · ) .
Among various choices for the risk specification corresponding to the change between the two probabilities P and Q , we take the one for which the risk-neutral and physical parameters are linked as
κ ( P ) = κ + λ σ , θ ( P ) = κ θ κ + λ σ .
Therefore, a constant market price λ is used and added to the risk neutral parameters. Hence, Θ is now redefined as
Θ = ( κ , θ , σ , s , λ ) .
Moreover, we assume that Θ defined in (25) are already known. In fact, the optimal values for Θ = ( κ , θ , σ , s , λ ) are searched using the PSO algorithm, as presented in Section 2.4.4. Then, any realization of the random variable X t ( · ) is noted as x t . It is assumed that, for past times t = t k , yield rates for increasing time-to-maturity values τ 1 , , τ m , , τ M are available, where M is a nonnegative integer, which is supposed to be fixed in the sequel. The time is supposed to be indexed by integers ranging between t 1 and t, and the time step is denoted by , being 0 < . After applying Itô’s lemma to (23), it may be written that
X t ( · ) | X t 1 = x t 1 = ϕ x t 1 + β + Q 1 2 ε t ; x ( · ) ,
where
ϕ exp κ ( P ) , β κ ( P ) θ ( P ) b ; κ ( P ) and Q σ 2 b ; 2 κ ( P ) .
When setting
f ( x ) ϕ x + β ,
one has
X t ( · ) | X t 1 = x t 1 N f ( x t 1 ) , Q .
One can usually denote the density of the random variable X t ( · ) | X t 1 = x t 1 with X t = x t R as p ( x t | x t 1 ) such that
p ( x t | x t 1 ) p ( X t = x t X t 1 = x t 1 = 2 π Q 1 2 exp 1 2 Q x t f ( x t 1 ) 2 = N x t ; f ( x t 1 ) , Q .
A realization of the M-dimensional random vector Y t = Y t , 1 , , Y t , m , , Y t , M is denoted by y t such that y t y t , 1 , , y t , m , , y t , M with y t , m y ( t , t + τ m ) , where y t , m represents a yield-rate realization at time t with the maturity τ m such that
y t , m = 1 τ m ln P x t ; τ m ; Θ ; s ; L ( I ) , H ( J ) ψ τ m , x t ,
where P x t ; τ ; Θ ; s ; L ( I ) , H ( J ) is defined as in (21).
To represent the measurement error, we adopt an additive noise specification,
Y t , m ( · ) | X t = x t = ψ τ m , x t + ρ min { 1 , τ m } 1 2 ε t , m ; y ( · ) ,
for some nonnegative constant ρ . Under the probability P measure, the M-dimensional random variable (having the ε t , m ; y ( · ) s as its components) is assumed to be a multivariate-Gaussian vector with zero mean and its covariance given by the M-dimensional identity matrix. We refer to p ( y t | x t ) as the probability density function corresponding to Y t ( · ) | X t = x t at y t , such that
p ( y t | x t ) p ( Y t = y t X t = x t for y t = y t , 1 , , y t , m , , y t , M = i . i . d . m = 1 M p ( Y t , m = y t , m X t = x t = m = 1 M 2 π τ m R 1 2 exp 1 2 τ m R y t , m ψ τ m , x t 2 = 2 π R M 2 m = 1 M τ m 1 2 m = 1 M exp 1 2 τ m R y t , m ψ τ m , x t 2 = C exp 1 2 R m = 1 M 1 τ m y t , m ψ τ m , x t 2 , where C = 2 π R M 2 m = 1 M τ m 1 2 = N M y t ; ψ ( x t ) , R ,
where
ψ ( x t ) = ψ ( τ 1 , x t ) , , ψ ( τ m , x t ) , , ψ ( τ M , x t ) ,
represent the mean vector of the multivariate normal random yield vector Y t ( · ) | X t = x t and R denotes the M-dimensional diagonal covariance matrix of the multivariate normal random yield vector Y t ( · ) | X t = x t , with its diagonal terms being
ρ 2 min { τ 1 , 1 } , , ρ 2 min { τ m , 1 } , , ρ 2 min { τ M , 1 } .
It may be noted that
Y t ( · ) | X t = x t = ψ x t + R 1 2 ε t , y ( · ) ,
where ε t , y ( · ) is a multivariate normal random vector with zero mean and identity covariance matrix.
The expressions given in this section can be summarized by the following system of state-space equations:
X t ( · ) = f X t 1 ( · ) ; Θ + Q t ( · ) , Y t ( · ) = ψ X t ( · ) ; Θ + R t ( · ) ,
where X t and Y t are stochastic processes that take their values in R and R M , respectively. The functions f and ψ are defined, respectively, in (28) and (31). The uncertainties in the state and observation models are approximated using additive random variables such as Q t ( · ) N 0 , Q ( Θ ) and R t ( · ) N 0 , R ( Θ ) , where the parameter vector Θ is defined as in (25). The initial hidden state (i.e., the shadow rate) is generated, assuming that it is of the form X 0 ( · ) N m 0 ( Θ ) , P 0 ( Θ ) , for some m 0 R and P 0 R . In this study, we aim to estimate the hidden state variable x t (i.e., the shadow rate) from some given noisy observations y t (i.e., the yield rate). This is achieved by making use of state-space Equation (33), assuming implicitly that the model parameters are already known. In fact, the optimal values for Θ = ( κ , θ , σ , s , λ ) are searched using the PSO algorithm, as presented in Section 2.4.4. This means in turn that we first need to calibrate the model, and this procedure is explained in the subsequent sections.

2.4.2. Maximum-Likelihood Estimation (MLE)

The Maximum-likelihood estimation (MLE) is a method to find the parameters of a statistical model by maximizing the likelihood function. The likelihood function can be seen as the probability of the model parameters for some known observation data. When the prior probability of the parameters is assumed to be of uniform distribution, then the maximization problem of the probability of the model parameters for some given observation data becomes equivalent to the maximization problem of the probability of the observation variable for some given the model parameter values (by the Bayes’ theorem). On the other hand, for this sort of problem, it is preferable to work in the logarithmic scale (instead of the linear scale) because the likelihood function implies the product of probabilities (through the definition of the total probability), and, as the number of observation samples grows, the resulting probability might become extremely small. This can lead to a serious problem depending on the resolution and the rounding error of the working station. A common practice to overcome this sort of problem is to work in a logarithmic scale instead. The resulting function is known as the logarithmic likelihood function or log-likelihood function ( ( Θ ) ), and, assuming that the distribution of the observation process is Gaussian and that the observation data are independent and identically distributed (i.i.d.), it can be defined as
( Θ ) = log p y 1 : T | Θ = i . i . d . log t = 1 T p ( y t | Θ ) = 1 2 t = 1 T log 2 π | S t | 1 2 t = 1 T y t μ t S t 1 y t μ t ,
where μ t = E y ^ x t ; Θ and S t = E y ^ x t ; Θ μ t y ^ x t ; Θ μ t are the expectation and covariance of the predicted observation variable at time t (i.e., y ^ x t ; Θ ), respectively. | S t | is the determinant of the covariance matrix S t .
Notice that maximizing the log-likelihood function is equivalent to minimizing the negative log-likelihood function as shown in (35):
max Θ ( Θ ) = min Θ ( Θ ) = min Θ 1 2 t = 1 T log 2 π | S t | + 1 2 t = 1 T y t μ t S t 1 y t μ t .
From (35), one can see that (when the Gaussian distribution is assumed for the observation process) maximizing the log-likelihood function is in turn equivalent to minimizing the difference between the actual measurement and the observation estimation over all samples.
Consequently, we are interested in finding the model parameters that minimize the difference between the measurement and the estimated measurement over all samples. For this task, we need two additional procedures. The first one is to estimate the μ t and S t . This can be achieved by using the Unscented Kalman Filter (UKF) approach [13]. The second one is the actual log-likelihood maximization procedure (equivalently, the negative log-likelihood minimization procedure). This optimization problem is solved in this work using the Particle Swarm Optimization (PSO) algorithm [14].

2.4.3. Unscented Kalman Filter (UKF)

As explained in Section 2.4.2, we need to estimate the expectation of the observation ( μ t ) and the covariance of the observation ( S t ) in order to search for the model parameters that maximize the log-likelihood function (34). The computation of these expectations suppose the knowledge of the probabilistic distribution of the hidden state variable (the shadow rate). But this distribution is unknown a priori, and therefore one should estimate it as well. This distribution is commonly called as the target probabilistic distribution function and may be searched by establishing a nonlinear relationship to a known proposal probabilistic distribution function.
The unscented Kalman filter (UKF) [13] allows one to statistically establish such a nonlinear relationship from the Gaussian proposal distribution with some chosen initial mean m 0 and covariance P 0 for the hidden state process.
Afterwards, for each observation sample, one builds the sigma points from the estimated mean ( m t 1 ) and the estimated covariance matrix ( P t 1 ) of the hidden state obtained in the previous iteration,
χ t 1 m t 1 , m t 1 + γ P t 1 , m t 1 γ P t 1 .
Then, predicted sigma points are obtained by passing the built sigma points through the state-transition model
χ ^ t f χ t 1 ; Θ .
Next, the weighted mean and the covariance of the predicted sigma points are computed,
m ^ t i = 0 2 n ω m ( i ) χ ^ t ( i ) , P ^ t i = 0 2 n ω c ( i ) χ ^ t ( i ) m ^ t χ ^ t ( i ) m ^ t + R t ,
where R t is the state-noise covariance matrix at time instant t. From the obtained mean and covariance of the predicted sigma points, one can form a new set of sigma points,
χ t m ^ t , m ^ t + γ P ^ t , m ^ t γ P ^ t ,
which are used to estimate the new observation values passing these points to the observation model
Y ^ t ψ χ t .
On the other hand, the mean and the covariance of the newly estimated observation values can be computed as follows:
μ t i = 0 2 n ω m ( i ) Y ^ t ( i ) , S t i = 0 2 n ω c ( i ) Y ^ t ( i ) μ t Y ^ t ( i ) μ t + Q t ,
where Q t is the observation-noise covariance matrix. Further, one can compute the cross-covariance matrix
C t i = 0 2 n ω c ( i ) χ ^ t ( i ) m ^ t Y ^ t ( i ) μ t ,
which in turn is used to compute the Kalman gain K t
K t C t S t 1 .
Finally, one can compute the mean ( m t ) and the covariance ( P t ) of the hidden state at time instant t,
m t m ^ t + K t y t μ t , P t P ^ t K t S t K t .
The mean ( m t ) and the covariance ( P t ) are used for the next iteration ( t + 1 ) of the UKF procedure. Once the execution of the UKF algorithm is finished, then it returns m = ( m t ) t = 0 T , P = ( P t ) t = 0 T , μ = ( μ t ) t = 0 T , and S = ( S t ) t = 0 T . The UKF algorithm is summarized in Algorithm 1.
Algorithm 1: Unscented Kalman Filter (UKF) [13,20] ( m , P , μ , S ) UKF ( y , m 0 , P 0 , R , Q )
Mathematics 12 02690 i001

2.4.4. Particle Swarm Optimization (PSO)

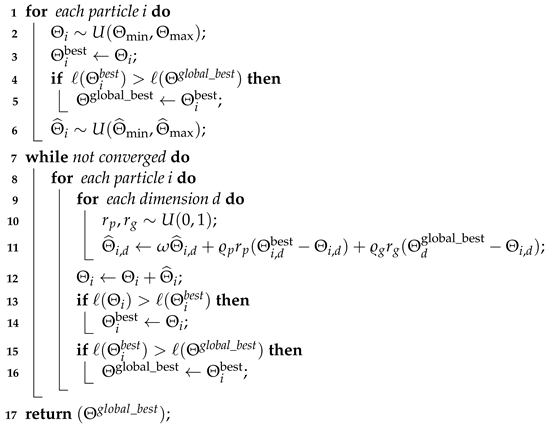
In this present work, the parameters that maximize the log-likelihood function introduced in Section 2.4.2 are searched using the Particle Swarm Optimization (PSO) algorithm for its outperformance [14]. The PSO algorithm (detailed in Algorithm 2) works in the following manner. It first initializes the “positions” ( Θ ) and “velocities” ( Θ ^ ) of the parameter particles following the respective uniform distributions. These uniform distributions are in turn defined by the lower and upper boundary values of Θ (i.e., Θ min and Θ max ) and by the lower and upper boundary values of Θ ^ (i.e., Θ ^ min and Θ ^ max ), where Θ ^ min and Θ ^ max are defined as ( | Θ max Θ min | ) and | Θ max Θ min | , respectively. In this initialization procedure, both the best global position among all the particles ( Θ global _ best ) and the best known position for each particle ( Θ i best ) are registered.
In the main loop of the optimization algorithm, the velocity of each particle ( Θ ^ i ) is updated by considering both the best global position among all the particles ( Θ global _ best ) and the best known position for that particle ( Θ i best ). Then, its position ( Θ i ) is updated using the new velocity ( Θ ^ i ). Afterwards, both the best global position among all the particles and the best known position for each particle are also updated, if better positions are found. Once the convergence criterion is satisfied, then the best global position is returned, which represents the parameter values that maximize the log-likelihood function. The PSO algorithm is summarized in Algorithm 2.
In Figure 1, we summarize the MeLo-1-V model that we propose in this work with all the components that intervene during the optimization stage. Once the optimization is finished, the ZCB price can be efficiently estimated from a given actual yield-rate value, which is fed to the one-factor Vasicek model to estimate the shadow rate, which in turn is fed to the MeLo model, which in turn is solved by the approximate closed-form solution that we propose in this work (which is based on the Gauss-Hermite quadrature (see Theorem 2)).
Algorithm 2: Particle Swarm Optimization (PSO) [14] ( Θ global _ best ) PSO ( L , Θ min , Θ max , size particles , dimension p a r t i c l e )
Mathematics 12 02690 i002

3. Results

In this section, we numerically illustrate the performance of the novel MeLo-1-V model, where the ZCB price is estimated using the approximate closed-form solution in the ZLB framework given in (21) within Theorem 2 for two types of observable data (yield rates): synthetically generated yield rates and actual yield rates of AAA-rated bonds compiled by the European Central Bank [15].

3.1. The MeLo-1-V Model with Synthetically Generated Data

In this section, the performance of the MeLo-1-V model obtained using synthetically generated data is presented. These data are generated using the state-transition model given in (23) and the observation model given by (29). We generated M realizations of 150 samples with the time step Δ = 5 350 , and the following model-parameter values:
Θ = κ , θ , σ , s , λ = 5 × 10 2 , 5 × 10 2 , 5 × 10 2 , 13 × 10 2 , 17.37 × 10 2 ,
where M refers to the number of time-to-maturity values. In this study, we consider the following maturities: 3 months, 6 months, 9 months, 1 year, 3 years, 5 years, 10 years, and 15 years.
Then, the shadow rate is generated using (7) with x 0 = 0.025 as initial condition. The PSO algorithm described in Algorithm 2 is employed to search for the parameter values that maximize the log-likelihood function given in (34). This search is performed over a space determined heuristically and is defined as
10 5 κ 2.0 , 1.0 θ 1.0 , 10 5 σ 0.5 , 10 5 s 0.2 , 10 5 λ 0.2 .
In each search iteration, the UKF described in Algorithm 1 is applied with the state-transition model described in (23) and the observation model given by (29). We recall that the state-transition model returns the shadow rate corresponding to time t and that the observation model returns the yield rate corresponding to time t. In fact, the yield rate is obtained by first estimating the ZCB price with the approximate closed-form solution given in (21).
As a result, the optimal model-parameter values obtained by the PSO algorithm are
Θ MLE = κ , θ , σ , s , λ MLE = 4.168 × 10 2 , 5.357 × 10 2 , 4.998 × 10 2 , 1.270 × 10 2 , 17.67 × 10 2 .
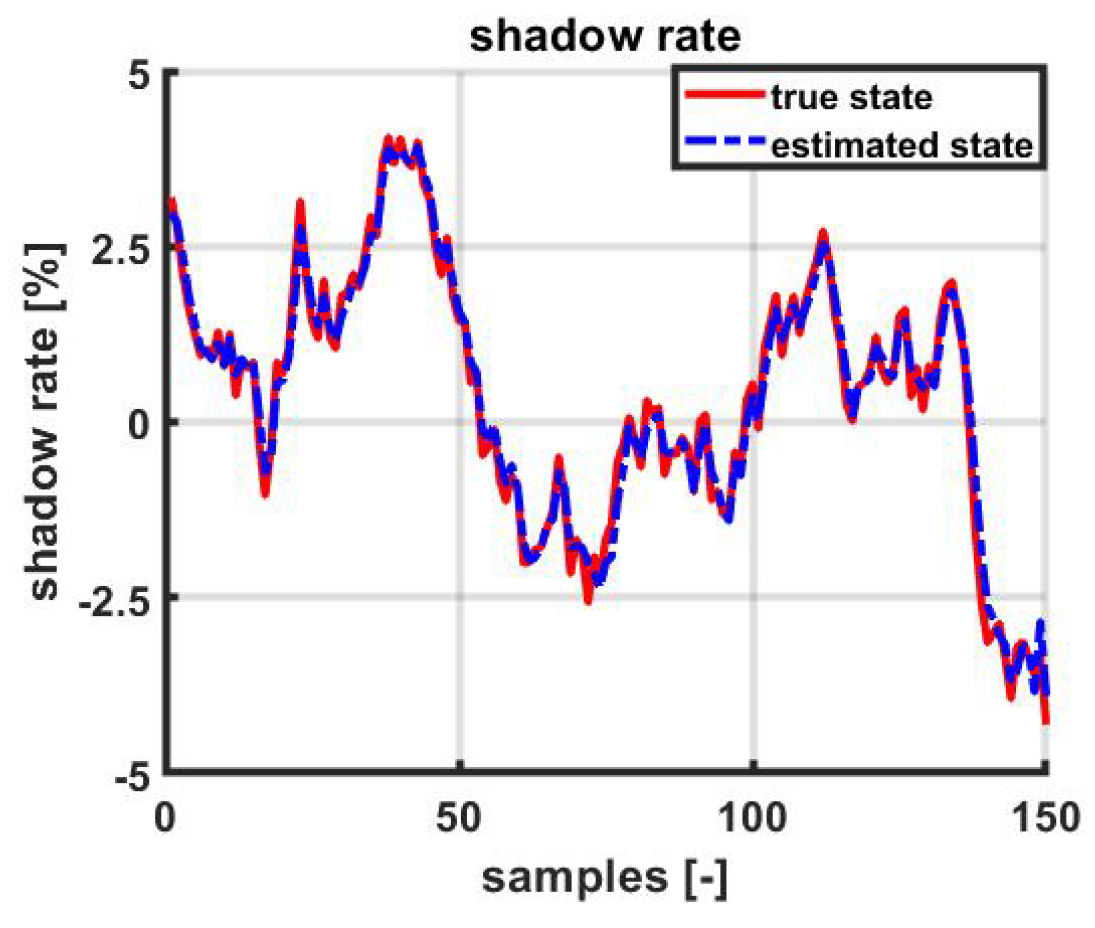
By comparing the model parameter values used for generating the synthetic data (see (45)) to those that are obtained using the PSO algorithm (see (47)), one can notice that they are close to each other, indicating the good performance of the PSO algorithm to search for optimal parameter values. This observation is further supported by the results shown in Figure 2 and Figure 3. Figure 2 compares the shadow-rate values that we generated using the parameter values indicated in (45) (called as “true state” and represented with red curve) to the shadow-rate values obtained using the parameter values that optimize the log-likelihood function (34) (called the “estimated state” and represented with a blue curve). These comparison results show that our estimator of the hidden state (i.e., the shadow rate) can satisfactorily find those that were originally generated synthetically.
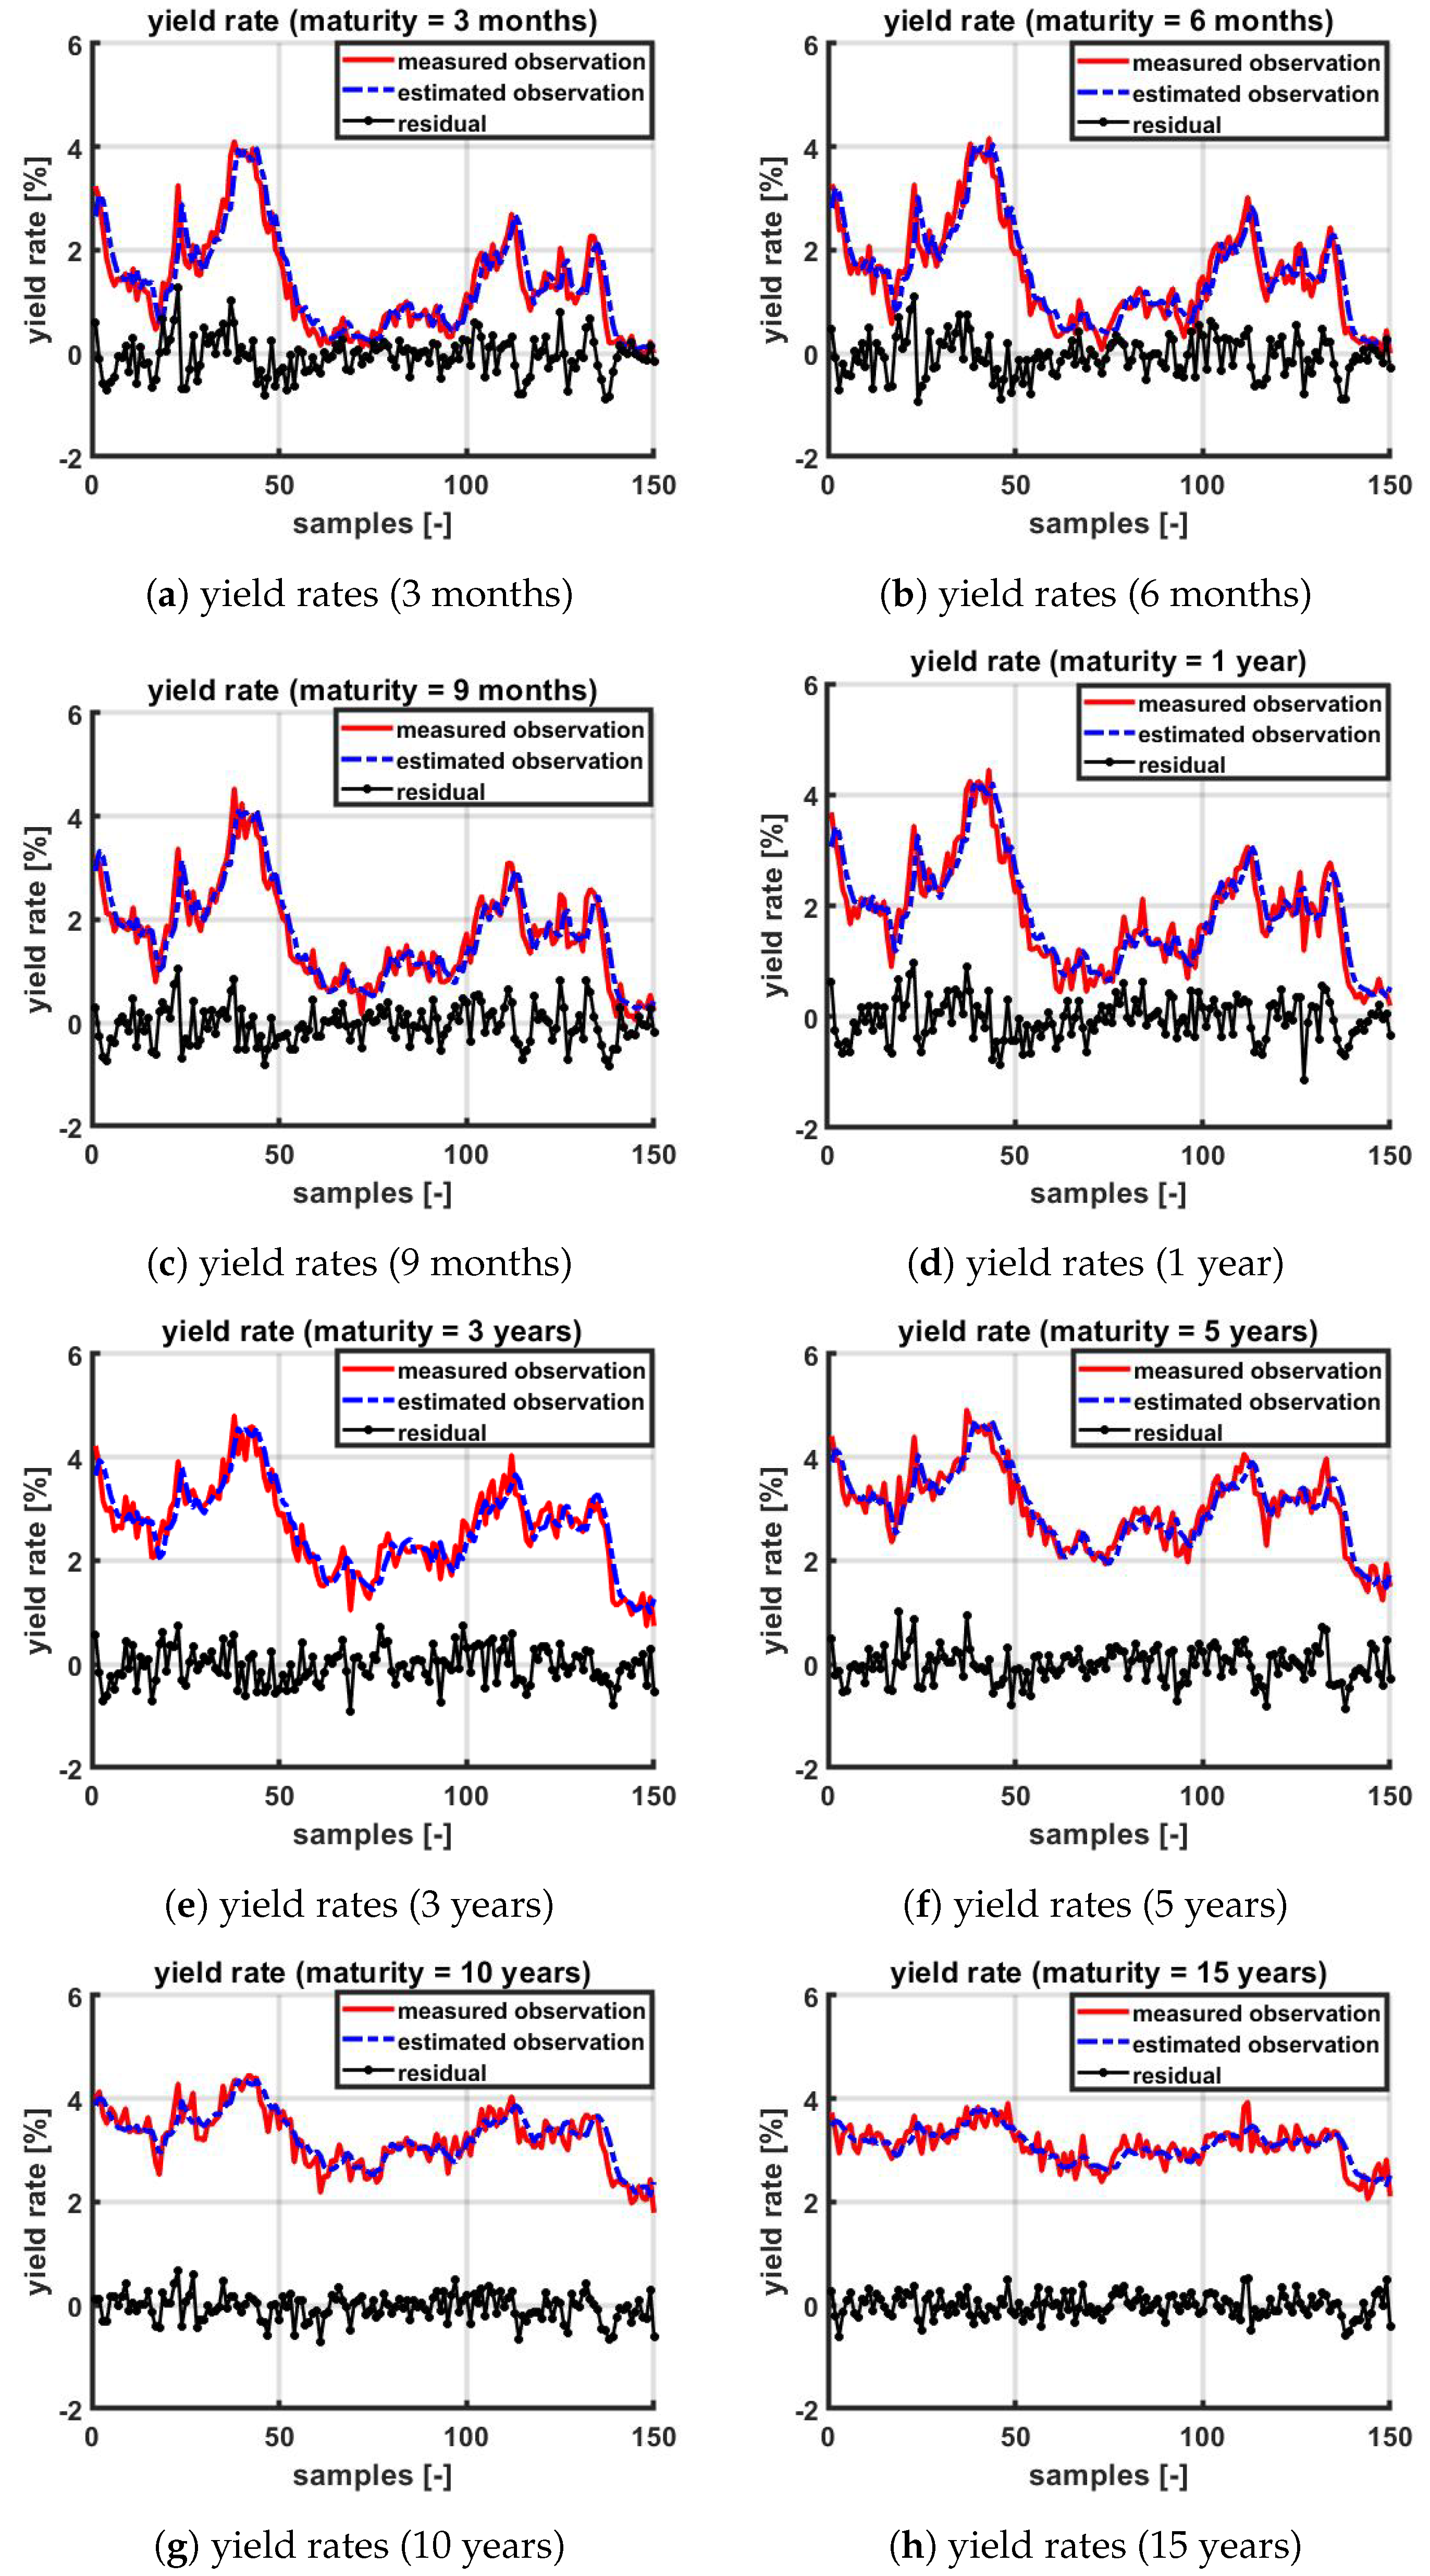
On the other hand, Figure 3 illustrates the yield-rate values corresponding to eight values of time to maturity, ranging from 3 months (Figure 3a) to 15 years (Figure 3h). For each time-to-maturity value, three graphs are shown: measured observation, estimated observation, and residual. By measured observation, we refer to the yield-rate values generated synthetically (represented with red curve), and, by estimated observation, we refer to the yield-rate values obtained using the parameter values that optimize the log-likelihood function (34) (represented with a blue curve). The residual is the difference between the measured observation and the estimated observation (represented with a black curve). These results illustrate once again that our estimator of yield rates is able to track the yield-rate values that were generated synthetically for all the considered time-to-maturity values. On the other hand, the gap between the actual observation curves (red) and the estimated observation curves (blue) are small in general.

3.2. The MeLo-1-V Model with Actual Data

In this section, the MeLo-1-V model is evaluated using the AAA-rated Euro-area yield-rate values published by the European Central Bank [15]. The yield-rate values ranging from 6 September 2004 to 21 June 2012 (a period that concerns the ZLB framework) are illustrated in Figure 4, for the values of time to maturity that range from 3 months to 15 years. This time period (i.e., from 6 September 2004 to 21 June 2012) is chosen because the yield rates beyond this period become negative for short time-to-maturity values and because the present work deals only with the ZLB framework.
As described in Section 3.1, the PSO algorithm is applied to search for the parameter values that maximize the log-likelihood function (34), now with the AAA-rated Euro-area yield rates as dataset. The parameter-search space is defined by (46). Once again, in each search iteration, the UKF is applied using (23) as the state transition model and (29) as the observation model. The approximate closed-form solution for the ZCB price in the ZLB framework (21) is used in the observation model.
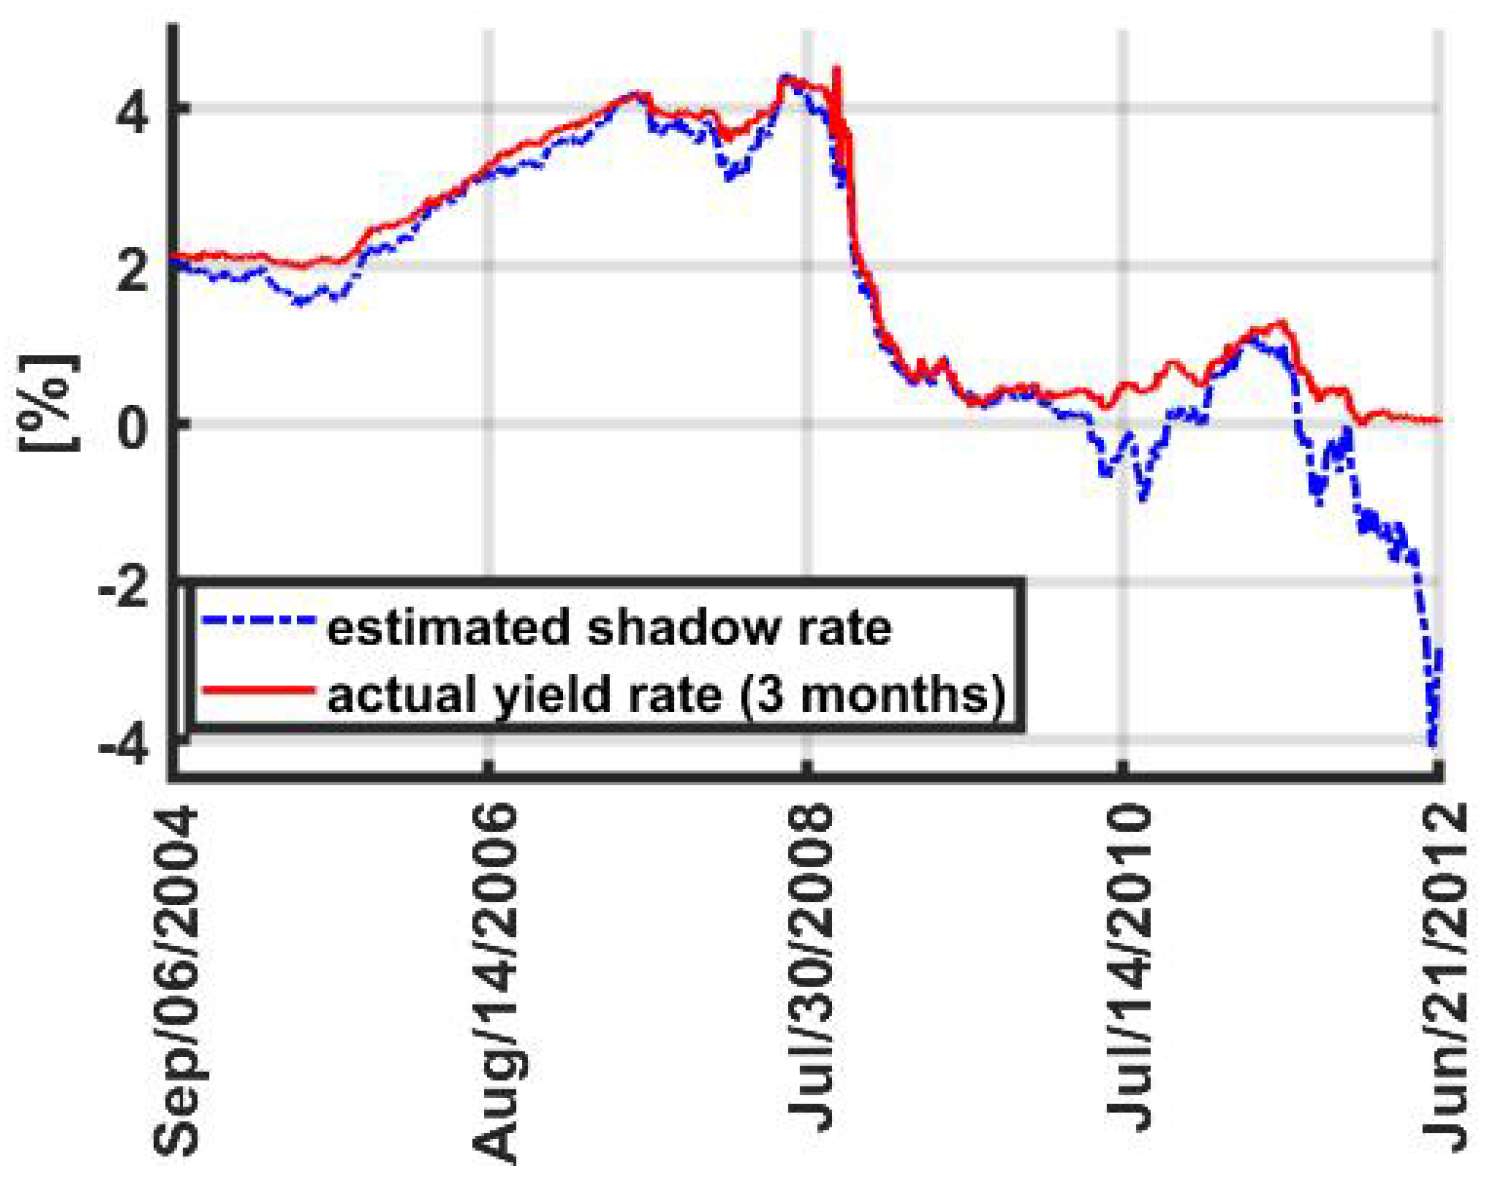
The performance of the MeLo-1-V model with actual data is shown in Figure 5 and Figure 6. As the only observable data are yield rates, the hidden state (the shadow rate) is estimated using the UKF. The estimated shadow-rate values are compared to the actual yield-rate values corresponding to the shortest time to maturity (3 months). Notice that, as the actual shadow-rate values are unobservable, the yield-rate values corresponding to the shortest time to maturity can be considered as reference values. Figure 5 illustrates that, in general, the estimated shadow rate (blue) tracks well the actual yield rate corresponding to the shortest time to maturity (red). Further, one can observe that, as the actual yield rate approaches zero, the estimated shadow rate becomes negative.
As a result, the following optimal model-parameter values are obtained:
Θ MLE = κ , θ , σ , s , λ MLE = 4.396 × 10 1 , 5.342 × 10 2 , 1.950 × 10 2 , 1.000 × 10 5 , 3.899 × 10 3 .
On the other hand, Figure 6 illustrates the yield-rate values corresponding to eight values of time to maturity ranging from 3 months (Figure 6a) to 15 years (Figure 6h). These results show that our yield-rate estimator can satisfactorily track the actual yield-rate values for short and medium time-to-maturity values (ranging from 3 months to 1 year), presenting small residual levels in general. For long time-to-maturity values (ranging from 3 years to 15 years), though our estimator cannot accurately track the actual yield-rate values, it is able to track the trend of the actual yield-rate values.
In order to carefully study the situations where the yield rates are near zero, we illustrate such a case in Figure 7, corresponding to the AAA-rated Euro-area yield rates ranging from 16 August 2010 to 12 November 2010, for a 3-month time to maturity. In this figure, we illustrate the actual yield-rate values (“measured observation”) and the residual between the actual yield rate and the estimated values. From these results, one can observe that the residual values are bounded and are much lower than the corresponding yield-rate values.
Further, the statistics of both the actual AAA-rated Euro-area yield rates ranging from 6 September 2004 to 21 June 2012 (a period that concerns the ZLB framework) and the estimated yield rates are shown in Table 1 and Table 2, respectively. First, one can observe that the mean values of the actual and estimated yield rates are close to each other for all the time-to-maturity values considered for this study. As mentioned earlier, this fact can also be observed from the graphs shown in Figure 6. Second, both the standard deviation and the skewness of both the actual and estimated yield rates are close for short time-to-maturity values, but they become distant as the time-to-maturity value is increased. Third, the distributions of both actual and estimated yield rates are close to each other for all time-to-maturity values considered in this study. This can be observed by analyzing all the quantile values shown in Table 1 and Table 2.

4. Discussion

The performance of the approximate closed-form solution proposed in the present work may be appreciated by statistically analyzing the residuals between the actual and the estimated yield-rate values (for both synthetically generated and actual data) shown, respectively, in Figure 3 and Figure 6.
Table 3 shows the statistics of the residuals of synthetically generated yield rates and the estimated ones depicted in Figure 3. All these values are in percentages. Both the mean absolute errors (MAEs) and the root mean square errors (RMSEs) for all considered maturities are under 0.4%, indicating a good performance in predicting the synthetically generated yield rates using the approximate closed-form solution proposed in this work. Further, once the model parameters are optimized, we can efficiently compute ZCB prices when corresponding yield rates are known, using the approximate closed-form solution proposed in this work (shown in Theorem 2).
Table 4 shows the statistics of the residuals of actual AAA-rated Euro-area yield rates and the estimated ones depicted in Figure 6. All these values are in percentages. Both the MAEs and the RMSEs for all considered maturities are under 0.6%. These results show that our approximate closed-form solution is able to show a good match between the actual and estimated yield-rate values for short and medium maturities (i.e., 3 months, 6 months, 9 months, and 1 year), whereas for long maturities (i.e., 3 years, 5 years, 10 years, and 15 years), it is able to estimate the trend of the yield rates.
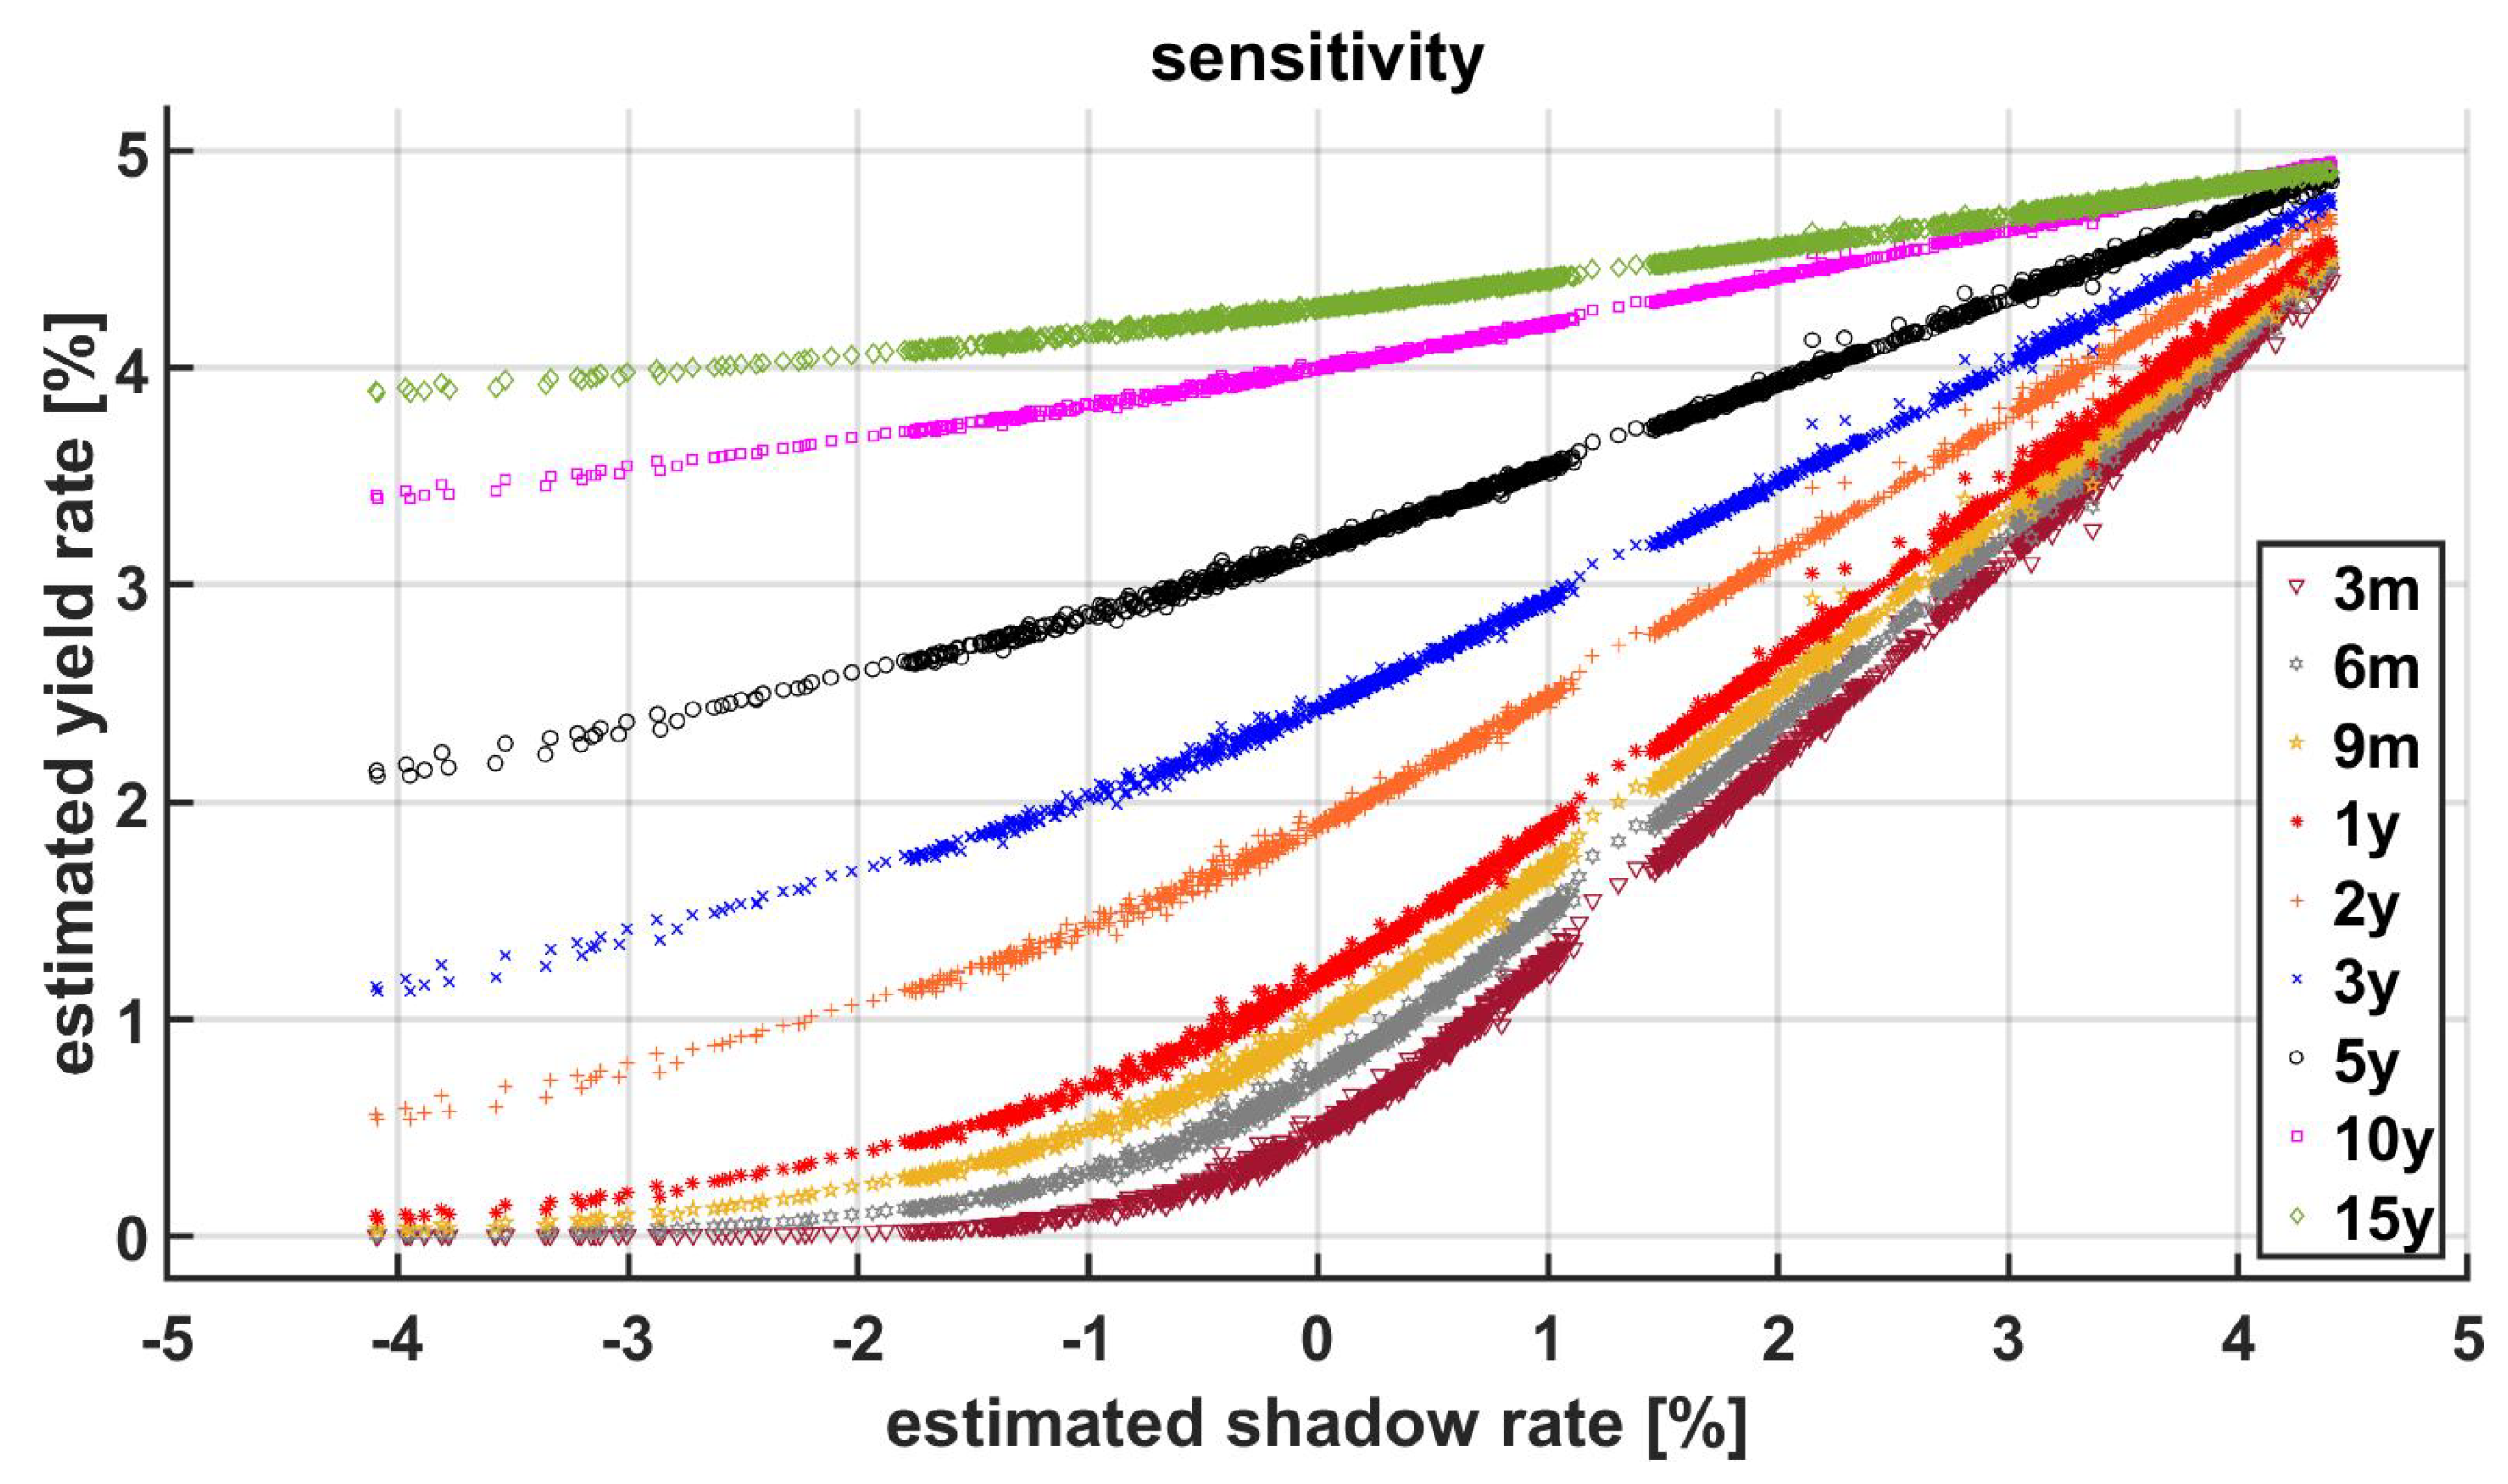
On the other hand, we also estimate the sensitivity of the estimated yield rates with respect to the estimated shadow rate, which are illustrated in Figure 8. These results show that in general, the slope of the yield rate diminishes as the time to maturity increases. In other words, the influence of shadow-rate changes is greater for yield rates with shorter time-to-maturity values, and therefore the shorter the time to maturity is, the more sensitive the yield rate is to changes in the shadow rate.
Further, we compare the Vasicek model to the MeLo-1-V model for different scenarios, and the respective results are analyzed in the sequel. From the fact that the difference of the parameters employed for the Vasicek model and the MeLo-1-V model is simply due to the smoothing factor (s) (i.e., Θ ( 1 V a s i c e k ) = Θ ( M e L o 1 V ) { s } ), one can be easily tempted to calibrate first for the Vasicek model, and then for the MeLo-1-V model, choosing the smoothing factor that offers the best estimate of the actual yield rates. We show in this section that this can be achieved for some situations. Under the Vasicek model (similar to any Gaussian model), one can obtain negative yield rates for some time horizons [21]. If the occurrence of such negative values is frequent, then it is preferable to switch from the Vasicek model to the MeLo-1-V model. In estimating yield rates using the Vasicek model for some time-to-maturity values, one can obtain negative values due to the chosen model parameter values: high volatility values or low state values. On the other hand, this is not the case with the MeLo-1-V model. The yield curves obtained using Θ ( 1 V a s i c e k ) and Θ ( M e L o 1 V ) = Θ ( 1 V a s i c e k ) { s } can be very similar, although the Vasicek model can involve negative values.

4.1. Negative Interest Rates under the Vasicek

In this section, we consider situations for which the model parameters and the initial state variable immediately lead to negative interest rates for some time-to-maturity values. These “pathological” cases deserve a special attention. Indeed, when one calibrates the Vasicek parameters, without imposing any restriction (such as the case when one follows the model in the strict sense), then one might encounter cases where the calibrated model parameters can lead to non-viable yield curves. As commented in Section 1, a similar issue can be observed when classical models such as the Gaussian models [1] are used, because they can return negative interest-rate values. To overcome this issue, Gaussian quadratic models [2] and stochastic volatility models with square-root processes (e.g., Cox–Ingersoll–Ross (CIR)) [3,4] may be used. However, then these models are not suitable for interest rates that remain constant for a long period of time. Further, the CIR model [3] has a problem: it can be stuck to zero interest-rate value without being able to return to other positive values. Consequently, it is an open question whether any set of Vasicek parameters (possibly non-acceptable ones) can be embedded into the MeLo-1-V model by just adding a suitable smoothing parameter such that one can finally obtain a reasonable yield curve.
To illustrate cases where non-viable yield curves (i.e., yield curves with negative values) are obtained using the Vasicek model, the following five examples are considered:
Example 1.
a scenario with negative interest rates for long time-to-maturity values, even though the initial state level is high, where the chosen initial state and model parameters are x 0 = 0.058 and Θ = κ , θ , σ = 0.05 , 0.05 , 0.15 .
Example 2.
a scenario with pronounced negative interest rates for short and medium time-to-maturity values, and with a high-level initial state and large volatility, where the chosen initial state and model parameters are x 0 = 0.058 and Θ = κ , θ , σ = 0.05 , 0.05 , 0.25 .
Example 3.
a scenario with negative interest rates and with a low positive initial state value, where the chosen initial state and model parameters are, respectively, x 0 = 0.0025 and Θ = κ , θ , σ = 0.05 , 0.015 , 0.2 .
Example 4.
a scenario with negative interest rates and with a negative initial state, where the chosen initial state and model parameters are x 0 = 0.005 and Θ = κ , θ , σ = ( 0.05 , 0.015 , 0.05 ) .
Example 5.
a scenario with positive interest rates for long time-to-maturity values and with a negative initial state, where the initial state and model parameters are x 0 = 0.05 and Θ = κ , θ , σ = 0.55 , 0.015 , 0.03 .
Although these five examples represent scenarios with yield-rate values generated synthetically using the Vasicek model (and therefore they are not actual data), they allow us to grasp the subtleties and the richness of the Vasicek model when representing interest rates and the shadow rate.
The yield-rate values corresponding to the five examples are shown in Table 5. First, the results of Example 1 show that the interest rates become negative for time-to-maturity values of 5 years and above. Second, the results of Example 2 are roughly analogous to those of Example 1, with the only difference that the interest rates start to become negative at shorter time-to-maturity values due to higher volatilities. Third, for Example 3, as the initial state value is low, the risk to obtain negative interest rates even for shorter time-to-maturity values is high. The sign of the interest rates largely depends on the choice of the initial state level. Forth, from the results of Example 4, one can clearly observe that interest rates can become completely negative for all time-to-maturity values when the initial state value is negative. Fifth, the results of Example 5 show that one can obtain positive yield-rate values for long time-to-maturity values even the initial state value is negative. One possible reason for this behavior is because its κ value is relatively high compared to the rest of examples, which forces the yield-rate values to be quickly attracted to their mean value ( θ ).
These five examples demonstrate that even though the Vasicek model is recognized to be a restrictive model, it remains an instructive tool whose properties seem yet to be explored. A deep understanding of this aspect may be helpful when considering and assessing more advanced models that account for more than one uncertainty factor.

4.2. Comparison between the Vasicek Model and the MeLo-1-V Model

In this section, the Vasicek model is compared to the MeLo-1-V model in terms of the yield-rate values. In this comparison study, one can observe that, when the shadow rate is suitable to directly represent the yield rates, both the Vasicek and the MeLo-1-V return similar yield curves. On the other hand, when the shadow rate resulting from the Vasicek model is not suitable to directly represent the yield rates, then the same parameters calibrated for the Vasicek model may be applied to the MeLo-1-V model (with a suitable smoothing factor value) to derive acceptable yield curves with positive interest rates. However, it is advisable to directly estimate the model-parameter values for the MeLo-1-V model (independently from the Vasicek model). In general, the calibrated parameter values are different for the two models.
The comparison results shown to the below indicate that when using the same common parameter values shared by the two models, one obtains similar yield-rate values in some scenarios, and in some other scenarios very different yield-rate values. Nonetheless, even in the scenarios where the obtained yield-rate values are very different, their shapes plotted with respect to the time-to-maturity values are very similar (see Figure 9).

4.2.1. Scenarios Where the MeLo-1-V and Its Underlying Vasicek Are Roughly the Same

To analyze the scenario where the Vasicek may be directly applied to represent the instantaneous short rate, we consider the following two cases (as in [21]):
Case 1 : x 0 = 2.5000000 % , κ = 5.0692963 % , θ = 4.7513000 % , σ = 0.3891468 % , Case 2 : x 0 = 0.0000 % , κ = 10.6766 % , θ = 5.5697 % , σ = 2.7915 % .
The initial state and the parameter values o Case 1 (see (49)) correspond to yield-rate values prior to the 2007–2008 financial crisis. The model-parameter values are found from the EUR IR ranging from 1999 to 2007 for the 3-month period daily Euro Interbank Offered Rate. On the other hand, the initial state and the parameter values of Case 2 (see (49)) correspond to yield-rate values of 2013. The model-parameter values are found from the US IR, published by the Federal Reserve Bank on 31 December 2013.
The model comparison results for the two different cases are shown in Table 6. For each case, the yield rates (in percentage) computed using the two models as well as the difference of their values are illustrated for time-to-maturity values ranging from 1 / 12 to 50 years.
For Case 1, the differences between the yield rates obtained using the two different models are generally small. Although these differences grow as the time to maturity increases, they always remain small.
However, this is not so with Case 2. For Case 2, the differences between the yield rates obtained using the two different models become relatively significant for time-to-maturity values ranging between 4 and 20 years. It may be observed that the initial state value is 0 for Case 2. The difference between the yield rates obtained using the Vasicek model and those obtained using the MeLo-1-V model is that the parameters of the MeLo-1-V model are not directly calibrated using the market data, but the parameter values calibrated for the Vasicek model are used (therefore without taking into account the smoothing factor).

4.2.2. Scenarios Where the Vasicek Curve Seems to Be Unreliable

In this section, the yield-rate values obtained using the Vasicek model for the five examples considered in Section 4.1 are compared to those obtained using the MeLo-1-V model, using the same common parameter values for the two models. For simplicity, the comparison is made for Example 1, Example 3, and Example 5, and the comparison results are shown in Table 7.
Example 1 and Example 3 show, in general, that as the time to maturity grows, the yield rates become strongly negative when they are estimated using the Vasicek model, while this is not the case when they are estimated using the MeLo-1-V model. Nevertheless, the shapes of the yield curves obtained using the two different models are similar (see also Figure 9).
On the other hand, for Example 5, one can observe a similar behavior between the two models (see also Figure 9). One possible reason for this behavior is because its κ value is relatively high compared to the rest of examples, which forces the yield-rate values to be quickly attracted to their mean value ( θ ).

5. Conclusions and Future Work

When the short rate is modeled as Meucci and Loregian proposed in [10] (called the MeLo model), the interest rate is ensured to be nonnegative and differentiable with respect to the shadow rate. By describing the shadow rate after the one-factor Vasicek model and the short rate after the MeLo model (coined in this work as the MeLo-1-V model), we can express the ZCB price as a function of the shadow rate, for which the corresponding interest rate resides in the ZLB framework. We then provide two approximate closed-form solutions for the ZCB price in the ZLB framework using the Monte-Carlo simulation with the Gaussian quadratures. In addition, we show how the model parameters are calibrated using the Particle Swarm Optimization algorithm. In each optimization iteration, the unobservable variable (i.e., the shadow rate) is estimated using the Unscented Kalman Filter, for which in turn the one-factor Vasicek model is used as the state-transition model, and the ZCB price is computed in the observation model to estimate the interest rate. The results obtained in this work show a good match between the actual and estimated yield-rate values for short and medium time-to-maturity values. For long time-to-maturity values, our approach is able to reliably estimate the trend of the yield rates. Further, once the model parameters are optimized, we can efficiently compute ZCB prices when corresponding yield rates are known using the approximate closed-form solution proposed in this work (shown in Theorem 2). Moreover, we compare the Vasicek model and the MeLo-1-V model and show that while Vasicek model can return negative yield-rate values (hence not complying the ZLB framework), our approach guarantees the compliance of the ZLB framework.
As a possible future work, the solutions proposed in this work for ZCB pricing may be explored to derive analytic expressions for the sensitivity of yield rates and ZCB prices with respect to the underlying shadow rates and model parameters. In addition, we are interested in using other expressions for the short rate, such as the short rate obtained using the one-factor Hull–White model with the aim to exactly fit the market yield. Finally, we are also interested in extending the current work to the framework of pricing nonlinear instruments such as options.

Author Contributions

Conceptualization, J.-Y.J. and Y.R.; methodology, J.-Y.J. and Y.R.; software, J.-Y.J.; validation, J.-Y.J. and Y.R.; formal analysis, J.-Y.J. and Y.R.; investigation, J.-Y.J. and Y.R.; resources, J.-Y.J. and Y.R.; data curation, J.-Y.J.; writing—original draft preparation, J.-Y.J. and Y.R.; writing—review and editing, J.-Y.J.; visualization, J.-Y.J. and Y.R.; supervision, J.-Y.J. and Y.R.; project administration, J.-Y.J. and Y.R.; funding acquisition, Not applicable. All authors have read and agreed to the published version of the manuscript.

Funding

This research received no external funding.

Data Availability Statement

The data presented in this study are available in “Euro area yield curves” at https://www.ecb.europa.eu/stats/financial_markets_and_interest_rates/euro_area_yield_curves/html/index.en.html (accessed on 20 January 2024). These data were derived from the following resources available in the public domain: “All years—AAA” https://data-api.ecb.europa.eu/service/data/YC/B.U2.EUR.4F.G_N_A.SV_C_YM.?startPeriod=2004-09-06&endPeriod=2023-12-31&format=csvdata (accessed on 20 January 2024).

Acknowledgments

The authors appreciate the ECE Paris for financing the purchase of the Lambda Quad Max Deep Learning server, which is used to obtain the results illustrated in the present work.

Conflicts of Interest

The authors declare no conflicts of interest.

Appendix A. Proof of Theorem 1

Let us recall that, by (6), one has
P ( t , t + τ ) E Q [ exp t t + τ r u ( · ) d u | F t ] = Ω exp R ( ω ; 0 , τ ) d Q | F t ( ω ) ,
where, for most ω Ω (with Ω being a sample space), one has
R ( ω ; 0 , τ ) R ω ; 0 , τ ; x t , Θ = t t + τ r u ( ω ) d u = 0 τ r ζ + t ( ω ) d ζ = 0 τ c s x ζ + t ( ω ) d ζ .
According to (7), for 0 t and 0 < ζ , one has
x ζ + t ( · ) = exp κ ζ x t + κ θ b ζ ; κ + σ b 1 2 ζ ; 2 κ Z ( · ; ζ )
with
Z ( · ; ζ ) Z · ; ζ , t , κ = b 1 2 ζ ; 2 κ exp κ ( ζ + t ) t t + ζ exp κ v d W v ( Q ) ( · ) ,
such that Z ( · ; ζ ) | F t is reduced to a normal and standard random variable for each ζ . It is important to notice that Z ( · ; ζ ) depends on the current time t but not on the time to maturity τ . Therefore, in order to derive the ZCB price, one has to deal with the random variable R defined by
R ( ω ; 0 , τ ) = 0 τ c s α ( ζ ) x t + β ( ζ ) + V ( ζ ) Z ( ω ; ζ ) d ζ ,
where
α ( ζ ) exp κ ζ , β ( ζ ) κ θ b ζ ; κ , V ( ζ ) σ b 1 2 ζ ; κ .
It appears that R ( ω ; 0 , τ ) depends on the family of random variables Z ( · ; ζ ) ζ [ 0 , τ ] conditioned by F t , where each Z ( · ; ζ ) is a standard Gaussian random variable. The difficulty in computing the variable R ( · ; 0 , τ ) is in the fact that it depends on a family of infinite and uncountable Gaussian random variables. Hence, there is no obvious way to derive the joint law.
In fact, we are interested in computing not only a single ZCB price P ( t , t + τ ) , but the entire curve
P ( t , t + τ 1 ) , , P ( t , t + τ m ) , , P ( t , t + τ M )
corresponding to the increasing time-to-maturity values
0 τ 0 < τ 1 < < τ m < < τ M
while satisfying Condition (15).
For simplicity, let us set that
F ( ω , ζ ) c s α ( ζ ) x t + β ( ζ ) + V ( ζ ) Z ( ω ; ζ ) .
To obtain the previously mentioned curve, one needs to consider the terms
R ( ω ; 0 , τ 1 ) , , R ( ω ; 0 , τ m ) , , R ( ω ; 0 , τ M ) .
However, since
R ( ω ; 0 , τ m ) = 0 τ m F ( ω , ζ ) d ζ = l = 1 m τ l 1 τ l F ( ω , ζ ) d ζ = l = 1 m R ( ω ; τ l 1 , τ l ) ,
we only need to consider
R ( ω ; 0 , τ 1 ) , R ( ω ; τ 1 , τ 2 ) , , R ( ω ; τ m 1 , τ m ) , , R ( ω ; 0 , τ M 1 , τ M ) .
By using the Legendre integration, each R ( ω ; τ m 1 , τ m ) , with m { 1 , , M } , can be written as
R ( ω ; τ m 1 , τ m ) = τ m 1 τ m F ( ω , ζ ) d ζ = 1 2 τ m τ m 1 1 1 F ω , 1 2 τ m τ m 1 ( 1 + ζ ) + τ m 1 d ζ 1 2 τ m τ m 1 i = 1 I F ω , 1 2 τ m τ m 1 1 + a i ( L ) + τ m 1 w i ( L ) .
Then, one needs to introduce the notations
ζ i , m 1 2 τ m τ m 1 1 + a i ( L ) + τ m 1 ,
α i , m α ( ζ i , m ) , β i , m β ( ζ i , m ) , V i , m V ( ζ i , m ) ,
where i { 1 , , I } and m { 1 , , M } . It is also useful to introduce the random variables Z i , m defined by
Z i , m ( ω ) Z ( ω , ζ i , m ) .
Using these notations, the approximation given in (A9) becomes
R ( ω ; τ m 1 , τ m ) 1 2 τ m τ m 1 i = 1 I c s α i , m x t + β i , m + V i , m Z i , m ( ω ) w i ( L ) .
This implies that the computation of R ( ω ; τ m 1 , τ m ) requires the joint law for the I-dimensional vector of random variables Z 1 , m ( · ) , , Z i , m ( · ) , Z I , m ( · ) . Therefore, the consideration of the terms (A7) or (A8) requires the joint law for the I × M -dimensional vector of random variables
Z 1 , 1 ( · ) Z i , 1 ( · ) Z I , 1 ( · ) Z 1 , m ( · ) Z i , m ( · ) Z I , m ( · ) Z 1 , M ( · ) Z i , M ( · ) Z I , M ( · ) .
Each component in the I × M -dimensional vector in (A12) is a standard Gaussian normal random variable. If, for example, M = 40 and I = 250 , then one has to deal with 10,000 random variables, which is too large.
To reduce the dimensionality, one can replace all the
Z 1 , m ( · ) , , Z i , m ( · ) , Z I , m ( · )
by one among these random variables. That is, for some I * ( m ) { 1 , , I } , we take
Z i , m ( · ) Z I * ( m ) , m ( · ) .
Several choices are possible to select I * ( m ) . For example, one can choose I * ( m ) = 1 or I * ( m ) = I . Further, another possible choice is I * ( m ) = 1 2 ( 1 + I ) if I is odd and I * ( m ) = 1 2 I + 1 , if I is even.
Therefore, using (A13), one has
R ( ω ; τ m 1 , τ m ) 1 2 τ m τ m 1 i = 1 I c s α i , m x t + β i , m + V i , m Z I * ( m ) , m ( ω ) w i ( L ) ,
which means that instead of the I × M -dimensional vector considered in (A12), we are reduced to deal just with an M-dimensional vector whose components are
Z I * ( 1 ) , 1 ( · ) , , Z I * ( m ) , m ( · ) , Z I * ( M ) , M ( · ) .
It should be noted that depending on the choice, the I * ( m ) s may differ from each other.
Let us recall that our goal is to derive an approximate expression for each ZCB price,
P ( t , t + τ m ) = Ω exp R ( ω ; 0 , τ m ) d Q | F t ( ω ) = Ω exp k = 1 m R ( ω ; τ k 1 , τ k ) d Q | F t ( ω ) Ω exp k = 1 m 1 2 τ k τ k 1 i = 1 I c s α i , k x t + β i , k + V i , k Z I * ( k ) , k ( ω ) w i ( L ) d Q | F t ( ω ) Ω F m Z I * ( 1 ) , 1 ( ω ) , , Z I * ( m ) , m ( ω ) d Q | F t ( ω ) ,
where
F m u 1 , , u m exp k = 1 m 1 2 τ k τ k 1 i = 1 I c s α i , k x t + β i , k + V i , k u k w i ( L ) .
(A16) can be transformed into an integral involving an M-variate Gaussian law. As no analytic approach is clearly available to compute this resulting integral, one has to deal with a numerical approach. A first choice is the Monte-Carlo simulation approach, though Gaussian quadrature approach might also be a possibility.
The (brute) Monte-Carlo approach entails the assertion that, for a large nonnegative integer J, one has the approximation
P ( t , t + τ m ) 1 J j = 1 J F m z [ j , 1 ] , , z [ j , m ] ,
where z [ j , 1 ] , , z [ j , m ] should be considered as a jth realization of the vector of random variables mentioned in (A15). The key observation from our analyses is that the derivation of the ZCB curve (14) is actually reduced to perform analytic calculations such as (16), once one has at disposal some joint realizations
z [ 1 , 1 ] , , z [ 1 , m ] , , z [ 1 , M ] z [ j , 1 ] , , z [ j , m ] , , z [ j , M ] z [ J , 1 ] , , z [ J , m ] , , z [ J , M ] .
In fact, we must justify that these dependent Gaussian realizations in (A18) can be actually obtained as a result of independent realizations
ε [ 1 , 1 ] , , ε [ 1 , m ] , , ε [ 1 , M ] ε [ j , 1 ] , , ε [ j , m ] , , ε [ j , M ] ε [ J , 1 ] , , ε [ J , m ] , , ε [ J , M ]
corresponding to a standard Gaussian normal random variable.
For this purpose, let us focus first on the vector in (A15) whose generic component is
Z i , m ( · ) = Z ( · , ζ i , m ) = b 1 2 ζ i , m ; 2 κ exp κ ( ζ i , m + t ) t t + ζ i , m exp κ v d W v ( Q ) ( · )
with
ζ i , m 1 2 τ m τ m 1 1 + a i ( L ) + τ m 1 .
As the Z i , m ( · ) s are standard Gaussian random variables, to study the joint law, we must consider the covariance terms
η i , m ; i , m C o v Q Z i , m ( · ) ; Z i , m ( · ) .
It should be stressed that actually only the cases i = I * ( m ) and i = I * ( m ) are useful to solve the derivation of (A18) from (A19). However, we perform our analysis of the covariance terms (A21) for all indexes i , i { 1 , , I } and m , m { 1 , , M } .
It may be noted that
i { 1 , , I } a i ( L ) ( 1 , 1 )
is an increasing function, which implies that for any m { 1 , , M } ,
ζ i , m < ζ i , m whenever i < i .
Moreover, it can be stated that for m < m , one has
ζ i , m ζ i , m for any i , i { 1 , , I } .
Inequality (A22) arises from Assumption (15) and from the fact that 0 < 1 + a i ( L ) . On the other hand, Inequality (A23) arises since, by constructions of τ m 1 < ζ i , m < τ m , one first applies (A22), which yields in turn ζ i , m < ζ i , m and then ζ i , m < ζ i , m , because of the increasing property of the map i a i ( L ) .
Given the geometry of the ζ i , m ’s, as described by (A22) and (A23), to calculate the covariance terms in (A21), one needs to differentiate between the following situations:
  • m = m with m , m { 1 , , M }
  • m < m with m { 1 , , M 1 } and m { m + 1 , , M }
  • m < m with m { 1 , , M 1 } and m { m + 1 , , M } .
In the sequel, we set
i = min { i , i } and i = max { i , i } .
Case m = m with m { 1 , , M 1 }
By applying Itô’s isometry, one has
η i , m ; i , m = C o v Q Z i , m ( · ) ; Z i , m ( · ) = b 1 2 ζ i , m ; 2 κ b 1 2 ζ i , m ; 2 κ exp κ ζ i , m + ζ i , m + 2 t t t + ζ i , m exp 2 κ v d v = b 1 2 ζ i , m ; 2 κ b 1 2 ζ i , m ; 2 κ exp κ ζ i , m + ζ i , m + 2 t exp 2 κ t + ζ i , m b ζ i , m ; 2 κ = exp κ ζ i , m ζ i , m b ζ i , m ; 2 κ b 1 2 ζ i , m ; 2 κ b 1 2 ζ i , m ; 2 κ .
Notice that η i , m ; i , m = 1 and η i , m ; i , m do not depend on time t for m m .
  • Case m < m with m { 1 , , M 1 } and m { m + 1 , , M }
Notice that ζ i , m < ζ i , m . By applying Itô’s isometry, one has
η i , m ; i , m = C o v Q Z i , m ( · ) ; Z i , m ( · ) = b 1 2 ζ i , m ; 2 κ b 1 2 ζ i , m ; 2 κ exp κ ζ i , m + ζ i , m + 2 t t t + ζ i , m exp 2 κ v d v = b 1 2 ζ i , m ; 2 κ b 1 2 ζ i , m ; 2 κ exp κ ζ i , m + y i , m + 2 t exp 2 κ t + ζ i , m b ζ i , m ; 2 κ = exp κ ζ i , m ζ i , m b ζ i , m ; 2 κ b 1 2 ζ i , m ; 2 κ b 1 2 ζ i , m ; 2 κ .
Notice also that η i , m ; i , m does not depend on time t.
  • Case m < m with m { 1 , , M 1 } and m { m + 1 , , M }
For this case, one can reuse the analysis performed in the previous case by changing the role of m and m as
η i , m ; i , m = C o v Q Z i , m ( · ) ; Z i , m ( · ) = C o v Q Z i , m ( · ) ; Z i , m ( · ) = exp κ ζ i , m ζ i , m b ζ i , m ; 2 κ b 1 2 ζ i , m ; 2 κ b 1 2 ζ i , m ; 2 κ .
With (A24)–(A26), one can easily deduce the computation of the M × M -dimensional matrix
Σ = η I * ( m ) , m ; I * ( m ) , m m , m { 1 , , M } = C o v Q Z I * ( m ) , m ( · ) ; Z ; I * ( m ) , m ( · ) m , m { 1 , , M } .
As this matrix is a symmetric and positive definite matrix, by the Cholesky’s decomposition, one can find an M × M -dimensional lower triangular matrix
= η ( m , m ) m , m { 1 , , M } ,
such that
Σ = Γ Γ ,
where Γ denotes the transpose matrix of Γ . As a result, one can state that, for each m { 1 , , M } , the random variable Z I * ( m ) , m ( · ) can be written as
Z I * ( m ) , m ( · ) = l = 1 m η ( m , l ) ε l ( · ) ,
for some independent standard normal random variables ε 1 ( · ) , , ε M ( · ) . In other words, the relationship between the two matrices in (A18) and (A19) can be given by
z [ j , m ] = l = 1 m η ( m , l ) ε [ j , l ] .
Notice that the η ( m , l ) s do not depend on x t . Hence, we prove that
P ( t , t + τ m ) = P m ε [ j , l ] 1 j J , 1 l m ; a i ( L ) , w i ( L ) i = 1 I ; x t ; τ k k = 0 m ; Θ 1 J j = 1 J F m z [ j , 1 ] , , z [ j , m ] ,
where z [ j , 1 ] , , z [ j , m ] should be considered as a jth realization of the vector of random variables described in (A15). □

Appendix B. Proof of Theorem 2

As shown in (A16), one has
P ( t , t + τ m ) = Ω exp k = 1 m R ( ω ; τ k 1 , τ k ) d Q | F t ( ω ) Ω exp k = 1 m 1 2 τ k τ k 1 i = 1 I c s α i , k x t + β i , k + V i , k Z I * ( k ) , k ( ω ) w i ( L ) d Q | F t ( ω ) .
As each of the Z I * ( m ) , m ( ω ) s is a standard Gaussian random variable, then we can adopt a freeze approach. That is, for a fixed standard Gaussian random variable Z ( · ) , one can assert that
Z I * ( m ) , m ( ω ) Z ( ω ) ,
for all integers m. As a consequence, one obtains
P ( t , t + τ m ) exp k = 1 m 1 2 τ k τ k 1 i = 1 I c s α i , k x t + β i , k + V i , k z w i ( L ) φ ( z ) d z ,
where φ denotes the probability distribution of the standard Gaussian random variable. Then, one needs to evaluate integrals of the form
I = G ( z ) φ ( z ) d x = 1 π G 2 z exp ( z ) d x .
According to the Gaussian–Hermite quadrature approach, one has
G 2 z exp ( z ) d x j = 1 J G 2 a j ( H ) w j ( H ) ,
where the a j ( H ) , w j ( H ) j = 1 J s represent the abscissas and weights corresponding to Gaussian–Hermite quadrature. Then, the result stated in Theorem 2 can be obtained from (A31) and (A32) by taking function G as
G ( z ) exp k = 1 m 1 2 τ k τ k 1 i = 1 I c s α i , k x t + β i , k + V i , k z w i ( L ) .

References

  1. Brigo, D.; Mercurio, F. Interest Rate Models—Theory and Practice: With Smile, Inflation and Credit; Springer: Berlin/Heidelberg, Germany, 2006. [Google Scholar] [CrossRef]
  2. Leblon, G.; Moraux, F. Quadratic, affine and hybrid Gaussian term structure models in discrete time: Theory and evidence. In Proceedings of the Finance International Meeting AFFI-EUROFIDAI, Paris, France, 17–18 December 2009. [Google Scholar] [CrossRef]
  3. Cox, J.C.; Ingersoll, E.I., Jr.; Ross, S.A. A theory of the term structure of interest rates. Econometrica 1985, 53, 385–407. [Google Scholar] [CrossRef]
  4. Leippold, M.; Wu, L. Asset pricing under the quadratic class. J. Financ. Quant. Anal. 2002, 37, 271–295. [Google Scholar] [CrossRef]
  5. Black, F. Interest rate as options. J. Financ. 1995, 50, 1371–1376. [Google Scholar] [CrossRef]
  6. Kim, D.H.; Priebsch, M. Estimation of Multi-Factor Shadow-Rate Term Structure Models; Federal Reserve Board Discussion Paper Series; Federal Reserve Board: Washington, DC, USA, 2013.
  7. Krippner, L. Modifying Gaussian Term Structure Models When Interest Rates Are Near the Zero Lower Bound; Reserve Bank of New Zealand Discussion Paper Series; Reserve Bank of New Zealand: Wellington, New Zealand, 2012. [Google Scholar]
  8. Richard, S. A Non-Linear Macroeconomic Term Structure Model; The Wharton School Research Paper: Philadelphia, PA, USA, 2013. [Google Scholar]
  9. Wu, J.C.; Xia, F.D. Measuring the macroeconomic impact of monetary policy at the zero lower bound. J. Money Credit. Bank. 2016, 48, 253–291. [Google Scholar] [CrossRef]
  10. Meucci, A.; Loregian, A. Neither “normal” nor “lognormal”: Modeling interest rates across all regimes. Financ. Anal. J. 2016, 72, 68–82. [Google Scholar] [CrossRef]
  11. Vasicek, O. An equilibrium characterization of the term structure. J. Financ. Econ. 1977, 5, 177–188. [Google Scholar] [CrossRef]
  12. Abramowitz, M.; Stegun, I.A. Handbook of Mathematical Functions: With Formulas, Graphs, and Mathematical Tables; United States Government Printing Office: Washington, DC, USA, 1964.
  13. Wan, E.; Van Der Merwe, R. The unscented Kalman filter for nonlinear estimation. In Proceedings of the Adaptive Systems for Signal Processing, Communications, and Control Symposium, Lake Louise, AB, Canada, 4 October 2000; pp. 153–158. [Google Scholar] [CrossRef]
  14. Kennedy, J.; Eberhart, R. Particle swarm optimization. In Proceedings of the IEEE International Conference on Neural Networks, Perth, WA, Australia, 27 November–1 December 1995; pp. 1942–1948. [Google Scholar] [CrossRef]
  15. ECB. AAA-Rated Euro-Area Yield Curve, 2004–2012. Available online: https://www.ecb.europa.eu/stats/financial_markets_and_interest_rates/euro_area_yield_curves/html/index.en.html (accessed on 1 July 2024).
  16. Christensen, J.H.E.; Rudebusch, G.D. Modeling yields at the zero lower bound: Are shadow rates the solution? Dyn. Factor Model. 2016, 35, 75–125. [Google Scholar] [CrossRef]
  17. Monfort, A.; Pegoraro, F.; Renne, J.P.; Roussellet, G. Staying at zero with affine processes: A new dynamic term structure model. J. Econom. 2017, 201, 348–366. [Google Scholar] [CrossRef]
  18. Uhlenbeck, G.E.; Ornstein, L.S. On the theory of the Brownian motion. Phys. Rev. 1930, 36, 823. [Google Scholar] [CrossRef]
  19. Christensen, J.H.E.; Diebold, F.X.; Rudebusch, G.D. The affine arbitrage-free class of Nelson-Siegel term structure models. J. Econom. 2011, 164, 4–20. [Google Scholar] [CrossRef]
  20. Thrun, S.; Burgard, W.; Fox, D. Probabilistic Robotics; Intelligent Robotics and Autonomous Agents Series; The MIT Press: Cambridge, MA, USA, 2005. [Google Scholar]
  21. Dang-Nguyen, S.; Rakotondratsimba, Y. On the Generation of Negative Yields under the Vasicek One-Factor Model. 22 December 2014; Available at SSRN. [Google Scholar] [CrossRef]
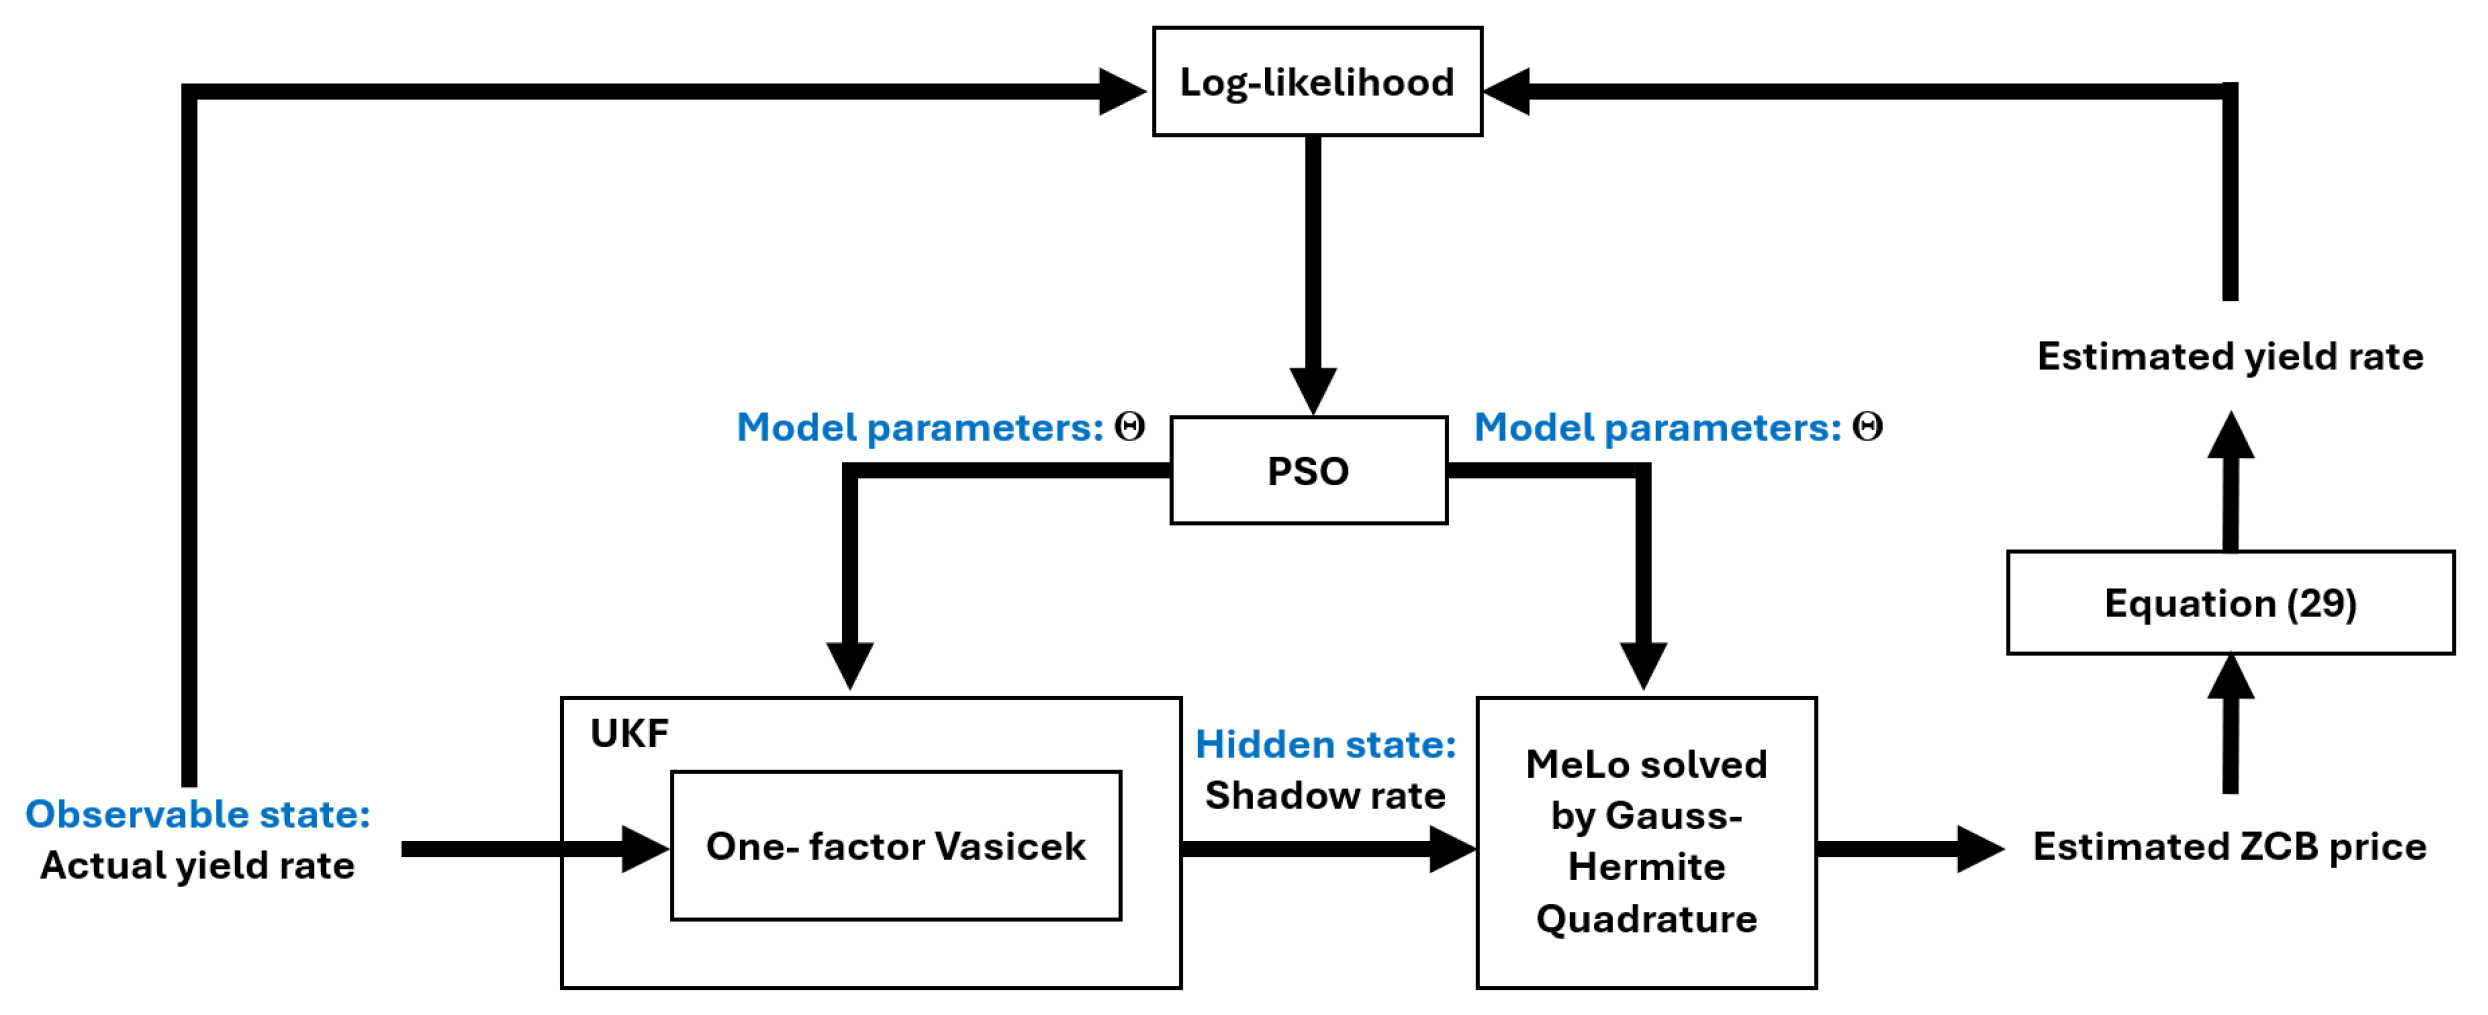
Figure 1. Block diagram that summarizes the MeLo-1-V model that we propose in this work with all the components that intervene during the optimization stage.
Mathematics 12 02690 g001
Figure 2. Shadow-rate data used to generate synthetic data are compared to the estimated shadow rate using the approach proposed in the present work. These results show the satisfactory performance of the estimation procedure. Recall that the time step between two consecutive samples is Δ = 5 350 .
Mathematics 12 02690 g002
Figure 3. Comparison results between the actual yield rates (in blue) and the estimated ones (in red). The residuals between the actual and the estimated values are also represented (in black). Recall that the time step between two consecutive samples is Δ = 5 350 .
Mathematics 12 02690 g003
Figure 4. The AAA-rated Euro-area yield rates published by the European Central Bank (from 6 September 2004 to 21 June 2012 (a period that concerns the ZLB framework)) [15].
Mathematics 12 02690 g004
Figure 5. Comparison results between the estimated shadow rate and the yield rate corresponding to the shortest time to maturity (3 months).
Mathematics 12 02690 g005
Figure 6. Estimation of yield rates using the MeLo-1-V model that we propose in this work (for time-to-maturity values that range from 3 months to 15 years), where the AAA-rated Euro-area yield rates published in [15] are used as “measured observation” (ranging from 6 September 2004 to 21 June 2012 (a period that concerns the ZLB framework)).
Mathematics 12 02690 g006
Figure 7. A zoomed-in plot for the yield rates with 3-month maturity ranging from 16 August 2010 to 12 November 2010.
Mathematics 12 02690 g007
Figure 8. The sensitivity of the estimated yield rate with respect to the estimated shadow rate is shown for various time-to-maturity values. The estimation is performed from the AAA-rated Euro-area yield rates (from 6 September 2004 to 21 June 2012 (a period that concerns the ZLB framework)) shown in Figure 4.
Mathematics 12 02690 g008
Figure 9. Comparison between the yield rates obtained using the Vasicek model and those obtained using the MeLo-1-V model using the parameter values corresponding to Example 1, Example 3, and Example 5.
Mathematics 12 02690 g009
Table 1. Statistics of the actual AAA-rated Euro-area yield rates ranging from 6 September 2004 to 21 June 2012 (a period that concerns the ZLB framework) (all the values are in percentages).
MaturityMinMaxMeanStdSkewnessKurtosis1Q2Q3Q
3 months−0.02444.51161.96201.44800.20131.52660.48112.05423.5388
6 months0.01484.66502.07971.43040.18951.54550.67162.08303.5441
9 months0.03044.82862.19671.36580.17761.64620.97272.15253.6033
1 year0.07084.87342.31271.28940.13571.76361.29452.21893.6097
3 years0.95864.76813.17760.7458−0.52112.71792.78513.29623.7141
5 years1.99804.88073.85790.4881−0.62043.02623.53643.97034.2129
10 years3.11805.74114.53840.46590.03732.24554.14774.52914.9369
15 years2.83655.51444.49290.5141−0.23662.29644.10054.48254.9547
Table 2. Statistics of the estimated yield rates (all the values are in percentages).
MaturityMinMaxMeanStdSkewnessKurtosis1Q2Q3Q
3 months0.00004.46271.94671.38960.19751.60290.63841.90253.3335
6 months0.00364.50712.11201.33460.15451.63780.89682.08443.4368
9 months0.02794.54772.26681.28090.11661.67401.12872.25253.5322
1 year0.07994.58482.41181.22840.08431.70931.33872.40763.6206
3 years1.12364.78823.27950.8759-0.04441.88682.55193.30234.1293
5 years2.12004.88813.78830.6423-0.07751.94693.26143.80884.4092
10 years3.39984.94914.34010.3556-0.08271.96474.04894.35134.6834
15 years3.88504.91034.50250.2371-0.07111.94984.30774.50904.7317
Table 3. Statistics of the residuals of synthetically generated yield rates and the estimated ones shown in Figure 3 (all the values are in percentages).
MaturityMinMaxMeanMedianStdMAERMSE
3 months−0.88801.2776−0.0581−0.05410.38110.29400.3842
6 months−0.92391.0959−0.0574−0.08060.38810.31560.3910
9 months−0.82651.0415−0.0386−0.03980.37000.30040.3708
1 year−1.13210.9634−0.0443−0.04110.37860.30650.3800
3 years−0.91650.7445−0.0293−0.02190.35030.28820.3504
5 years−0.85171.0144−0.0126−0.01870.33760.26900.3367
10 years−0.71060.6723−0.0389−0.01420.26410.20860.2661
15 years−0.59810.5265−0.0038−0.01410.22920.18460.2285
Table 4. Statistics of the residuals of actual AAA-rated Euro-area yield rates and the estimated ones shown in Figure 6 (all the values are in percentages).
MaturityMinMaxMeanMedianStdMAERMSE
3 months−0.54071.24520.01530.03850.17790.13900.1785
6 months−0.47330.3394−0.0324−0.00390.15890.12760.1621
9 months−1.38010.4284−0.0703−0.08730.17080.14780.1847
1 year−1.63170.4660−0.0992−0.09500.20090.16310.2240
3 years−0.89261.0397−0.1022−0.19080.40120.35510.4139
5 years−0.88151.39980.0692−0.03520.53280.45520.5371
10 years−0.86181.60630.19800.14160.55500.46330.5891
15 years−1.07491.1497−0.0100−0.07660.47100.39020.4710
Table 5. Negative interest rates under the Vasicek model. All the yield-rate values are in percentages, while the time-to-maturity values are in years.
MaturityYield (Ex. 1)Yield (Ex. 2)Yield (Ex. 3)Yield (Ex. 4)Yield (Ex. 5)
1/125.79575.79110.2480−0.4961−4.8534
4/125.77185.73050.2165−0.4901−4.5738
6/125.69815.53450.1019−0.4854−4.1859
8/125.58015.2154−0.0915−0.4858−3.8324
15.41914.7768−0.3615−0.4910−3.5098
24.36871.8931−2.1652−0.5580−2.4706
32.7224−2.6475−5.0306−0.6928−1.7293
40.5467−8.6592−8.8389−0.8881−1.1891
5−2.0974−15.9733−13.4820−1.1368−0.7870
6−5.1548−24.4364−18.8616−1.4330−0.4815
7−8.5753−33.9090−24.8885−1.7709−0.2448
8−12.3132−44.2644−31.4815−2.1454−0.0580
9−16.3273−55.3877−38.5670−2.55180.0921
10−20.5799−67.1744−46.0782−2.98600.2146
12−29.6680−92.3696−62.1415−3.92280.4015
15−44.3380−133.0506−88.0919−5.45160.5906
20−70.1354−204.6084−133.7631−8.16880.7806
25−96.0515−276.5105−179.6724−10.92030.8947
30−120.9957−345.7247−223.8763−13.58140.9708
35−144.3949−410.6574−265.3527−16.08571.0252
50−203.6505−575.1068−370.4153−22.45041.1230
Table 6. Comparison between the Vasicek model and the MeLo-1-V model. All the yield-rate values are in percentages, while the time-to-maturity values are in years.
Case 1Case 2
MaturityYield
(Vasicek)
Yield
(MeLo-1-V)
Diff.Yield
(Vasicek)
Yield
(MeLo-1-V)
Diff.
1/122.50472.50470.00000.02460.5361−0.5115
4/122.51422.51420.00000.07290.6468−0.5739
6/122.52822.52820.00000.14290.7898−0.6469
8/122.54212.54210.00000.21030.9140−0.7037
12.55592.55580.00010.27501.0254−0.7504
22.60942.60910.00030.51011.3910−0.8809
32.66082.66010.00070.71131.6754−0.9641
42.71012.70890.00120.88391.9065−1.0226
52.75742.75560.00181.03222.0977−1.0655
62.80292.80030.00261.15982.2572−1.0974
72.84662.84300.00361.26982.3908−1.1210
82.88852.88400.00451.36482.5026−1.1378
92.92892.92310.00581.44712.5962−1.1491
102.96772.96060.00711.51852.6740−1.1555
123.04113.03080.01031.63452.7912−1.1567
153.14133.12540.01591.75922.8940−1.1348
203.28603.25810.02791.88542.9399−1.0545
253.40753.36490.04261.95602.8964−0.9404
303.51043.45070.05971.99832.8073−0.8090
353.59823.51920.07902.02542.6967−0.6713
503.79523.64750.14772.06762.3444−0.2768
Table 7. Comparison between the Vasicek model and the MeLo-1-V model. All the yield-rate values are in percentages while the time-to-maturity values are in years.
Example 1Example 3Example 5
MaturityYield
(Vasicek)
Yield
(MeLo-1-V)
Yield
(Vasicek)
Yield
(MeLo-1-V)
Yield
(Vasicek)
Yield
(MeLo-1-V)
1/125.79575.86180.24801.7537−4.85340.0128
4/125.77186.18520.21652.8204−4.57380.0204
6/125.69816.65050.10193.8359−4.18590.0403
8/125.58017.0312−0.09154.5639−3.83240.0728
15.41917.3388−0.36155.1264−3.50980.1170
24.36878.0579−2.16526.4461−2.47060.3570
32.72248.2548−5.03066.9329−1.72930.6075
40.54678.1533−8.83896.9861−1.18910.8208
5−2.09747.8840−13.48206.8093−0.78700.9906
6−5.15487.5285−18.86166.5191−0.48151.1222
7−8.57537.1376−24.88856.1822−0.24481.2232
8−12.31326.7417−31.48155.8356−0.05801.3007
9−16.32736.3579−38.56705.49880.09211.3601
10−20.57995.9952−46.07825.18110.21461.4058
12−29.66805.3454−62.14154.61520.40151.4675
15−44.33804.5553−88.09193.93240.59061.5139
20−70.13543.6158−133.76313.12650.78061.5297
25−96.05152.9812−179.67242.58350.89471.5112
30−120.99572.5303−223.87632.19760.97081.4782
35−144.39492.1955−265.35271.91051.02521.4389
50−203.65051.5688−370.41531.37101.12301.3141
Disclaimer/Publisher’s Note: The statements, opinions and data contained in all publications are solely those of the individual author(s) and contributor(s) and not of MDPI and/or the editor(s). MDPI and/or the editor(s) disclaim responsibility for any injury to people or property resulting from any ideas, methods, instructions or products referred to in the content.