Abstract
Microwave-assisted mechanical rock breaking represents an innovative technology in the realm of mining excavation. The intricate and variable characteristics of geological formations necessitate a comprehensive understanding of the interplay between microwave-induced rock damage and the subsequent deterioration in rock strength. This study conducted microwave irradiation damage assessments on 78 distinct rock samples, encompassing granite, sandstone, and marble. A total of ten critical parameters were identified: Microwave Irradiation Time (MIT), Microwave Irradiation Power (MIP), Longitudinal Wave Velocity prior to Microwave Treatment (LWVB), Longitudinal Wave Velocity post-Microwave Treatment (LWVA), Percentage Decrease in Longitudinal Wave Velocity (LWVP), Porosity before Microwave Treatment (PB), Porosity after Microwave Treatment (PA), Percentage Increase in Porosity (PP), and Uniaxial Compressive Strength following Microwave Treatment (UCSA). Utilizing the Pied Kingfisher Optimizer (PKO) alongside Extreme Gradient Boosting (XGBoost), we developed a PKO-XGBoost machine learning model to elucidate the relationship between UCSA and the nine additional parameters. This model was benchmarked against other prevalent machine learning frameworks, with Shapley additive explanatory methods employed to assess each parameter’s influence on UCSA. The findings reveal that the PKO-XGBoost model provides superior accuracy in delineating relationships among rock physical properties, microwave irradiation variables, microscopic attributes of rocks, and UCSA. Notably, PA emerged as having the most significant effect on UCSA, indicating that microwave-induced microscopic damage is a primary contributor to reductions in rock strength. Additionally, MR exhibited substantial influence; under identical microwave irradiation conditions, rocks with lower density demonstrated greater susceptibility to strength degradation. Furthermore, during microwave-assisted rock breaking operations, it is imperative to establish optimal MIT and MIP values to effectively diminish UCSA while facilitating mechanical cutting processes. The insights derived from this research offer a more rapid, cost-efficient approach for accurately assessing correlations between microwave irradiation parameters and resultant rock damage—providing essential data support for enhancing mechanical rock-breaking efficiency.
Keywords:
microwave irradiation; machine learning; microwave-assisted mechanical rock breaking; Shapley additive explanatory (SHAP); rock damage; meta-heuristic optimization algorithms MSC:
74-10
1. Introduction
The development of underground resources presents the challenge of efficiently and economically excavating and fragmenting rock formations while simultaneously ensuring the long-term stability of caverns and tunnels [1,2,3]. This inherent conflict arises from differing objectives within these processes, representing a significant concern in the field of rock mechanics [4]. In underground rock mass engineering, both drilling and blasting techniques, as well as mechanical methods such as Tunnel Boring Machines, are routinely utilized [5]. While the drilling and blasting method offers considerable adaptability, it can induce irreversible blast-induced vibrations that damage surrounding structures, thereby compromising the stability of goafs, caverns, and tunnels [6]. This instability subsequently undermines the support mechanisms essential for safe subsequent operations in underground rock mass engineering [7].
The uniaxial compressive strength (UCS) of hard rock materials is a fundamental parameter widely utilized in the excavation and fracturing of rock masses [8,9,10]. Variations in lithology can exacerbate issues such as tool wear during the rock-breaking process, leading to increased construction costs and diminished efficiency [11]. Currently, there is an urgent need for the introduction of novel auxiliary rock-breaking techniques to fracture rocks with higher UCS effectively. Consequently, a primary focus within the domain of hard rock excavation and fracturing lies in enhancing mechanical rock-breaking efficiency while simultaneously reducing construction costs [12,13].
Currently, the primary methods employed to assist mechanical rock breaking include high-energy laser irradiation, high-pressure liquid nitrogen jets, and supercritical CO2 jet techniques [14,15,16,17,18]. The high-energy laser irradiation method rapidly heats localized regions of rock, thereby enhancing its cutability by weakening mechanical properties through thermal stress. The high-pressure liquid nitrogen jet technique generates three significant temperature gradients in a brief timeframe, resulting in rock damage due to intense thermal shock effects. Supercritical CO2 fluid combines the low viscosity and high diffusivity characteristic of gases with the elevated density typical of liquids; these unique properties allow for impact stresses that can induce rock fracturing. However, these methods are limited by their capacity to fracture only small volumes of rock and their sensitivity to working condition constraints, which restricts their application primarily to oil and gas drilling operations. Consequently, there is an urgent need for innovative auxiliary rock-breaking technologies capable of facilitating large-scale pre-fracturing in hard rocks across expansive working faces [19].
Industrial microwave irradiation, extensively employed in material analysis, processing, and pollutant degradation, is distinguished by its rapid heating rate, uniformity, and high efficiency [20,21,22]. Comprehensive theoretical and experimental studies have demonstrated that microwave irradiation can significantly compromise rock integrity, thereby reducing its strength and enhancing the efficiency of mechanical rock breaking [23]. This technology presents substantial potential for future advancements in hard rock fracturing processes. The initial concept of applying microwaves to hard rock metal mining entails utilizing them either independently or synergistically with mining machinery for tunneling or extraction purposes, ultimately facilitating continuous mining of metal ores. Lin et al. [24] developed a proprietary microwave-induced fracturing and cutting system specifically designed for true triaxial hard rock, investigating the microwave fracturing process, cracking mechanisms, and their implications for subsequent cutting, grinding, and mineral liberation. Compared to untreated samples, those subjected to combined stress and microwave irradiation exhibited increased total rock fragmentation and powder content in ore products—indicating that microwaves can enhance subsequent mechanical mining operations as well as grinding and mineral beneficiation processes. The researchers [25] further examined the effects of various microwave antenna types, power levels, and working distances on the reflection coefficient and heating characteristics of Sishanling iron ore. They optimized the working distance for effective microwave fracturing under true triaxial stress conditions; based on observed arcing phenomena within the ore matrix, they proposed an improved design for the microwave antenna. Lehmann et al. [26] irradiated over 700 samples composed of granite alongside three different grades of concrete while conducting comprehensive geotechnical tests. Their findings revealed that microwave pretreatment serves as an effective strategy for artificially reducing rock strength—thereby accelerating the advancement rates of tunnel boring machines and other mining equipment. Ahmed et al. [27] introduced a novel experimental method to assess two primary rock failure mechanisms induced by microwave treatment without applying any mechanical force. Their results indicated that the presence of microwave-absorbing minerals leads to localized heat concentration within the rock matrix; UCS-sized samples displayed two distinct heating patterns when subjected to microwave treatment.
Overall, researchers have conducted extensive studies on the deterioration of rock due to microwave irradiation, investigating both the underlying mechanisms and experimental aspects. These investigations focus on elucidating the connections between microwave exposure and resultant rock damage. Microwave irradiation induces high-temperature fracturing of mineral particles within the rock, leading to a reduction in overall rock mass strength. This decrease in strength enhances the effectiveness of mechanical rock-breaking equipment when fracturing materials with high UCS. However, previous studies have seldom addressed the practical application of microwave-assisted rock breaking within mining environments. In this context, a critical consideration is the optimal selection of microwave irradiation parameters to maximize the efficiency of mechanical rock fragmentation. Excessively high microwave power or prolonged irradiation times can lead to energy wastage, process delays, and increased operational costs. Conversely, insufficiently calibrated microwave parameters may fail to establish adequate conditions for pre-cracking the rock, thereby complicating subsequent mechanical fragmentation efforts.
In fact, rock conditions in different mines exhibit significant variability, and even within the same mining area, factors such as groundwater presence and geological faults can lead to further discrepancies in rock conditions. Consequently, the strength of the rock encountered during excavation is often inconsistent [28,29]. This inconsistency poses challenges in adjusting microwave irradiation parameters throughout the application process, thereby impeding timely and effective pre-cracking of the rock [30]. If a correlation between microwave-induced rock damage and subsequent strength degradation could be established, along with rapid assessment methods for determining post-irradiation strength characteristics, it would facilitate quick and flexible adjustments to the microwave-assisted rock-breaking process based on specific rock properties [31]. Such advancements would significantly enhance the efficiency of mechanical fragmentation operations.
Given the high costs and time-consuming nature of experiments designed to ascertain the fracture characteristics of rock under microwave irradiation, this study innovatively employs machine learning methodologies [32,33,34]. Initially, microwave irradiation and uniaxial strength experiments were conducted in established laboratories to assess variations in UCS across diverse rock samples subjected to different microwave irradiation conditions. Throughout these experiments, the fracture and damage phenomena induced by microwave exposure were meticulously considered. Nuclear magnetic resonance (NMR) and acoustic testing techniques were utilized to capture pore damage characteristics within the rock both before and after microwave treatment. Furthermore, we developed a nonlinear correlation model that integrates microwave irradiation parameters with pre- and post-irradiation rock damage characteristics using a coupled approach involving a metaheuristic optimization algorithm alongside extreme gradient boosting (XGBoost). This model establishes relationships between these variables and the UCS of rock materials following microwave exposure. By formulating an innovative analytical model for understanding the weakening in rock strength due to microwave irradiation, we elucidated degradation patterns in rock strength subsequent to treatment. Additionally, our proposed model facilitates rapid adjustments of microwave irradiation parameters tailored to various lithologies during mechanical rock-breaking processes—effectively reducing UCS while optimizing mechanical fragmentation efficiency.
2. Methodology
2.1. Microwave-Induced Rock Fracture Test Research
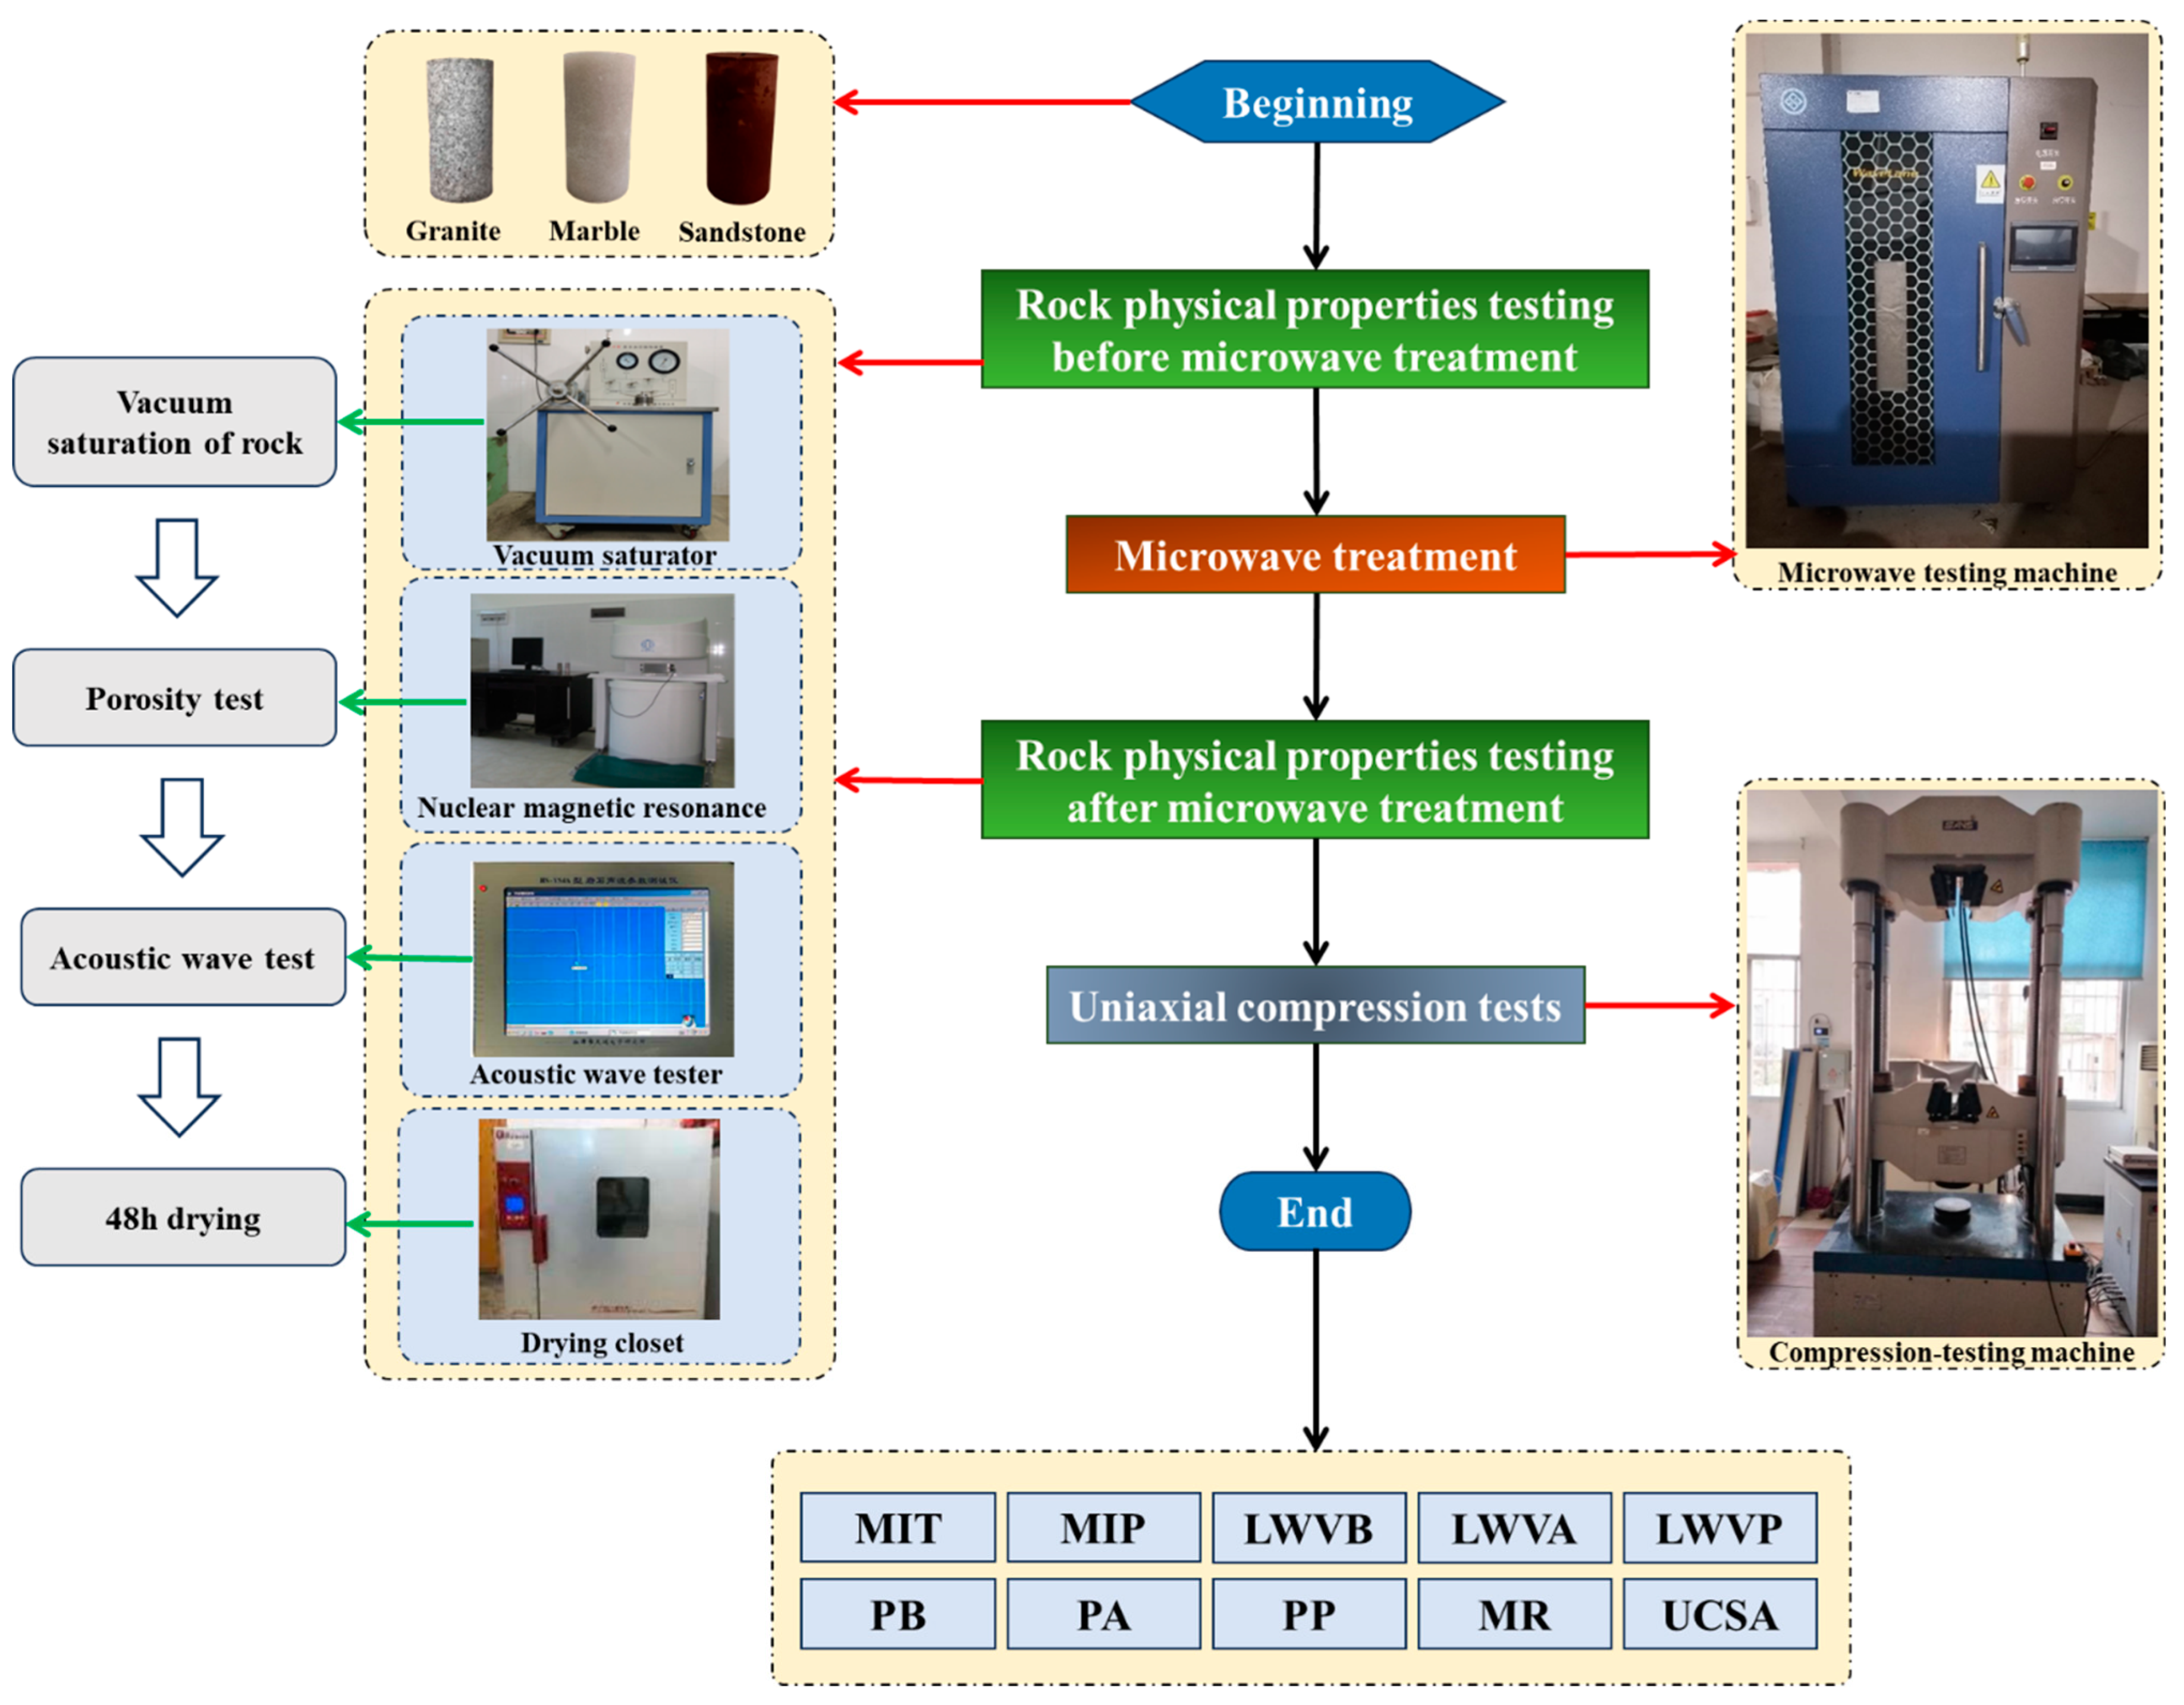
Data on microwave-induced weakening strength of rocks were obtained through experimental methods, with the procedure illustrated in Figure 1. The experimental protocol primarily involved measuring the physical parameters of the specimens, vacuum saturation, porosity assessment, P-wave velocity testing, sample drying, exposure to microwave radiation, and subsequent analysis. Three types of rock samples representing different lithologies (granite, marble, and sandstone) were selected for these experiments. The rock specimens were machined into cylindrical shapes with a diameter of 50 mm and a height of 100 mm, resulting in a total of 78 samples. Microwave irradiation was conducted using a self-developed WLKJ-D9 industrial microwave oven. For acoustic testing of the rocks, we utilized the HS-YS4A rock acoustic parameter tester, developed in China. Porosity measurements were performed using our custom-designed AniMR-150 nuclear magnetic resonance imaging system tailored for rocks [35]. Uniaxial compression tests were executed with a ZZY-C microcomputer-controlled pressure testing machine, also developed in China. Vacuum saturation and drying processes for the rock samples employed conventional equipment.

Figure 1.
Test process.
Prior to the experiment, the physical parameters of the rock samples were measured, with a particular emphasis on determining the mass of rock (MR/Kg). During the experimental phase, we systematically adjusted various microwave irradiation parameters, including Microwave Irradiation Time (MIT, values: 0 min, 1 min, 3 min, 5 min, 6 min, 7 min, 12 min, 18 min, and 24 min) and Microwave Irradiation Power (MIP, values: 0 kW, 3 kW, 4 kW, 5 kW, 6 kW, and 9 kW). These adjustments aimed to replicate actual conditions encountered in microwave-assisted rock fracturing during mechanical rock breaking.
Before and after the microwave irradiation of the rock samples, we conducted a series of procedures, including vacuum saturation, porosity measurement, P-wave velocity testing, and sample drying. These procedures were implemented to obtain wave velocity characteristics that reflect changes in rock porosity before and after microwave treatment, as well as variations in the porosity of the rock samples. The key parameters measured included: Longitudinal Wave Velocity Before Microwave Treatment (LWVB) in m/s; Longitudinal Wave Velocity After Microwave Treatment (LWVA) in m/s; Percentage Decrease in Longitudinal Wave Velocity (LWVP); Porosity Before Microwave Treatment (PB) expressed as a percentage; Porosity After Microwave Treatment (PA) expressed as a percentage; and Percentage Increase in Porosity (PP).
Finally, through a uniaxial compression test, we obtained the Uniaxial Compressive Strength after Microwave Treatment (UCSA) measured in MPa. In subsequent research, our objective is to establish a correlation model between UCSA and various physical parameters of the rock samples, microwave irradiation parameters, and microparameters of the rocks before and after microwave treatment using machine learning algorithms. This model will facilitate rapid predictions of UCSA.
2.2. Extreme Gradient Boosting (XGBoost)
We commence our analysis with Extreme Gradient Boosting (XGBoost), a sophisticated algorithm rooted in decision tree methodologies [36]. Decision trees are widely utilized in machine learning for both classification and regression tasks, owing to their user-friendliness, interpretability, resilience to missing data, and capacity to handle irrelevant features. However, traditional decision trees exhibit significant limitations, including instability, sensitivity to variations in data distribution, a tendency to overfit training datasets, and inconsistent generalization performance. To mitigate these challenges, advancements in artificial intelligence research have fostered the development of various strategies wherein researchers have concentrated on enhancing decision trees by integrating weak learners into more robust models through ensemble methods [37].
The primary focus of XGBoost lies in data prediction, with particular emphasis on the following areas: it constructs a robust predictive model by integrating multiple weak regressors or classifiers, leveraging efficient parallel processing capabilities. It excels in both classification and regression tasks, making it extensively utilized in data mining and predictive analytics domains. Within the XGBoost framework, an optimized objective function (1) is established, incorporating regularization terms to mitigate overfitting, thereby enabling the generation of rapid and reliable models suitable for diverse engineering simulations.
In this context, represents a real number, indicates the prediction made in the r-th iteration, gr refers to the configuration of the decision tree, denotes the loss function, and signifies the regularization term defined by the subsequent equation:
In this context, T represents the total number of leaves, w denotes their weight, and the coefficients λ and γ are typically assigned default values of λ = 1 and γ = 0.
In alignment with the fundamental principles of the XGBoost algorithm, meticulous parameter selection is essential for achieving reliable predictive outcomes in nonlinear regression tasks [38]. Table 1 delineates the key parameters pertinent to XGBoost regression analysis. Among these, three pivotal parameters—num_trees, max_depth, and eta—exert a significant influence on prediction results. These parameters are frequently adjusted manually during the computational process to enhance goodness-of-fit metrics. However, manual tuning introduces the risk of subjective biases that may result in suboptimal solutions and elevate the likelihood of convergence at local optima.

Table 1.
XGBoost calculation parameters.
2.3. Pied Kingfisher Optimizer (PKO)
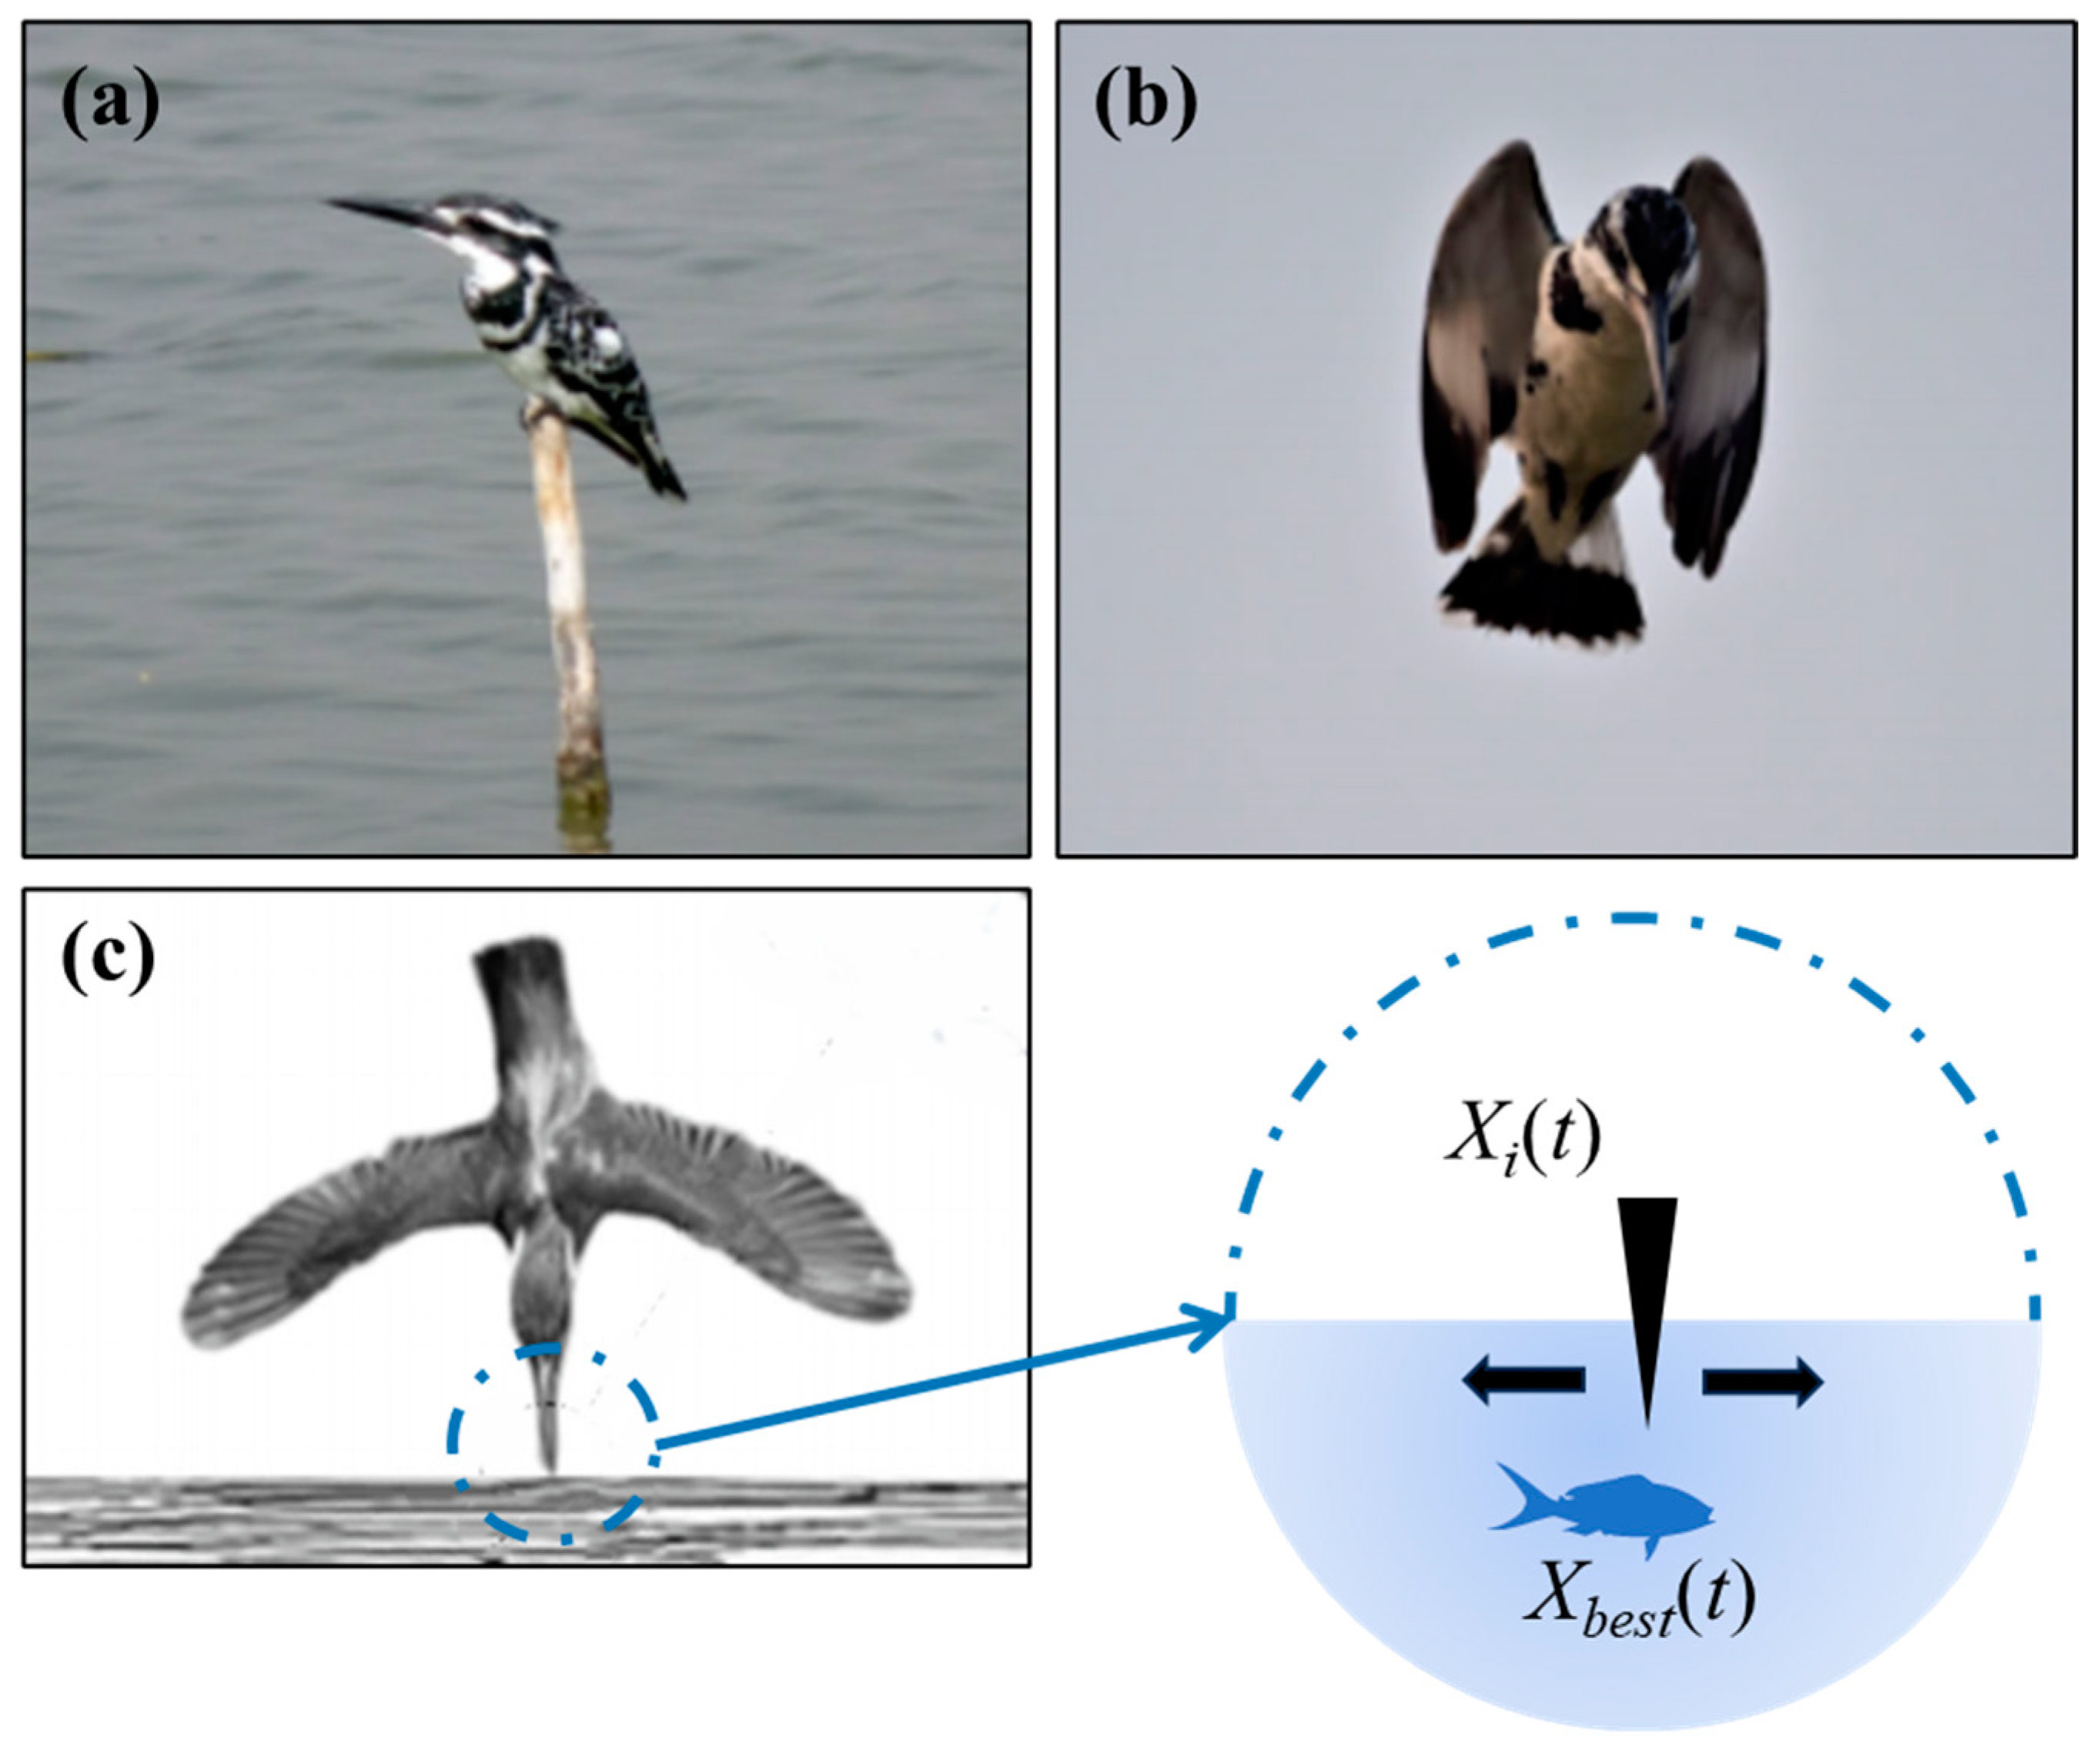
To mitigate the effects of parameter selection on optimizing the XGBoost model, we employ a Pied Kingfisher Optimizer (PKO) to meticulously fine-tune our predictive model’s parameters [39]. The PKO is an optimization algorithm rooted in swarm intelligence, drawing inspiration from the distinctive hunting strategies and cooperative behaviors exhibited by pied kingfishers in their natural environment. This methodology contains two fundamental phases that mirror these birds’ behavior: perching or hovering above their prey (exploration/diversification) and subsequently diving for it (exploitation/intensification), as illustrated in Figure 2. Furthermore, this algorithm integrates these symbiotic characteristics into mathematical frameworks, facilitating effective solutions to a variety of optimization challenges across diverse search environments.
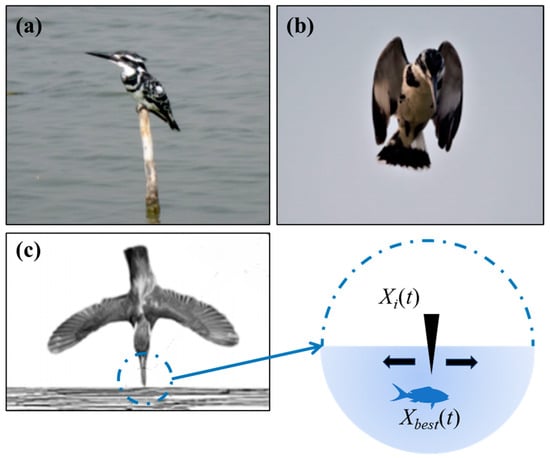
Figure 2.
Principles of PKO algorithm ((a,b). Perching and hovering strategies; (c). Diving for prey).
- (1)
- Initialization phase
PKO initiates the search process by randomly generating a set of initial solutions from the search space as the first attempt:
where Xi,j represents the position of the i-th individual in the j-th dimension, rand represents a random value between 0 and 1, and UB and LB represent the upper and lower bounds of the search range.
- (2)
- Perching and hovering strategies (Exploration phase)
The exploration phase in the PKO algorithm draws inspiration from the predatory behaviors exhibited by the pied kingfisher, particularly its “perch” and “hover” strategies, as illustrated in Figure 2a,b. During this exploration phase, PKO’s strategy emulates the predation behavior of the pied kingfisher, encompassing several key aspects: 1. Perching: The pied kingfisher adopts a vantage point to survey its surroundings, enabling precise strikes on its prey. In PKO, the habitat state serves as a relatively stable solution position for observing and assessing the quality of current solutions. 2. Hovering: Pied kingfishers hover aloft to gain an enhanced perspective on their prey before executing timely strikes. This process parallels conducting a more refined local search within PKO aimed at identifying superior solutions.
In PKO, the updated formula for location searching simulates these roosting and hovering behaviors. While specific formulations may vary depending on individual implementations of the PKO algorithm, generally speaking, positional update formulas can be articulated as follows:
In any iteration of PKO, the position of a solution is denoted Xi(t) in the current iteration and Xi(t + 1) in the subsequent iteration. The parameters α and T play a crucial role in fine-tuning and optimizing exploration strategies. Specifically, α is defined as 2 × randn(1, dim), where randn(1, dim) represents a value randomly drawn from a normal distribution, with dim indicating the dimensionality of the analysis problem. This parameter governs both the range and step size of the search process, influencing global and local search capabilities by modulating the update step for position adjustments. Meanwhile, parameter T is dynamically modified based on various policies such as “perch” or “hover”. To elaborate:
When perching, the parameter T is expressed as:
where Max_Iter denotes the maximum number of iterations permitted by the algorithm, serving as a stopping criterion. When the algorithm reaches this iteration limit, it will cease its search process even if an optimal solution has yet to be identified. This mechanism ensures that the algorithm can conclude its search within a finite timeframe. The parameter BF is a constant, typically set to 8, and is instrumental in modulating the algorithm’s search behavior, particularly during the exploration phase. Specifically, it influences either the step size of searches or the intensity of exploratory actions. For instance, BF may function as a factor in location update formulas to regulate jumps or adjustments throughout the searching process. Finally, rand represents a random value uniformly distributed between 0 and 1.
When Hovering, the parameter T is expressed as:
where PKO_Fitness(i) and PKO_Fitness(j) are used to indicate the fitness of the i and j individuals, respectively.
- (3)
- Diving for prey (Exploitation/Intensification)
The pied kingfisher’s diving behavior contributes significantly to its effectiveness as a predator, which is a major factor in its success within its natural environment. Its ability to dive quickly and accurately, along with its keen eyesight and sharp beak, allows it to thrive as an efficient hunter in aquatic settings. This behavior is depicted in Figure 2c, and the related mathematical model can be represented as follows:
where PKO_Fitness(i) denotes the fitness value of the i-th individual, which serves as a metric for assessing the quality of individual solutions and is typically correlated with the objective function value. A higher fitness value indicates a superior solution. Best_Fitness represents the maximum fitness value achieved across all iterations, reflecting the quality of the optimal solution identified during the current search process. This metric is frequently employed to update and refine search strategies, thereby steering the algorithm towards enhanced solutions. The variable α functions as a control parameter that modulates both exploration and exploitation phases within the algorithm; it can be computed using α = 2 × randn(1, dim) − 1. Additionally, o and HA signify characteristics pertinent to hunting dynamics—such as hunting efficacy or other optimization factors—which may influence exploratory behavior in the algorithm and facilitate simulations of diverse hunting strategies and search behaviors.
- (4)
- The symbiosis stage
The pied kingfisher has a symbiotic relationship with various species of otters. This relationship implies mutual benefits between the two species without causing harm to each other. The PKO algorithm takes into account this symbiotic relationship, thereby enhancing the operational efficiency of the algorithm. This behavior is mathematically modeled as follows:
where two individuals are randomly selected from the population, and their positions are represented by Xm and Xn. The predation efficiency is expressed by PE, where fixed PEmax and PEmin values are 0.5 and 0, respectively. Through parameter tuning via PE, the algorithm enhances its efficiency in both global and local searches within the solution space, ultimately identifying the optimal parameters.
2.4. The Research Methodology
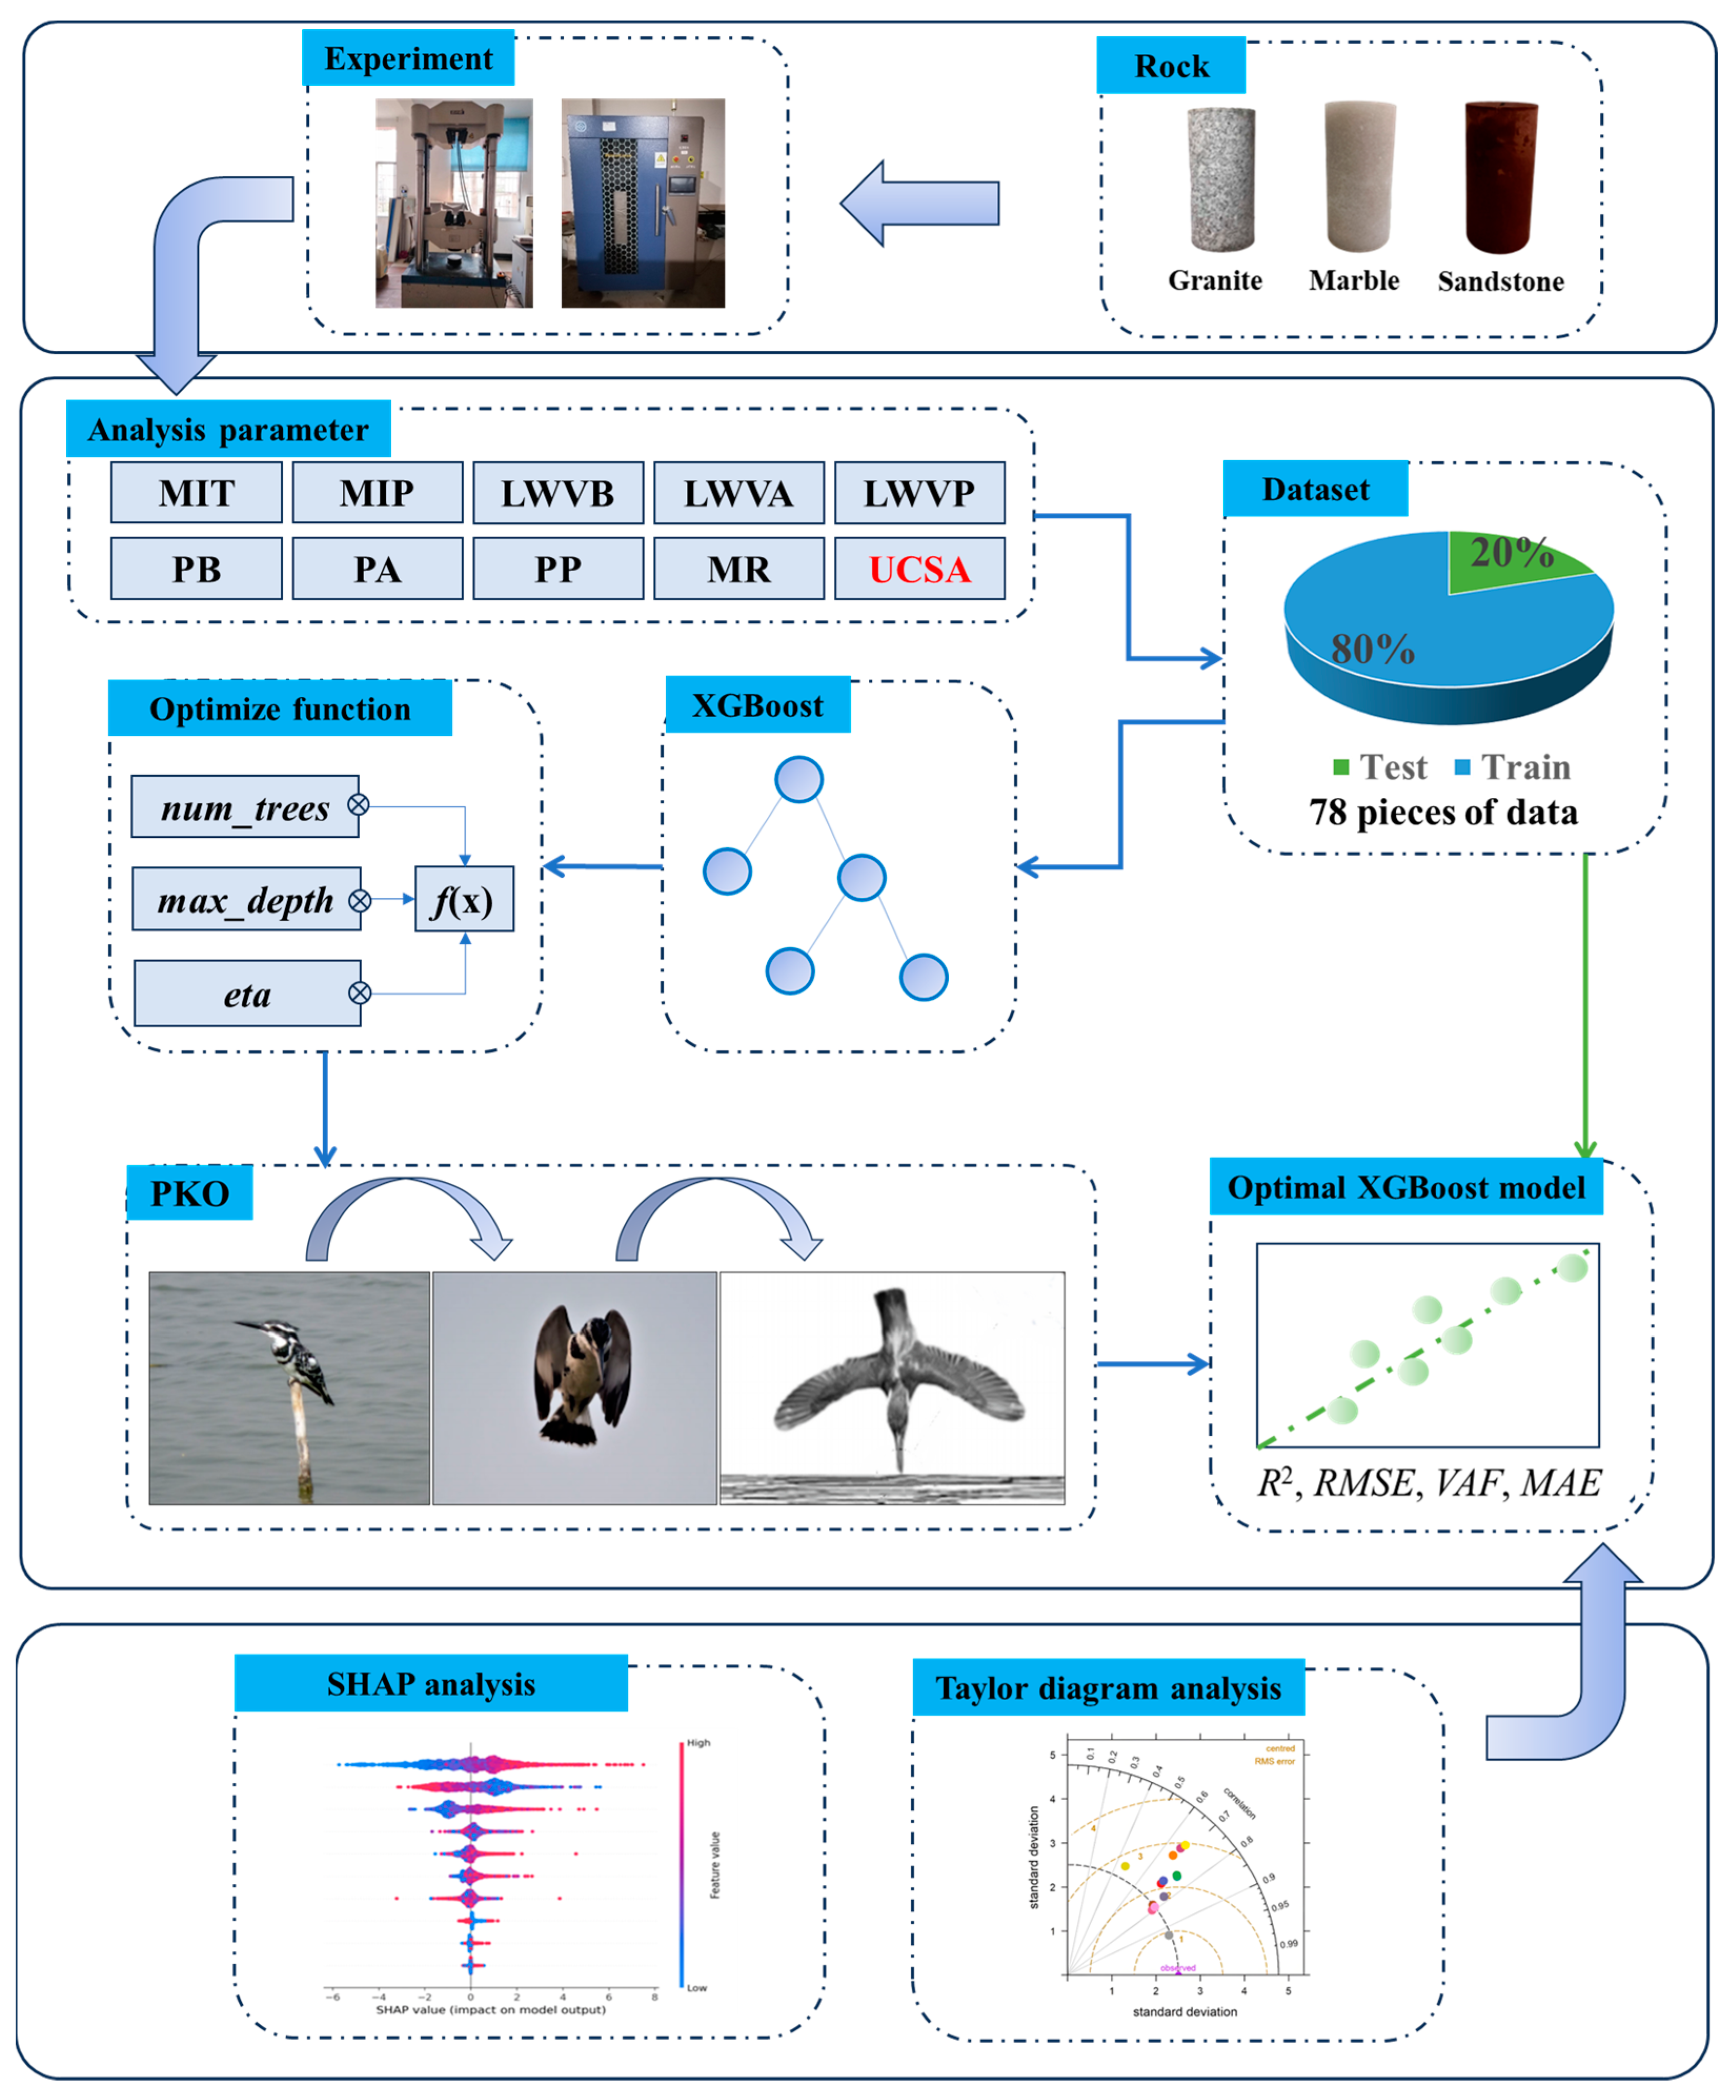
To establish a more precise correlation among rock physical parameters, microwave irradiation conditions, rock microparameters, and UCSA, the optimization principles of the PKO algorithm are integrated with XGBoost to enhance parameter estimation. Figure 3 illustrates the implementation process visually, with detailed steps outlined as follows:
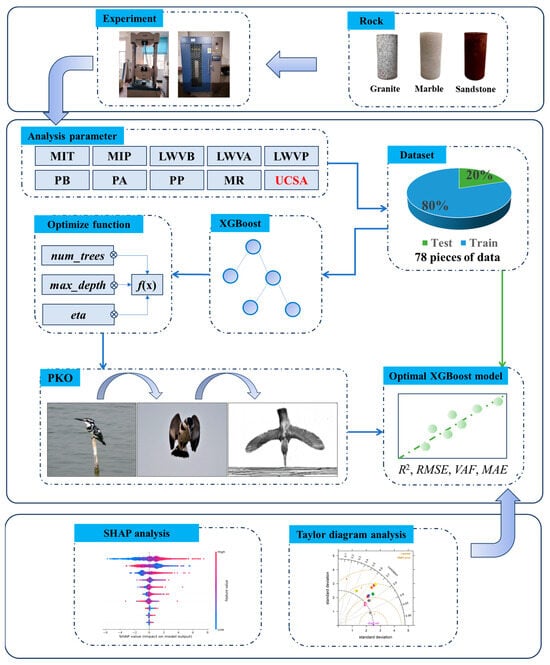
Figure 3.
Calculation flow chart.
- The experimental dataset is constructed and randomly divided into a training set (80%) and a testing set (20%). The rationale behind the random division of data sets is to evaluate the model’s performance across diverse data distributions, thereby mitigating the impact of distributional biases on training outcomes. This approach enhances both the robustness and predictive accuracy of the model.
- A fitness function is designed to optimize XGBoost parameters, including num_trees, max_depth, and eta. In this study, the cross-validation score from multiple optimization iterations of the prediction model serves as the fitness evaluation criterion. Thus, the fitness function can proficiently direct the PKO algorithm in its iterative pursuit of the optimal parameter configuration for the XGBoost model, consequently enhancing predictive performance.
- The PKO algorithm is employed to iteratively improve the process of selecting optimal XGBoost parameters. This iterative process continues until the termination conditions are satisfied, resulting in the determination of optimal parameters.
- The resulting optimal parameters lead to the creation of PKO-XGBoost, which is applied for predicting UCSA and generating subsequent results.
- A comparative analysis using Tylar diagrams is conducted against other machine learning models, while SHAP modeling provides further insights into the relationships among different rock physical properties, microwave irradiation settings, rock microparameters, and UCSA outcomes.
3. Materials
3.1. Dataset Analysis
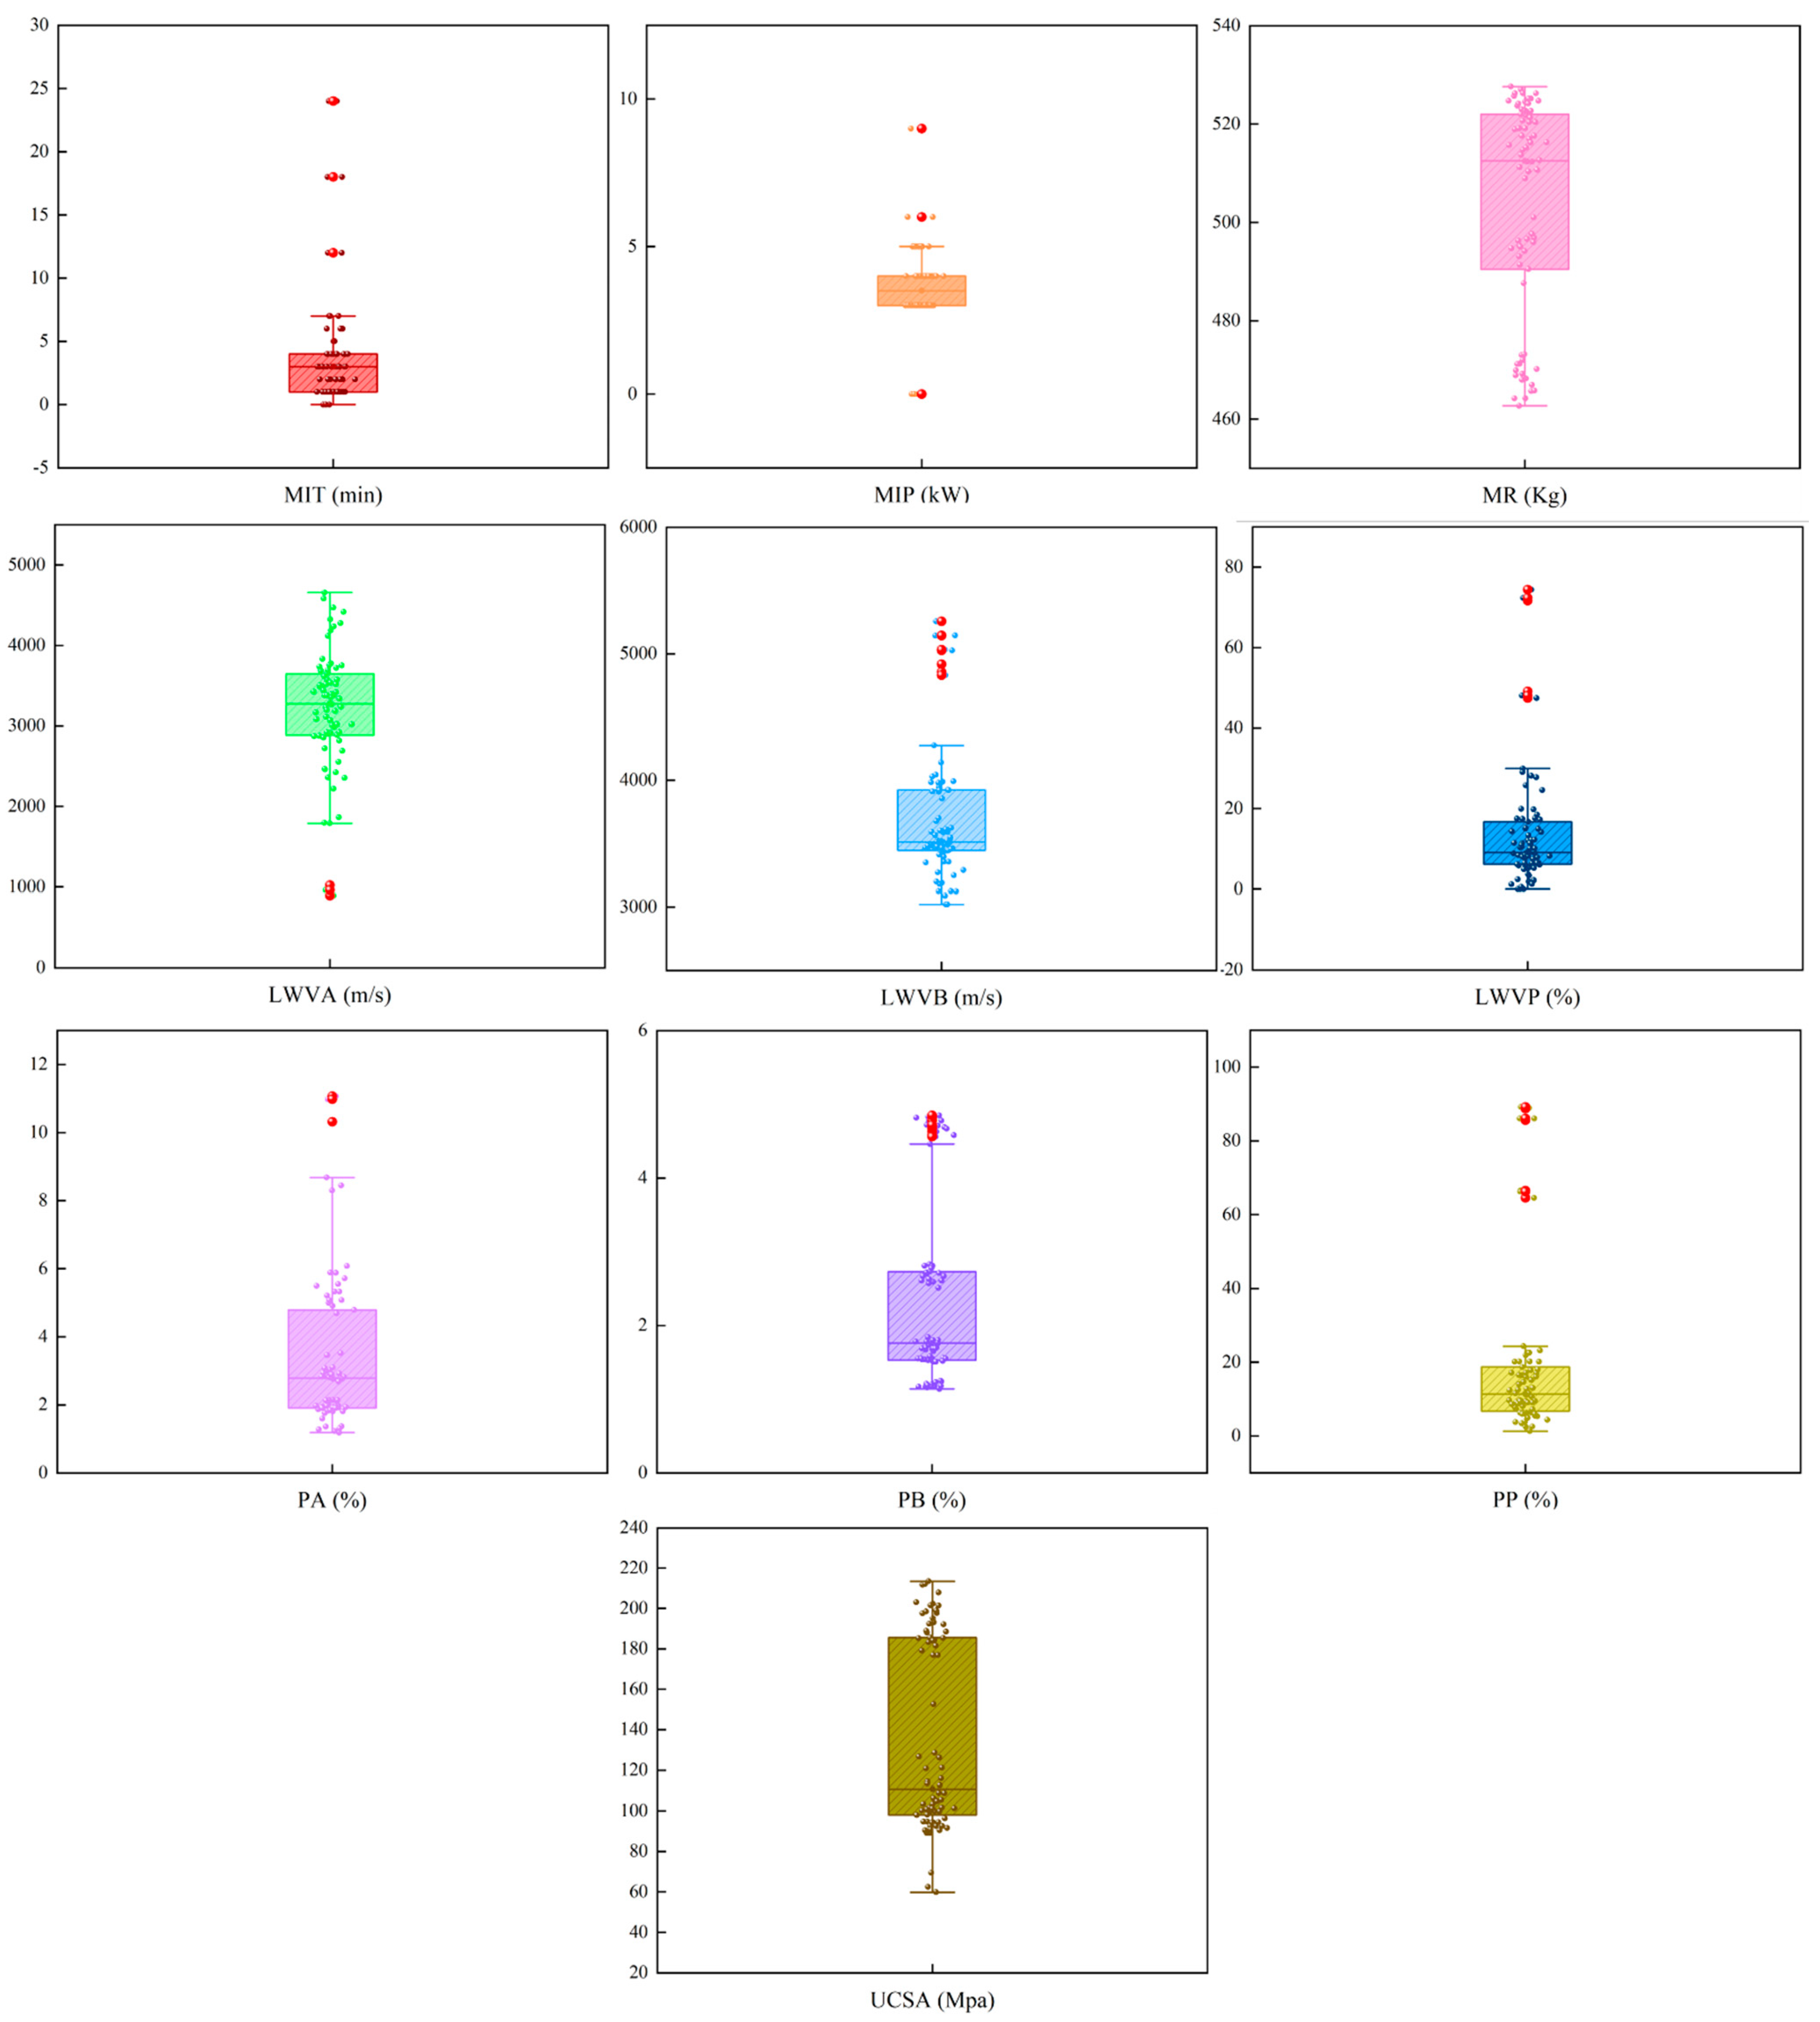
Microwave irradiation test data from 78 distinct rock samples were collected during the experiment, and violin plots were generated to visualize the distributions of MIT, MIP, LWVB, LWVA, LWVP, PB, PA, PP, MR, and UCSA within the dataset (Figure 4). The experimental data demonstrate significant dispersion across groups, which complicates accurate characterization of their relationships using conventional linear mathematical methods. This underscores the imperative of employing machine learning techniques.
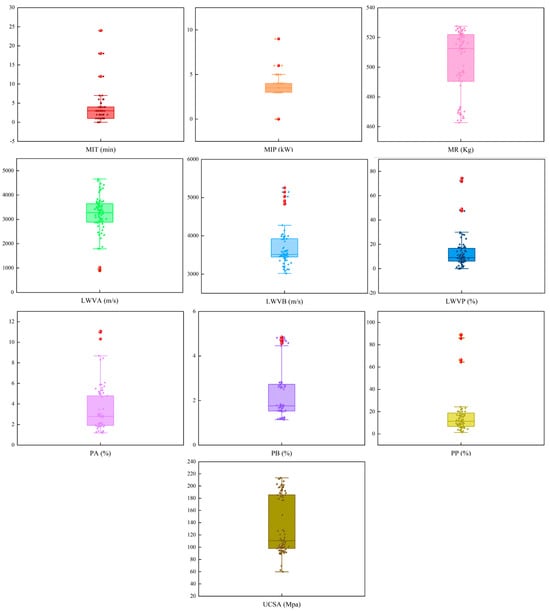
Figure 4.
Violin diagram of dataset. (The enlarged red dots in the figure signify data points that exhibit substantial deviation from the mean).
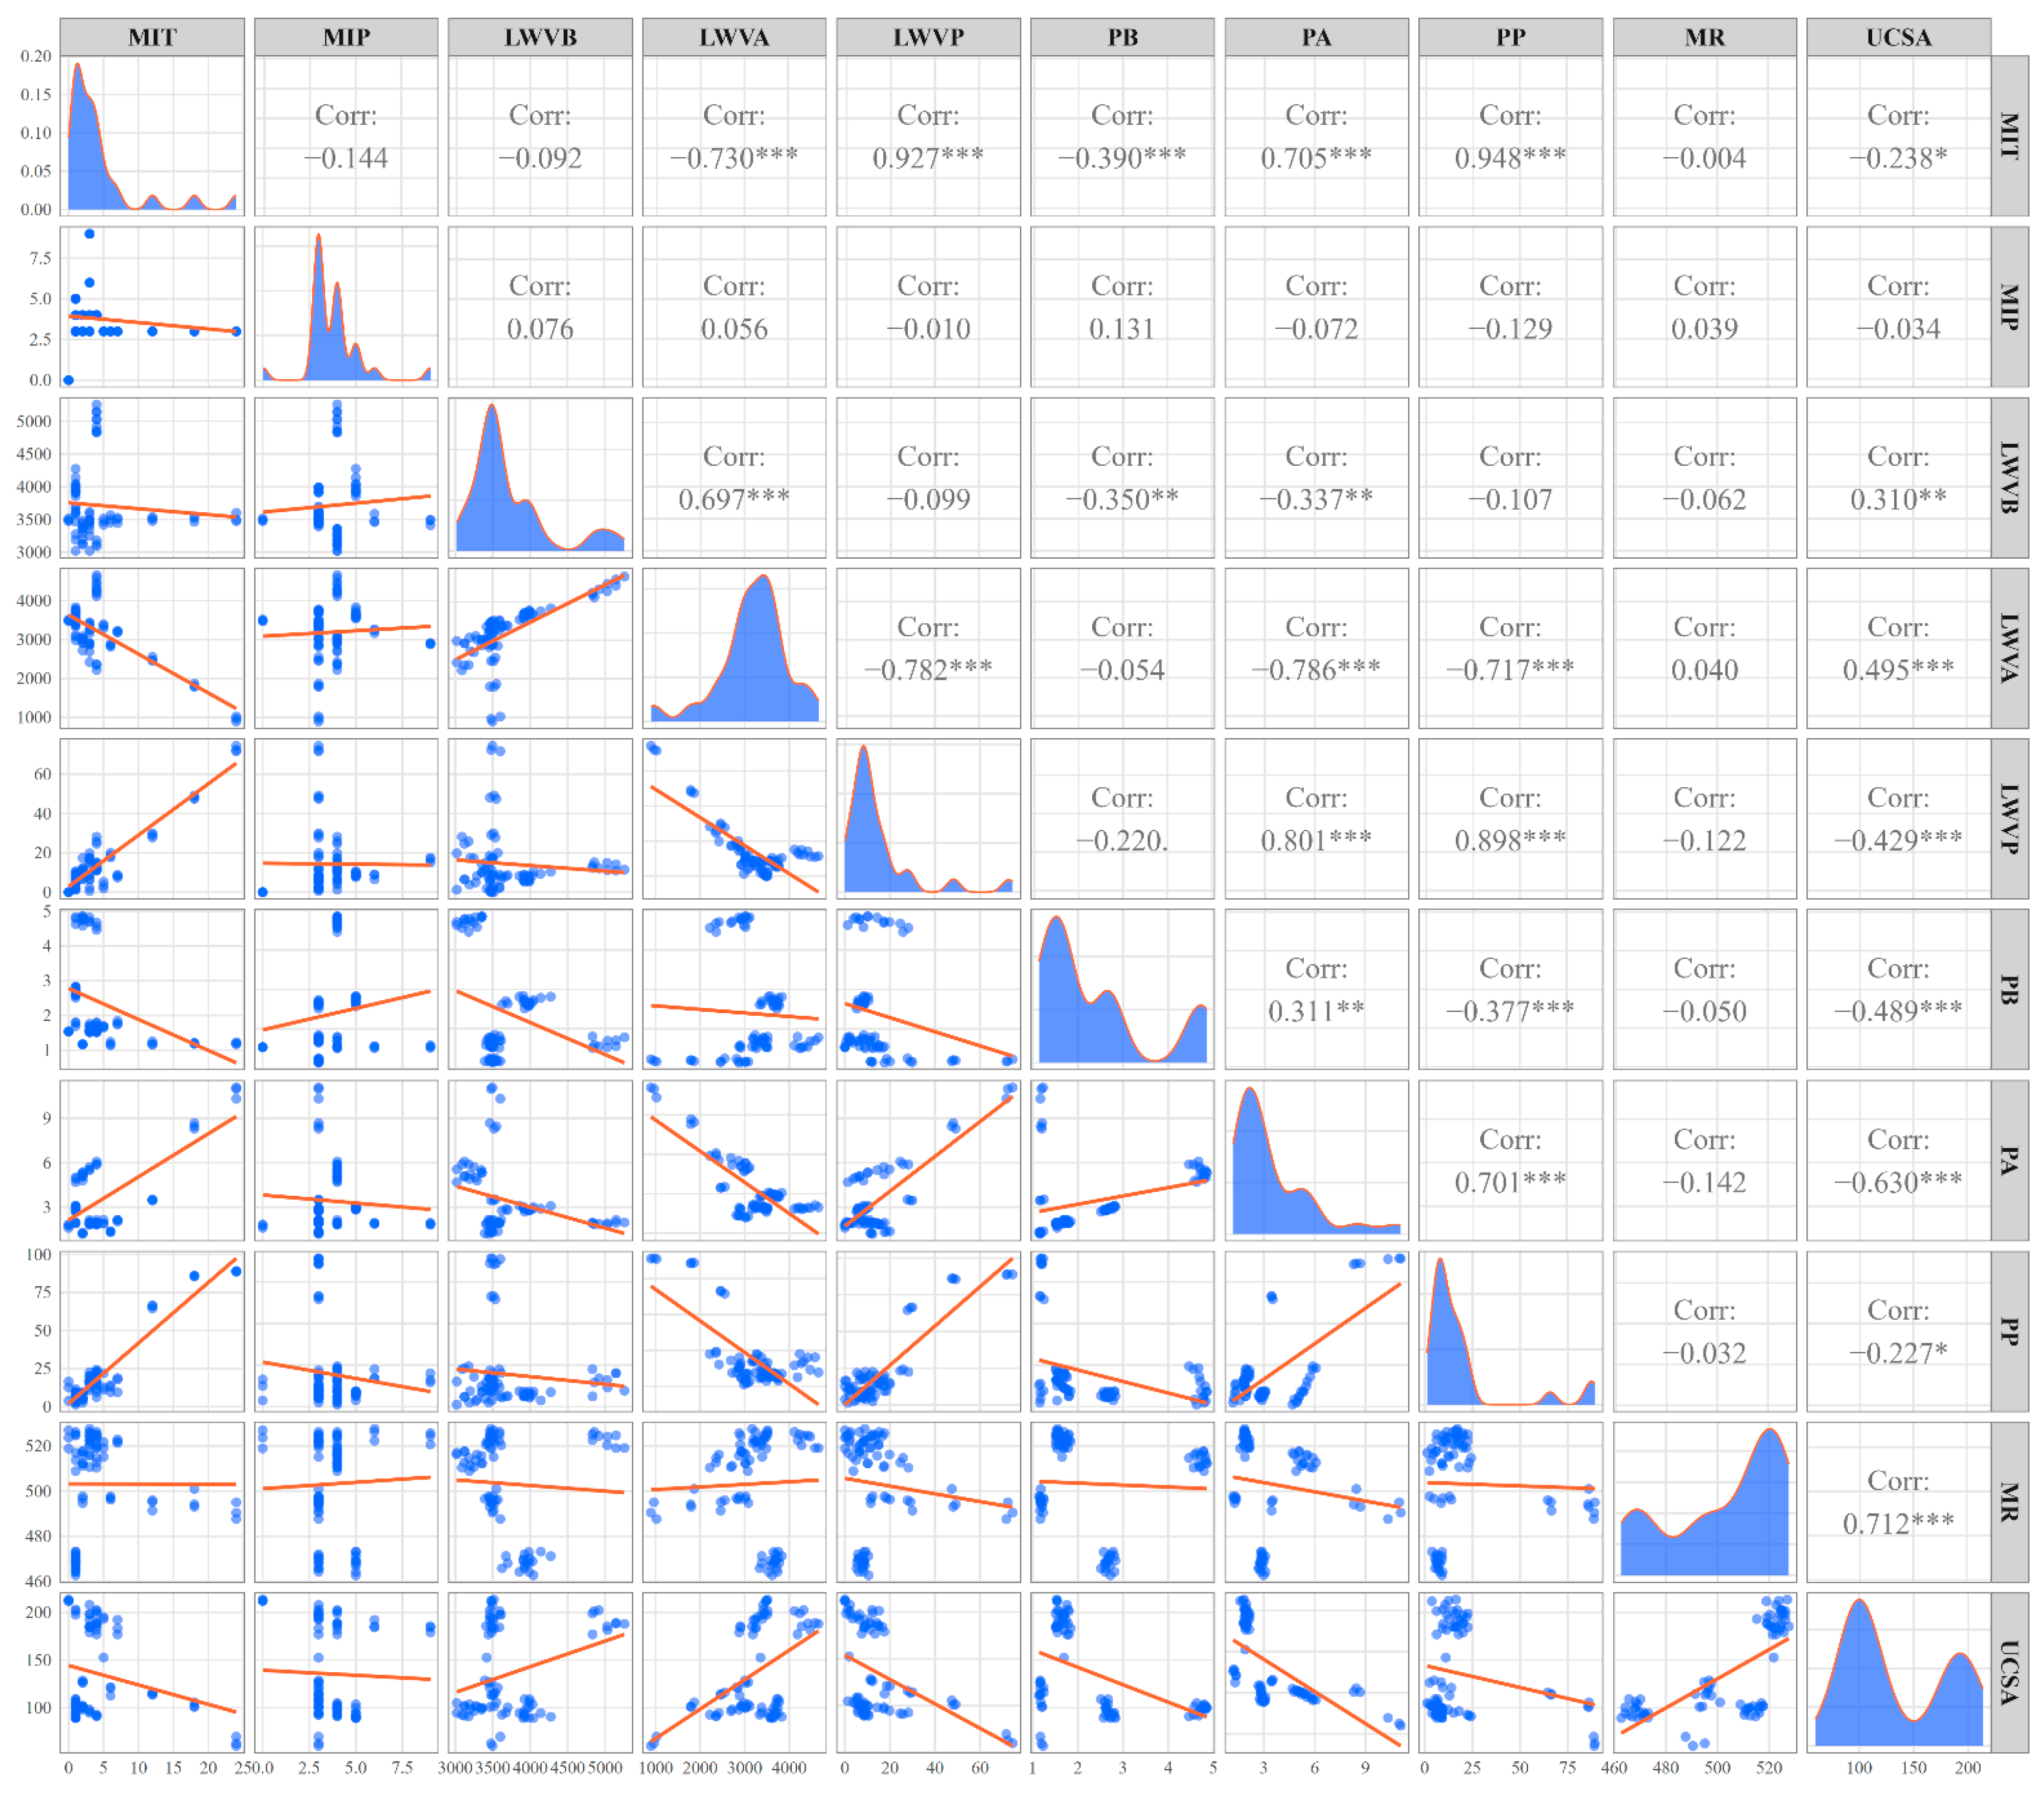
The dataset underwent correlation analysis (Figure 5). The correlation plots of the collected data reveal a nearly non-linear relationship among the data groups, thereby validating the applicability of the proposed PKO-XGBoost model in elucidating such non-linear correlations.
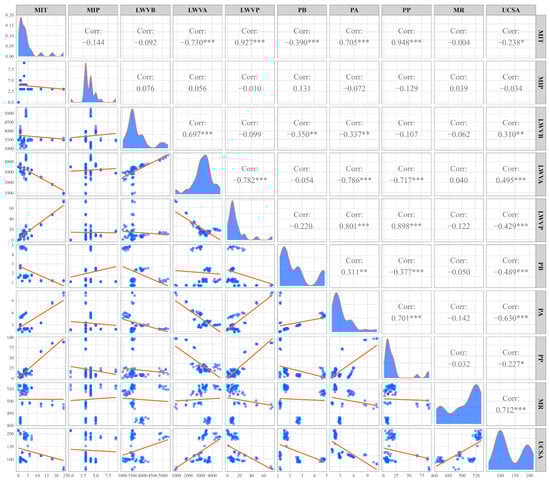
Figure 5.
Correlation matrix analysis of dataset. (* denotes a correlation among the data, and an increase in the quantity of * corresponds to a heightened level of correlation).
As illustrated in the Figure 5, LWVB, LWVP, and MR exhibit a positive correlation with UCSA, with the most pronounced positive correlation observed between MR and UCSA (0.712). This finding indicates that an increase in the mass of rock samples corresponds to higher density, which results in reduced deterioration in strength under identical microwave irradiation parameters. The positive correlations between LWVB, LWVP, and UCSA imply that elevated wave velocity test values are indicative of greater internal integrity, thereby contributing to relatively enhanced strength of the rock samples.
MIT, MIP, LWVP, PB, PA, and PP all demonstrate negative correlations with UCSA. Among these parameters, MIT and MIP pertain to microwave irradiation conditions; increased irradiation time and power further compromise the strength of rock samples. LWVP quantifies the extent of wave velocity reduction before and after microwave irradiation. A decrease in wave velocity signifies an increase in internal rock porosity during irradiation, which subsequently contributes to strength degradation. PB, PA, and PP directly represent the porosity of rocks prior to and following microwave irradiation, indicating that deterioration in rock strength initiates internally. Microwave irradiation induces varying degrees of heating within mineral particles in the rock samples; significant thermal stress results in heightened internal porosity or even crack formation, ultimately leading to a decline in rock strength and a reduction in UCSA.
3.2. Prediction and Evaluation Index
In this study, a coupling model referred to as PKO-XGBoost was developed to elucidate the relationships among rock physical parameters, microwave irradiation settings, rock microstructural characteristics, and UCSA. To assess the reliability of the parameter estimation results derived from the PKO-XGBoost model, various metrics including R2, RMSE, VAF, and MAE were employed to evaluate and analyze the predictive performance of this hybrid model. These metrics primarily serve to examine and characterize how well the predicted UCSA values align with actual experimental data while also validating the explanatory power of the machine learning model concerning the UCSA dataset. The formulas for calculating these evaluation metrics are presented below [40]:
where is the w value, is the predicted UCSA value of the model, is the average of the UCSA values, and N denotes the number of samples in the training or testing stages.
4. Results and Discussions
4.1. Parameter Optimization Results
In accordance with the research methodology previously delineated, we initiated the fine-tuning of parameters for PKO-XGBoost. The population size within a population optimization algorithm is pivotal in influencing optimization accuracy; variations in this size can lead to disparate outcomes. It is generally recommended to select a population size between 20 and 100 [41]. In our investigation, we opted for five distinct populations (20, 40, 60, 80, and 100) alongside conducting 120 iterations. Utilizing the experimental dataset, we applied the PKO-XGBoost algorithm to explore the relationship between UCSA and other variables.
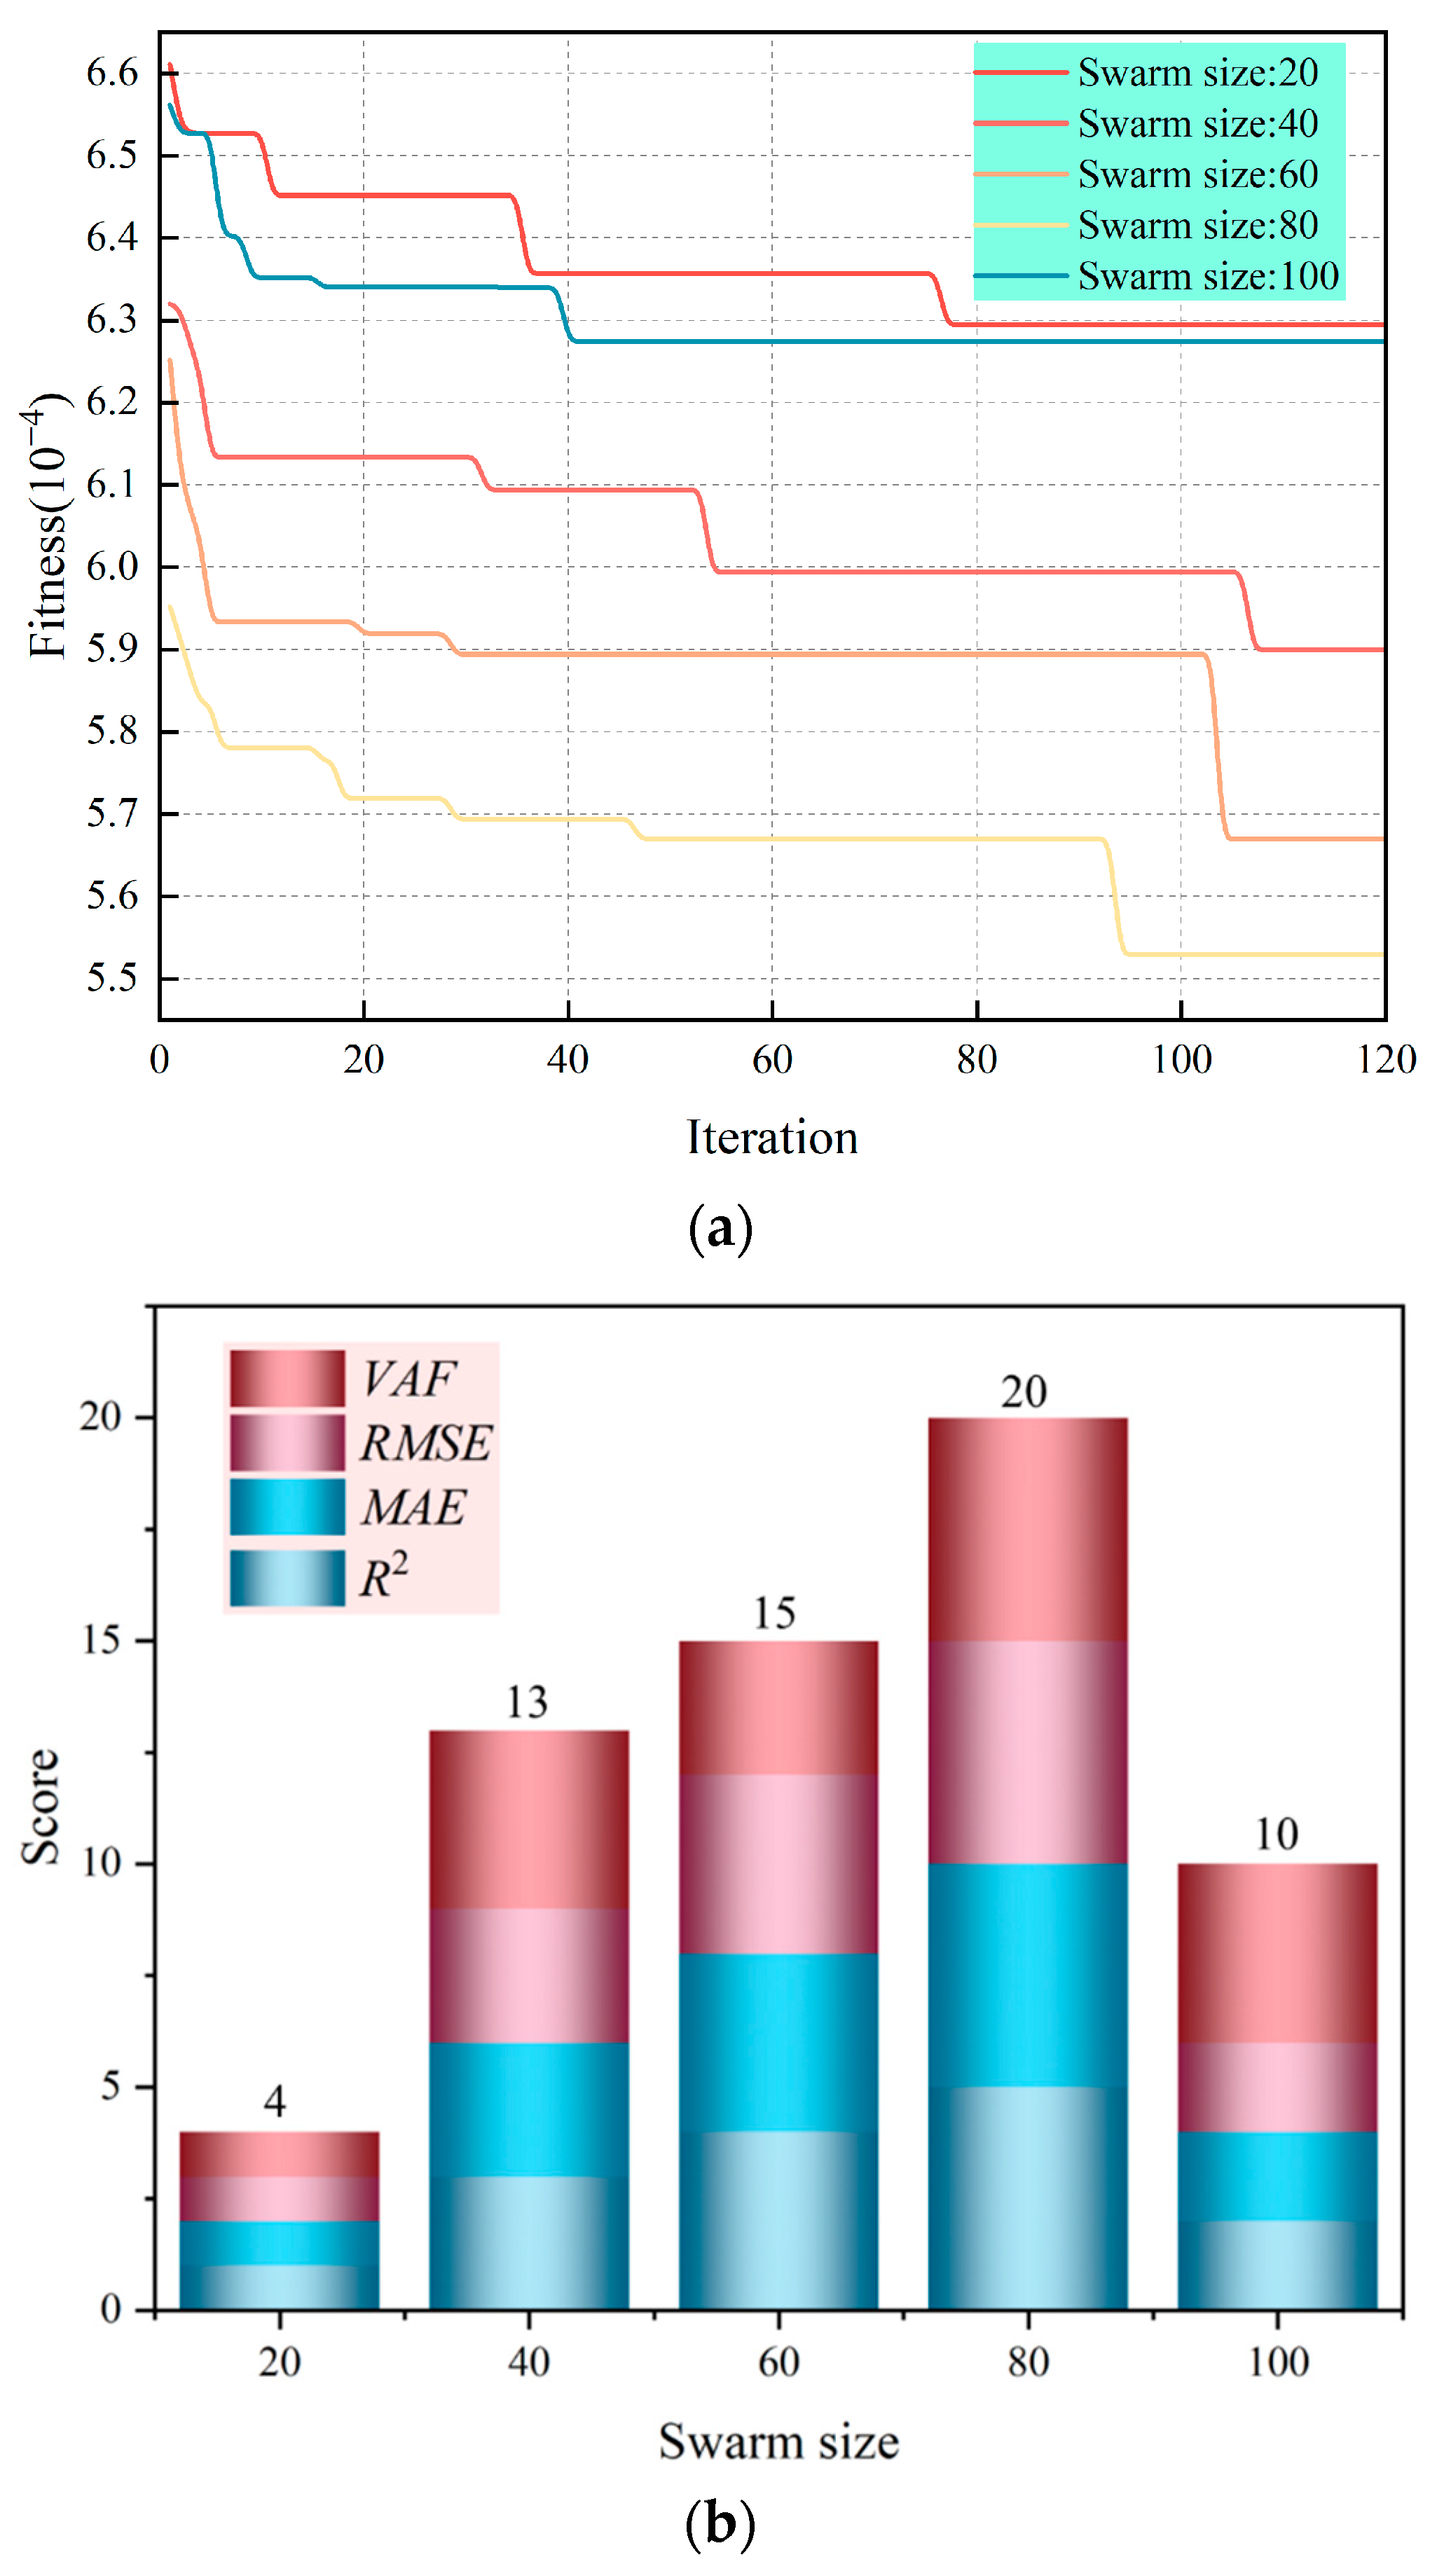
Firstly, we obtained the fitness curve changes of PKO-XGBoost under different population sizes (Figure 6a). For all population sizes, the fitness values converge after 100 iterations. Notably, the fitness value for the group with 80 populations was the lowest (5.52 × 10⁻⁴), indicating that this configuration achieved the optimal value during the optimization process. However, as the number of populations increased to 100, the resulting fitness value instead rose (6.28 × 10⁻⁴) and converged at around 40 iterations, suggesting it may have fallen into a local optimum.

Figure 6.
Comparison of parameter optimization results ((a). Iterative optimization results of different swarm sizes; (b). TOPSIS analysis of different results).
The TOPSIS evaluation method [42] was employed to comprehensively rank the performance indicators of different population size results (Figure 6b). The evaluation indicators and their corresponding scores are detailed in Table 2. Based on various performance metrics, it is evident that a group size of 80 yields the best overall performance. Consequently, the optimization parameters obtained with a population size of 80 were selected as the optimal parameters for subsequent PKO-XGBoost model analysis, as shown in Table 3.
Table 2.
Evaluation index for different swarm sizes.
Table 3.
Optimal calculation parameters.
4.2. Comparative Analysis of Prediction Results
Based on the optimization parameter results, the PKO-XGBoost model with a Swarm size of 80 was selected for further investigation. This model is derived from optimizing key parameters of the XGBoost framework (num_trees, max_depth, and eta) using the PKO algorithm, which enhances its performance in terms of accuracy and generalization capability. To assess the practical efficacy of this model, we conducted rigorous validation using results obtained from a test dataset. During this validation process, we systematically compared the performance of the PKO-XGBoost model against several other prominent models. These comparison models include traditional XGBoost implementations as well as PSO-XGBoost models optimized via particle swarm optimization (PSO) algorithms. Furthermore, we incorporated various widely adopted regression machine learning techniques such as Ridge regression, LASSO regression, support vector machines (SVM), and Random Forest (RF).
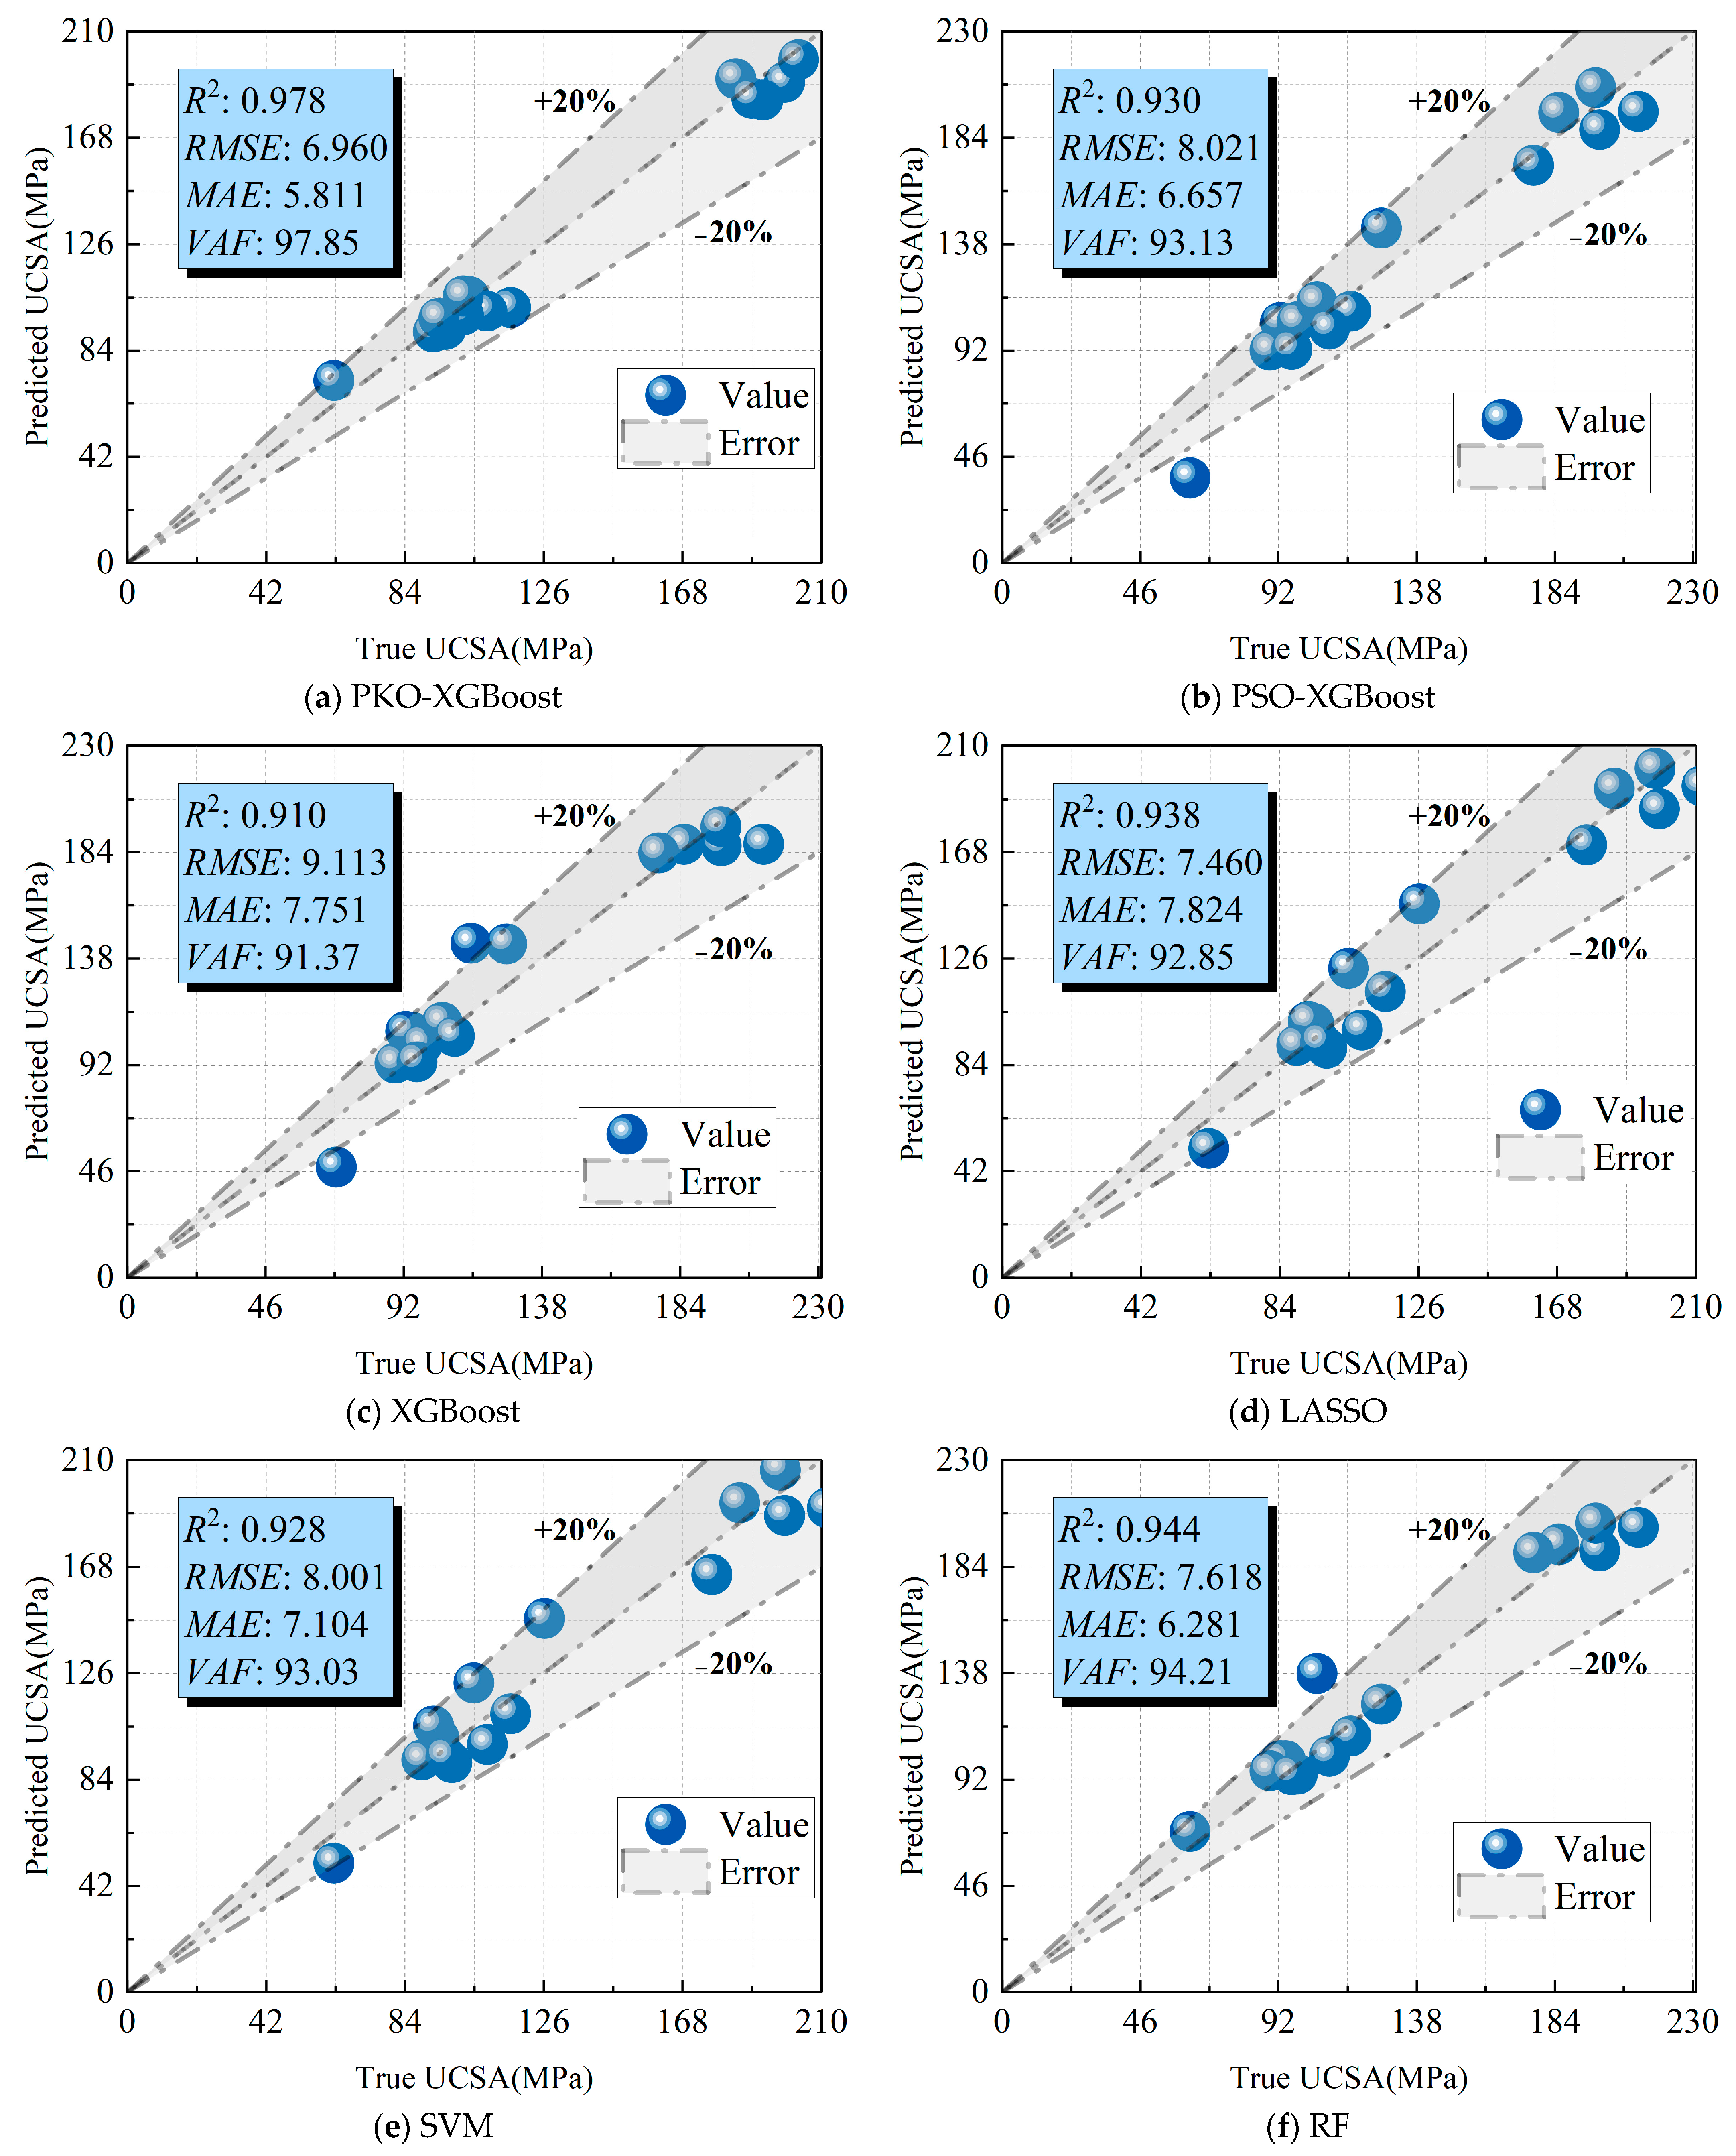
In Figure 7, we present the predictive outcomes of various models alongside a comparative analysis of multiple evaluation metrics. By examining the juxtaposition of predicted values against actual values, one can discern notable differences in prediction accuracy across models. Specifically, data points that are proximate to the correspondence line (y = x) indicate minimal deviation between the model’s predictions and actual observations; thus, closer alignment with this line signifies superior predictive performance. This intuitive visualization approach facilitates a rapid assessment of each model’s strengths and weaknesses. Additionally, Figure 7 illustrates the distribution of data points for each model within a ±20% error margin. The density of data points within this range serves as a critical criterion for evaluating model accuracy; greater concentration indicates enhanced precision and relatively smaller errors.
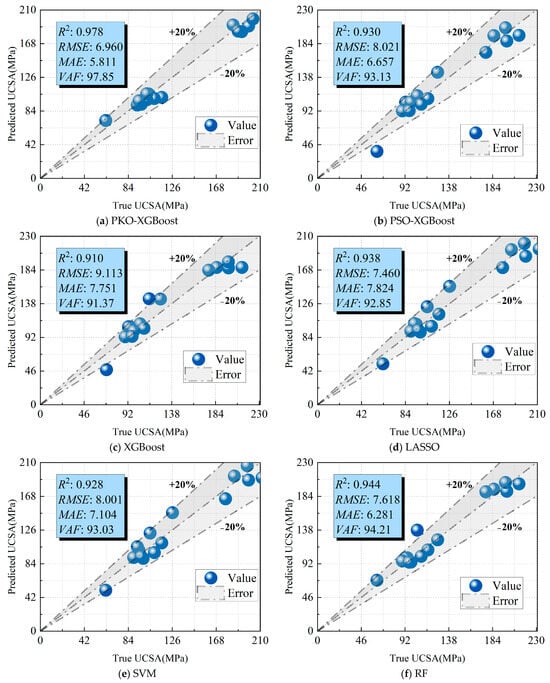
Figure 7.
The outcomes of various methodologies.
The PKO-XGBoost model generally demonstrates the most favorable evaluation metrics for analyzing UCSA, as shown in Figure 7a. With an R2 value of 0.978, it outperforms all other models, signifying a robust correlation between predicted and actual data. Moreover, the VAF for this model reaches 97.85, marking it as the highest among all regression approaches. This indicates that the PKO-XGBoost model has exceptional explanatory capabilities regarding the real UCSA dataset, with its predictions closely matching observed results. Additionally, when assessing errors between predicted and actual values, both MAE and RMSE are at their lowest in the PKO-XGBoost model. This implies that it effectively captures nonlinear relationships within the UCSA dataset while managing variability in prediction outcomes.
The PKO-XGBoost and PSO-XGBoost models exhibit superior accuracy compared to the traditional XGBoost prediction model, as demonstrated in Figure 7b,c. This finding suggests that utilizing population optimization algorithms represents a more effective approach for parameter tuning in XGBoost, leading to enhanced predictive performance. Furthermore, various optimization techniques significantly influence parameter selection within XGBoost. A comparative analysis of predicted results against actual values indicates that the PKO algorithm substantially outperforms the PSO algorithm in terms of optimization efficacy. Given that particle swarm optimization often converges at local optima, it is evident that the PKO algorithm offers enhanced global optimization capabilities.
In comparison to conventional machine learning techniques (Figure 7d–f), the PKO-XGBoost model shows a notable superiority in both the accuracy of predicted data fitting and the related error metrics. This model effectively captures the relationship between UCSA and various parameter modifications, while also simplifying the parameter selection process compared to traditional methods. Consequently, it is particularly well-suited for engineering applications. The characteristics of rock’s UCSA can be swiftly assessed, enabling quick and adaptable adjustments to microwave irradiation parameters based on rock attributes. Overall, this approach offers benefits in terms of speed, ease of use, and cost efficiency.
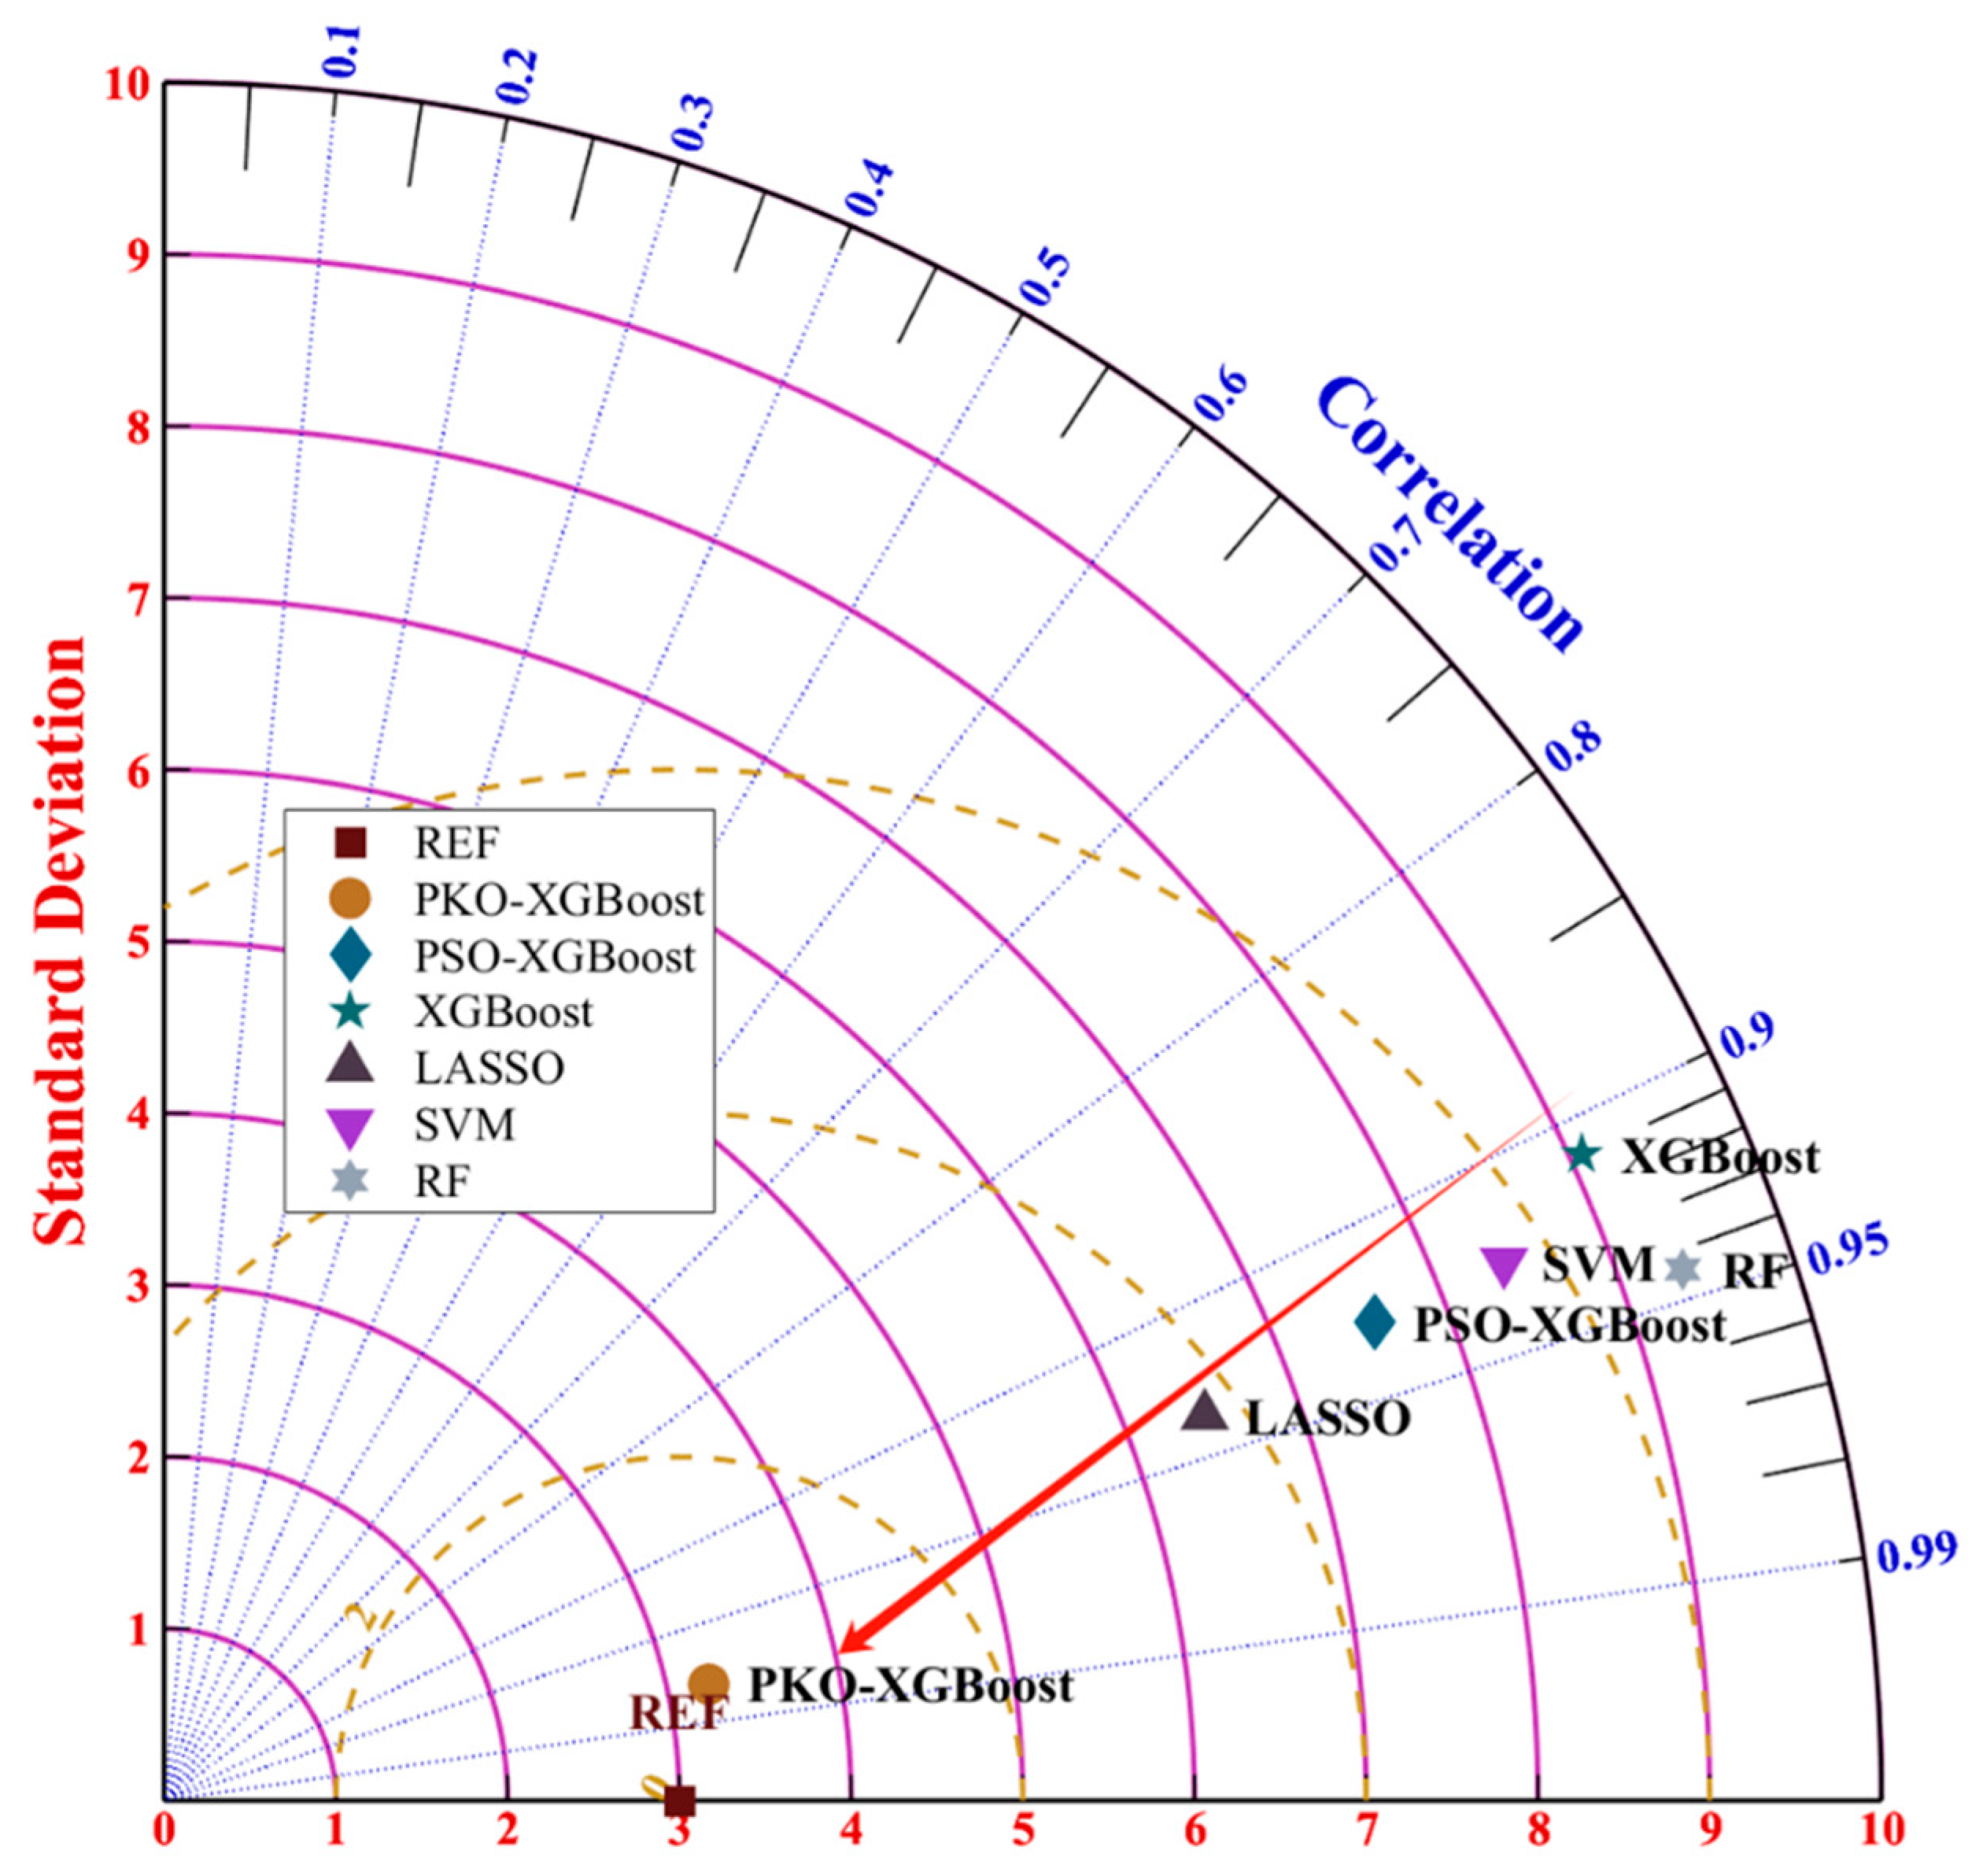
A Taylor diagram (Figure 8) was constructed using the standard deviation (SD), RMSE, and R2 values of the PKO-XGBoost model alongside those from five other models. REF, with SD = 3, RMSE = 6, and R2 = 1, served as the reference point. It was found that the model most similar to REF achieved the best prediction outcomes and evaluation metrics. The PKO-XGBoost model is noted for being closest to this reference in terms of both predictive results and assessment criteria. In particular, it shows markedly improved predictive capability when compared to other machine learning approaches. This analysis suggests that the PKO-XGBoost model utilized in this research provides enhanced results for UCSA analysis while more accurately evaluating the interrelations among rock physical parameters, microwave irradiation factors, rock microscopic characteristics, and UCSA.
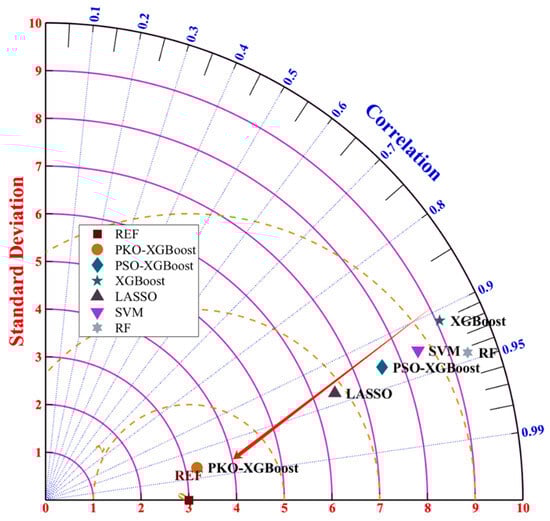
Figure 8.
Taylor diagram analysis. (The red arrow indicates the trend towards the REF).
4.3. Sensitivity Analysis
The prior analysis indicates that the PKO-XGBoost model effectively captures the relationships between rock physical parameters, microwave irradiation settings, microscopic characteristics of rocks, and UCSA. Consequently, it is crucial to further investigate how various factors (MIT, MIP, LWVB, LWVPLWVP, PB, PA, PP, MR) influence UCSA predictions and assess the contribution of each index. To examine and compare the sensitivity of these factors on UCSA outcomes, we utilized the Shapley additive explanations (SHAP) method [43] to uncover feature significance and their respective contributions to UCSA results.
SHAP is a technique used for interpreting models after they have been built, viewing all features as ‘contributors’ and measuring how much each feature adds to the model’s output. This method assesses the contribution of each feature when it is included in the model, considering its varying effects across different combinations of features. As a result, it provides insights from both global and local viewpoints. For every instance of prediction, SHAP calculates a value that indicates how important each feature is concerning the predictions made by the model. The underlying mathematical expression can be described as follows:
In this context, Φi denotes the significance of the i-th feature, N encompasses all features within the dataset, S is defined as the subset of N with the i-th index excluded, xs refers to the input features contained in set S, and q signifies the function that measures feature contributions.
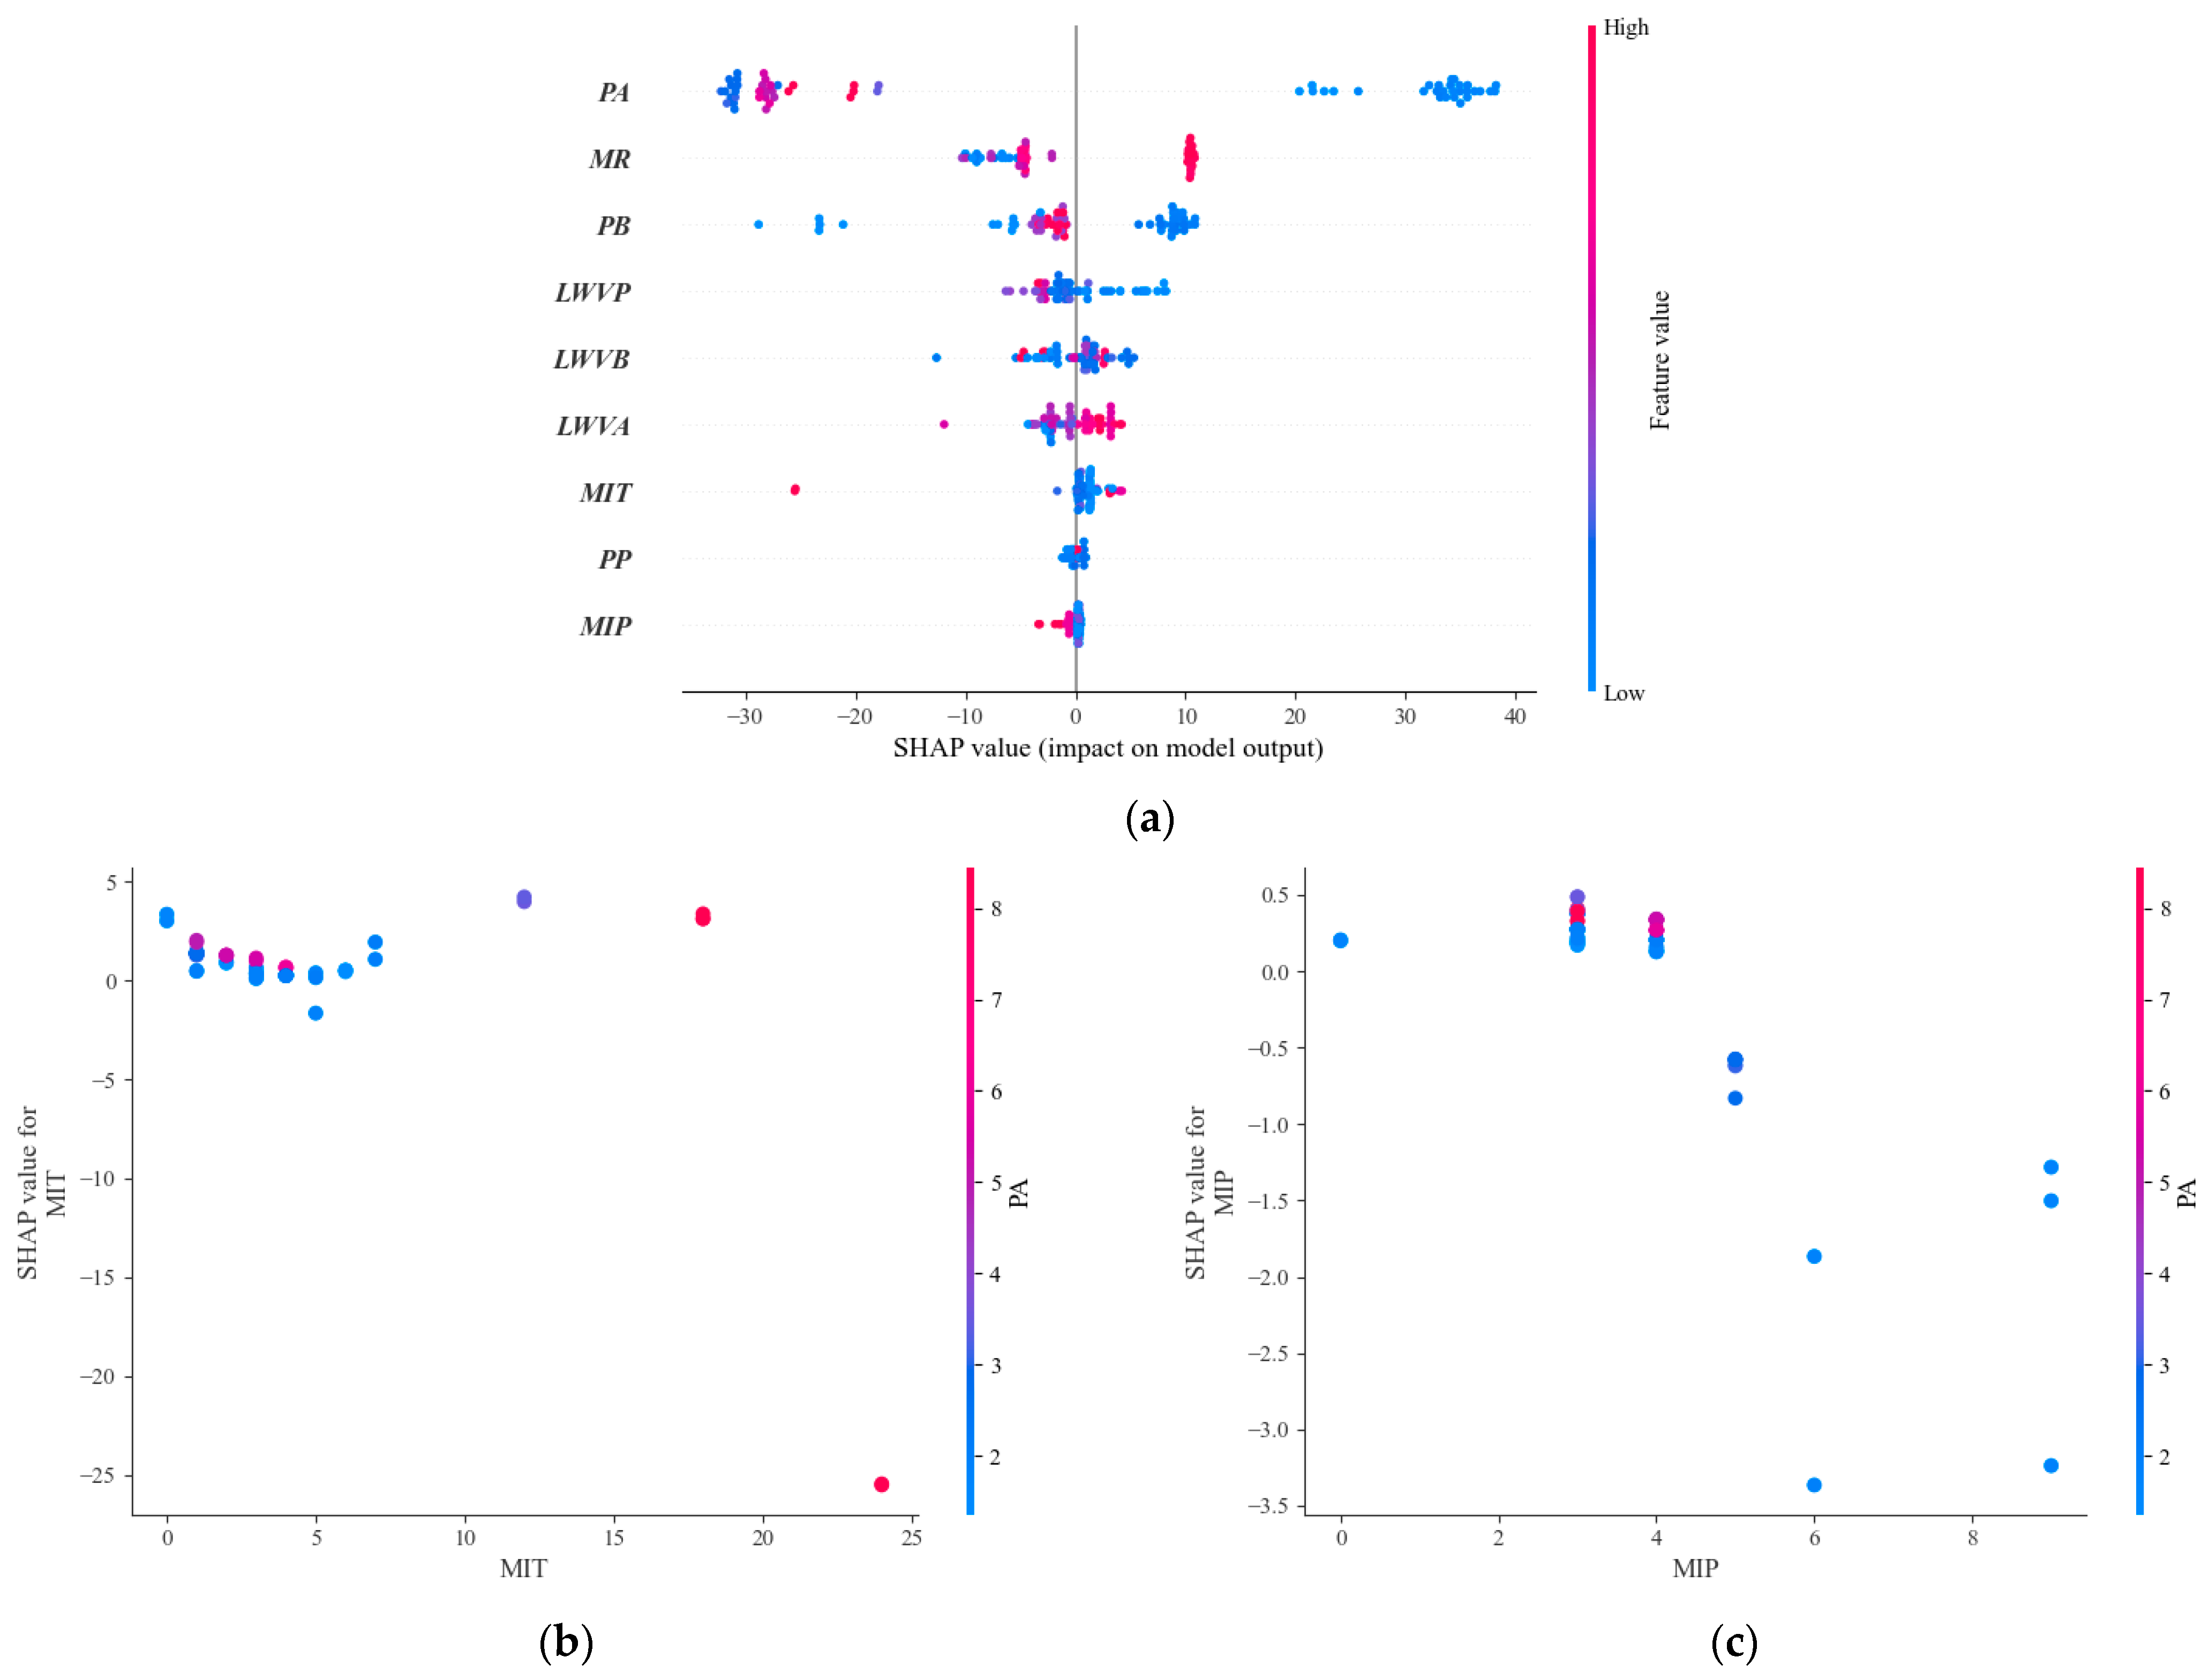
To elucidate the contribution of each parameter in the dataset, we analyzed the overall influence of input parameter characteristics on UCSA changes (Figure 9a). In the figure, points colored close to blue indicate that a given parameter has a negative effect on UCSA, while points closer to red signify a positive effect. The parameters are arranged from top to bottom based on their overall contributions.
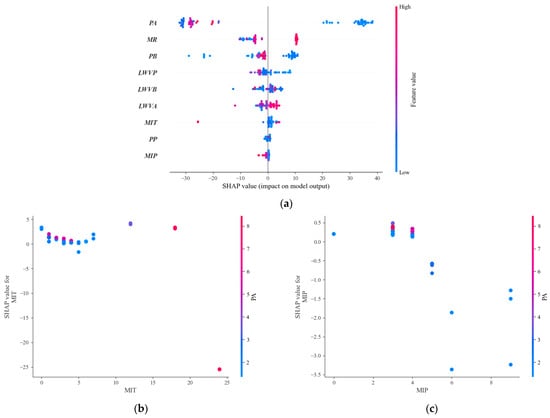
Figure 9.
Sensitivity analysis of SHAP chart ((a) the influence of aggregate factor indicators; (b) and (c) influence of a single factor index).
It is evident that PA exerts the most substantial overall influence, followed by MR and PB. As levels of PA and PB increase, their detrimental effects on UCSA in rock samples become increasingly pronounced; specifically, elevated PA and PB correlate with a reduction in UCSA. This suggests that microstructural damage induced by microwave irradiation plays a pivotal role in compromising rock strength, particularly in samples exhibiting high initial porosity where this effect is exacerbated. Conversely, an increase in MR enhances UCSA since denser rocks are less susceptible to microstructural damage from microwave exposure—a conclusion corroborated by our findings. In our experiments, granite demonstrated greater mass and density compared to sandstone and marble; thus, under identical microwave irradiation conditions, granite displayed a superior UCSA. This further substantiates that the PKO-XGBoost model effectively integrates data from diverse rock types.
Overall analysis indicates that MIT and MIP exert a lesser influence on UCSA; however, these parameters remain crucial for understanding how microwave irradiation affects rock fracture behavior. The relatively minor impact of MIT and MIP on UCSA can be interpreted as indicative of how microwave-induced microstructural damage leads to reduced rock strength—thereby shifting their contribution towards changes in PA and PB as key microstructural parameters.
To analyze the effects of microwave irradiation parameters on rocks, we further examined the influence of MIT and MIP on PA. As illustrated in Figure 9b,c, the horizontal axis represents the values of MIT and MIP, while the vertical axis depicts their corresponding SHAP values, with PA values indicated by color gradients. Blue signifies a decreasing trend, whereas red denotes an increasing trend. The figures demonstrate that both MIT and MIP significantly affect PA; specifically, lower values of MIT and MIP correlate with diminished PA. This finding underscores the importance of optimizing MIT and MIP settings during microwave-assisted rock fragmentation processes to achieve a substantial reduction in rock UCSA, thereby facilitating mechanical cutting.
4.4. Mechanism of Microwave-Induced Reduction in Rock Strength
The analysis revealed that microwave irradiation diminishes rock strength by inducing microscopic damage within the samples. Given that microwaves predominantly interact with polar molecules, variations in both the content and type of these molecules across different minerals lead to distinct thermal responses upon microwave exposure. The mechanism underlying microwave-induced damage is attributed to the heterogeneous composition of rocks, which consist of various mineral types. As a result, different constituents exhibit varying degrees of thermal reactivity; some minerals respond robustly while others demonstrate minimal reactivity [44]. This variability can be ascribed to differences in dielectric constants among minerals, as these properties significantly influence their thermal behavior under microwave conditions [45].
where Pd represents the power density absorbed by the mineral; f represents the microwave frequency; ε0, ε″ and E02 are the vacuum dielectric constants, dielectric loss factor, and microwave electric field intensity, respectively.
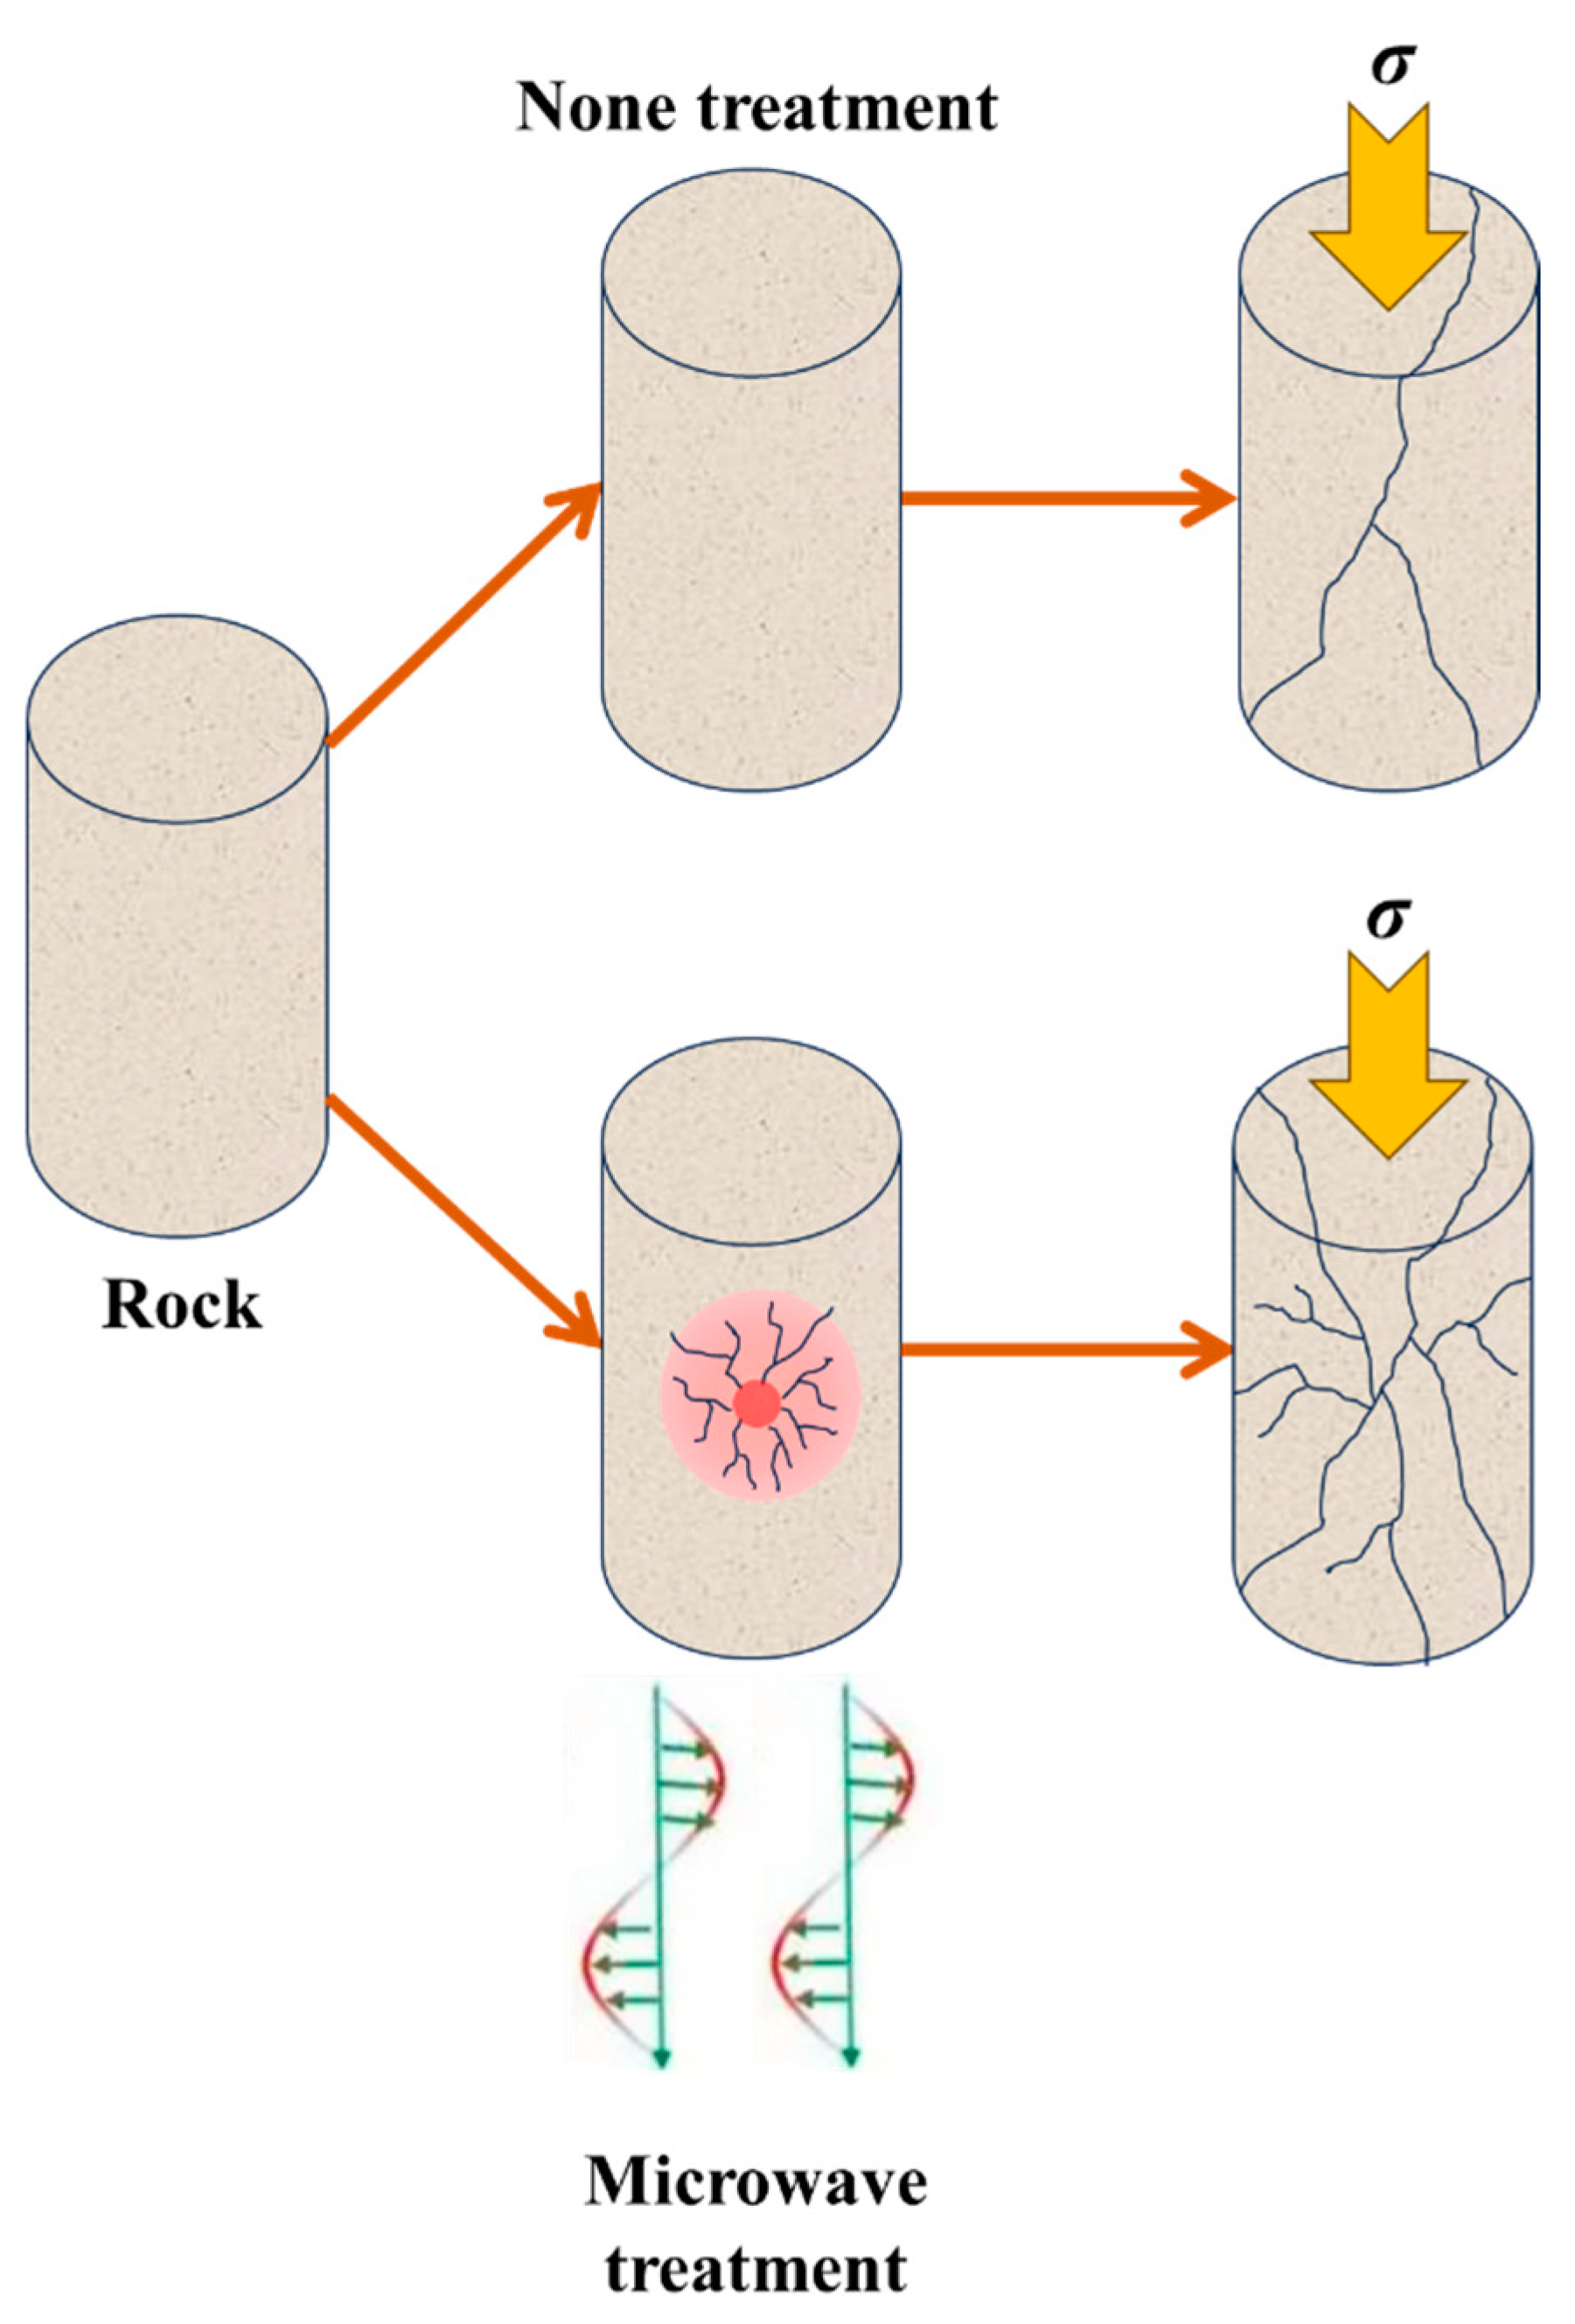
The variation in dielectric constants among different minerals serves as a critical factor influencing their distinct responses to microwave radiation, resulting in divergent heating rates under identical microwave exposure and consequently producing varied thermal expansion effects. Generally, minerals with lower thermal expansion coefficients constrain the deformation of those exhibiting higher expansion rates, thereby subjecting the latter to compressive stress while placing the former under tensile stress. This interaction progressively undermines bonding at grain boundaries, and heightened thermal stresses promote the formation of microcracks within the rock matrix [46]. These microcracks can expand, interconnect, and penetrate one another, ultimately leading to more pronounced macroscopic fractures. Such developments compromise both the physical and mechanical properties of the rock, effectively degrading its overall performance. Under consistent pressure conditions, this degradation renders rocks increasingly susceptible to crushing and facilitates mechanical cutting processes, as illustrated in Figure 10.
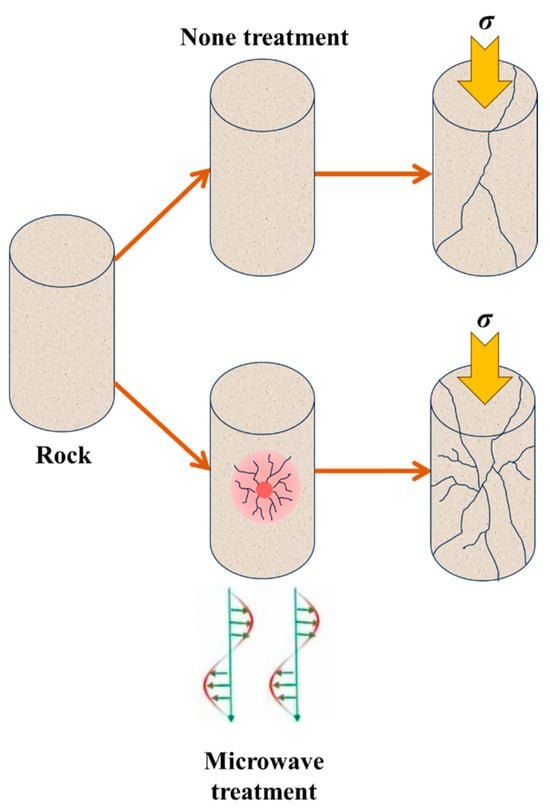
Figure 10.
Mechanism of microwave-induced rock breakage.
The findings of this research present a novel methodology for microwave-assisted rock fragmentation by identifying nine parameters associated with the rock and microwave irradiation (MIT, MIP, LWVB, LWVA, LWVP, PB, PA, PP, MR). This approach facilitates the rapid assessment of UCSA of the rock and allows for prompt adjustments to both microwave irradiation settings and mechanical fragmentation parameters. Consequently, it enhances the efficiency of and energy conservation in the rock fragmentation process. It is crucial to acknowledge that various standards and influencing factors govern rock strength; these encompass not only uniaxial compressive strength but also elastic modulus, point load strength, and RQD value among others. In our future research endeavors, we will integrate additional strength parameters to refine the accuracy of assessing rock strength following microwave irradiation.
5. Conclusions
- (1)
- Through the execution of microwave radiation experiments on 78 rock samples, encompassing granite, marble, and sandstone, we collected ten parameters (MIT, MIP, LWVB, LWVA, LWVP, PB, PA, PP, MR, and UCSA) and employed the PKO-XGBoost algorithm to establish correlations between UCSA and variations in these parameters. We identified optimal PKO-XGBoost hyperparameters with a population size of 80. Subsequently, we compared this model against the XGBoost and PSO-XGBoost models as well as other widely utilized machine learning algorithms. Evaluation using four performance indicators alongside a Taylor diagram analysis revealed that the PKO-XGBoost model demonstrated exceptional fitting performance (R2 = 0.978; VAF = 97.85) coupled with remarkably low prediction errors (RMSE = 6.960; MAE = 5.811). Thus, it can be concluded that the PKO-XGBoost model provides enhanced accuracy in assessing relationships among physical parameters related to microwave radiation variables and rock microstructural features concerning UCSA.
- (2)
- By employing advanced SHAP methodology, we analyzed the influence of the composite model on UCSA, elucidating the effects of parameters such as MIT, MIP, LWVB, LWVA, LWVP, PB, PA, PP, and MR on UCSA. The comprehensive analysis derived from SHAP indicates that PA exerts the most significant impact on UCSA. This finding suggests that microwave-induced microscopic damage in rocks is a fundamental factor contributing to the reduction in rock strength. Furthermore, MR exhibits a substantial secondary effect on UCSA; this implies that rocks with lower density experience a more pronounced deterioration in strength under identical microwave irradiation conditions.
- (3)
- Utilizing the SHAP method, we further analyzed the influence of microwave irradiation parameters MIT and MIP on the damage parameter PA induced by microwave irradiation in rocks. The findings indicate that lower values of MIT and MIP correspond to decreased PA values, which may enhance UCSA and affect mechanical rock-breaking capacity. This underscores the necessity of establishing optimal settings for MIT and MIP during microwave-assisted rock fragmentation to ensure a significant reduction in UCSA, thereby facilitating efficient mechanical cutting.
- (4)
- The primary objective of microwave rock fracturing is to modify the physical and mechanical properties of rocks, thereby reducing their strength and facilitating fracture under consistent pressure, which in turn minimizes wear on mechanical rock-breaking tools. However, variations in irradiation parameters and other influencing factors can result in disparate degradation effects on the rocks. By employing the PKO-XGBoost machine learning model presented in this study, we can more efficiently, economically, and accurately assess the relationship between microwave irradiation parameters and rock damage. In the complex and variable geological conditions encountered during mining operations, we are able to implement rapid and adaptable modifications to microwave irradiation parameters based on specific rock characteristics, thus effectively enhancing mechanical rock-breaking processes.
Author Contributions
Methodology, Z.G., X.X., C.Y. and M.C.; Software, C.Y. and M.C.; Investigation, X.X.; Writing—original draft, Z.G.; Writing—review & editing, C.Y.; Funding acquisition, Z.G. All authors have read and agreed to the published version of the manuscript.
Funding
This work was supported by the Natural Science Foundation of Jilin Province (Grant No. 20240101080JC).
Data Availability Statement
The datasets generated during and/or analyzed during the current study are available from the corresponding author on reasonable request.
Conflicts of Interest
The authors declare that they have no known competing financial interests or personal relationships that could have appeared to influence the work reported in this paper.
References
- Tan, F.; Guo, H.; Pan, P.; Wang, Z.; Liu, X.; Zhou, Y. Integrated approach of predicting rock stability in high mountain valley underground caverns. Undergr. Space 2024, 19, 317–341. [Google Scholar] [CrossRef]
- Yu, S.; Wang, J.; Gao, Y.; Sun, W.; Lu, J.; Liu, R.; Shi, Y.; Yu, S.; Wang, J.; Gao, Y.; et al. Effects of fissure properties on the tunnel damage evolutions: Insights from DIC-based 3D printing experiments and meshless numerical simulations. Tunn. Undergr. Space Technol. 2024, 149, 105817. [Google Scholar] [CrossRef]
- Yu, S.; Gao, Y. A total Lagrange meshless method for modeling the concrete damage evolutions under blast loading. Comput. Part. Mech. 2024; Early access. [Google Scholar] [CrossRef]
- Zhang, C.; Liu, X.; Fang, X.; Yang, J.; Xie, Y.; Zhou, W. Challenges of shaft drilling in broken rock masses with a large raise boring machine in confined underground space: A case study. Tunn. Undergr. Space Technol. 2024, 147, 105694. [Google Scholar] [CrossRef]
- Jiang, H.; Zhang, X.; Zhao, H.; Liu, Z.; Wang, Y. The mechanism and performance of rock breakage by undercutting disc cutter with advanced slotting. Sci. Rep. 2023, 13, 10474. [Google Scholar] [CrossRef]
- Mu, B.; Yang, W.; Zheng, Y.; Li, J. Excavation rate “predicting while tunnelling” for double shield TBMs in moderate strength poor to good quality rocks. Int. J. Rock Mech. Min. Sci. Géoméch. Abstr. 2022, 149, 104988. [Google Scholar] [CrossRef]
- Liu, X.-Y.; Xu, D.-P.; Jiang, Q.; Ma, X.-D. Excavation response and reinforcement practice of large underground caverns within high-stress hard rock masses: The case of Shuangjiangkou hydropower Station, China. Tunn. Undergr. Space Technol. 2024, 147, 105698. [Google Scholar] [CrossRef]
- Gao, H.; Wang, Q.; Jiang, B.; Zhang, P.; Jiang, Z.; Wang, Y. Relationship between rock uniaxial compressive strength and digital core drilling parameters and its forecast method. Int. J. Coal Sci. Technol. 2021, 8, 605–613. [Google Scholar] [CrossRef]
- Singh, T.N.; Kainthola, A.; Venkatesh, A. Correlation Between Point Load Index and Uniaxial Compressive Strength for Different Rock Types. Rock Mech. Rock Eng. 2012, 45, 259–264. [Google Scholar] [CrossRef]
- Luo, P.; Fang, X.; Li, D.; Yu, Y.; Li, H.; Cui, P.; Ma, J. Evaluation of excavation method on point load strength of rocks with poor geological conditions in a deep metal mine. Géoméch. Geophys. Geo-Energy Geo-Resources 2023, 9, 90. [Google Scholar] [CrossRef]
- Lee, G.J.; Ryu, H.H.; Cho, G.C.; Kwon, T.H. Full-scale TBM excavation tests for rock-like materials with different uniaxial compressive strength. Geomech. Eng. 2023, 35, 487–497. [Google Scholar] [CrossRef]
- Tiryaki, B. Predicting intact rock strength for mechanical excavation using multivariate statistics, artificial neural networks, and regression trees. Eng. Geol. 2008, 99, 51–60. [Google Scholar] [CrossRef]
- Dai, Y.; Chen, L.S.; Zhu, X.; Liu, H. Modelling and simulation of a mining machine excavating seabed massive sulfide deposits. Int. J. Simul. Model. 2016, 15, 377–387. [Google Scholar] [CrossRef]
- Dai, X.; Huang, Z.; Wu, X.; Zhao, H.; Shi, H. Fluid-solid-thermal coupling analysis of rock failure under the joint action of cutting and jet impingement. Geothermics 2021, 94, 102092. [Google Scholar] [CrossRef]
- Liu, C.; Duan, M.; Huang, Y.; Huang, Q.; Liu, J.; Wang, Z.; Zhang, Z. Research on the Mechanism and Characteristics of Ultrasonically Coupled Mechanical Rock-Breaking Pre-Fracturing Technology. Machines 2023, 11, 934. [Google Scholar] [CrossRef]
- Cai, C.; Yang, X.P.; Gao, C.; Pu, Z.C.; Zhang, P.; Tan, Z.B.; Li, B.R.; Xie, S. Intense Cooling during Composite Rock Breaking of High--Pressure CO2 Jet-Polycrystalline Diamond Cutter. Spe J. 2022, 27, 2525–2540. [Google Scholar] [CrossRef]
- Shi, X.; Duan, Y.; Han, B.; Zhao, J. Enhanced rock breakage by pulsed laser induced cavitation bubbles: Preliminary experimental observations and conclusions. Géoméch. Geophys. Geo-Energy Geo-Resour. 2020, 6, 25. [Google Scholar] [CrossRef]
- Xue, Y.; Yao, L.; Li, J.; Ding, L.; Luo, W.; Zhou, X.; Wang, S.; Zhao, Y. Temporal and spatial evolution laws of temperature effects in high-velocity liquid nitrogen jet rock breaking. Appl. Therm. Eng. 2024, 255, 124060. [Google Scholar] [CrossRef]
- Jeong, H.; Choi, S.; Lee, Y.-K. Evaluation of Cutting Performance of a TBM Disc Cutter and Cerchar Abrasivity Index Based on the Brittleness and Properties of Rock. Appl. Sci. 2023, 13, 2612. [Google Scholar] [CrossRef]
- Feng, X.-T.; Li, S.-P.; Yang, C.-X.; Lin, F.; Tong, T.-Y.; Su, X.-X.; Zhang, J.-Y. The Influence of the Rotary Speed of a Microwave Applicator on Hard-Rock Fracturing Effect. Rock Mech. Rock Eng. 2022, 55, 6963–6979. [Google Scholar] [CrossRef]
- Ma, Z.; Zheng, Y.; Li, J.; Zhao, X.; Zhao, J. Enhancing rock breakage efficiency by microwave fracturing: A study on antenna selection. Energy 2024, 288, 129876. [Google Scholar] [CrossRef]
- Ma, Z.; Zheng, Y.; Zhao, X.; Li, J. Microwave-assisted hard rock breakage by impact hammers: Heating, fracturing and mechanical breakage. Bull. Eng. Geol. Environ. 2022, 81, 308. [Google Scholar] [CrossRef]
- Lu, G.; Zhou, J.; Li, Y.; Zhang, X.; Gao, W. The influence of minerals on the mechanism of microwave-induced fracturing of rocks. J. Appl. Geophys. 2020, 180, 104123. [Google Scholar] [CrossRef]
- Lin, F.; Feng, X.-T.; Yang, C.-X.; Li, S.-P.; Zhang, J.-Y.; Su, X.-X.; Tong, T.-Y. Experimental study on improving mechanical mining efficiency of deep banded iron ore by microwave presplitting. Int. J. Rock Mech. Min. Sci. 2022, 159, 105233. [Google Scholar] [CrossRef]
- Lin, F.; Feng, X.-T.; Li, S.-P.; Zhang, J.-Y.; Su, X.-X.; Tong, T.-Y. Optimization of Microwave Presplitting Iron Ore to Improve Mechanical Mining Efficiency. Rock Mech. Rock Eng. 2024, 57, 1897–1914. [Google Scholar] [CrossRef]
- Lehmann, G.; Mayr, M.; Käsling, H.; Thuro, K. Microwave pre-conditioning of granite and concrete and the implications on their geotechnical parameters. Int. J. Rock Mech. Min. Sci. 2023, 164, 105294. [Google Scholar] [CrossRef]
- Ahmed, H.M.; Ahmadihosseini, A.; Hassani, F.; Hefni, M.A.; Ahmed, H.A.M.; Saleem, H.A.; Moustafa, E.B.; Sasmito, A.P. Numerical and experimental analyses of rock failure mechanisms due to microwave treatment. J. Rock Mech. Geotech. Eng. 2023, 15, 2483–2495. [Google Scholar] [CrossRef]
- Li, X.-J.; Zhang, H.-K.; Bai, Y.-F.; Zhang, X.-Y. Factor analysis and numerical simulation of rock breaking efficiency of TBM deep rock mass based on orthogonal design. J. Cent. South Univ. 2022, 29, 1345–1362. [Google Scholar] [CrossRef]
- Sun, N.; Liu, C.; Zhang, F.; Dong, M.; Li, Z. Accurate Identification of Broken Rock Mass Structure and Its Application in Stability Analysis of Underground Caverns Surrounding Rock. Appl. Sci. 2023, 13, 6964. [Google Scholar] [CrossRef]
- Lu, G.-M.; Feng, X.-T.; Li, Y.-H.; Zhang, X. The Microwave-Induced Fracturing of Hard Rock. Rock Mech. Rock Eng. 2019, 52, 3017–3032. [Google Scholar] [CrossRef]
- Bai, G.; Sun, Q.; Jia, H.; Ge, Z.; Li, P. Variations in fracture toughness of SCB granite influenced by microwave heating. Eng. Fract. Mech. 2021, 258, 108048. [Google Scholar] [CrossRef]
- Ling, X.; Wang, M.; Yi, W.; Xia, Q.; Sun, H. Predicting Rock Unconfined Compressive Strength Based on Tunnel Face Boreholes Measurement-While-Drilling Data. KSCE J. Civ. Eng. 2024; Early access. [Google Scholar] [CrossRef]
- Sabri, S.; Jaiswal, A.; Verma, A.K.; Singh, T.N. Advanced machine learning approaches for uniaxial compressive strength prediction of Indian rocks using petrographic properties. Multiscale Multidiscip. Model. Exp. Des. 2024; Early access. [Google Scholar] [CrossRef]
- Sun, J.; Zhang, R.; Zhang, A.; Wang, X.; Wang, J.; Ren, L.; Zhang, Z.; Zhang, Z. Rock strength prediction based on machine learning: A study from prediction model to mechanism explanation. Measurement 2024, 238, 115373. [Google Scholar] [CrossRef]
- Li, J.; Kaunda, R.B.; Zhou, K. Experimental investigations on the effects of ambient freeze-thaw cycling on dynamic properties and rock pore structure deterioration of sandstone. Cold Reg. Sci. Technol. 2018, 154, 133–141. [Google Scholar] [CrossRef]
- Ding, Z.; Nguyen, H.; Bui, X.-N.; Zhou, J.; Moayedi, H. Computational Intelligence Model for Estimating Intensity of Blast-Induced Ground Vibration in a Mine Based on Imperialist Competitive and Extreme Gradient Boosting Algorithms. Nat. Resour. Res. 2020, 29, 751–769. [Google Scholar] [CrossRef]
- Zhou, J.; Qiu, Y.; Zhu, S.; Armaghani, D.J.; Khandelwal, M.; Mohamad, E.T. Estimation of the TBM advance rate under hard rock conditions using XGBoost and Bayesian optimization. Undergr. Space 2021, 6, 506–515. [Google Scholar] [CrossRef]
- Xu, C.; Zhou, K.; Xiong, X.; Gao, F.; Zhou, J. Research on height prediction of water-conducting fracture zone in coal mining based on intelligent algorithm combined with extreme boosting machine. Expert Syst. Appl. 2024, 249, 123669. [Google Scholar] [CrossRef]
- Bouaouda, A.; Hashim, F.A.; Sayouti, Y.; Hussien, A.G. Pied kingfisher optimizer: A new bio-inspired algorithm for solving numerical optimization and industrial engineering problems. Neural Comput. Appl. 2024, 36, 15455–15513. [Google Scholar] [CrossRef]
- Sun, M.; Yang, J.; Yang, C.; Wang, W.; Wang, X.; Li, H. Research on prediction of PPV in open-pit mine used RUN-XGBoost model. Heliyon 2024, 10, e28246. [Google Scholar] [CrossRef]
- Qiu, Y.; Zhou, J. Short-Term Rockburst Damage Assessment in Burst-Prone Mines: An Explainable XGBOOST Hybrid Model with SCSO Algorithm. Rock Mech. Rock Eng. 2023, 56, 8745–8770. [Google Scholar] [CrossRef]
- Xu, C.; Zhou, K.; Xiong, X.; Gao, F.; Lu, Y. Prediction of mining induced subsidence by sparrow search algorithm with extreme gradient boosting and TOPSIS method. Acta Geotech. 2023, 18, 4993–5009. [Google Scholar] [CrossRef]
- Cao, J.; Gao, J.; Rad, H.N.; Mohammed, A.S.; Hasanipanah, M.; Zhou, J. A novel systematic and evolved approach based on XGBoost-firefly algorithm to predict Young’s modulus and unconfined compressive strength of rock. Eng. Comput. 2022, 38, 3829–3845. [Google Scholar] [CrossRef]
- Zhao, X.B.; Zhao, Q.H.; Zheng, Y.L.; He, L.; He, J.L.; Zhao, G.F.; Li, H. Cracking Behavior and Mechanism of Igneous Rocks Under Open-Ended Microwave Irradiation. Rock Mech. Rock Eng. 2022, 55, 6151–6169. [Google Scholar] [CrossRef]
- Bai, G.; Sun, Q.; Jia, H.; Ge, Z.; Tang, L.; Xue, S. Mechanical responses of igneous rocks to microwave irradiation: A review. Acta Geophys. 2022, 70, 1183–1192. [Google Scholar] [CrossRef]
- Tian, J.; Lu, G.M.; Feng, X.T.; Li, Y.H.; Zhang, X.W. Experimental study of the microwave sensitivity of main rock-forming minerals. Rock Soil Mech. 2019, 40, 2066–2074. [Google Scholar] [CrossRef]
Disclaimer/Publisher’s Note: The statements, opinions and data contained in all publications are solely those of the individual author(s) and contributor(s) and not of MDPI and/or the editor(s). MDPI and/or the editor(s) disclaim responsibility for any injury to people or property resulting from any ideas, methods, instructions or products referred to in the content. |
© 2024 by the authors. Licensee MDPI, Basel, Switzerland. This article is an open access article distributed under the terms and conditions of the Creative Commons Attribution (CC BY) license (https://creativecommons.org/licenses/by/4.0/).