Article

Performance Analysis for Predictive Voltage Stability Monitoring Using Enhanced Adaptive Neuro-Fuzzy Expert System

by
Oludamilare Bode Adewuyi
* and
Senthil Krishnamurthy
*
Centre for Intelligence Systems and Emerging Technologies, Department of Electrical, Electronic and Computer Engineering, Cape Peninsula University of Technology, Bellville 7535, South Africa
*
Authors to whom correspondence should be addressed.
Mathematics 2024, 12(19), 3008; https://doi.org/10.3390/math12193008
Submission received: 1 September 2024 / Revised: 24 September 2024 / Accepted: 25 September 2024 / Published: 26 September 2024
(This article belongs to the Special Issue Artificial Intelligence Techniques Applications on Power Systems)

Abstract

:
Intelligent voltage stability monitoring remains an essential feature of modern research into secure operations of power system networks. This research developed an adaptive neuro-fuzzy expert system (ANFIS)-based predictive model to validate the viability of two contemporary voltage stability indices (VSIs) for intelligent voltage stability monitoring, especially at intricate loading and operation points close to voltage collapse. The Novel Line Stability Index (NLSI) and Critical Boundary Index are VSIs deployed extensively for steady-state voltage stability analysis, and thus, they are selected for the predictive model implementation. Six essential power system operational parameters with data values calculated at varying real and reactive loading levels are input features for ANFIS model implementation. The model’s performance is evaluated using reliable statistical error performance analysis in percentages ( M A P E and R R M S E p ) and regression analysis based on Pearson’s correlation coefficient (R). The IEEE 14-bus and IEEE 118-bus test systems were used to evaluate the prediction model over various network sizes and complexities and at varying clustering radii. The percentage error analysis reveals that the ANFIS predictive model performed well with both VSIs, with CBI performing comparatively better based on the comparative values of M A P E , R R M S E p , and R at multiple simulation runs and clustering radii. Remarkably, CBI showed credible potential as a reliable voltage stability indicator that can be adopted for real-time monitoring, particularly at loading levels near the point of voltage instability.

1. Introduction

The recent power industry reform has heightened competition in energy service provision, emphasizing the importance of real-time power system operation [1]. However, due to insufficient grid capacity to meet load demand, most existing electricity networks experience voltage instability, with partial and total voltage collapse occurrences. The voltage stability issues are dynamic and often become more complicated with increasing loading [2]. Consequently, various voltage stability indices (VSIs) have been established for projecting power system voltage stability levels in different operating situations and eventualities. Most of these approaches are formulated from steady-state power flow analysis for marking the voltage stability conditions. Such indices like P–V and Q–V curves provide reliable information on voltage stability based on system loads at various operating points [3]. The line stability index (Lmn), fast voltage stability index (FVSI), voltage collapse prediction index (VCPI), novel line stability index (NLSI), line stability factor (LQP), L-index, and critical boundary index (CBI) are a few of the adaptable VSIs that are derived from the power transfer theory [4].
However, steady-state load flow analysis cannot adequately reflect power system conditions if load levels often fluctuate; also, VSIs have limited precision because of parameter approximations in the derivation, and the level of inaccuracy becomes significant as the power network size and complexity increase [5]. Notably, voltage stability indices for monitoring power system conditions are preemptive analyses using data from load flow analysis. Thus, practical prediction algorithms can be developed to calculate power system voltage stability index values at various loading levels and system contingencies. Significantly, in recent times, power systems researchers are developing prediction approaches using proven statistical techniques and other sophisticated artificial intelligence (AI) approaches such as artificial neural networks (ANNs) and adaptive neuro-fuzzy inference systems (ANFISs) [6]. Thus, this study considered the empirical analysis of the performance accuracy of specific VSIs (NLSI and CBI) towards validating their adaptability for intelligent real-time voltage stability monitoring systems. Thus, this study empirically analyzed the performance accuracy of NLSI and CBI using ANFISs to validate their adaptation for intelligent real-time voltage stability monitoring systems.

Review of Machine Learning Applications for Voltage Stability Analysis

Reference [7] presented an artificial immune system (AIS) to monitor real-time voltage stability and notify power system operators of impending voltage collapses. The suggested technique uses pattern recognition and algorithms to forecast voltage collapse at different power systems loading. In Reference [8], the authors developed a multilayer feedforward ANN using error backpropagation learning estimating voltage stability margins. Credible performance-based sensitivity analysis was utilized to determine power system loading situations and voltage stability margin trends using the ANN model. In [9], the authors validated the load flow-based power system voltage stability monitoring technique with ANN models implemented using the voltage stability data calculated from Newton Rapson load flow analysis. The ANN model was trained with sufficient data from the load flow solutions to confirm the consistency of the system voltage stability levels using FVSI; the authors in [10] performed a similar analysis using L-index.
The authors in [11] modeled an efficient self-organized ANN model with multi-layered perceptron using supervised learning for estimating the voltage stability margin of an actual 92-bus power system. Implementing an intelligent algorithm for real-time voltage stability analysis and voltage collapse risk assessment is discussed in [12]. The real-time ANN voltage stability prediction model is trained to determine the weakest lines within the power system based on the data obtained from pre-estimated steady-state line VSIs; the test scenarios include IEEE 9 and IEEE 14-bus systems. In [13], an ANN model was presented to forecast voltage stability using node voltage magnitudes and phase angles. Direct measurement utilizing measuring units (PMUs) at various power system locations provided the input data for ANN training, and the model was designed to estimate the voltage stability margin for different power systems at different complexity, operating conditions, and credible contingencies.
A network reduction-based ANN approach was developed using adaptive training to monitor voltage stability and load margin in a multi-area power system using IEEE 14-bus and 118-bus test systems in [14]. In [15], an ANN model based on the feed-forward back propagation network (FFBPN) was used to build an online voltage stability monitoring strategy for various load conditions using the sequential learning and linear optimization approach. The training data are generated from the results of the conventional line stability indices. Consequently, the performance efficiency of the developed ANN model is compared to the typical VSI values for ranking weak lines and placing power conditioning devices. Moreover, an ANN-based real-time power system VSM monitoring method was presented in [16]. The VSM was estimated as the distance between the power system’s current operating point and the nearest voltage collapse as monitored by the system loading using orthogonalization and ANN-based sensitivity analysis. The model is robust and performed efficiently using different power system networks and configurations under changing operational conditions.
In [17], an ANN was implemented using the Levenberg Marquardt (LM) approach to anticipate voltage instability in power systems. FVSI and LQP analysis data were combined with real and reactive loading power to create the input information for training the ANN. The ANN model was trained to determine the line criticality based on system maximum loading conditions. A recurrent neural network (RNN) trained using particle swarm optimization (PSO) was modeled for predicting voltage instability in power systems in [18]; the performance of the PSO-trained RNN was compared to the backpropagation (BP)-ANN model. Moreover, the Salp Swarm Algorithm (SSA) was employed to optimize the ANN model parameters for online voltage stability monitoring, considering the voltage stability margin index (VSMI) in [19]. The model was compared to other hybrid ANN models to determine its performance for intelligent prediction of the network’s closeness to voltage collapse. The accuracy of different machine learning models (such as Gaussian Process Regression, ANNs, SVMs, and Decision Trees) for predicting voltage stability margins during routine operations and contingencies was determined [20]. The ML models were trained and validated using node voltage magnitude and angle data with voltage stability margin as the target.
The adaptive neuro-fuzzy inference system (ANFIS) is a robust machine-learning technique that has recently received a lot of research attention [21]. The adaptive neuro-fuzzy inference system (ANFIS) is a fuzzy rule-based expert system that has been enhanced with the learning skills of an ANN for supervised learning [22]. It has become one of the important faces of modern data analytics and prediction systems [23]. For medical purposes, a new model for early illness prediction using an ANFIS model optimized by GA for classification, DenseNet-201 for feature extraction, and WOA for feature selection, was developed in [24]. For food industry applications, an ANFIS model was developed adopting the American customer satisfaction index (ACSI) parameters to develop a novel model for predicting the dairy sector customer satisfaction level in [25]; it was found that ANFIS better modeled the customer satisfaction than case-based reasoning and multiple linear regression. Subsequently, credible ANFIS models have been developed for predictive applications in several other areas, such as soil science [26], autonomous underwater vehicle control [27], photovoltaic (PV) systems design [28], etc.
In [29], a fuzzy neural network model with one output unit was developed to monitor voltage stability and enhance the power system loadability margin. The model was tested to predict the maximum load limit for IEEE 30-bus and IEEE 118-bus systems using real and reactive power uncertainties, generator powers, bus voltages, and static VAR compensators as the implementation parameters. Using a modified PSO algorithm, a fuzzy logic-based distribution network reconfiguration model was developed to reduce power loss and improve voltage stability considering renewable energy uncertainty in [30]. The authors in [31] employed an expert FL system to determine crucial SVC parameters for enhancing wind energy-integrated power system voltage stability and low voltage ride-through (LVRT) capacity. ANFIS and its hybridized models have been developed to predict power system load profiles/patterns and available generating outputs. In [32], an association rule-based ANFIS model was trained using the Harris Hawks optimization method to monitor power system VSM effectiveness. The proposed hybrid ANFIS model for VSM assessment is tested in three key areas: feature selection, model training, and data estimation. In [33], synchronized phasor measurements created a fusion of SVR and ANFIS models for online voltage stability assessment. The Ant Lion Optimiser (ALO) optimizes SVR-ANFIS parameters for model training and precise performance.
Thus, in this study, an ANFIS-based predictive model is implemented using credible power systems data to establish the voltage stability prediction capability of specific VSIs to standardize the implementation of intelligent voltage stability predictive models towards ensuring reliable real-time operation of power systems, especially at contingent loading conditions. The remaining content of this paper consists of Section 2, which conceptualizes the mathematical models and implementation methods, Section 3, which presents the simulation and results’ discussion, and the study is concluded in Section 4.

2. Models and Methods

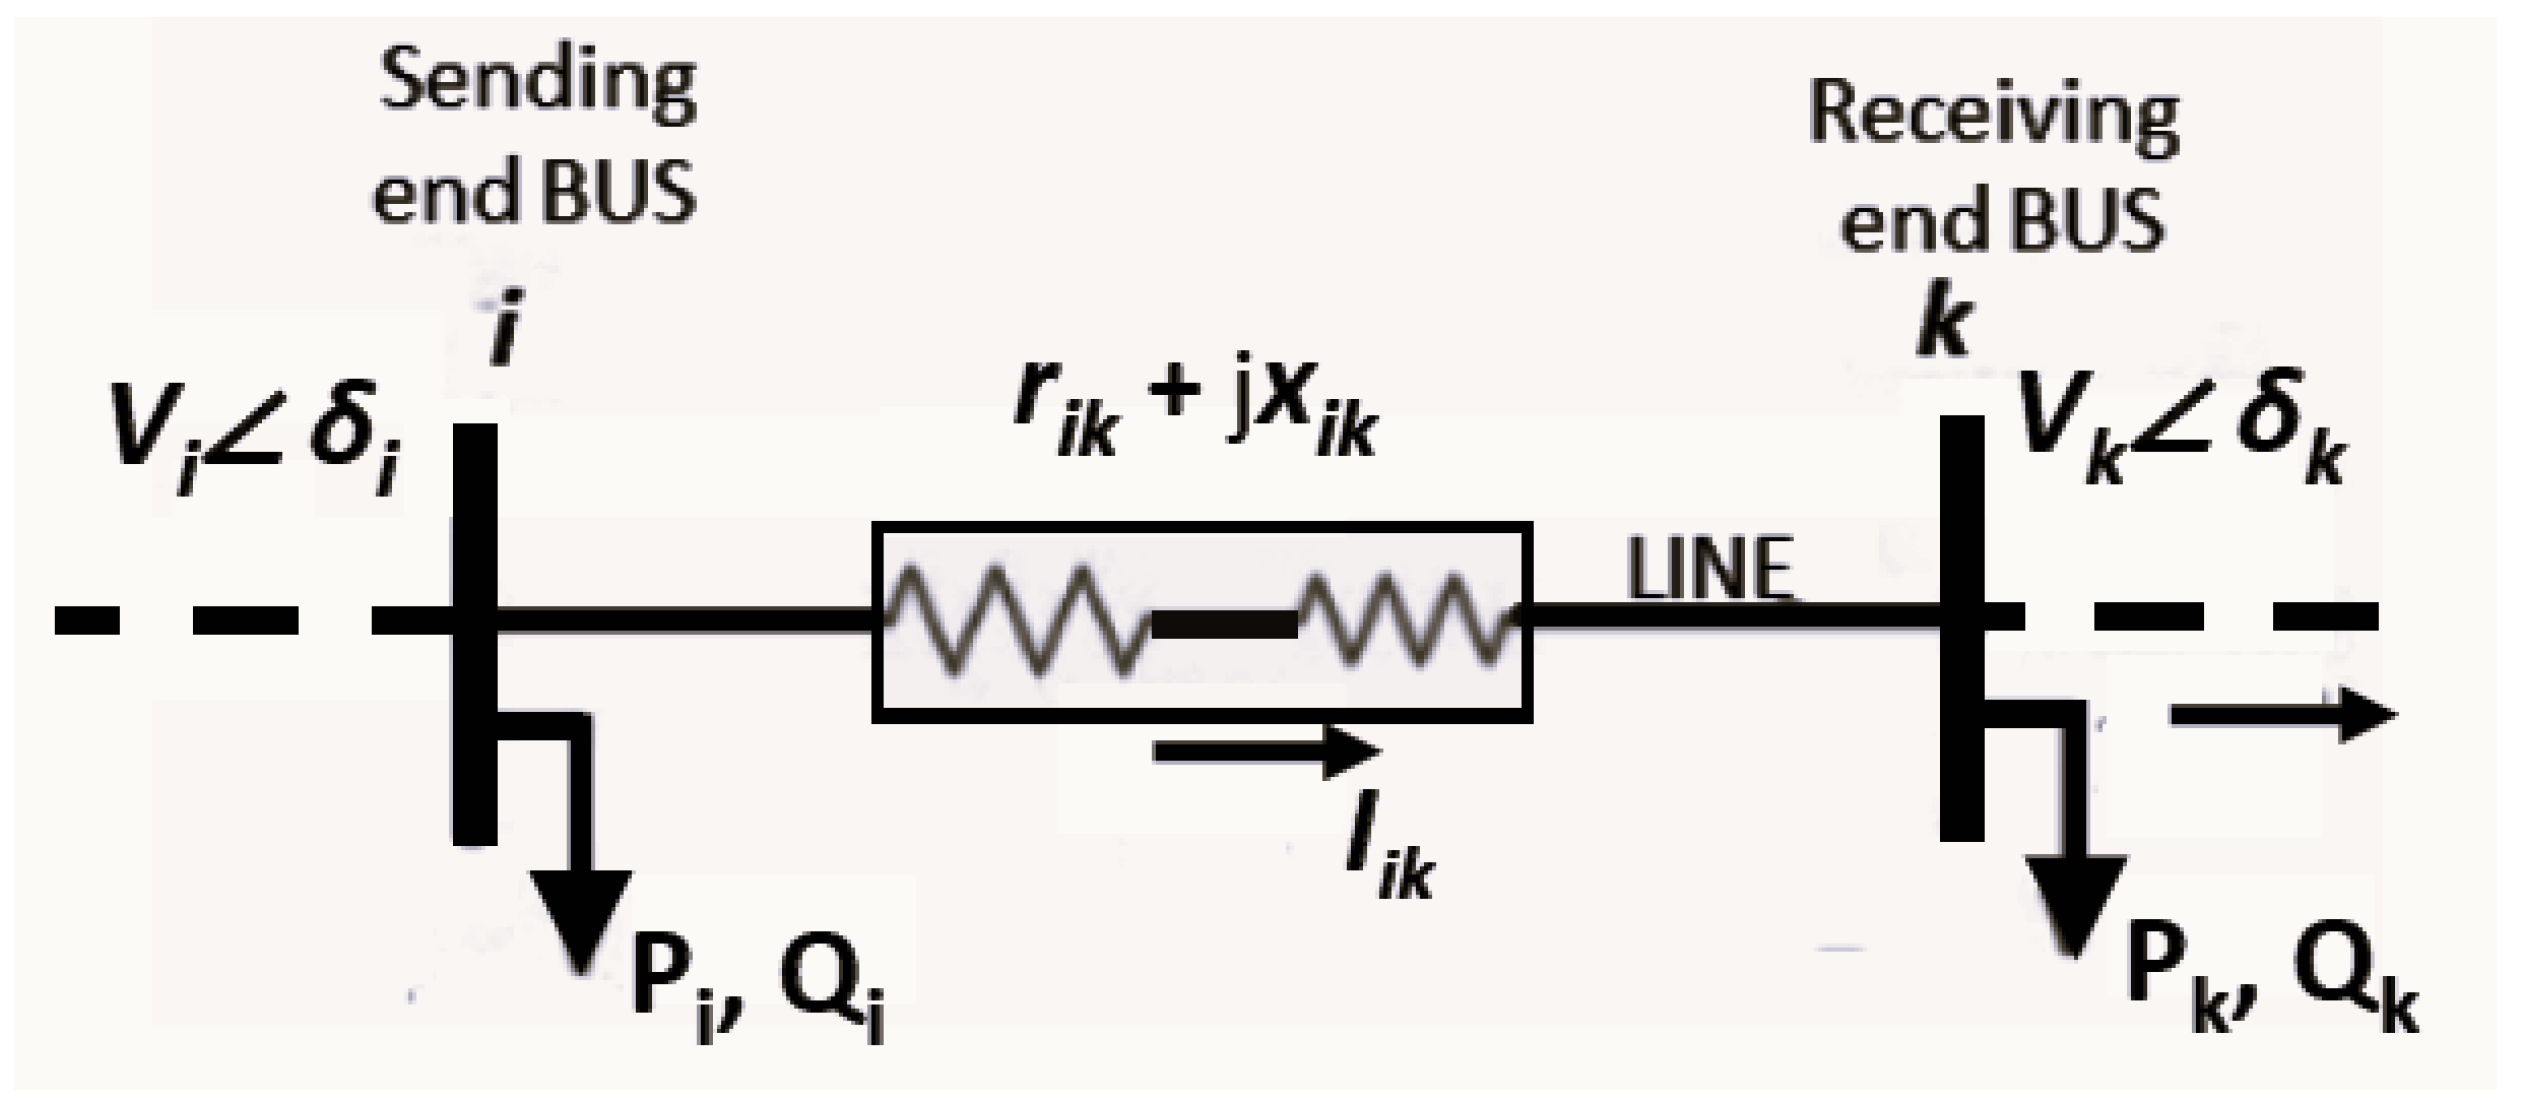
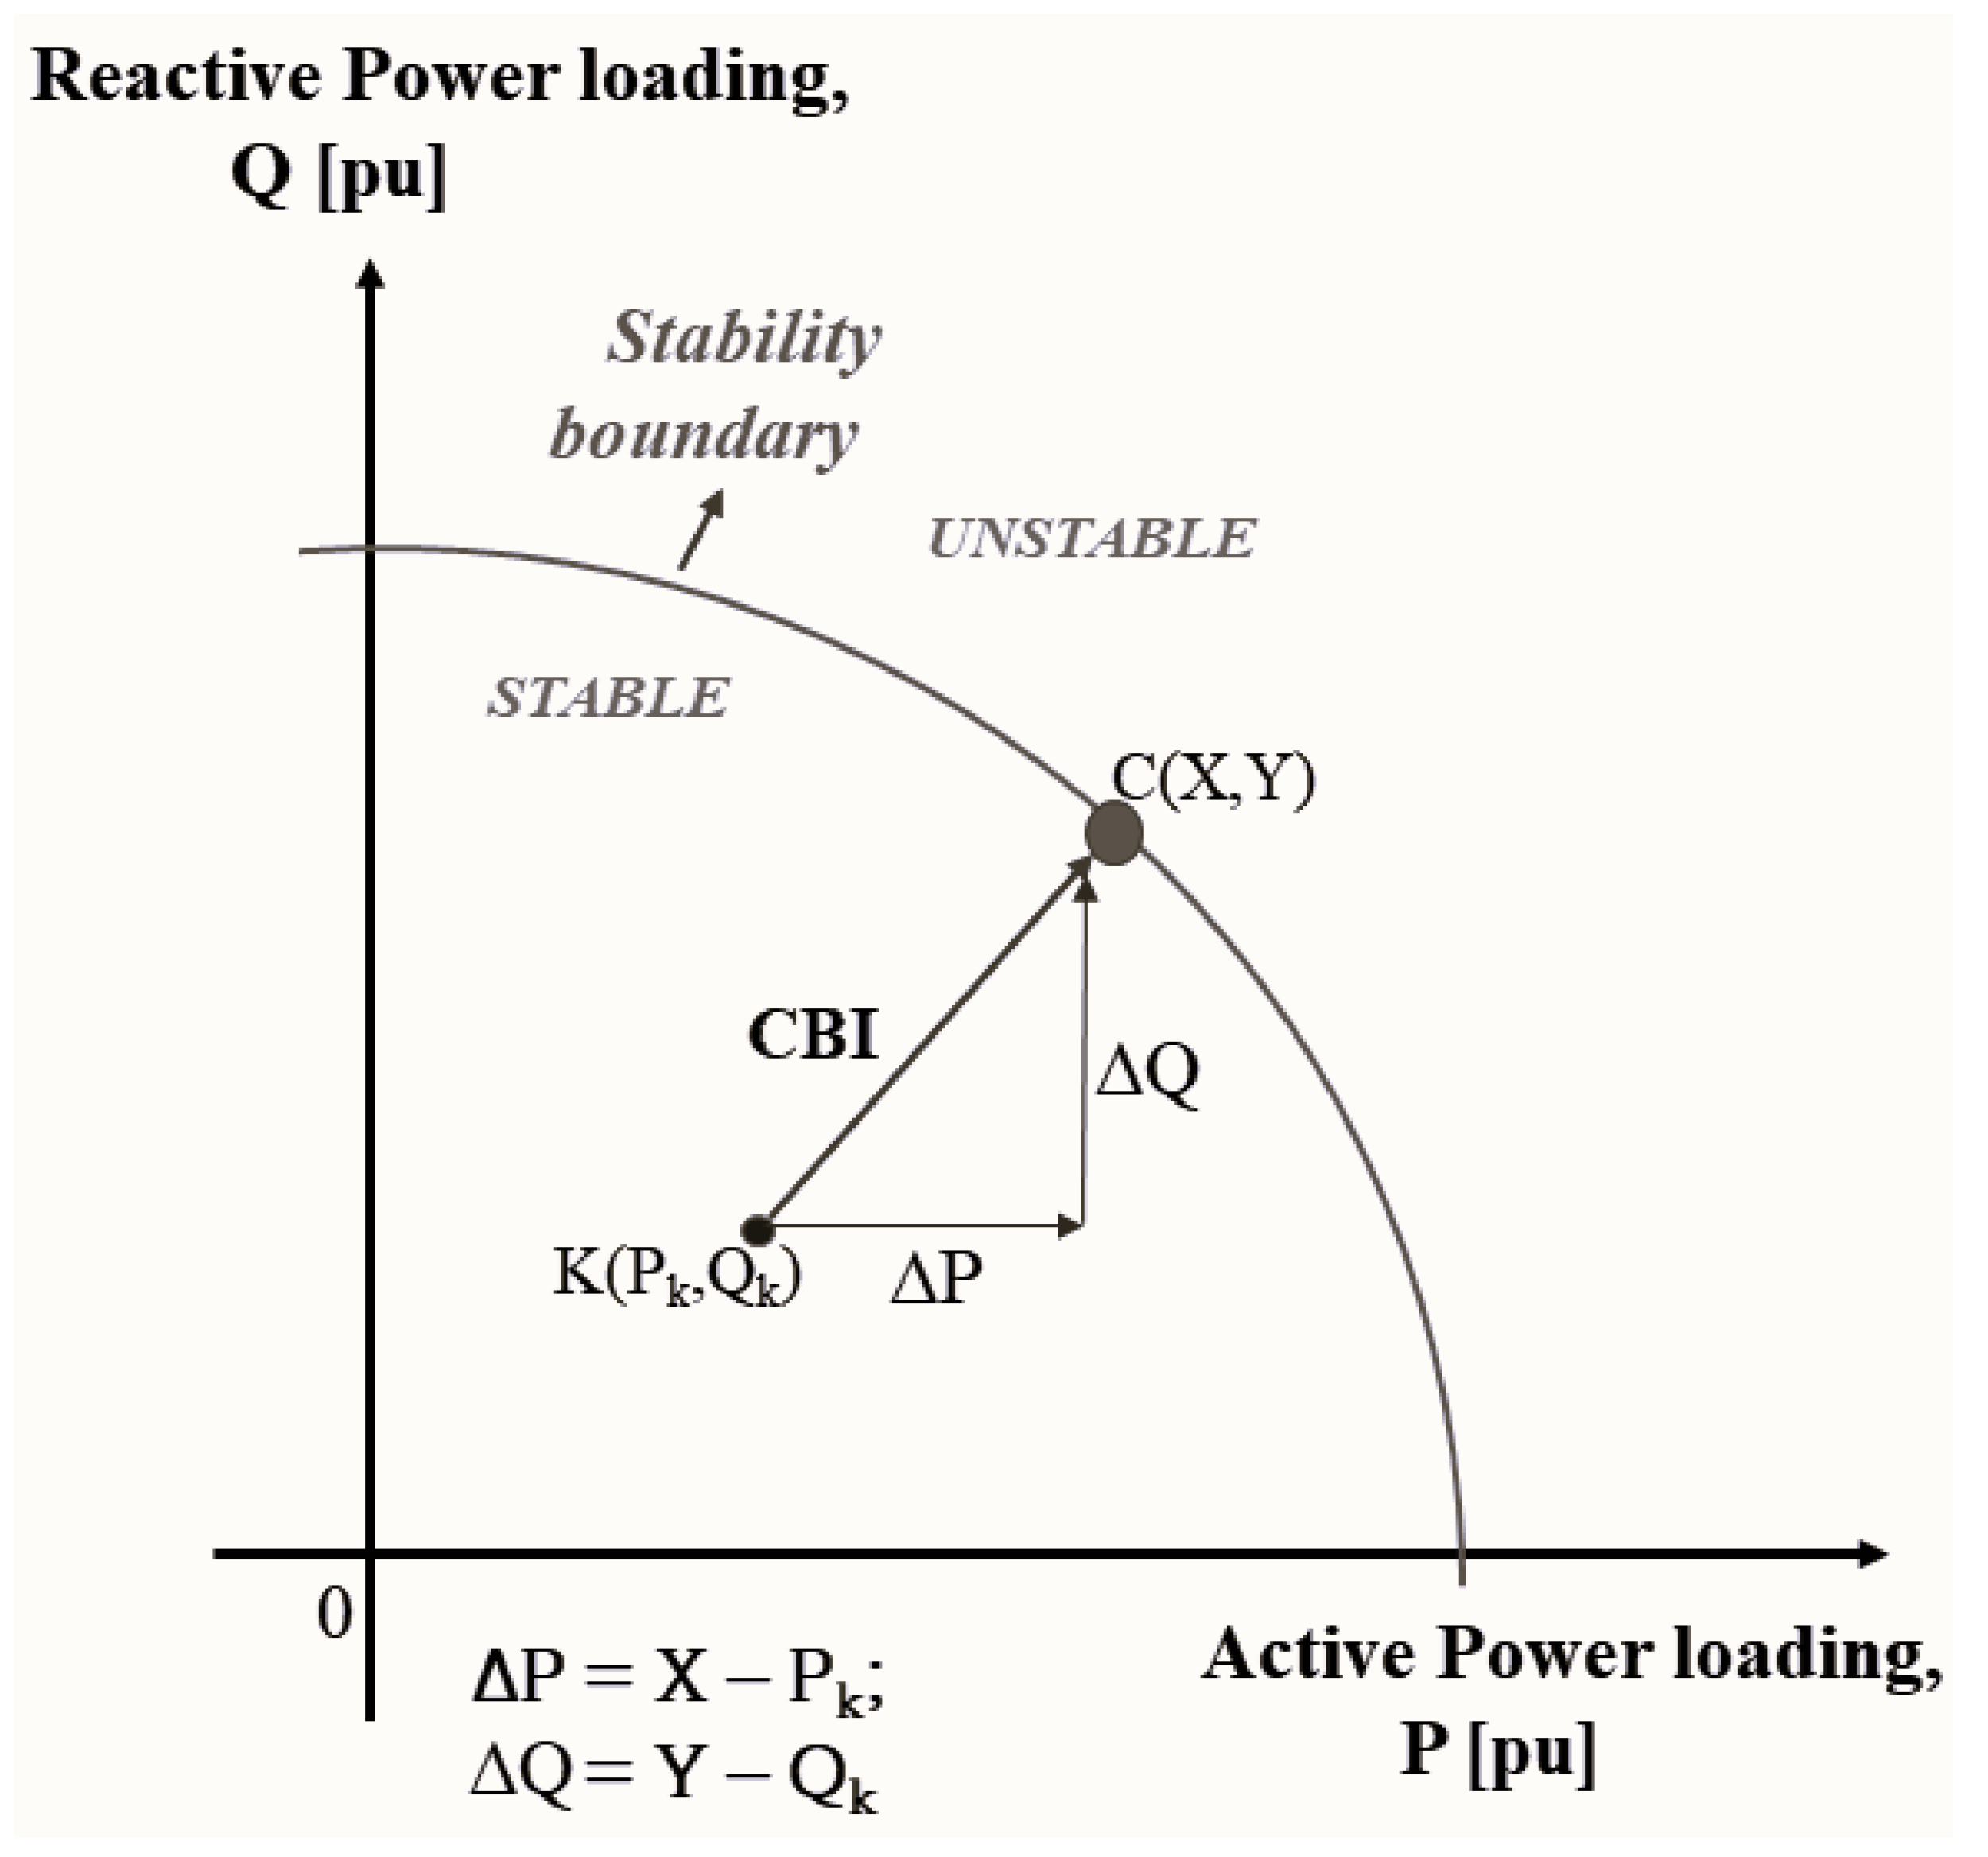
2.1. Derivation of Voltage Stability Indices

Estimating the voltage stability margin (VSM) for the secure operation of the power system at varied loading circumstances is crucial when monitoring voltage stability [34]. Most VSIs are derived from steady-state load flow solutions using the power transfer concept with no absolute unit of measurement. However, the load distance from a power system’s current operating point to the nearest point of voltage instability (near the voltage collapse point) can be estimated as the VSM [5]. From Figure 1, the power transfer equations along a transmission and the consequent equation describing the power systems’ voltage stability limit at specified loading conditions are derived below.
At both ends, the active and reactive powers/loading levels are P and Q, while the sending and receiving buses are denoted as i and k, respectively. The bus voltage magnitude and angle are V and δ , while the line reactance and resistance are r and x. Consequently, the power at the receiving end is based on the power transfer equation:
P k + j Q k = ( V k δ k ) V i δ i V k δ k r i k + j x i k *
By resolving Equation (1) further as detailed in [5], the following equations were obtained:
P k r i k + x i k Q k + j r i k Q k x i k P k = V i V k cos δ i δ k j V i V k sin δ i δ k V k 2
Analyzing Equation (2) yields a non-linear function (Equation (3)) with its unique positive and real roots (Equation (4)) establishing the condition for power system voltage stability [5].
V k 4 + 2 V k 2 P k r i k + Q k x i k 0.5 V i 2 + P k 2 + Q k 2 r i k 2 + x i k 2 = 0
P k r i k + Q k x i k 0.5 V i 2 2 + P k 2 + Q k 2 r i k 2 + x i k 2 0
Consequently, most of the conventional steady-state VSIs for monitoring critical lines are derived from the simplification of Equation (4); some of these VIs are expressed below:
  • Line stability factorq, L Q P [35]:
    4 x i k V i 2 Q k + P i 2 x i k V i 2
  • Line stability factorp, L P P [35]:
    4 r i k V i 2 P k + Q i 2 r i k V i 2
  • Line stability index, L m n [36]:
    4 x i k Q k ( V i sin ( θ δ ) ) 2
  • Fast voltage stability index, F V S I [37]:
    4 z i k 2 Q k V i 2 x i k
  • Novel voltage stability index, N V S I [38]:
    2 x i k P k 2 + Q k 2 2 Q k x i k V i 2
  • Modern voltage stability index, M V S I [39]:
    2 z i k 2 P k 2 + Q k 2 2 Q k Z i k 2 x i k V i 2
  • Novel line stability index, N L S I [40]:
    4 ( P k r i k + Q k x i k ) V i 2 cos 2 δ
  • Critical boundary index, C B I [5]
    C B I = X P k 2 + Y Q k 2
z is the line impedance, θ is the impedance angle, and δ = ( δ i δ k ) is the sending to receiving end voltage angle difference. VSIs 1 to 6, i.e., Equations (6)–(11), have no specified unit with an absolute value of 0 indicating no loading (ideal stable) and 1.0 indicating severe loading (point of instability/near voltage collapse). However, CBI is the optimal VSM based on transmission line criticality; hence, a low CBI value indicates poor VSM. As shown in Figure 2, C ( X , Y ) is an “unstable point” of real and reactive loading on the voltage stability boundary (described by Equation (4)) referenced to the current operating point, K ( P k , Q k ) [5,34].

2.2. Implementing ANFIS for Voltage Stability Monitoring

Many fuzzy inference systems (FISs) use ’if-then’ probabilistic rules to simulate qualitative decision-making without quantitative details [41]. This study adopted the ANFIS technique based on the Takagi–Sugeno fuzzy system with backpropagation gradient descent and least square methods for pre-processing and optimal output parameter estimation [42]. According to Figure [43], the ANFIS paradigm has five major information processing components: f u z z i f i c a t i o n , m u l t i p l i c a t i o n , n o r m a l i z a t i o n , d e f u z z i f i c a t i o n , and s u m m i n g for total output.
For an ANFIS model with two inputs (x,y) and one output (f), the implementation requires two ‘if-then’ rules based on the first-order Takagi–Sugeno model as described:
Rule 1 : if x is A 1 and y is B 1 , then : f 1 = p 1 x + q 1 y + r 1 Rule 2 : if x is A 2 and y is B 2 , then : f 2 = p 2 x + q 2 y + r 2
A k and B k are fuzzy sets, f i are fuzzy rule outputs, and p k , q k , and r k are training parameters.
  • Layer 1—In the fuzzification layer, square adaptive nodes have fuzzy membership functions represented by specific inference rules:
    O k 1 = μ A k ( x ) , k = 1 , 2
    O k 1 = μ B k ( y ) , k = 1 , 2
The membership grade of fuzzy sets, O k 1 , represents the agreement between input (x,y). The fuzzy sets A k , B k , and μ quantify the element’s membership grade using Gaussian rules.
  • Layer 2 —The multiplication/product layer processes fuzzification layer input values based on membership function strength and the pre-specified product rule. This layer’s fixed and non-adaptive nodes multiply input values to determine each node’s output (fuzzy rule firing strength):
    O k 2 = w k = μ A k ( x ) · μ B k ( y ) , k = 1 , 2
  • Layer 3—This layer normalizes the projected firing strengths from rule 2 by comparing each rule’s firing strength to all the rules’ overall firing strengths. The nodes are fixed and non-adaptive, and the k-th rule’s normalized firing strength is as follows:
    O k 3 = w k ¯ = w k w 1 + w 2 ; k = 1 , 2
  • Layer 4—the adaptive nodes in this layer decode the normalized firing strengths from layer three based on layer two’s inference rules. Finding the product of the normalized firing strengths yields a first-order polynomial function that shows the model’s output as a result of the third layer’s k-th rule and based on the consequent parameters, as described:
    O k 4 = w k ¯ ( p k x + q k y + r k ) = w k ¯ f k , k = 1 , 2
w k ¯ denotes the normalized firing strengths, ( p k , q k , r k ) are the consequent parameters, while f k is the output function.
  • Layer 5—The last layer has one non-adaptive summation node. This node sums the output values from layer 4 to obtain the final output, and all fuzzy categorizations of results are then converted to concrete/interpretable values.
    O k 5 = k w k ¯ f k = k w k ¯ f k k w k ¯
The capability of the subtractive clustering tuning approach for consistent predictive performance is exploited in this study. In subtractive clustering, each input data point is a cluster center candidate for ANFIS tuning, and the potential of each data point is determined by estimating its strength from surrounding data points from the assumed cluster center, iteratively [44,45]. Thus, for an input data set of n normalized data sets in M dimensions, the potential, P k , of a data point, x k , is calculated as:
P k = j = 1 n e α x k x j 2
The Euclidean distance α depends on the clustering radius, and the location and influence of a data point to surrounding data points determines its potential as a cluster center. The data point with the highest probability function dominates all other points within the specified cluster center’s radius (r) at each iteration. The next cluster center is fixed by reestimating the power of surrounding locations outside the initial center’s effect, and this analysis is repeated to find a cluster center that has the most substantial influence on all data points within its radius. Thus, the clustering radius (r) is an essential modeling parameter determining the model’s performance. In this study, the ANFIS model with subtractive clustering is developed to predict the voltage stability condition of power systems using the results from the load flow-based VSI estimation procedure as the input information, as illustrated in Figure 3.

2.2.1. Data Preparation

To gather and process the data required for training and validating the ANFIS-VSI model under various power system load situations, the base real and reactive loads at all nodes/buses are step-wisely increased. Load flow analysis for five overloading conditions is performed without compromising the solution points’ tractability (convergence/fidelity) [47]. Thus, the data for implementing the developed predictive model are generated from the load flow-based voltage stability analysis under six PQ-loading conditions, i.e., the base PQ-load and five overload conditions. Table 1 presents the data structure of the constructed ANFIS model, with ψ representing the (PQ)-load increment factor.
The table illustrates the essential input features: line resistance and reactance, active and reactive power injections at the receiving end, sending end voltage magnitude, and the difference between sending and receiving end voltage angles referenced to the sending end. The target/output predicts power system voltage stability conditions based on the estimated NLSI or CBI values. Given the six loading instances, the length of the data point L d a t a is 6 × N b r . , where N b r . denotes the number of lines/branches in the network. To construct the ANFIS-VSI model, 80% of the total data is used for model training ( L t r a i n ) and the remaining for testing and validation ( L t e s t ). As a function of the base real and reactive load at each bus, a step-wise load increase of 10% to 50% was considered for the IEEE 14-bus system (i.e., the load increase factor, ψ = 0.10), while a load increase of 1% to 5% was considered for the IEEE 118-bus system (i.e., the load increase factor, ψ = 0.01). The training and testing data distribution for the two test systems is presented in Table 2.

2.2.2. Performance Metrics

The subsequent performance metrics, which are based on sturdy statistical evaluation, are adopted to validate the feasibility of the developed ANFIS-VSI model for reliable monitoring of power system voltage stability:
  • Percentage Relative Root Mean Square Error ( R R M S E P ): Comparing quantities of different ranges, units, and magnitudes is more objective using the relative root mean square error (RRMSE). RRMSE is calculated by dividing RMSE with the average value of the measured data, i.e., the estimated VSI values from load flow analysis [48]. Thus, the percentage RRMSE is calculated as follows:
    R R M S E P = 1 N i = 1 N V S I i c a l . V S I i p r e d . 2 i = 1 N V S I i c a l . × 100 %
    The benefit of using R R M S E P for validating model accuracy is the standardized scale of performance interpretations as specified: ’Excellent’ when R R M S E P ≤ 10%, ’Good’ if 10% ≤ R R M S E P ≤ 20%, ’Fair’ if 20% ≤ R R M S E P ≤ 30%, and ’Poor’ if R R M S E P ≥ 30%.
  • Mean Percentage Absolute Error ( M A P E ): This is also known as the mean absolute percentage error or the mean absolute percentage deviation. It is one of the primary, simple, yet objective measures for prediction accuracy in the cross-correlated data system. Performance accuracy is measured as a percent of the actual value for easy understanding [49]. For effective model performance, the value of this metric should be close to zero percent.
    M A P E = 1 N i = 1 N V S I i c a l . V S I i p r e d . V S I i c a l . × 100 %
  • Coefficient of correlation (R): The strength of the relationship between the input variables and the expected output is often measured using the correlation coefficients. The standard coefficient of correlation metric is Pearson’s correlation, R, used for linear regression analysis. A value of R sufficiently close to 1.0 shows that the selected input information significantly influences the values of the desired output.
    R = 1 i = 1 N V S I i c a l . V S I i p r e d . 2 i = 1 N V S I i c a l . V S I i m e a n 2
where N is the data length, V S I c a l . is the calculated VSI value, V S I p r e d . is the predicted VSI value using the developed ANFIS-VSI model, and V S I m e a n is the mean of the calculated VSI values.

3. Simulation

3.1. Conditions and Assumptions

The performance of the VSI predictive model is evaluated using the IEEE 14-bus system with 20 transmission lines and the extended IEEE 118-bus system with 186 transmission lines, taking into account network complexity; complete details for modeling both networks are obtained in References [14,50]. The model was implemented and run on Matlab version 2023b using a PC with 64-bit, Intel(R) Core(TM), i7-8650U processor at 1.90 GHz.
The input and target information, as well as the description for the ANFIS-VSI modeling, are as given: Inputs: [ r i k , x i k , P k , Q k , V i , δ i k ] ; Output/target: VSI—“NLSI” and “CBI”. The clustering radius (radius of inference) is a crucial simulation parameter; thus, simulations were run for different clustering radii from r = 0.1 to 0.9. Based on observation and objective inferences, the ANFIS model converges to reliable output values from r = 0.2 to 0.5 for the IEEE 14-bus system, and r = 0.2 yielded consistent results for the IEEE 118-bus system. Thus, the ANFIS implementation parameters for this study are provided in Table 3.

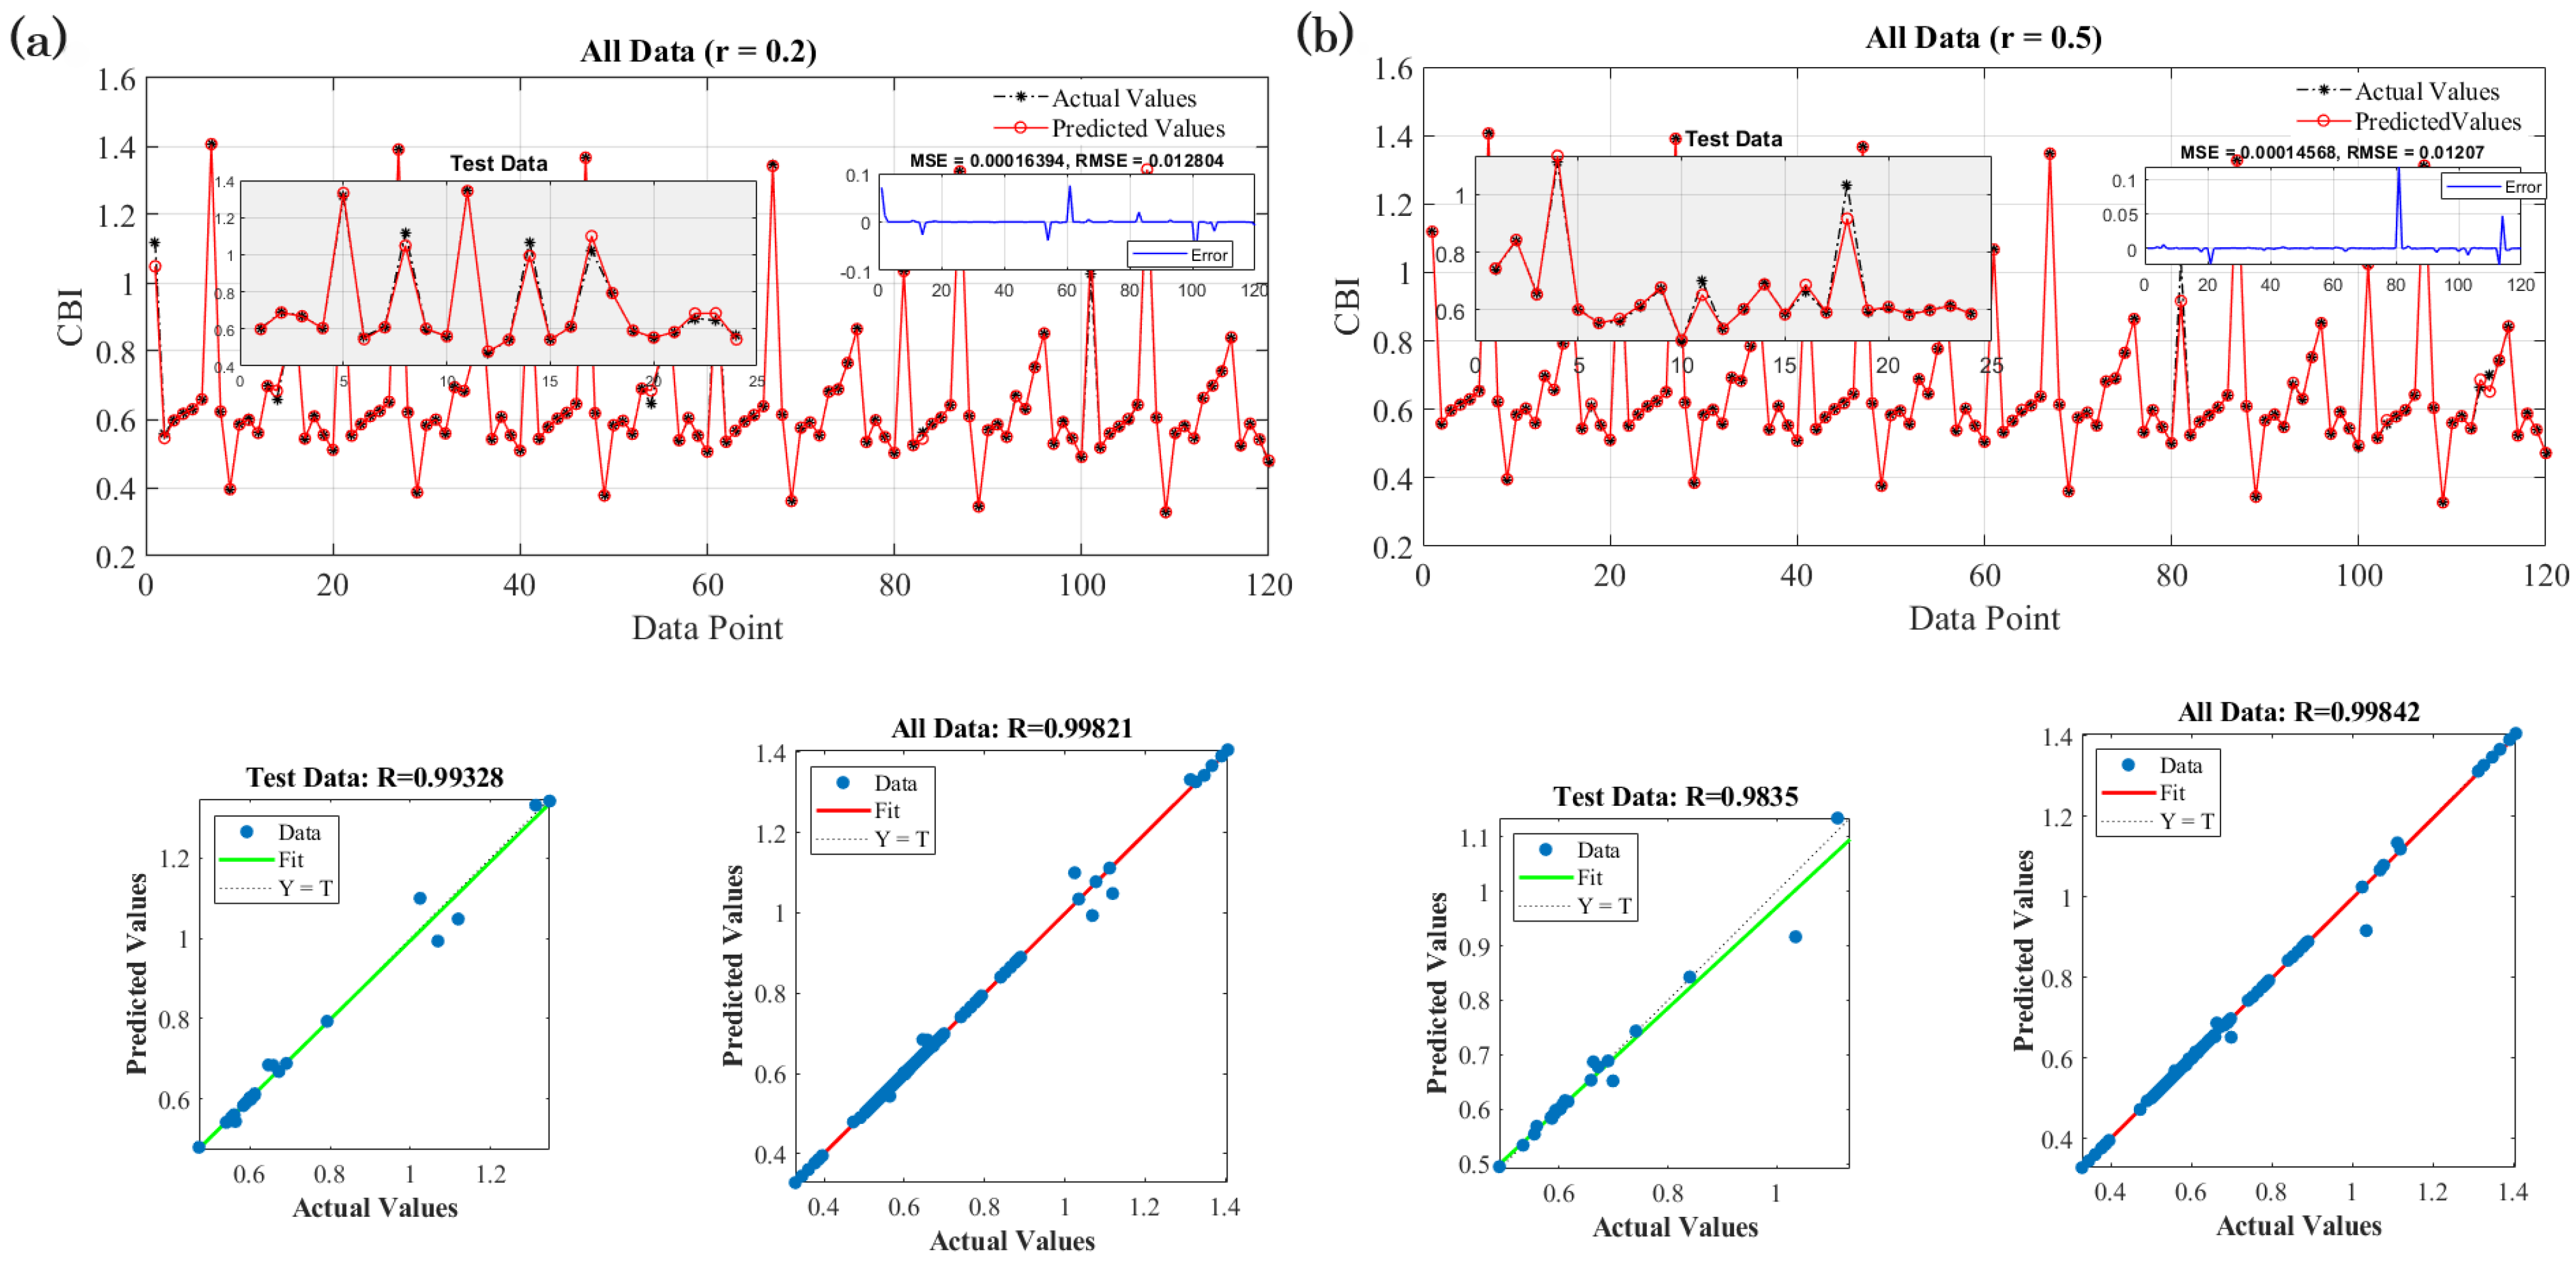
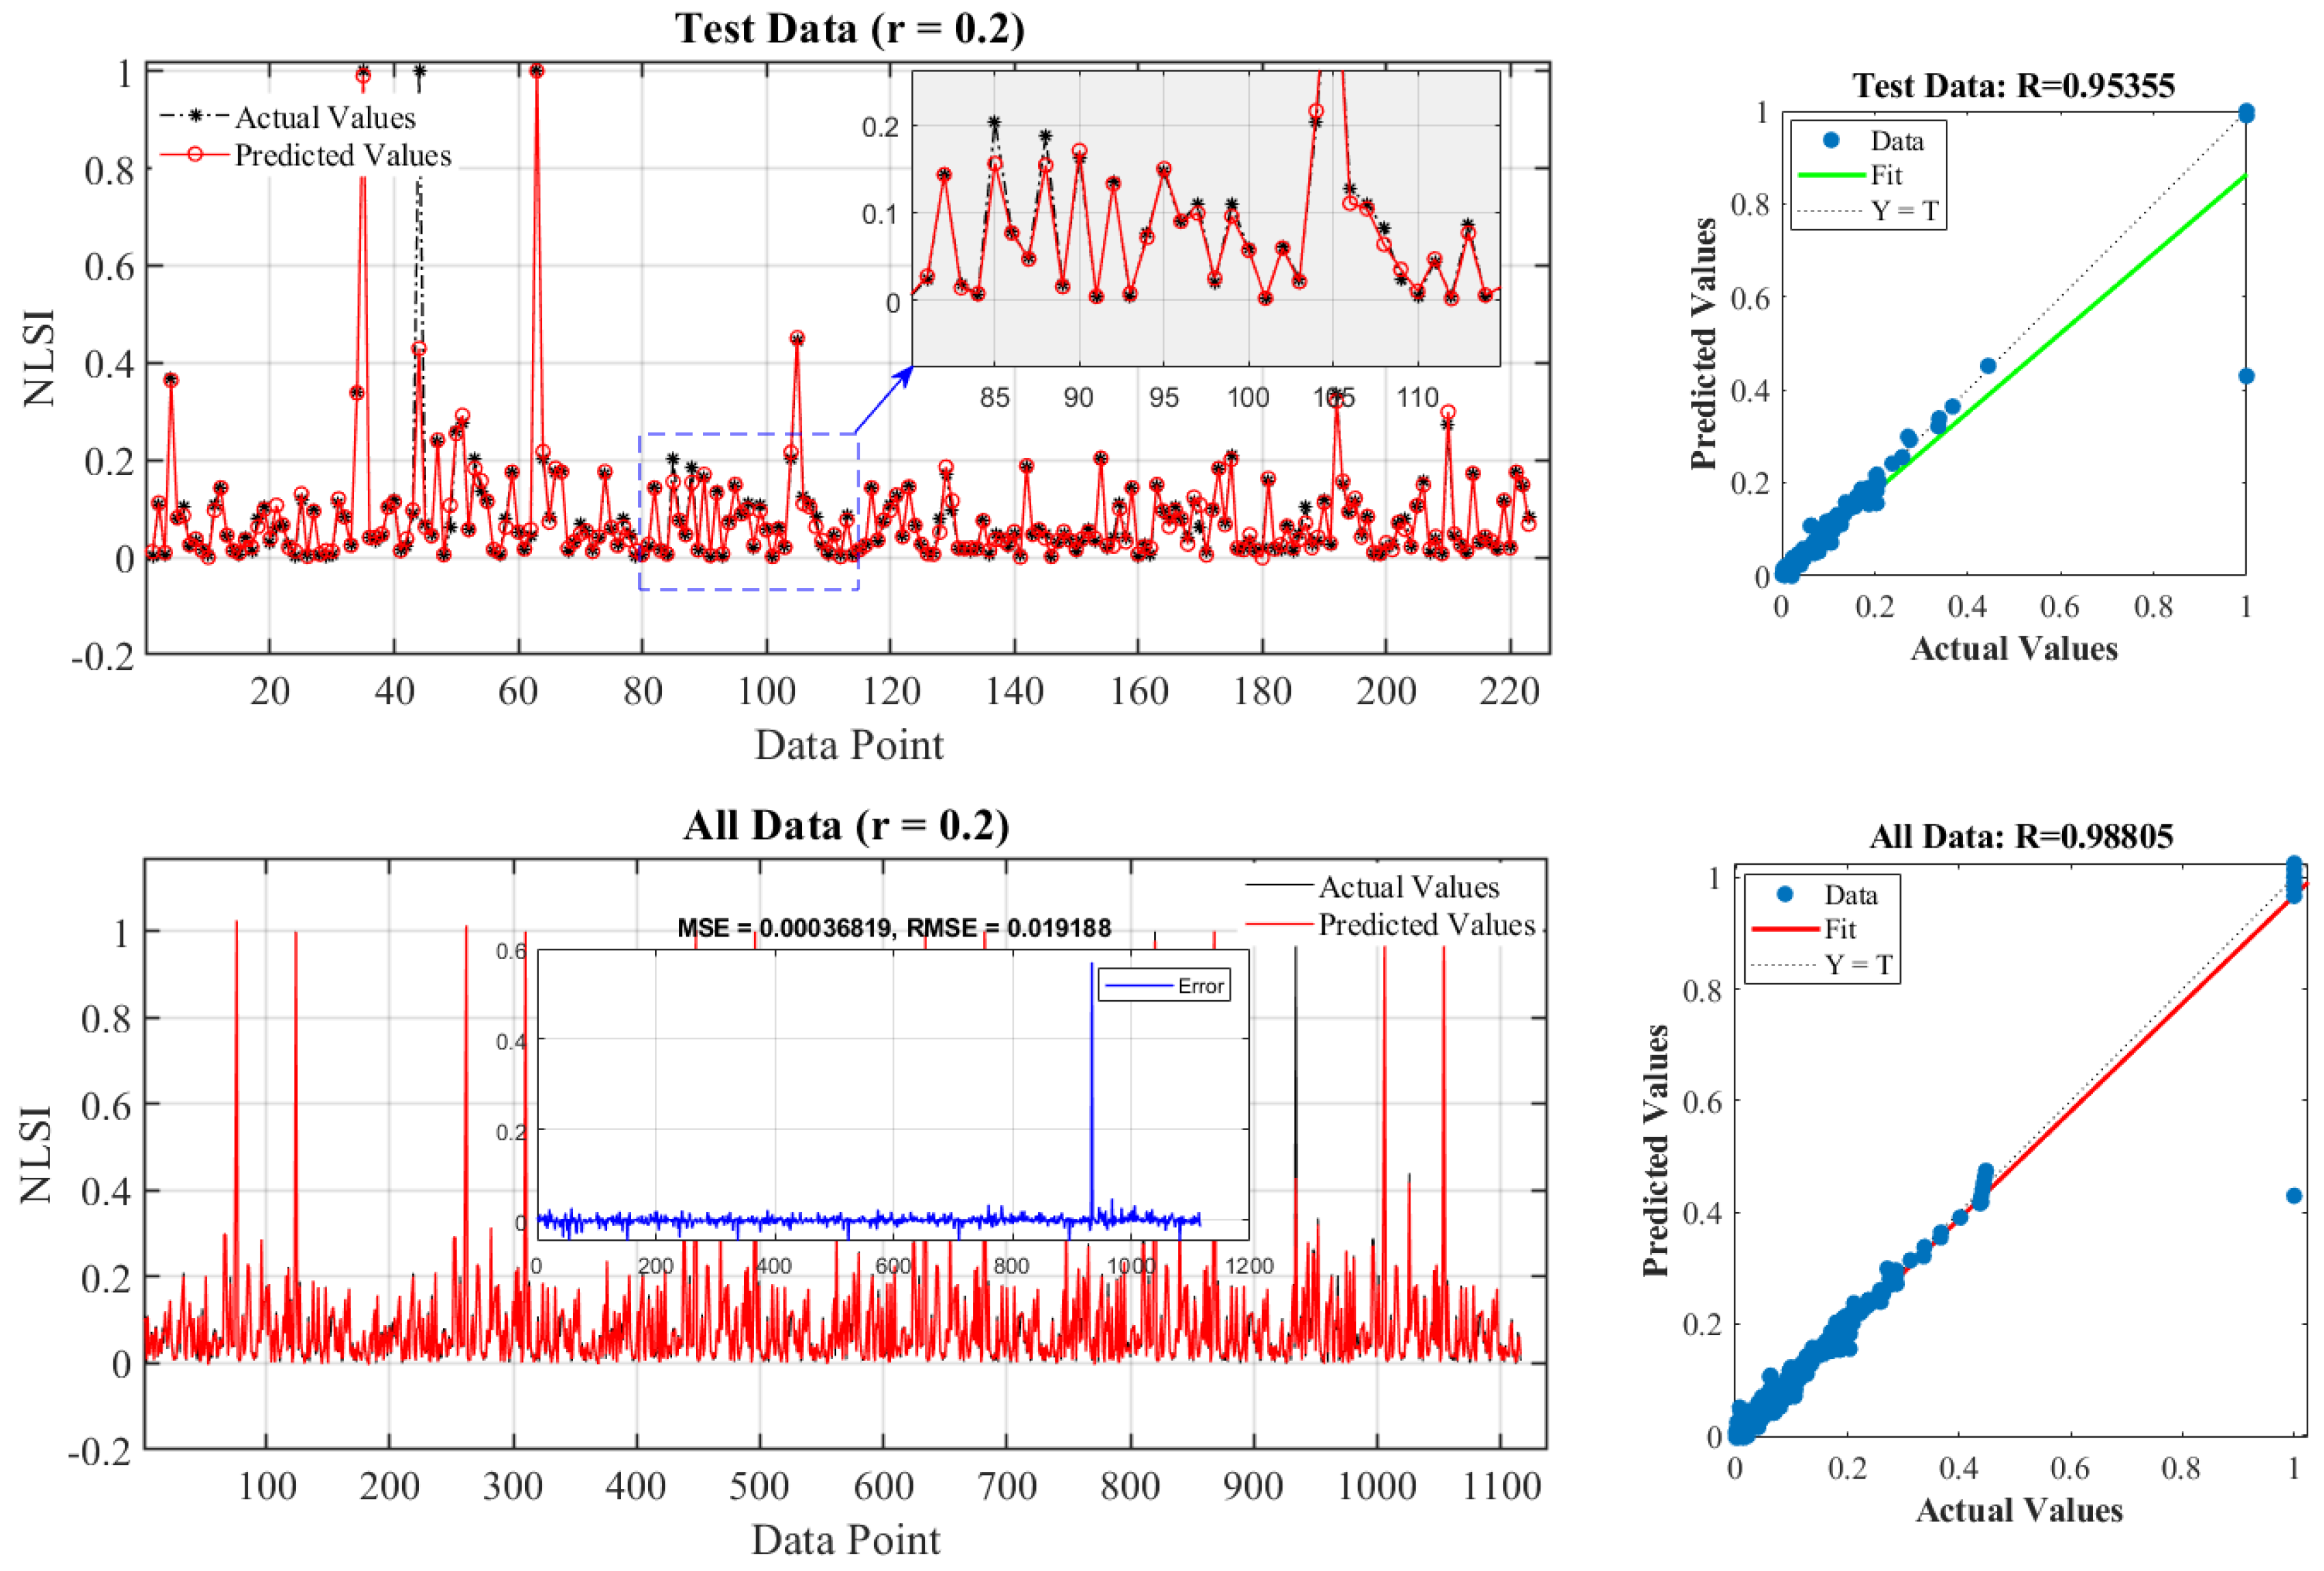
3.2. Results and Discussion

Figure 4 and Figure 5 present the comparison of the actual and predicted values and the regression plots for the ANFIS model implementation for predicting NLSI and CBI, respectively, for the IEEE 14-bus system. Similarly, the prediction comparison and the regression plots for the ANFIS-based prediction of NLSI and CBI for the IEEE 118-bus system are shown in Figure 6 and Figure 7, respectively. Considering the regression, R results for the test data and complete data, Table 4 shows the predictability and consistency of both VSIs using the ANFIS model at r = 0.2 with multiple simulation runs. Subsequently, the detailed comparative performance analysis of the developed predictive analytics for validating the effectiveness of NLSI and CBI as credible tools for online intelligent voltage stability monitoring using the two power system network cases is presented in Table 5.
The error analyses are graphically illustrated in Figure 4, Figure 5, Figure 6 and Figure 7, showing the corresponding mean square error ( M S E and R M S E ) values as well as the error variations and peaks. Specific details of the performance of the ANFIS model on the testing data set are drawn out for comprehensive performance analysis. The details in Table 5 are extracted from the observed results as graphically illustrated in Figure 4, Figure 5, Figure 6 and Figure 7. For the IEEE 14-bus system at r = 0.2 , M A P E is estimated to be 3.150% and 0.361% for NLSI and CBI, respectively, the R R M S E P is calculated as 25.029% and 1.930% for NLSI and CBI, respectively, and R yielded 0.8564 for NLSI and 0.9982 for CBI. To evaluate objectively and in detail, similar predictive analysis was performed on the IEEE 14-bus system at an influence range r = 0.5 ; M A P E is calculated as 8.746% and 0.306% for NLSI and CBI, respectively, the R R M S E P is recorded to be 42.724% and 1.819% for NLSI and CBI, respectively and R analysis for NLSI is 0.7702 and 0.9984 for CBI. For the IEEE 118-bus system, it is observed from multiple simulation runs that clustering radii above r = 0.2 gave inconsistent results for the predictions; thus, the predictive analysis for the IEEE 118-bus is limited to r = 0.2 only. R R M S E P is calculated as 22.286% and 1.248% for NLSI and CBI, respectively, and R yielded 0.9881 for NLSI and 0.9980 for CBI, with M A P E calculated as 31.255% and 1.749% for NLSI and CBI, respectively, for the IEEE 118-bus system with r = 0.2 .
Based on the linear regression analysis, the R correlation coefficient measures the significant relationship between the output (NLSI or CBI) and the six inputs’ information. The regression analysis for IEEE 14-bus indicates that the calculation of CBI is significantly influenced by the input information, with R estimated at 0.8564 for NLSI and 0.9982 for CBI at r = 0.2 ; R = 0.7702 and 0.9984 for NLSI and CBI at r = 0.5 , and this trend is observed for the IEEE 118-bus system with R = 0.9881 for NLSI and 0.9980 for CBI at r = 0.2 . Looking closely at the performance of both VSIs at multiple simulations of the ANFIS-VSI model, the consistent predictability of CBI over NLSI is further emphasized by the regression results presented in Table 4, as reflected in the lower and inconsistent R values recorded for NLSI compared to the CBI. While there are negative regressions and wide disparities of solutions (poor convergence) for the test data for NLSI, the CBI data show more agreeable solution points for all the runs.
Remarkably, supported with the R R M S E p , M A P E , and the R values, the regression plots highlight the difference between the predictability of NLSI compared to CBI, showing the sparseness distribution of the NLSI data points compared to CBI and the wide misalignment of the line of best fit from the reference line of perfect fit for all the test cases. Thus, the percentage error analysis shows that the developed ANFIS model is adequate for intelligently monitoring the voltage stability conditions of the two power systems using the NLSI and CBI. However, it can be inferred from the obtained M A P E , R R M S E P , and R values that the consistency of CBI as a voltage stability indicator makes it more viable for real-time monitoring, especially at loading levels closer to the voltage collapse.

4. Conclusions

The ANFIS model was used to examine the performance accuracy of two contemporary power system voltage stability monitoring tools. The performance viability of NLSI and CBI as reliable techniques for modeling intelligent real-time prediction-based voltage stability monitoring was investigated. The ANFIS model tuned with a subtractive clustering approach was implemented, and credible power system parameters were trained using estimated data values from load flow-based VSI solutions at different loading levels. The model’s performance was assessed by statistical error analysis using metrics such as the mean absolute percentage error ( M A P E ), percentage relative root mean square error ( R R M S E P ), and the correlation coefficient (R). The simulation results provided justifiable evidence for accepting the robustness of CBI, as indicated by the three performance metrics concerning the consistency of convergence, precision of prediction, and the accuracy of predicted values. Future studies will involve applicable feature engineering and data preprocessing for the adoption of contemporary AI-based predictive analytics for model validation in suitable real-time simulation environments.

Author Contributions

O.B.A.: methodology, modeling, software, writing—original draft. S.K.: conceptualization, resource, supervision, project administration. All authors have read and agreed to the published version of the manuscript.

Funding

This research was partly funded by the NRF Thuthuka Grant, Number 138177, and the Eskom Tertiary Education Support Programme (TESP).

Data Availability Statement

All data used for the numerical simulation are reported in the manuscript, and all developed Matlab codes are available upon request to the corresponding author.

Acknowledgments

The authors gratefully acknowledge the National Research Foundation and Cape Peninsula University of Technology, South Africa, for the facilities provided to do this work.

Conflicts of Interest

The authors declare that they have no known competing financial interests or personal relationships that could have appeared to influence the work reported in this paper.

References

  1. Krishnamurthy, S.; Mohlwini, E.X. Voltage stability index method for optimal placement of capacitor banks in a radial network using real-time digital simulator. In Proceedings of the 2016 International Conference on the Domestic Use of Energy (DUE), Cape Town, South Africa, 30–31 March 2016; pp. 1–8. [Google Scholar]
  2. Adewuyi, O.B.; Howlader, H.O.R.; Olaniyi, I.O.; Konneh, D.A.; Senjyu, T. Comparative analysis of a new VSC-optimal power flow formulation for power system security planning. Int. Trans. Electr. Energy Syst. 2020, 30, e12250. [Google Scholar] [CrossRef]
  3. Kumar, R.; Mittal, A.; Sharma, N.; Duggal, I.V.; Kumar, A. PV and QV curve analysis using series and shunt compensation. In Proceedings of the 2020 IEEE 9th Power India International Conference (PIICON), Sonepat, India, 28 February–1 March 2020; pp. 1–6. [Google Scholar]
  4. Danish, M.S.S.; Senjyu, T.; Danish, S.M.S.; Sabory, N.R.; Mandal, P. A recap of voltage stability indices in the past three decades. Energies 2019, 12, 1544. [Google Scholar] [CrossRef]
  5. Furukakoi, M.; Adewuyi, O.B.; Danish, M.S.S.; Howlader, A.M.; Senjyu, T.; Funabashi, T. Critical Boundary Index (CBI) based on active and reactive power deviations. Int. J. Electr. Power Energy Syst. 2018, 100, 50–57. [Google Scholar] [CrossRef]
  6. Sarker, I.H. Ai-based modeling: Techniques, applications and research issues towards automation, intelligent and smart systems. SN Comput. Sci. 2022, 3, 158. [Google Scholar] [CrossRef] [PubMed]
  7. Suliman, S.I.; Rahman, T.K.A. Artificial immune system based machine learning for voltage stability prediction in power system. In Proceedings of the 2010 4th International Power Engineering and Optimization Conference (PEOCO), Shah Alam, Malaysia, 23–24 June 2010; pp. 53–58. [Google Scholar] [CrossRef]
  8. El-Keib, A.; Ma, X. Application of artificial neural networks in voltage stability assessment. IEEE Trans. Power Syst. 1995, 10, 1890–1896. [Google Scholar] [CrossRef]
  9. Sharma, A.K.; Saxena, A.; Soni, B.P.; Gupta, V. Voltage stability assessment using artificial neural network. In Proceedings of the 2018 IEEMA Engineer Infinite Conference (eTechNxT), New Delhi, India, 13–14 March 2018; pp. 1–5. [Google Scholar] [CrossRef]
  10. Rahi, O.; Yadav, A.K.; Malik, H.; Azeem, A.; Kr, B. Power system voltage stability assessment through artificial neural network. Procedia Eng. 2012, 30, 53–60. [Google Scholar] [CrossRef]
  11. Popović, D.; Kukolj, D.; Kulić, F. Monitoring and assessment of voltage stability margins using artificial neural networks with a reduced input set. IEEE Proc. Gener. Transm. Distrib. 1998, 145, 355–362. [Google Scholar] [CrossRef]
  12. Goh, H.; Chua, Q.; Lee, S.; Kok, B.; Goh, K.; Teo, K. Evaluation for voltage stability indices in power system using artificial neural network. Procedia Eng. 2015, 118, 1127–1136. [Google Scholar] [CrossRef]
  13. Nakawiro, W.; Erlich, I. Online voltage stability monitoring using artificial neural network. In Proceedings of the 2008 Third International Conference on Electric Utility Deregulation and Restructuring and Power Technologies, Nanjing, China, 6–9 April 2008; pp. 941–947. [Google Scholar]
  14. Ashraf, S.M.; Gupta, A.; Choudhary, D.K.; Chakrabarti, S. Voltage stability monitoring of power systems using reduced network and artificial neural network. Int. J. Electr. Power Energy Syst. 2017, 87, 43–51. [Google Scholar] [CrossRef]
  15. Jayasankar, V.; Kamaraj, N.; Vanaja, N. Estimation of voltage stability index for power system employing artificial neural network technique and TCSC placement. Neurocomputing 2010, 73, 3005–3011. [Google Scholar] [CrossRef]
  16. Bahmanyar, A.; Karami, A. Power system voltage stability monitoring using artificial neural networks with a reduced set of inputs. Int. J. Electr. Power Energy Syst. 2014, 58, 246–256. [Google Scholar] [CrossRef]
  17. Singh, P.; Parida, S.; Chauhan, B.; Choudhary, N. Online Voltage Stability Assessment Using Artificial Neural Network considering Voltage stability indices. In Proceedings of the 2020 21st National Power Systems Conference (NPSC), Gandhinagar, India, 17–19 December 2020; pp. 1–5. [Google Scholar]
  18. Ibrahim, A.M.; El-Amary, N.H. Particle Swarm Optimization trained recurrent neural network for voltage instability prediction. J. Electr. Syst. Inf. Technol. 2018, 5, 216–228. [Google Scholar] [CrossRef]
  19. Rao, A.N.; Vijayapriya, P. A robust neural network model for monitoring online voltage stability. Int. J. Comput. Appl. 2019, 44, 1103–1112. [Google Scholar] [CrossRef]
  20. Adhikari, A.; Naetiladdanon, S.; Sagswang, A.; Gurung, S. Comparison of Voltage Stability Assessment using Different Machine Learning Algorithms. In Proceedings of the 2020 IEEE 4th Conference on Energy Internet and Energy System Integration (EI2), Wuhan, China, 30 October–1 November 2020; pp. 2023–2026. [Google Scholar]
  21. Ashfaq, M. A Tribute to Father of Fuzzy Set Theory and Fuzzy Logic (Dr. Lotfi A. Zadeh). J. Swarm. Intel. Evol. Comput. 2018, 7, 2. [Google Scholar]
  22. Mendel, J.M. Type-2 fuzzy sets as well as computing with words. IEEE Comput. Intell. Mag. 2019, 14, 82–95. [Google Scholar] [CrossRef]
  23. Jang, J.S. ANFIS: Adaptive-network-based fuzzy inference system. IEEE Trans. Syst. Man Cybern. 1993, 23, 665–685. [Google Scholar] [CrossRef]
  24. Rashed, B.M.; Popescu, N. Medical Image-Based Diagnosis Using a Hybrid Adaptive Neuro-Fuzzy Inferences System (ANFIS) Optimized by GA with a Deep Network Model for Features Extraction. Mathematics 2024, 12, 633. [Google Scholar] [CrossRef]
  25. Ljepava, N.; Jovanović, A.; Aleksić, A. Industrial Application of the ANFIS Algorithm—Customer Satisfaction Assessment in the Dairy Industry. Mathematics 2023, 11, 4221. [Google Scholar] [CrossRef]
  26. Bardhan, A.; Singh, R.K.; Ghani, S.; Konstantakatos, G.; Asteris, P.G. Modelling soil compaction parameters using an enhanced hybrid intelligence paradigm of ANFIS and improved grey wolf optimiser. Mathematics 2023, 11, 3064. [Google Scholar] [CrossRef]
  27. Nayak, N.; Das, S.R.; Panigrahi, T.K.; Das, H.; Nayak, S.R.; Singh, K.K.; Askar, S.; Abouhawwash, M. Overshoot Reduction Using Adaptive Neuro-Fuzzy Inference System for an Autonomous Underwater Vehicle. Mathematics 2023, 11, 1868. [Google Scholar] [CrossRef]
  28. Ramadan, A.; Kamel, S.; Hamdan, I.; Agwa, A.M. A novel intelligent ANFIS for the dynamic model of photovoltaic systems. Mathematics 2022, 10, 1286. [Google Scholar] [CrossRef]
  29. Modi, P.; Singh, S.P.; Sharma, J. Fuzzy neural network based voltage stability evaluation of power systems with SVC. Appl. Soft Comput. 2008, 8, 657–665. [Google Scholar] [CrossRef]
  30. Wu, H.; Dong, P.; Liu, M. Distribution network reconfiguration for loss reduction and voltage stability with random fuzzy uncertainties of renewable energy generation and load. IEEE Trans. Ind. Inform. 2018, 16, 5655–5666. [Google Scholar] [CrossRef]
  31. Rezaie, H.; Kazemi-Rahbar, M.H. Enhancing voltage stability and LVRT capability of a wind-integrated power system using a fuzzy-based SVC. Eng. Sci. Technol. Int. J. 2019, 22, 827–839. [Google Scholar] [CrossRef]
  32. Ghaghishpour, A.; Koochaki, A. An intelligent method for online voltage stability margin assessment using optimized ANFIS and associated rules technique. ISA Trans. 2020, 102, 91–104. [Google Scholar] [CrossRef]
  33. Amroune, M.; Musirin, I.; Bouktir, T.; Othman, M.M. The amalgamation of SVR and ANFIS models with synchronized phasor measurements for on-line voltage stability assessment. Energies 2017, 10, 1693. [Google Scholar] [CrossRef]
  34. Adewuyi, O.B.; Adeagbo, A.P.; Adebayo, I.G.; Howlader, H.O.R.; Sun, Y. Modified analytical approach for PV-DGs integration into a radial distribution network considering loss sensitivity and voltage stability. Energies 2021, 14, 7775. [Google Scholar] [CrossRef]
  35. Mohamed, A.; Jasmon, G.; Yusoff, S. A static voltage collapse indicator using line stability factors. J. Ind. Technol. 1989, 7, 73–85. [Google Scholar]
  36. Moghavvemi, M.; Omar, F. Technique for contingency monitoring and voltage collapse prediction. IEEE Proc. Gener. Transm. Distrib. 1998, 145, 634–640. [Google Scholar] [CrossRef]
  37. Musirin, I.; Rahman, T.A. Novel fast voltage stability index (FVSI) for voltage stability analysis in power transmission system. In Proceedings of the Student Conference on Research and Development, Shah Alam, Malaysia, 17 July 2002; pp. 265–268. [Google Scholar]
  38. Kanimozhi, R.; Selvi, K. A novel line stability index for voltage stability analysis and contingency ranking in power system using fuzzy based load flow. J. Electr. Eng. Technol. 2013, 8, 694–703. [Google Scholar] [CrossRef]
  39. Mokred, S.; Wang, Y.; Chen, T. Modern voltage stability index for prediction of voltage collapse and estimation of maximum load-ability for weak buses and critical lines identification. Int. J. Electr. Power Energy Syst. 2023, 145, 108596. [Google Scholar] [CrossRef]
  40. Yazdanpanah-Goharrizi, A.; Asghari, R. A novel line stability index (NLSI) for voltage stability assessment of power systems. In Proceedings of the 7th WSEAS International Conference on Power Systems, Beijing, China, 15–17 September 2007; pp. 164–167. [Google Scholar]
  41. Adedeji, P.A.; Akinlabi, S.A.; Madushele, N.; Olatunji, O.O. Hybrid neurofuzzy investigation of short-term variability of wind resource in site suitability analysis: A case study in South Africa. Neural Comput. Appl. 2021, 33, 13049–13074. [Google Scholar] [CrossRef]
  42. Singh, R.; Kainthola, A.; Singh, T. Estimation of elastic constant of rocks using an ANFIS approach. Appl. Soft Comput. 2012, 12, 40–45. [Google Scholar] [CrossRef]
  43. Adedeji, P.A.; Akinlabi, S.; Madushele, N.; Olatunji, O.O. Wind turbine power output very short-term forecast: A comparative study of data clustering techniques in a PSO-ANFIS model. J. Clean. Prod. 2020, 254, 120135. [Google Scholar] [CrossRef]
  44. Benmouiza, K.; Cheknane, A. Clustered ANFIS network using fuzzy c-means, subtractive clustering, and grid partitioning for hourly solar radiation forecasting. Theor. Appl. Climatol. 2019, 137, 31–43. [Google Scholar] [CrossRef]
  45. Adeleke, O.; Akinlabi, S.A.; Jen, T.C.; Dunmade, I. Prediction of municipal solid waste generation: An investigation of the effect of clustering techniques and parameters on ANFIS model performance. Environ. Technol. 2022, 43, 1634–1647. [Google Scholar] [CrossRef]
  46. Sarkar, J.; Prottoy, Z.H.; Bari, M.T.; Al Faruque, M.A. Comparison of ANFIS and ANN modeling for predicting the water absorption behavior of polyurethane treated polyester fabric. Heliyon 2021, 7, e08000. [Google Scholar] [CrossRef]
  47. Adewuyi, O.B.; Krishnarmurthy, S. Performance Assessment of Steady-State Voltage Stability Indices for Parameter Validation Using ANFIS. In Proceedings of the 2023 10th International Conference on Power and Energy Systems Engineering (CPESE), Nagoya, Japan, 8–10 September 2023; pp. 129–134. [Google Scholar]
  48. Despotovic, M.; Nedic, V.; Despotovic, D.; Cvetanovic, S. Evaluation of empirical models for predicting monthly mean horizontal diffuse solar radiation. Renew. Sustain. Energy Rev. 2016, 56, 246–260. [Google Scholar] [CrossRef]
  49. Chou, J.S.; Ngo, N.T.; Chong, W.K. The use of artificial intelligence combiners for modeling steel pitting risk and corrosion rate. Eng. Appl. Artif. Intell. 2017, 65, 471–483. [Google Scholar] [CrossRef]
  50. Pena, I.; Martinez-Anido, C.B.; Hodge, B.M. An extended IEEE 118-bus test system with high renewable penetration. IEEE Trans. Power Syst. 2017, 33, 281–289. [Google Scholar] [CrossRef]
Figure 1. Two-nodes illustration of transmission network [5].
Mathematics 12 03008 g001
Figure 2. P–Q curve showing the voltage stability margin as a function of load increase [5].
Mathematics 12 03008 g002
Figure 3. (a) The five-layer architecture of the ANFIS model [46], (b) the schematic illustration of the developed ANFIS-VSI model.
Mathematics 12 03008 g003
Figure 4. NLSI prediction performance, error analysis, and regression plots for IEEE 14-bus system, (a) r = 0.2 ; (b) r = 0.5 .
Mathematics 12 03008 g004
Figure 5. CBI prediction performance, error analysis, and regression plots for IEEE 14-bus system, (a) r = 0.2 ; (b) r = 0.5 .
Mathematics 12 03008 g005
Figure 6. NLSI prediction performance, error analysis, and regression plots for IEEE 118-bus system, r = 0.2 .
Mathematics 12 03008 g006
Figure 7. CBI prediction performance, error analysis, and regression plots for IEEE 118-bus system, r = 0.2 .
Mathematics 12 03008 g007
Table 1. Data matrix for ANFIS-VSI model.
Load LevelsInput DataOutput Data
r ik x ik P k Q k V i δ ik VSI
Base⋮× N b r .
Base + ( ψ × Base)
Base + 2 ( ψ × Base)
Base + 3 ( ψ × Base)
Base + 4 ( ψ × Base)
Base + 5 ( ψ × Base)
Data  size(6 × N b r . ) by 7
Table 2. Training and testing data distribution for the developed ANFIS-VSI model.
Test Systems N br . L data L train L test
IEEE 142012010218
IEEE 1181861116949167
Table 3. ANFIS-VSI model implementation parameters.
ParameterValue
Primary step size0.01
Decline rate of step size0.90
Increment rate of step size1.10
Cluster radius, r0.2, 0.5 (IEEE 14); 0.2 (IEEE 118)
Epochs200 (IEEE 14); 1500 (IEEE 118)
Table 4. Model R performance analysis for multiple runs at r = 0.2 with IEEE 14-bus system data.
RunNLSICBI
Test All Test All
10.717250.851940.998470.99936
20.482900.699720.998490.99964
30.032340.817070.996850.99910
4−0.060150.920020.861640.99190
5−0.441440.831600.997690.99945
60.149350.831900.999180.99967
7−0.195990.752190.992140.99638
80.519610.856420.993280.99821
Table 5. Comparative performance analysis for the case study networks.
rVSIIEEE 14IEEE 118
RMSE RRMSEp (%) MAPE (%) R RMSE RRMSEp (%) MAPE (%) R
0.2NLSI0.0305125.0293.1500.85640.0191922.28631.2550.9881
CBI0.012801.9300.3610.99820.006921.2481.7490.9980
0.5NLSI0.0520842.7248.7460.7702
CBI0.012071.8190.3060.9984
Disclaimer/Publisher’s Note: The statements, opinions and data contained in all publications are solely those of the individual author(s) and contributor(s) and not of MDPI and/or the editor(s). MDPI and/or the editor(s) disclaim responsibility for any injury to people or property resulting from any ideas, methods, instructions or products referred to in the content.

