Abstract
Breast cancer is a global health concern, emphasizing the need for early detection. However, current mammography struggles to effectively image dense breasts. Breast ultrasound can be an adjunctive method, but it is highly dependent on operator skill. Ultrasound computed tomography (USCT) reflection imaging provides high-quality 3D images, but often uses delay-and-sum (DAS) beamforming, which limits its image quality. This article proposes the integration of coherence-factor (CF) beamforming into ultrasound computed tomography (USCT) reflection imaging to enhance image quality. CF assesses the focus quality of beamforming by analyzing the signal coherence across different channels, assigning higher weights to high-quality focus points and thereby improving overall image quality. Numerical simulations and phantom experiments using our built USCT prototype were conducted to optimize the imaging parameters and assess and compare the image quality of CF and DAS beamforming. Numerical simulations demonstrated that CF beamforming can significantly enhance image quality. Phantom experiments with our prototype revealed that CF beamforming significantly improves image resolution (from 0.35 mm to 0.14 mm) and increases contrast ratio (from 24.54 dB to 63.28 dB). The integration of CF beamforming into USCT reflection imaging represents a substantial improvement in image quality, offering promise for enhanced breast cancer detection and imaging capabilities.
Keywords:
ultrasound computed tomography; reflection imaging; coherence factor; breast ultrasound imaging MSC:
92-05
1. Introduction
Breast cancer stands as the most prevalent cancer worldwide [1], underscoring the critical role of early detection and screening in reducing its mortality rate [2]. Mammography serves as a common screening tool for early breast cancer detection [3], yet it presents three significant drawbacks. Firstly, it exposes women to ionizing radiation due to X-ray use. Secondly, detecting early breast cancer in women with dense breasts proves challenging due to the overlap of suspicious tissue and glandular tissue on two-dimensional (2D) mammography images [4]. Lastly, women often endure pain and discomfort as their breasts require compression during imaging. Prior research [5,6,7] indicates that mammography coupled with adjunctive ultrasound imaging can notably enhance sensitivity for screening in dense breasts. However, current breast ultrasound (BUS) imaging encounters hurdles like non-isotropic low resolution and a high reliance on operator skill, which restrict its effectiveness in breast cancer screening and early detection [8,9]. An improved breast ultrasound imaging method is automated breast ultrasound (ABUS) [10,11,12], which can automatically obtain three-dimensional (3D) breast images, addressing the problem of high operator reliance. However, it utilizes a large linear array, and thus still suffers from non-isotropic low resolution.
To overcome the limitations of current methodologies, ultrasound computed tomography (USCT) has emerged as a promising avenue for breast cancer screening and diagnosis [5,6,7]. Offering the capability to automatically generate three-dimensional (3D) breast images across sound-speed, attenuation, and reflection modalities [13], the USCT imaging system typically comprises a bed with an opening situated atop a water tank housing a ring ultrasound transducer. This transducer, comprising numerous ultrasound elements, is movable in an up-and-down motion. The imaging procedure involves patients lying prone on the bed, allowing one breast to naturally extend through the opening. Positioned below, the ring transducer envelops the breast within water, with individual elements emitting pulse sound waves while others receive transmissive and echo waves. This process leads to the reconstruction of 2D coronal breast images across three modalities, facilitating the subsequent generation of 3D breast images through mechanical manipulation of the transducer. Following data acquisition, sound-speed and attenuation images are reconstructed based on the arrival time and amplitude of the transmissive wave signals. Meanwhile, the reflection image is derived utilizing the synthetic aperture (SA) technique and delay-and-sum (DAS) beamforming with echo wave signals. Typically, the reflection image boasts the highest resolution among the modalities, rendering it particularly adept at detecting small-scale, early-stage breast cancers. Hence, the quality of the reflection image, encompassing resolution and contrast, plays a pivotal role in the early detection and screening of breast cancer.
Numerous studies have delved into algorithms for ring-array ultrasound reflection imaging. In 1986, Greenleaf et al. utilized time-domain inversion of the full-wave equation to obtain breast ring-array ultrasound reflection images. Despite its theoretical capability for high-quality reflection images, the computational intensity of full-wave equation inversion posed practical challenges [14]. In 2011, Duric et al. adapted the commonly used plane-wave Kirchhoff migration method from geophysics for breast ultrasound tomographic imaging. Although they employed known sound-speed and attenuation distributions for correction, solving the full-wave equation remained necessary, leading to substantial computation [15]. In 2014, Ruiter et al. applied the traditional delay-and-sum method used in linear array probe reflection imaging to breast ring-array ultrasound reflection imaging. Despite optimizing the aperture to enhance image quality, larger apertures introduced significant phase errors, affecting image resolution [16]. In 2018, they compared two phase-error correction methods, utilizing sound-speed image information for echo signal phase-error correction, thereby improving the reflection image resolution. However, weak acoustic signal intensity resulted in a poor signal-to-noise ratio, and an increased number of transmit scans prolonged the imaging time [17]. In 2015, researchers like Ding M. from Huazhong University of Science and Technology introduced compressed sensing into ultrasound reflection imaging, reducing the data volume and enhancing algorithm stability, to some extent improving image quality. Yet, the computational demand of the compressed sensing algorithms remained high [18]. In 2017, they combined two filtering methods to improve breast ring-array ultrasound reflection imaging, experimentally verifying enhanced image resolution and contrast [19]. In 2016, Qu et al. proposed the synthetic aperture imaging method for ring-array probes and demonstrated its applicability through both wire model and in vitro experiments using a developed breast ring-array ultrasound reflection imaging system. This method produced isotropic high-resolution images independent of depth [20]. In 2019, they employed sound-speed images of breast ring-array ultrasound for echo signal phase-error correction, discussing the impact of sound-speed image resolution and noise levels on echo image resolution and contrast [6]. These previous studies on USCT reflection imaging have indeed produced commendable reflection images characterized by high resolution and contrast. However, the prevalent use of DAS beamforming in prior methods may limit image resolution and contrast due to the wide main lobe and side lobe characteristics [19].
In this study, we aimed to enhance the quality of USCT reflection images by integrating an adaptive beamforming approach with a ring transducer. The chosen adaptive beamforming method is the coherence-factor (CF) method, known for its ability to enhance image quality at a low computational cost. The CF method dynamically evaluates the coherence of received signals across various channels. By enhancing signals with high coherence and suppressing those with low coherence, the main lobe width can be reduced, and side lobe energy also can be effectively suppressed. Consequently, this study significantly contributes to improved image resolution and contrast, representing a substantial advancement in USCT reflection imaging.
2. Materials and Methods
2.1. Previous Delay-and-Sum Beamforming in Synthetic Aperture USCT Reflection Imaging
Most previous USCT reflection imaging methods utilized delay-and-sum (DAS) beamforming with synthetic aperture (SA) to generate grayscale reflection images from received raw echo data [21]. In DAS beamforming, the delay time for each received echo signal is calculated, and these signals are then summed for each pixel to derive its grayscale value. The SA uses the complete set of received raw echo data for each emitter–receiver pair, enabling both dynamic transmit and dynamic receive focusing through DAS beamforming. This approach ensures the acquisition of high-quality reflection images.
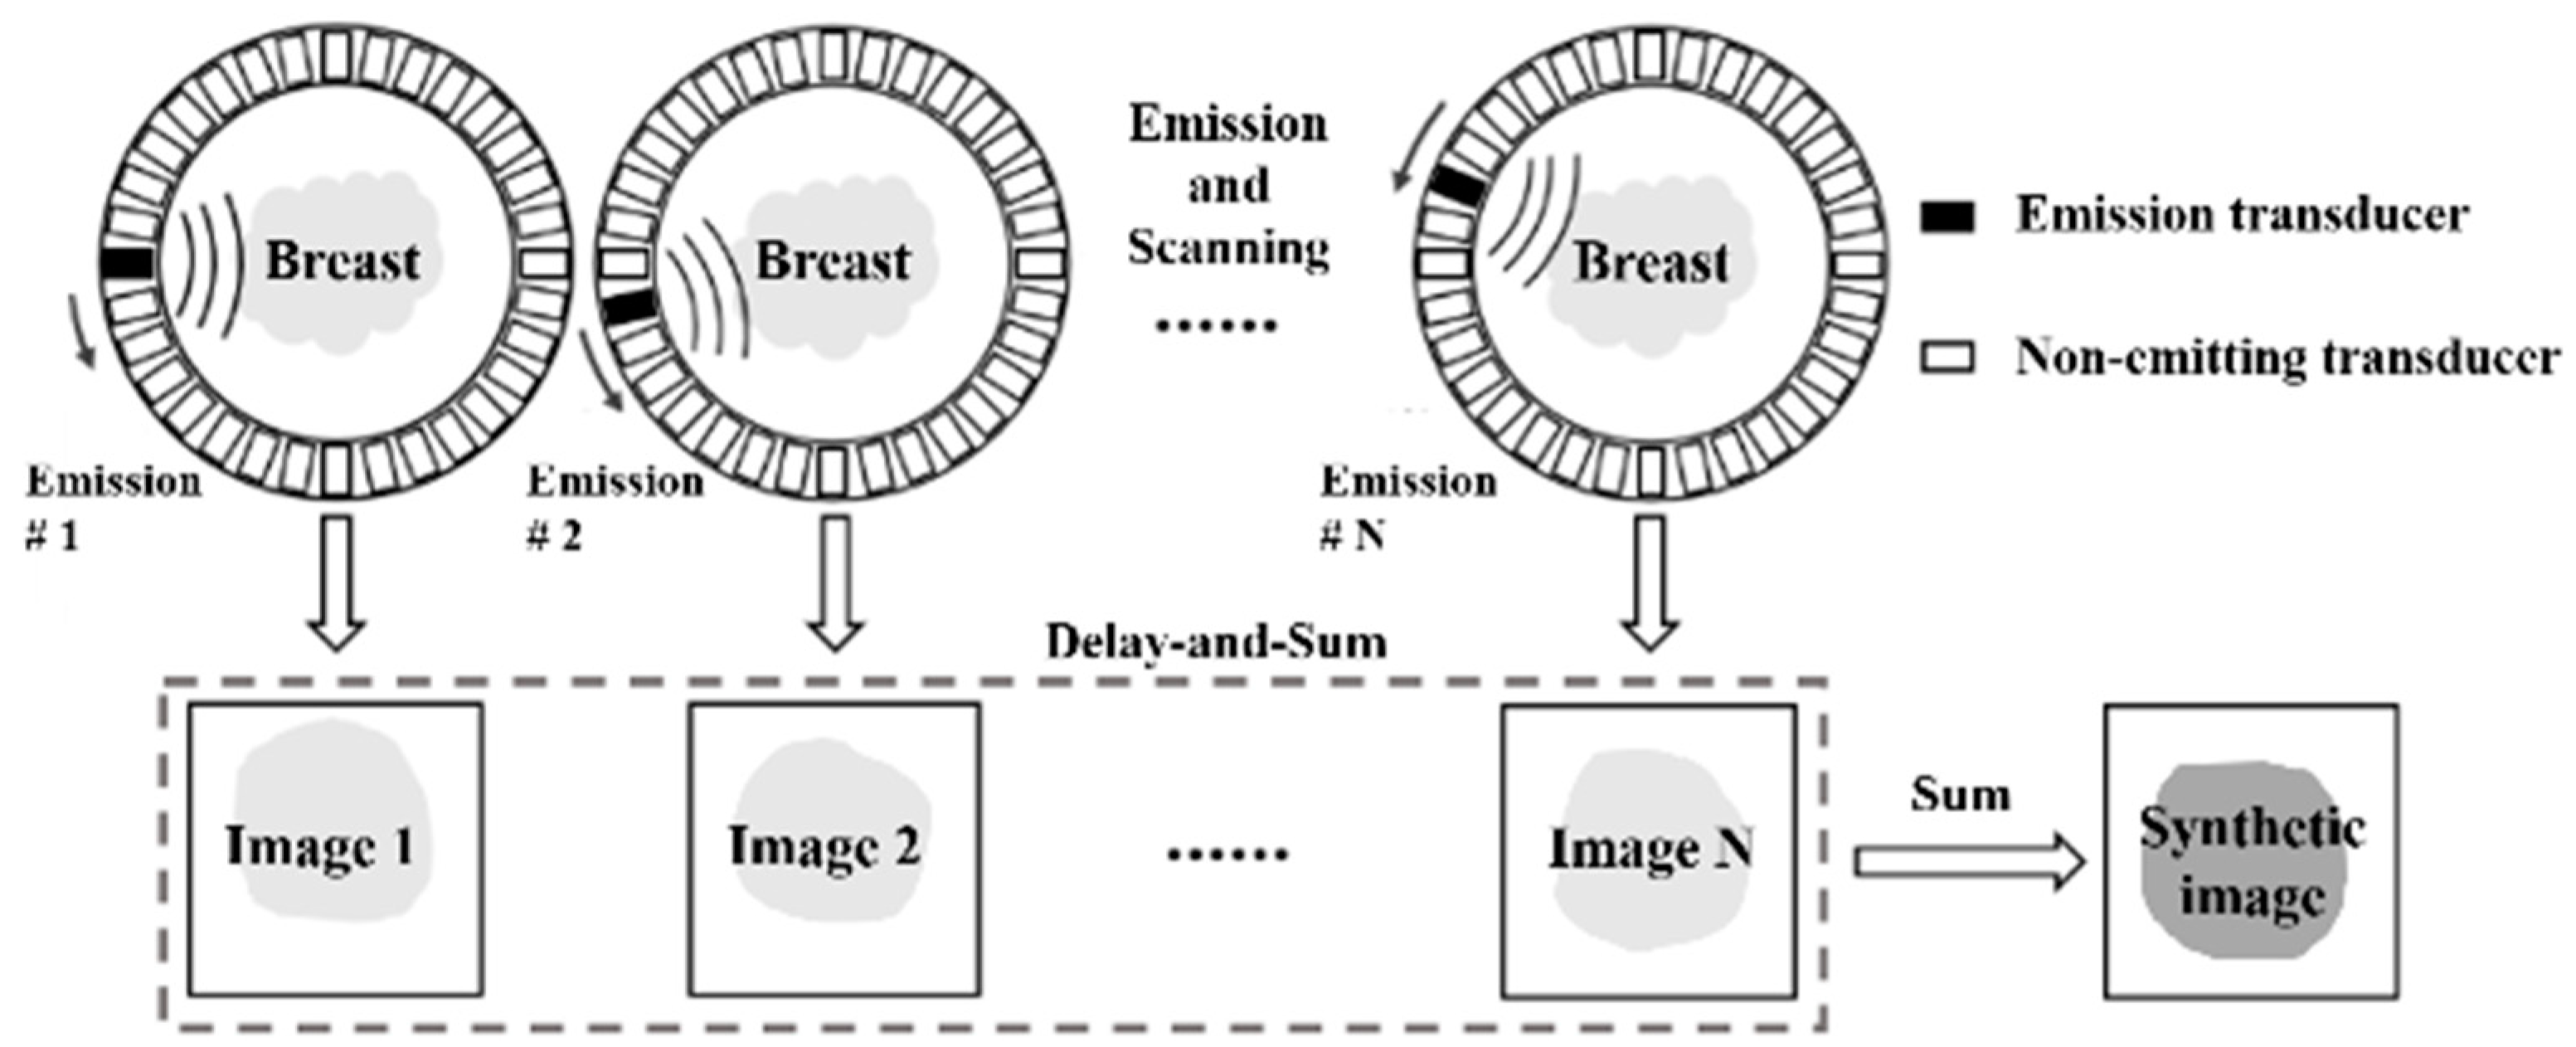
Figure 1 depicts a schematic diagram illustrating reflection imaging through the integration of delay-and-sum (DAS) beamforming and the synthetic aperture (SA) technique. Here, a spherical wave is emitted by an element within the ring transducer array, traversing the tissue enclosed by the ring and encountering processes such as reflection, refraction, scattering, and attenuation. Subsequently, this wave is captured by all elements within the ring transducer array. This iterative emission process occurs sequentially for each element, resulting in the acquisition of a 3D dataset denoted as , with representing the sampling point along the imaging time and and indicating the indexes of the emitting and receiving elements, respectively. As portrayed in the second row of Figure 1, a low-resolution image is generated through a single emission. This low-resolution image is crafted exclusively through dynamic receive focusing, as emission focusing is rendered impractical due to the inherently unfocused nature of the spherical wavefront emitted by an individual element. To achieve dynamic receive focusing, the propagation time of the ultrasound, from the emitter to the focal point and subsequently to the receiver, is initially computed using the following equation:
where indicates the assumed average sound speed of the medium; the subscripts , , and denote the indexes of the emission element, receive element, and imaging pixel, respectively; and , and are the emitter, imaging pixel, and receiver positions, respectively. This equation calculates the propagation time of the sound wave from an emitting element to a specific imaging pixel and then back to a designated receiving element. With the calculated propagation time, the USCT reflection image, formed using delay-and-sum (DAS) beamforming and the synthetic aperture (SA) technique, can be obtained as per [20]:
where M indicates the total number of emission scans; N indicates the receive element number for each emission; denotes the echo signal received by the element r during the element t emission; and denotes the delay time corresponding to a specific reflection imaging pixel. This delay time can be calculated using Equation (1) mentioned above. The is a weighting factor for signals from each receiving element and one emission. In this article, Gaussian weight for received signals was used.

Figure 1.
Previous DAS beamforming in synthetic aperture USCT reflection imaging.
2.2. Coherence-Factor Beamforming in Synthetic Aperture USCT Reflection Imaging
Previous DAS beamforming is fast, but generally, it exhibits a wide main lobe and strong side lobes. The linear transducer can use various adaptive beamforming methods to suppress the side lobe and gain a narrow main lobe. For the USCT reflection imaging, we introduce the use of CF beamforming as the adaptive beamforming method to reduce the main lobe width and suppress the side lobe, consequentially improving the USCT reflection image quality. The coherence factor was initially employed to quantify the quality of ultrasound signal focusing. Signals with superior focusing effects are deemed useful information and are assigned higher weights, whereas those with weaker focusing effects are attenuated by applying smaller weights. Its computation involves comparing the sums of the coherent and incoherent components of the complex signal after receiving focus delay, as expressed in the following equation.
where N indicates the emission count, indicates the pixel value obtained from the nth pixel during the mth emission, and denotes the coherence factor value.
In the process of receiving dynamic focusing, the CF is computed for each focal point using Equation (3). This calculated CF is subsequently multiplied by the output of the beamformer at that point, as depicted in Figure 2. Echo signals with higher coherence levels receive higher weightings, leading to reduced image distortion. Conversely, signals with lower coherence levels are assigned lower weights, attenuating the pixel at that point. As a result, CF beamforming effectively suppresses artifacts and side lobe energy levels, contributing to enhancements in spatial resolution and contrast.
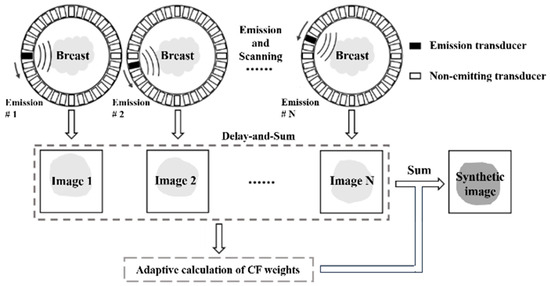
Figure 2.
CF beamforming in synthetic aperture USCT reflection imaging.
3. USCT Prototype
A USCT prototype was built for evaluation as illustrated in Figure 3, which depicts its overall block diagram. The prototype comprised four main components: the ring transducer array, multiplexer, ultrasound transceiver front-end, and host computer. The ring transducer array consisted of 2048 elements, and the multiplexer facilitated control over these elements through time-division multiplexing by a 128-channel ultrasound transceiver front-end. The transceiver front-end included the transmission front-end, receiver front-end, and an FPGA responsible for data transmission and control. The transmission front-end generated high-voltage ultrasound pulses for emission, while the receiver front-end performed a series of preprocessing steps, including filtering, on the analog echo signals before analog-to-digital conversion. The FPGA primarily managed echo data reception and transmission, utilizing DDR3 memory for continuous acquisition data buffering. Data were transferred to the host computer via a PCIe interface [22], where beamforming calculations on the echo data were conducted. The host computer was utilized for data storage and the reconstruction of reflection images.
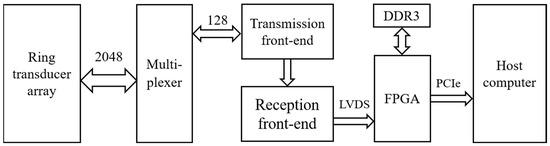
Figure 3.
The USCT prototype block diagram.
3.1. The Ring Transducer Array
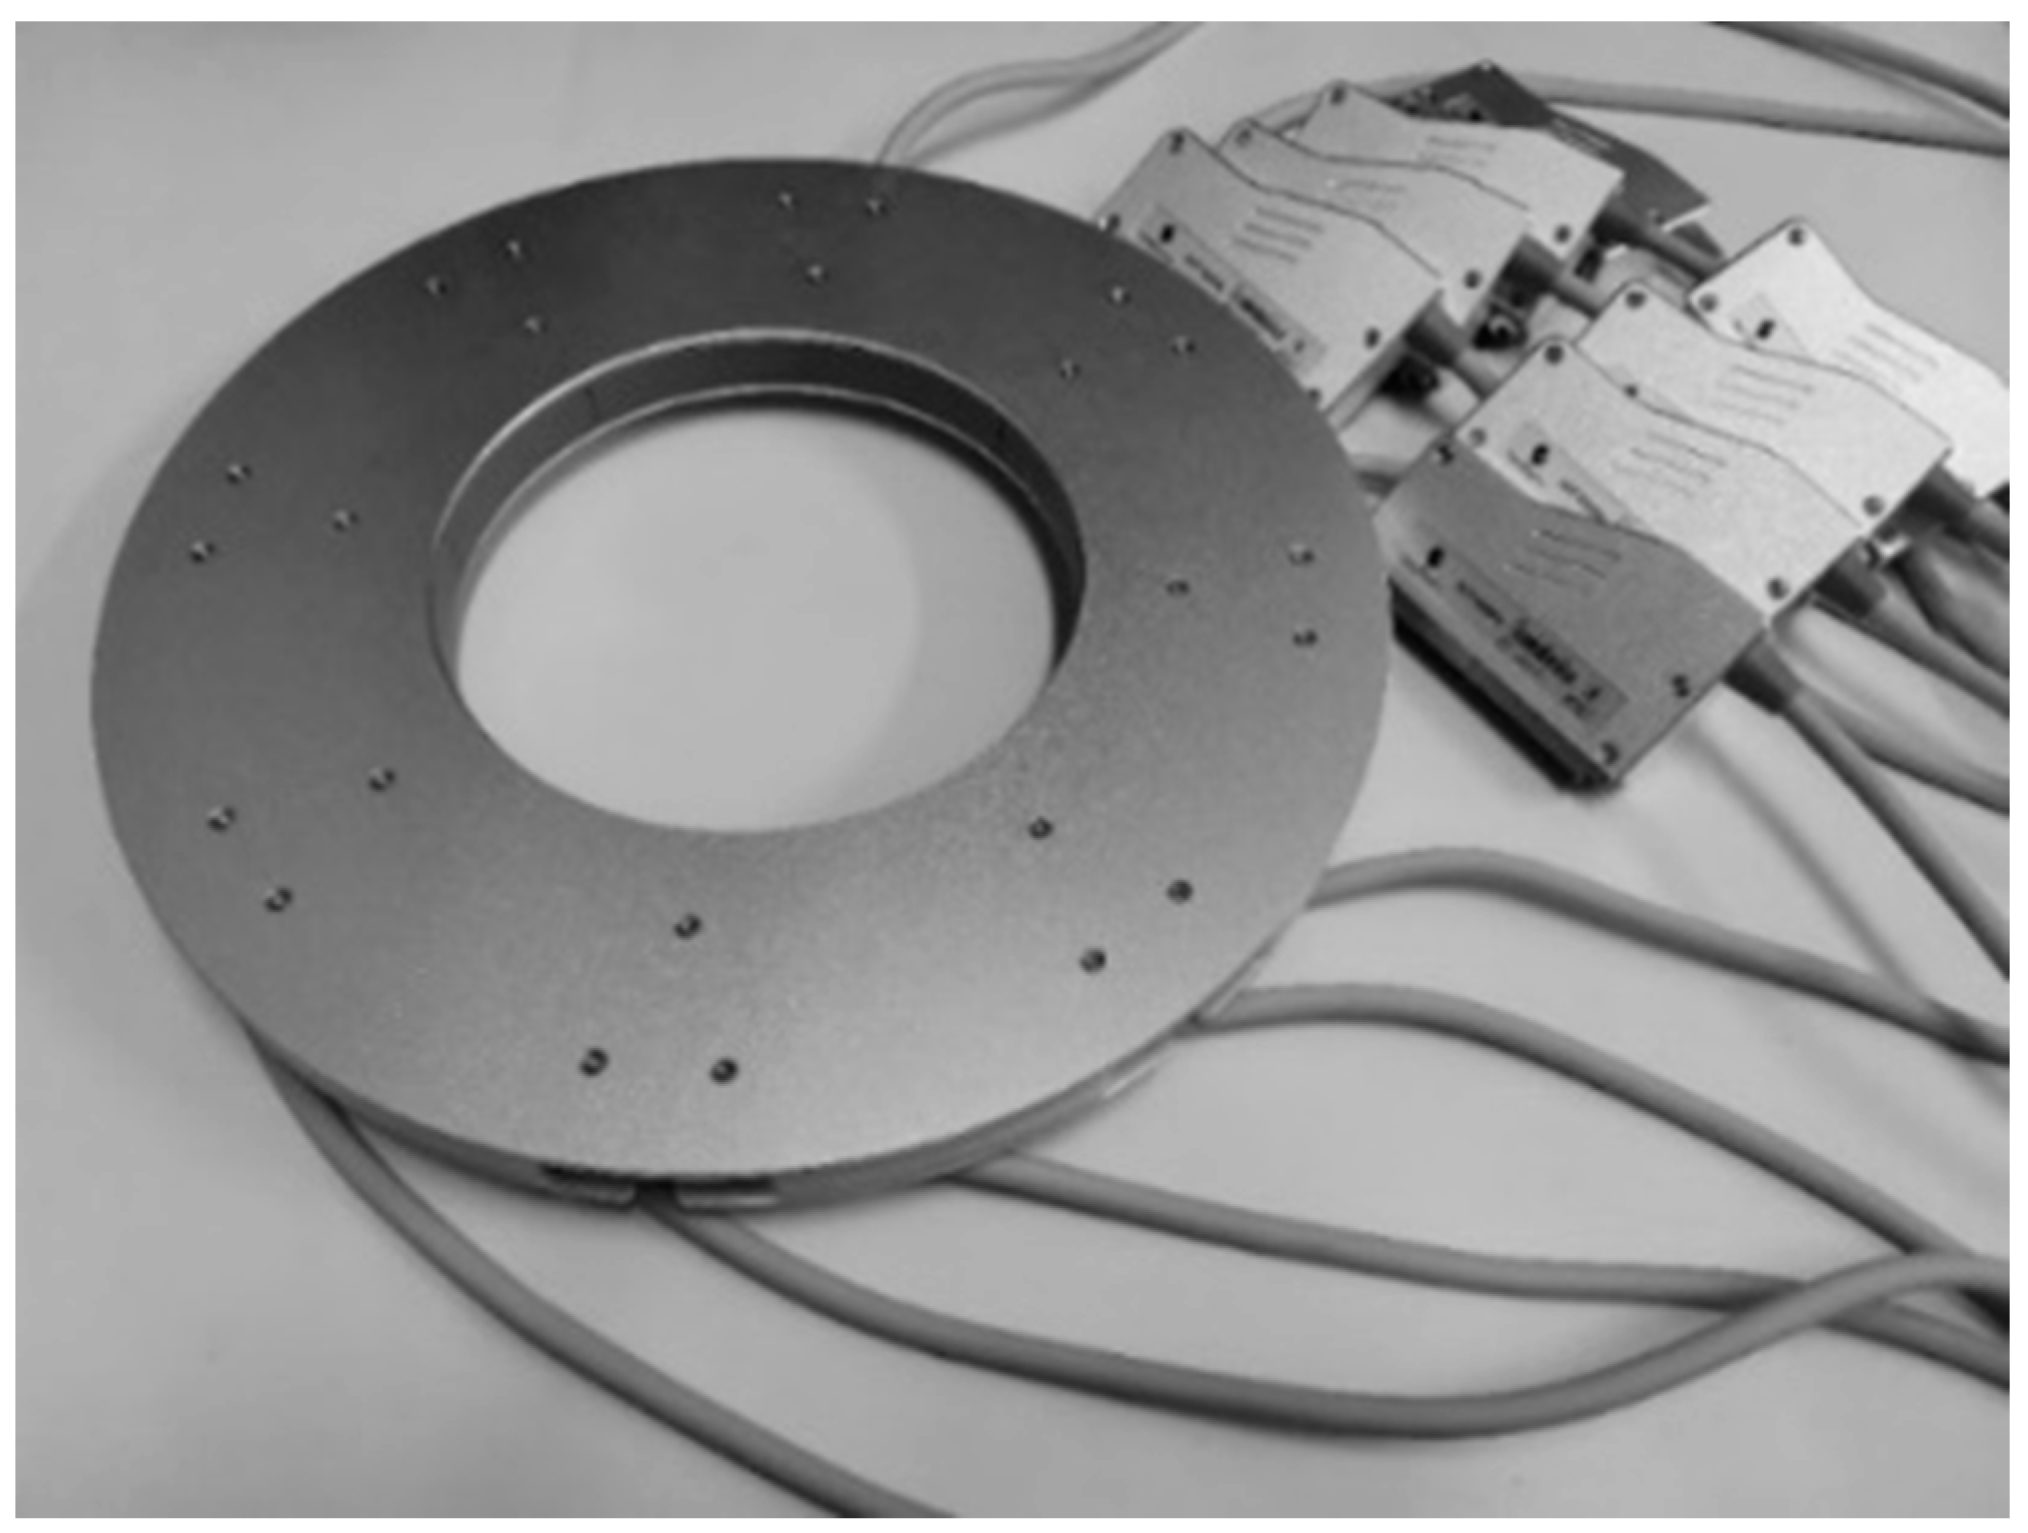
Figure 4 displays the ring transducer array, serving as the fundamental sensor of the prototype and exerting a substantial influence on imaging quality. The array is constructed by modifying eight commonly available convex transducer array probes into concave array probes and assembling them. Designed to suit the dimensions of the female breast, the inner diameter of the ring transducer array is set at 200 mm, comprising a total of 2048 elements. The inter-element pitch is about 0.3 mm. Each element has a central frequency of 3.2 MHz, ensuring that the emitted ultrasound wave can propagate over a distance of 200 mm and return with a sufficient echo. The bandwidth of these elements is 80% and 90% for −6 dB and −10 dB, respectively.

Figure 4.
The ring transducer array.
3.2. USCT Prototype Core Circuitry
The core circuitry of the USCT prototype is primarily composed of the ultrasound transceiver front-end and the multiplexer (Figure 5).
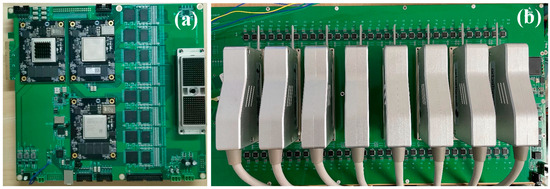
Figure 5.
Core circuitry of USCT prototype. (a) Transceiver front-end; (b) Multiplexer.
The ultrasound transceiver front-end plays a central role in the ring-array USCT prototype, managing ultrasound transmission, echo reception, and data transfer. For transmission, eight TX7316 chips from TI are employed, while eight AFE5818 analog front-end chips handle initial filtering and analog-to-digital conversion of the ultrasound echo signals during receiving. The transceiver front-end incorporates a Xilinx K7 series field-programmable gate array (FPGA) for tasks such as configuring transceiver front-end chips via serial peripheral interface (SPI), overseeing the imaging process, buffering received echo data, and uploading data via peripheral component interconnect express (PCIe) 3.0. In data transmission, high-speed deserializers (ISERDESE) within the FPGA convert high-speed serial signals from the analog-to-digital converter (ADC) into parallel data. Real-time buffering of deserialized signals is achieved using double-data-rate three synchronous dynamic random-access memory (DDR3), while the high-speed transceiver GTX and the PCIe high-speed interface facilitate rapid data transfer between the FPGA and the host computer.
The multiplexer, situated between the ring transducer array and the transceiver front-end, primarily enables channel switching. By controlling analog switches, the 128-channel transceiver front-end achieves time-division multiplexing control over the 2048-element ring transducer array. This module, autonomously controlled by a Xilinx A7 series FPGA, features 128 HV2707 single-pole single-throw high-voltage analog switches. During system operation, upon receiving a trigger signal from the transceiver front-end, the multiplexer switches to the transmission state. The ultrasound transmission front-end then generates high-voltage pulses that stimulate the transducer’s elements through the multiplexer. Subsequently, upon receiving another trigger signal from the transceiver front-end, the multiplexer switches to the reception state. The internal transmit/receive (T/R) switch of the transmission front-end shifts to the receive channel. Scattered echo signals generated by the medium travel through the multiplexer and reach the reception front-end, completing the ultrasound echo reception process.
4. Experiment Methods
4.1. Simulation Setup
The simulation evaluation was performed using the MATLAB-based K-Wave acoustic simulation toolbox [23,24,25,26,27,28,29,30,31,32], which is a widely used simulation toolbox. The imaging parameters for the simulation were set identical to those of the prototype. The central frequency of the transducer array was 3.2 MHz, and the sampling frequency was 20 MHz. The inner diameter of the ring transducer was 200 mm, comprising a total of 2048 elements. The simulation region spans a 210 mm × 210 mm square area to accommodate the 200 mm diameter ring transducer. Utilizing a grid size of 2048 × 2048 grids, each grid measures approximately 0.1 mm, ensuring it remains smaller than one quarter of the wavelength. This meticulous grid size contributes to high simulation accuracy. The procedure for USCT reflection imaging mirrored that mentioned above. Emission elements at uniform intervals on the ring array emitted ultrasound pulse waves one by one, while all other elements received the echo data. Subsequently, USCT reflection imaging with the synthetic aperture (SA) technique and beamforming was employed to obtain the reflection images.
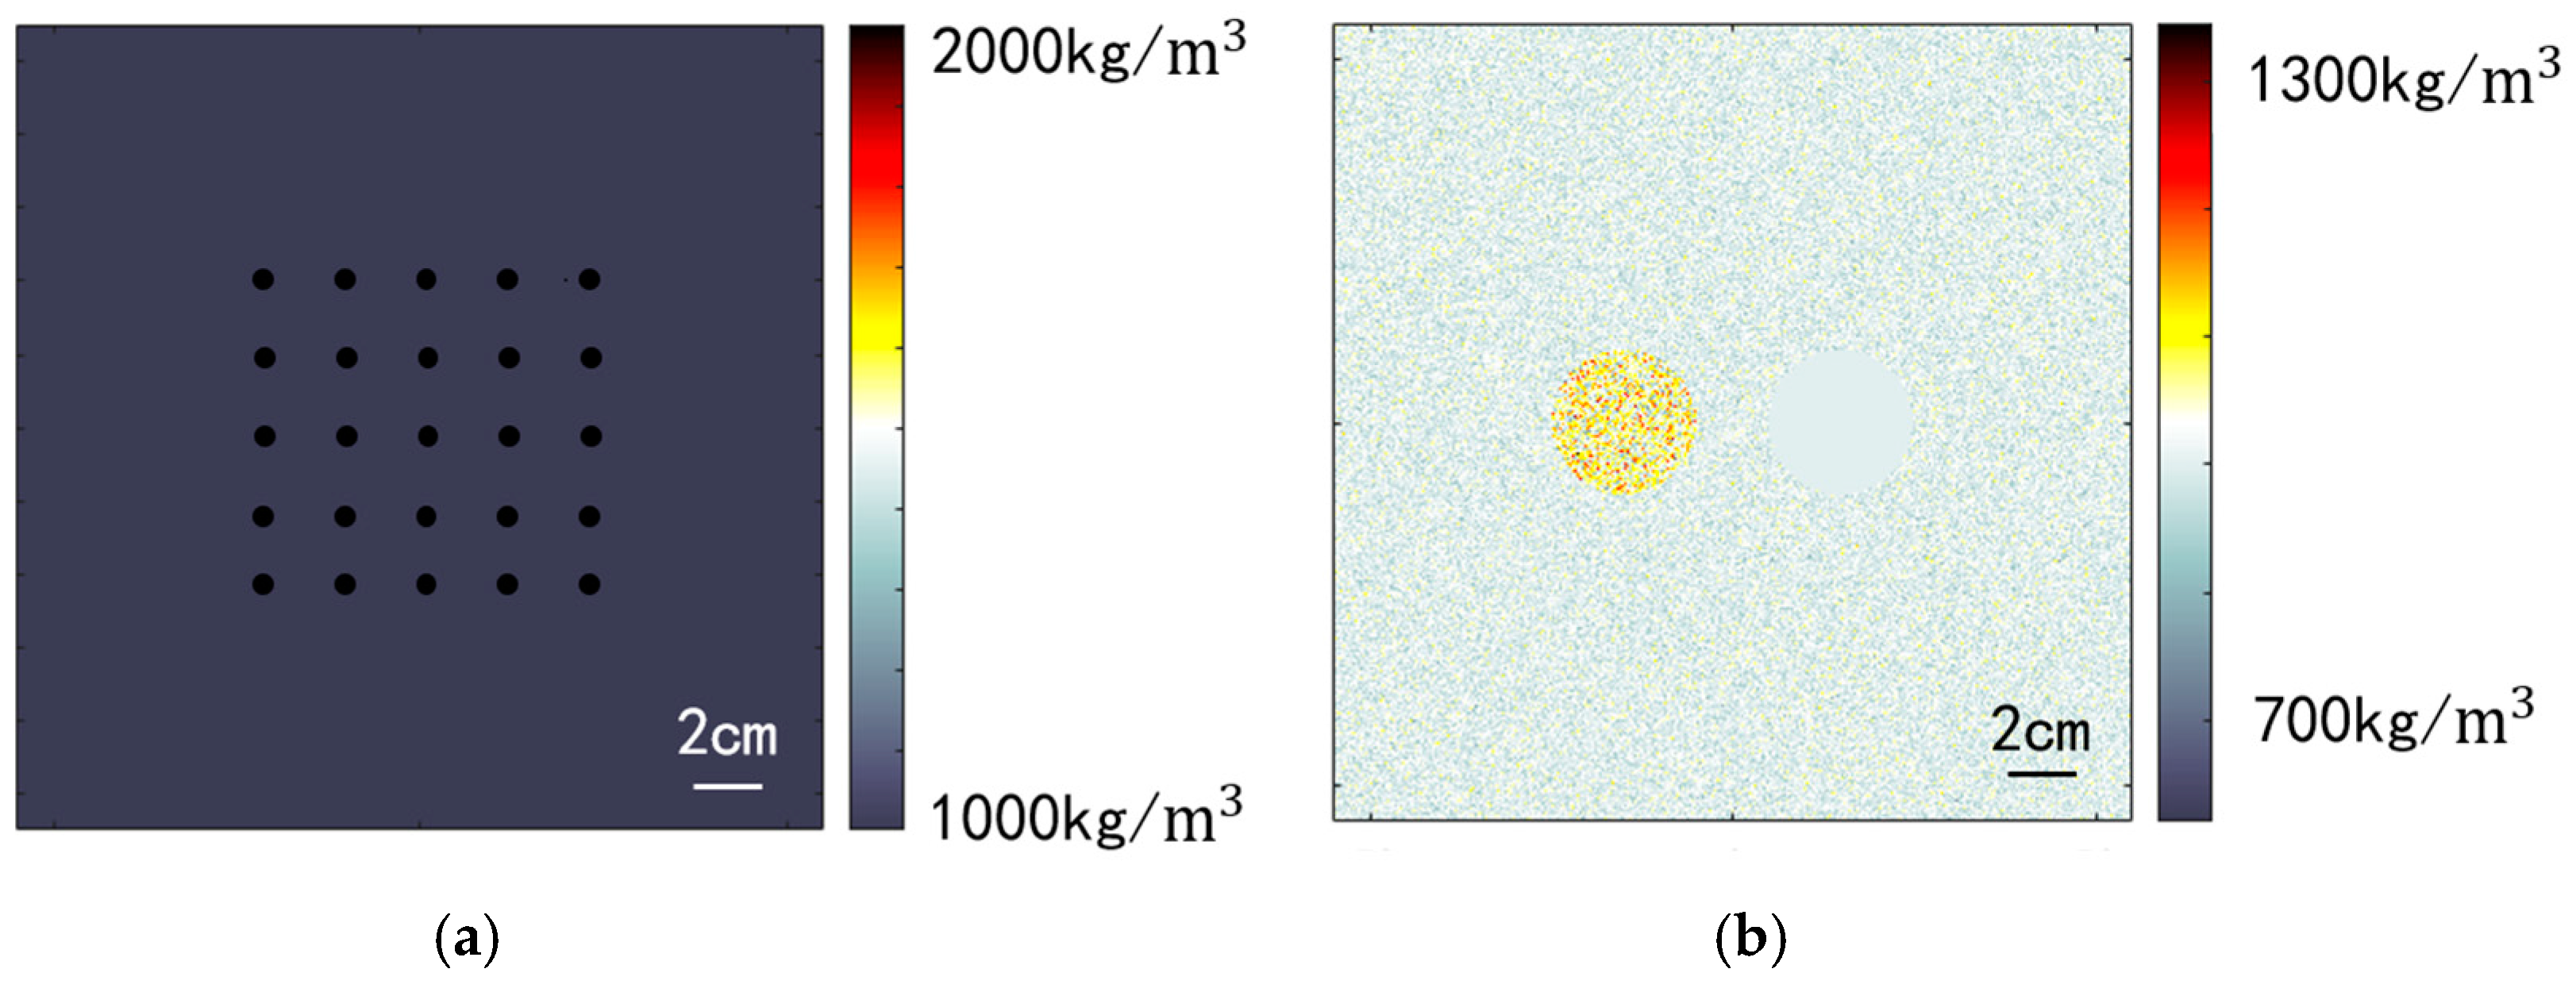
Two simulation models were established for evaluation: a point resolution evaluation model and a circular contrast evaluation model. To mitigate the influence of phase aberration on image quality, both models were configured with a constant sound speed of 1540 m/s. The medium density varied to create point targets and scatter points. Figure 6a illustrates the medium density distribution of the point resolution evaluation model, featuring 25 point targets. Each point target occupies a simulation grid approximately 0.1 mm in diameter, significantly higher than the background density, generating scatter sound waves with high energy. This model was employed to assess spatial resolution in imaging. Figure 6b depicts the circular contrast evaluation model, which includes two circular targets in a speckled background. The background region’s medium density follows a normal distribution with a standard deviation of 30 kg/m3. Two circular regions with a radius of 15 mm are symmetrically positioned at a distance of 30 mm from the center. The medium density within the left circular region follows a normal distribution with a standard deviation of 75 kg/m3, simulating a solid, high-echogenicity region within human tissue. The right circular region maintains a constant medium density, mimicking a cystic low-echogenicity region within human tissue. To enhance simulation realism, both models incorporate an attenuation coefficient of 0.75 dB/(MHz·cm) and an attenuation exponent of 1.5 for the entire medium.
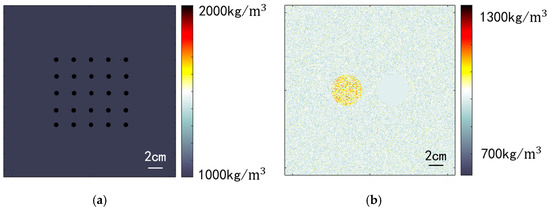
Figure 6.
Simulated medium density configuration. (a) Point resolution evaluation model; (b) Circular contrast evaluation model.
4.2. Experimental Setup
Phantom experiments were conducted using the aforementioned prototype. The imaging scan was configured for 256 emissions, with 4 elements simultaneously excited during each emission to mitigate the effects of element performance variation. The emitted sound wave pulse consisted of a 2-cycle 3.2 MHz pulsed square wave as the excitation waveform. The analog-to-digital (AD) sampling rate was set at 20 MHz.
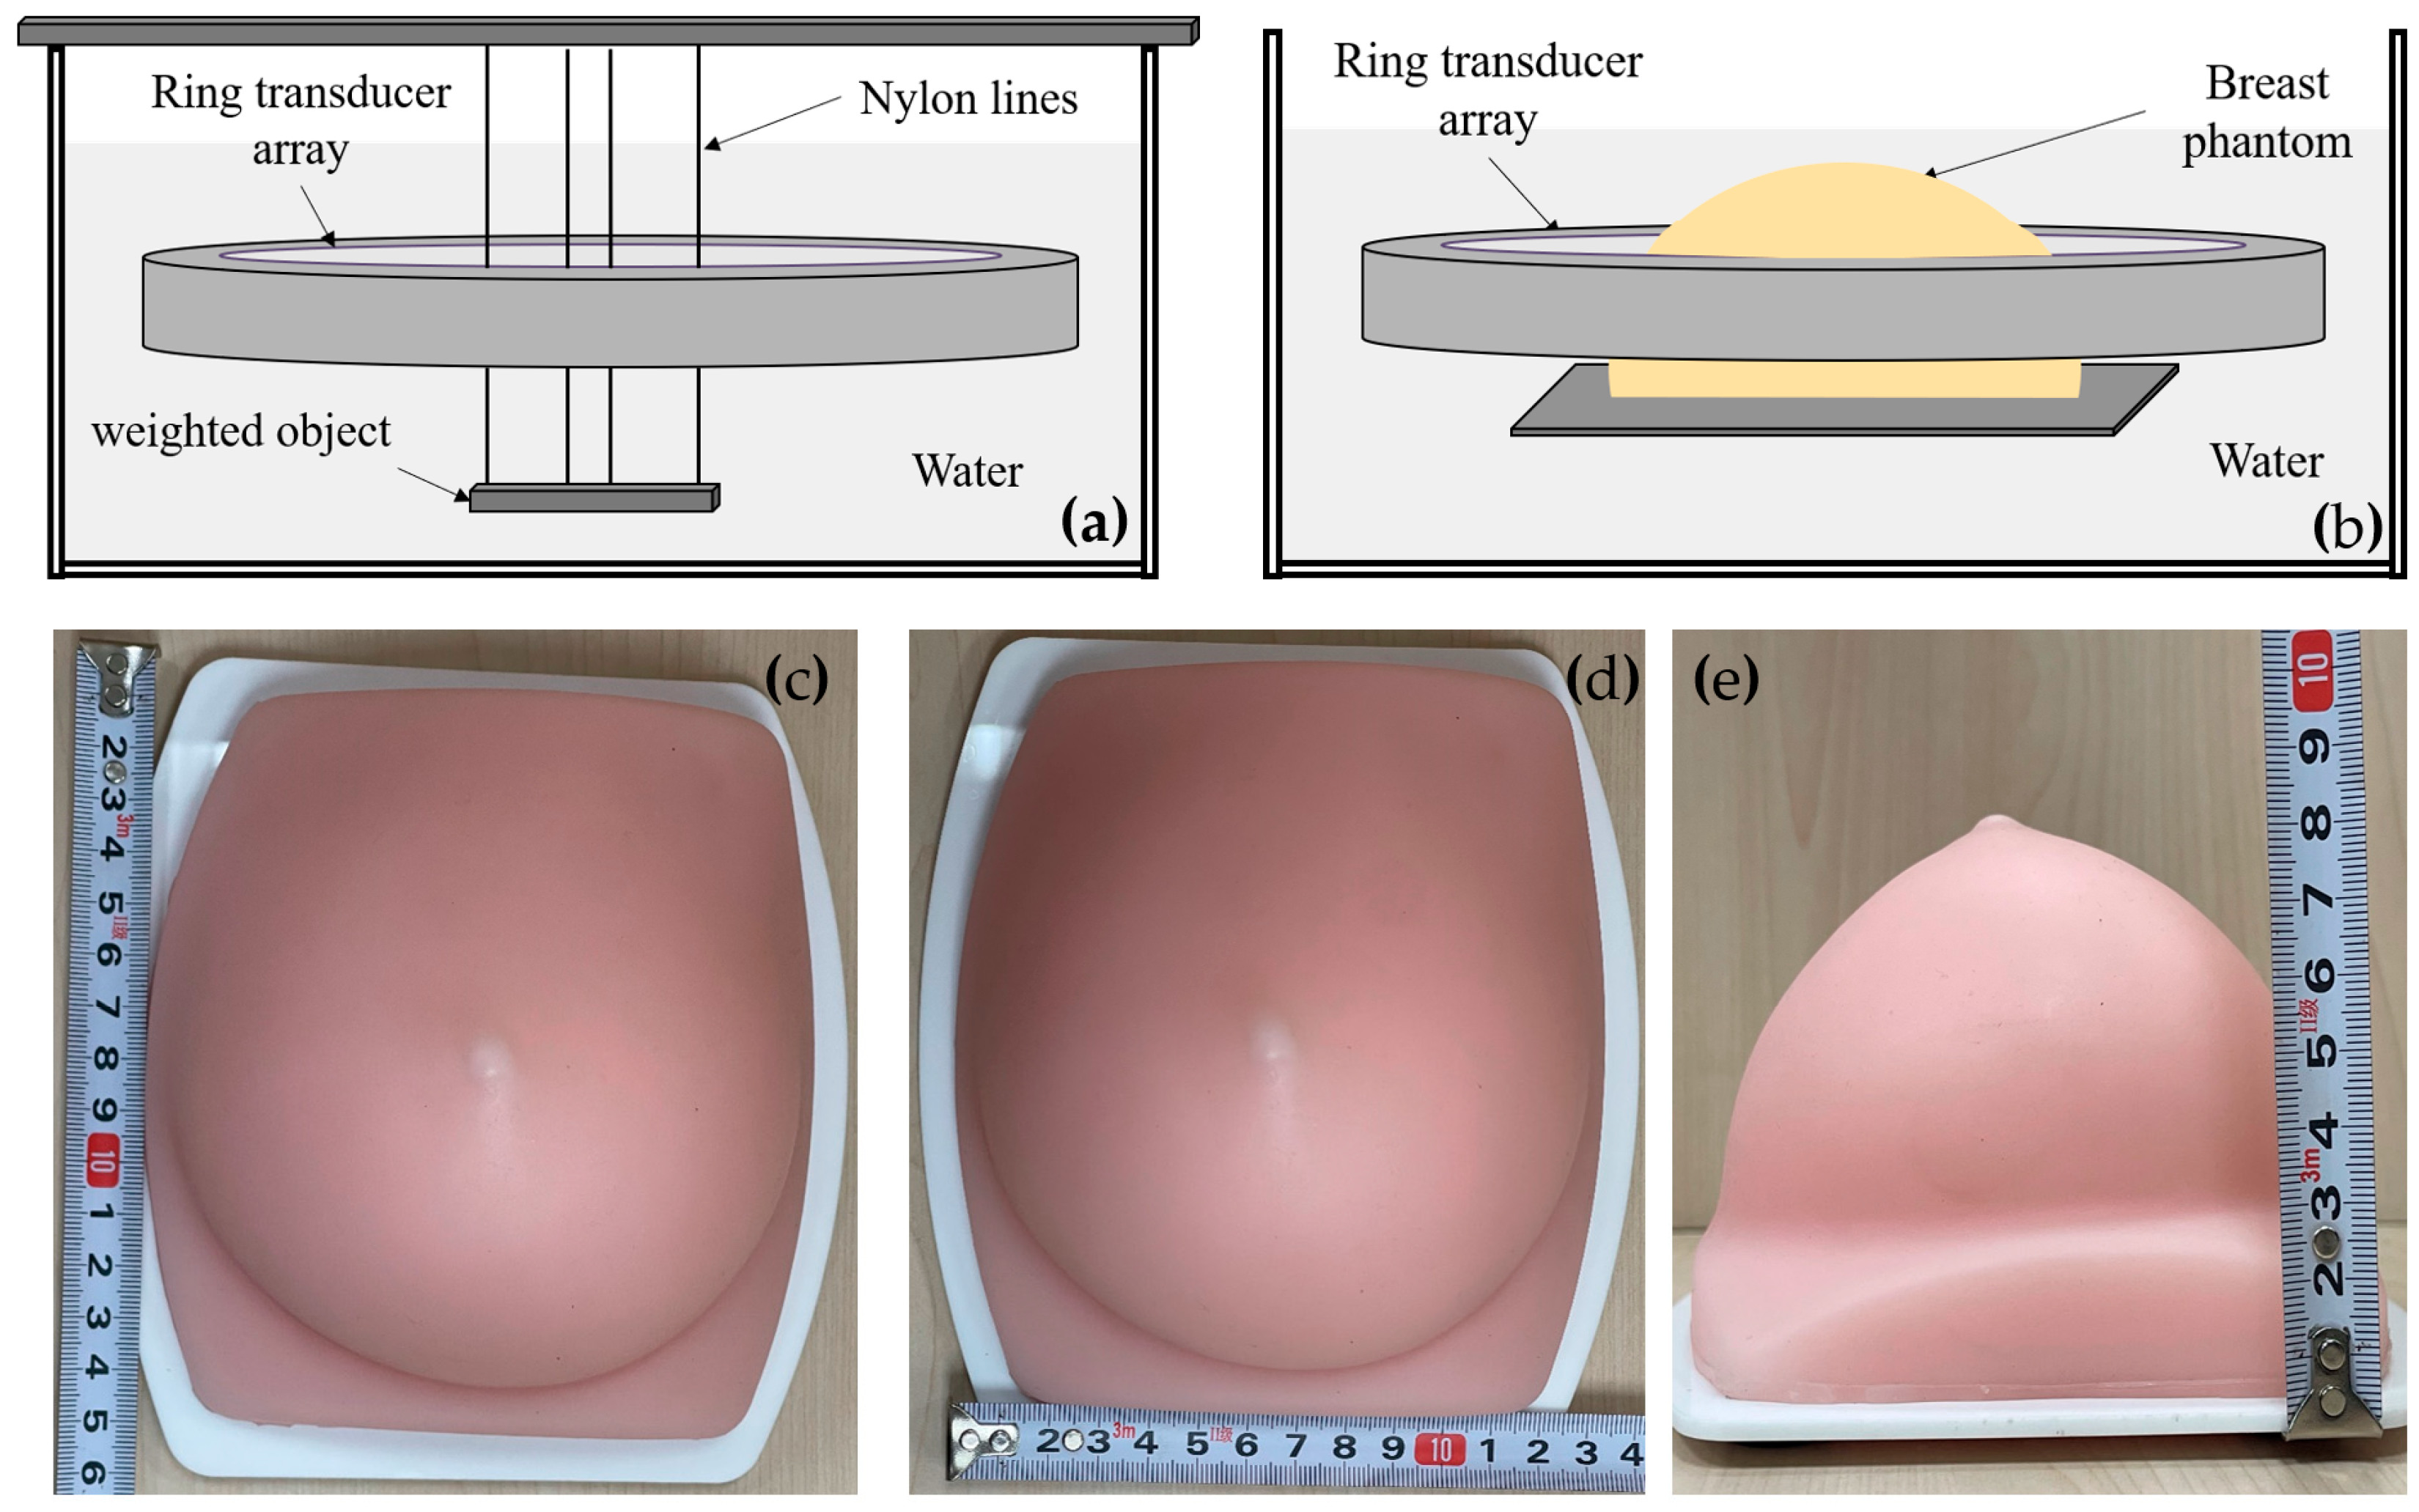
Figure 7 shows the setup for the phantom experiments. Figure 7a illustrates the point resolution evaluation phantom experiment setup, involving the use of four nylon fishing wires with a diameter of approximately 0.1 mm. A metal bar was suspended at their ends, making the wires hang vertically in the water. The ring transducer array was positioned in the water to perform cross-sectional scan imaging around the hanging wires. Before the experiment, the water temperature was measured using a thermometer, and the sound velocity of pure water at the same temperature was employed for beamforming calculations. To account for a slight discrepancy between the system’s sampling start time and the actual ultrasound pulse emission time, calibration of the echo start time was necessary. Subsequent beamforming calculations consistently applied this calibrated result. The calibration procedure involved utilizing the cross-sectional imaging of the nylon wires to adjust the initial time, iteratively refining until the point spread function’s half-width calculation was minimized, indicating the completion of the initial time calibration for the system. Figure 7b outlines the setup for the breast contrast evaluation phantom experiment. Figure 7c–e shows the breast phantom, which was created using gels with a tumor-mimic scatter region inside. The experiment setup and procedure were similar to the point resolution evaluation experiment.
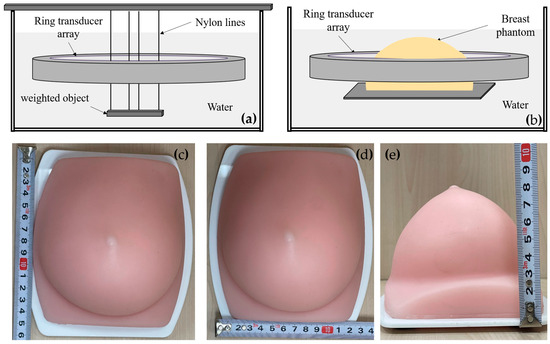
Figure 7.
Phantom experiment setup. (a) Point resolution evaluation phantom setup; (b) Breast contrast evaluation phantom setup; (c–e) The breast phantom.
4.3. Evaluation Metrics
In this article, three evaluation metrics were employed to assess the resolution and contrast of the USCT reflection image. These metrics include full width at half maximum (FWHM) for resolution evaluation, contrast ratio (CR) for overall contrast assessment, and contrast-to-noise ratio (CNR) for evaluating contrast while considering background noise.
FWHM was employed as a quantitative measure for image resolution. A smaller FWHM value indicates a stronger ability of the image to represent fine structures. Commonly, for assessment, a small acoustic impedance step change target is introduced within the imaging region’s medium, and the FWHM of this point on the ultrasound image is measured [33]. In our study, with the use of a ring transducer array for imaging, conventional methods to distinguish axial and lateral resolution are not applicable. Instead, the employed method calculates resolution as follows: the image area corresponding to the point is segmented by selecting pixels with intensities greater than half of the peak value, and the total area of this segmentation is used to derive the diameter of a circle, serving as the FWHM value. The calculation equation can be expressed by:
where represents the local region of the image containing the point target; max calculates the maximum intensity of the image; num calculates the number of pixels following the given condition; and is the side length of the square pixel.
CR was employed for quantitative evaluation of the image contrast. It characterizes the mean intensity difference between a target region and background region on ultrasound images. A larger CR value signifies a more distinct visibility of the target on the image. The calculation equation is presented as follows:
where indicates the mean intensity of the background region and indicates the mean intensity of the target region.
CNR was also used for the quantitative evaluation of image contrast, combining imaging contrast with image uniformity. A higher CNR value signifies improved contrast and better uniformity, indicating higher image quality. The CNR is defined as follows:
where and denote the standard deviations of the target and background regions, respectively.
5. Results
5.1. Resolution and Contrast Comparison in Simulation
Figure 8 compares USCT reflection images obtained through DAS beamforming and CF beamforming. The reflection images include both point resolution evaluation images and circular contrast evaluation images, with simulation models provided in Figure 6. The images in the first and second rows were obtained through DAS beamforming and CF beamforming, respectively. Enlarged point resolution images highlight that CF beamforming produces significantly smaller point targets compared with DAS beamforming, indicating that CF beamforming can generate higher-resolution images. The circular contrast evaluation images further demonstrate that CF beamforming yields higher-contrast images.
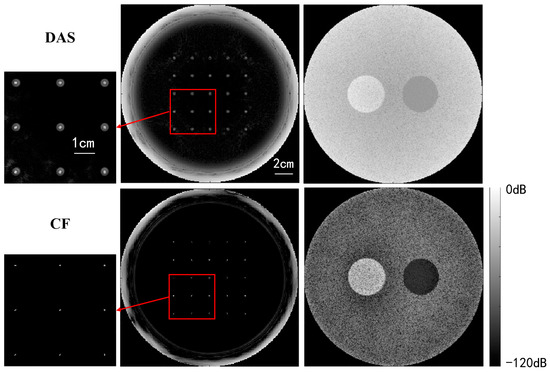
Figure 8.
Qualitative simulation image quality comparison between DAS and CF beamforming.
Table 1 presents a quantitative comparison of the quality of USCT reflection imaging using DAS and CF beamforming, employing the evaluation metrics outlined in Section 4.3. The results indicate that the CF method significantly improves image resolution by reducing the FWHM noticeably. In terms of contrast, the CF method substantially enhances both CR and CNR for low-echogenicity regions (cystic regions). Similarly, it improves the CR by 113% compared with DAS beamforming for high-echogenicity regions (solid regions), albeit with a slight decrease in CNR. This decrease is attributed to the fact that while the CF method enhances contrast, it also suppresses signals from individual high-echogenicity regions with poor coherence, resulting in a loss of uniformity and an increase in image standard deviation. However, overall, the uniformity loss introduced by the CF method is minimal, and the improvements in resolution and contrast are quite substantial.

Table 1.
Quantitative results for DAS and CF beamforming. Note: Cystic Region is the low-echogenicity region and Solid Region is the high-echogenicity region in Figure 8.
5.2. Imaging Parameters Affecting Simulation
Several USCT reflection imaging parameters can influence image quality, with two of the most critical ones being the emission time and the number of receiving elements for one-time emission.
Firstly, we examine the effect of emission time on imaging quality when using the CF beamforming method. Figure 9 illustrates the relationship between emission time and FWHM. The results demonstrate that resolution can be significantly improved with increasing emission time, but the rate of improvement gradually diminishes as the emission time increases. Figure 10 displays the relationship between emission time and CR as well as CNR when using the CF beamforming method. It can be observed that higher emission times generally lead to improvements in both CR and CNR, but the rate of improvement slows down as the emission time increases. Additionally, a more noticeable improvement effect is seen in the contrast of the cystic region (low-echogenicity region), whereas the contrast and CNR for solid, high-echogenicity regions remain relatively constant when the emission time is increased 32 times.
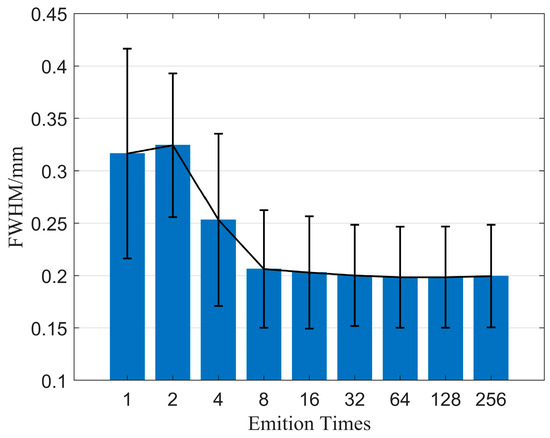
Figure 9.
FWHM changes with different emition times.
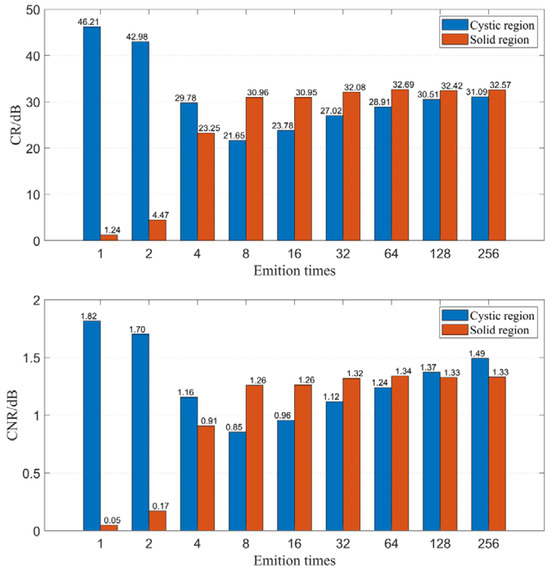
Figure 10.
CR and CNR change with different emition times.
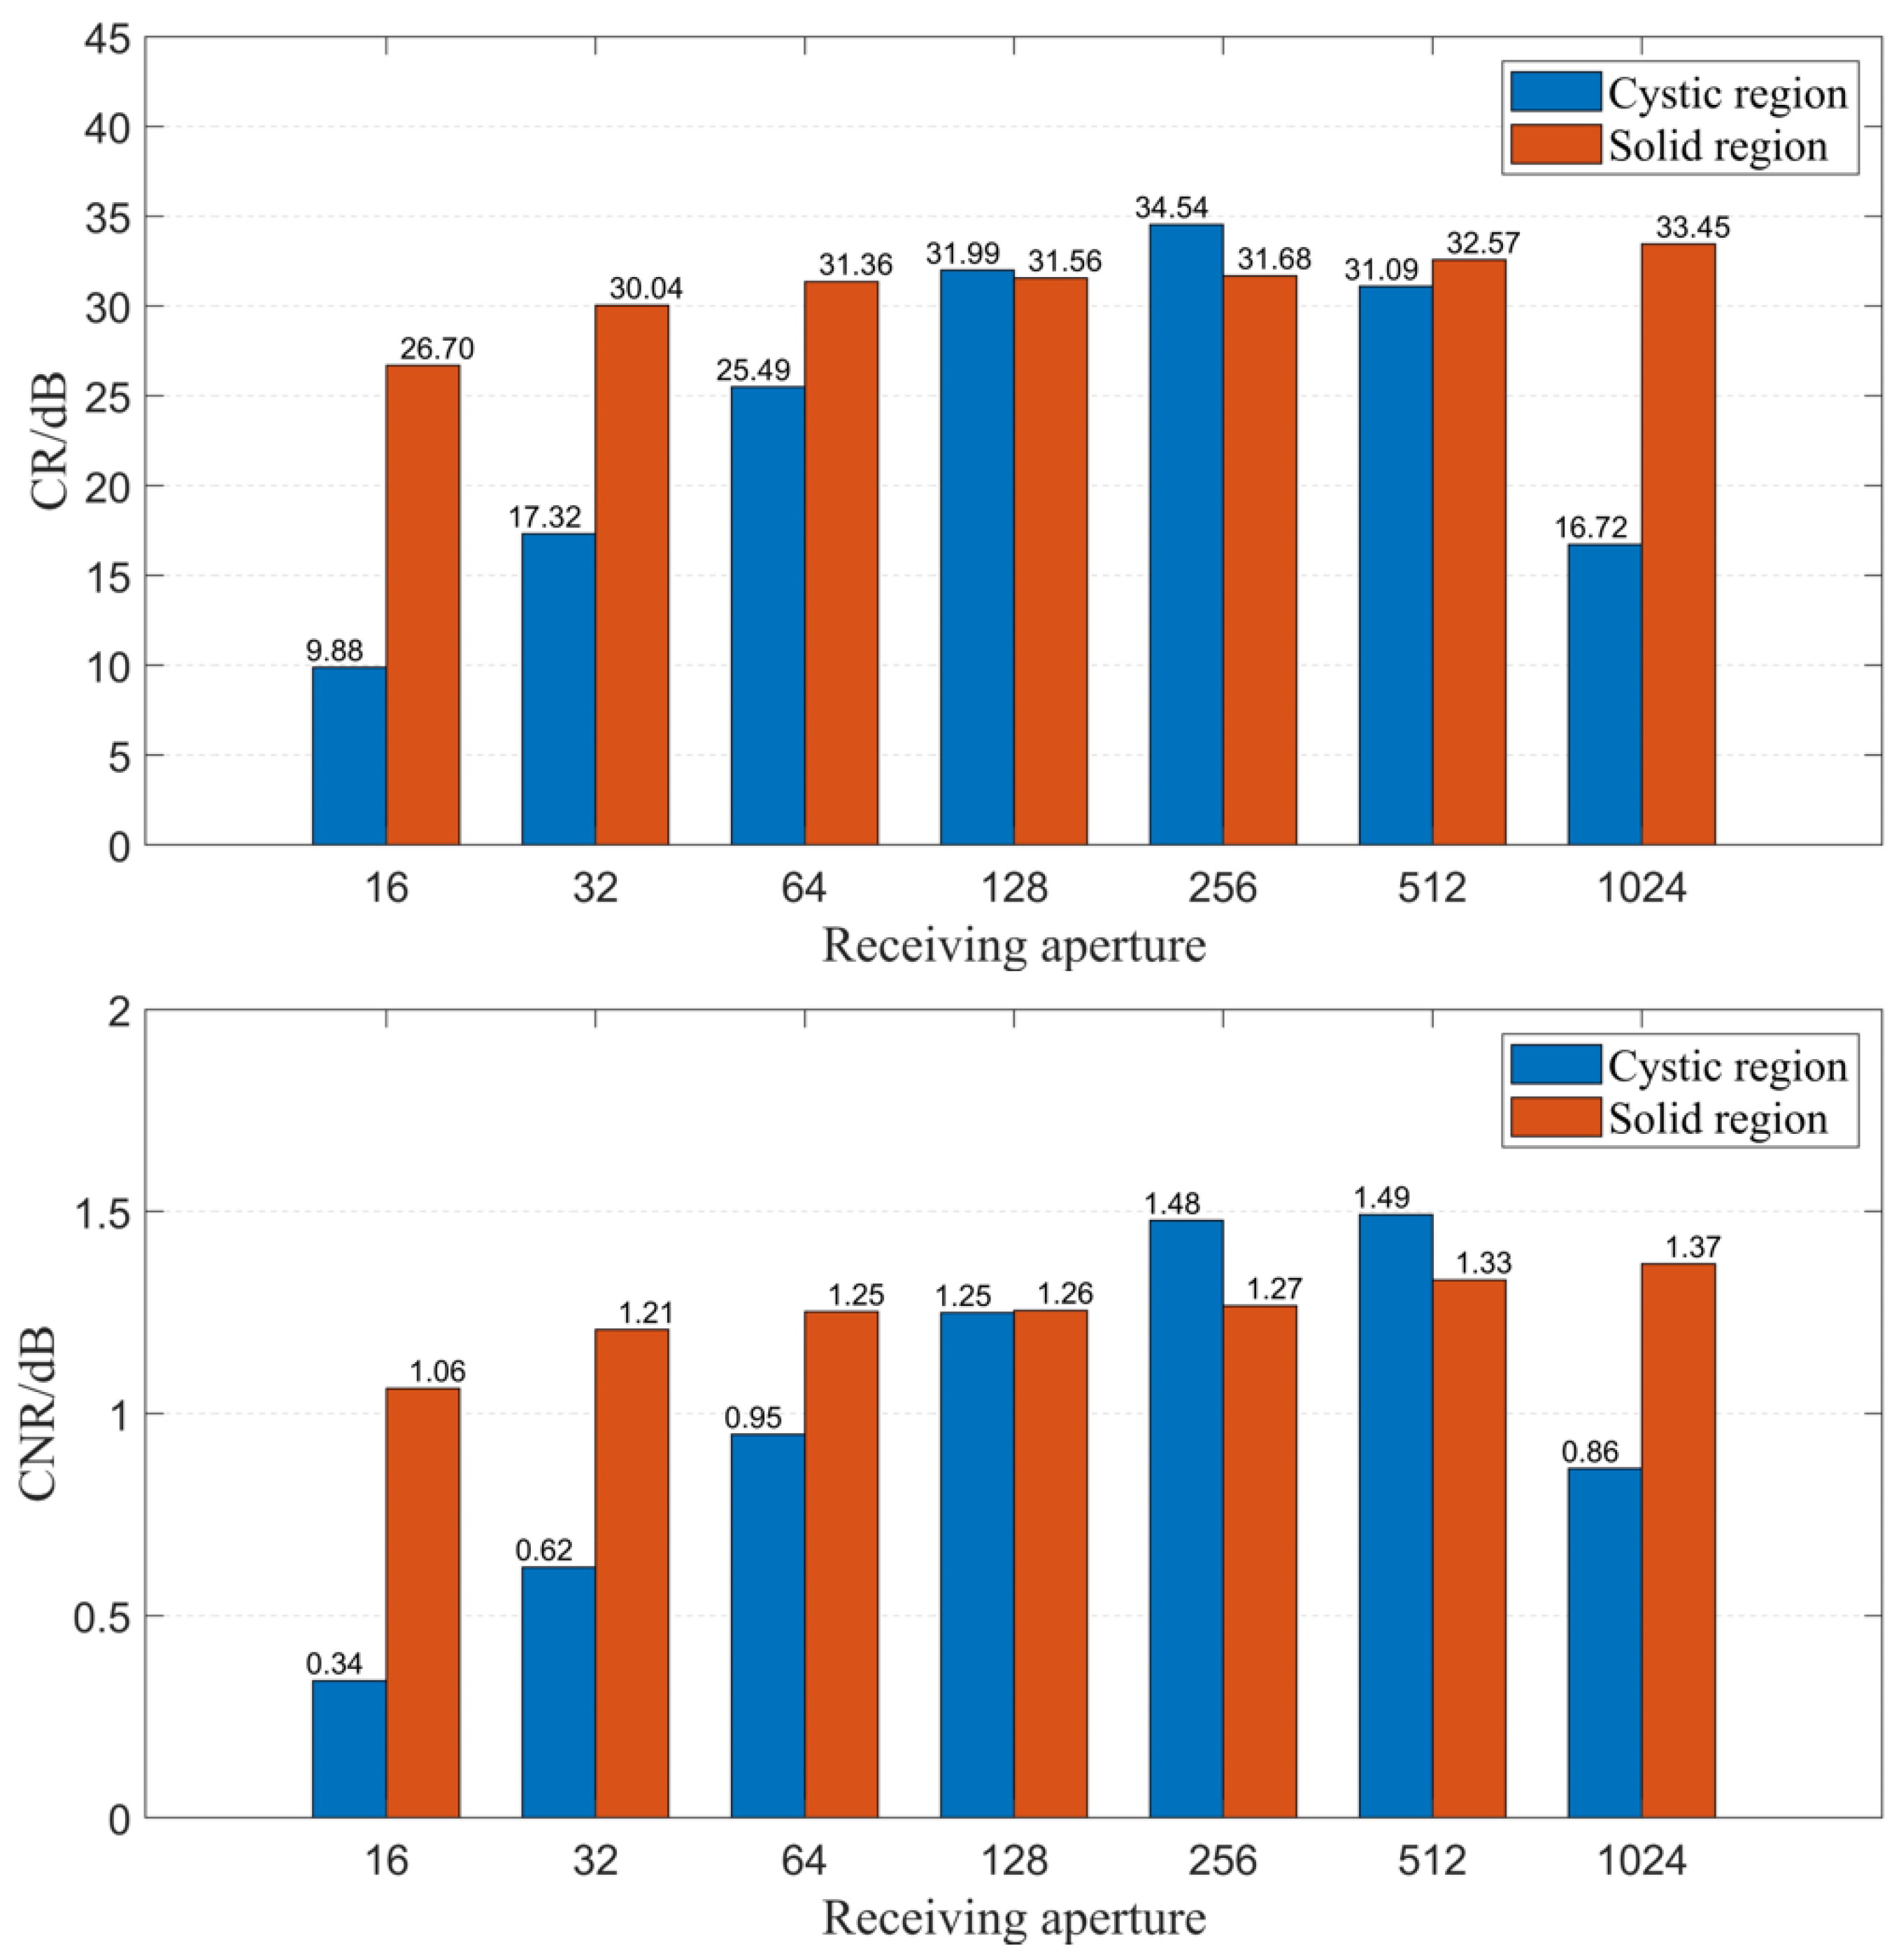
Secondly, we explored the impact of the number of receiving elements on imaging quality when using the CF beamforming method. Figure 11 illustrates the relationship between the number of receiving elements and resolution. It is observed that as the number of receiving elements gradually increases, the spatial resolution of the image improves, although the improvement is relatively small. Figure 12 displays the relationship between the number of receiving elements and CR as well as CNR when using the CF beamforming method. The curves reveal that both the CR and CNR of the solid region (high-echogenicity region) improved as the number of receiving elements increased. However, the CR and CNR for the cystic region (low-echogenicity region) exhibit a distinct pattern of initially increasing and then decreasing, with both metrics peaking at approximately 256 receiving channels. The reason may be that the low-echogenicity region was easily affected by the transmission sound wave received by the receiving element opposite the transmitting element. Furthermore, it is evident from the CF beamforming results that the cystic region is more sensitive to larger receiving apertures. Thus, when targeting cystic structures of interest, careful consideration is needed regarding the choice of receiving aperture when utilizing CF beamforming.
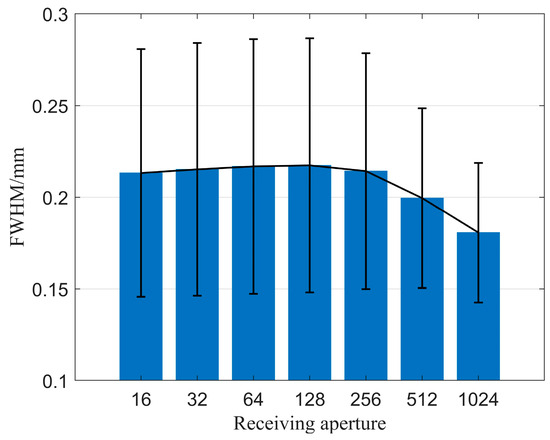
Figure 11.
FWHM changes with different numbers of receiving elements.
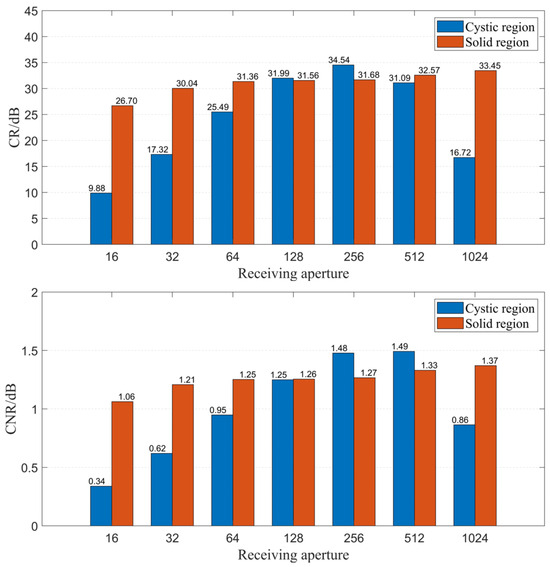
Figure 12.
CR and CNR change with different numbers of receiving elements.
5.3. Resolution and Contrast Comparison in Phantom Experiments
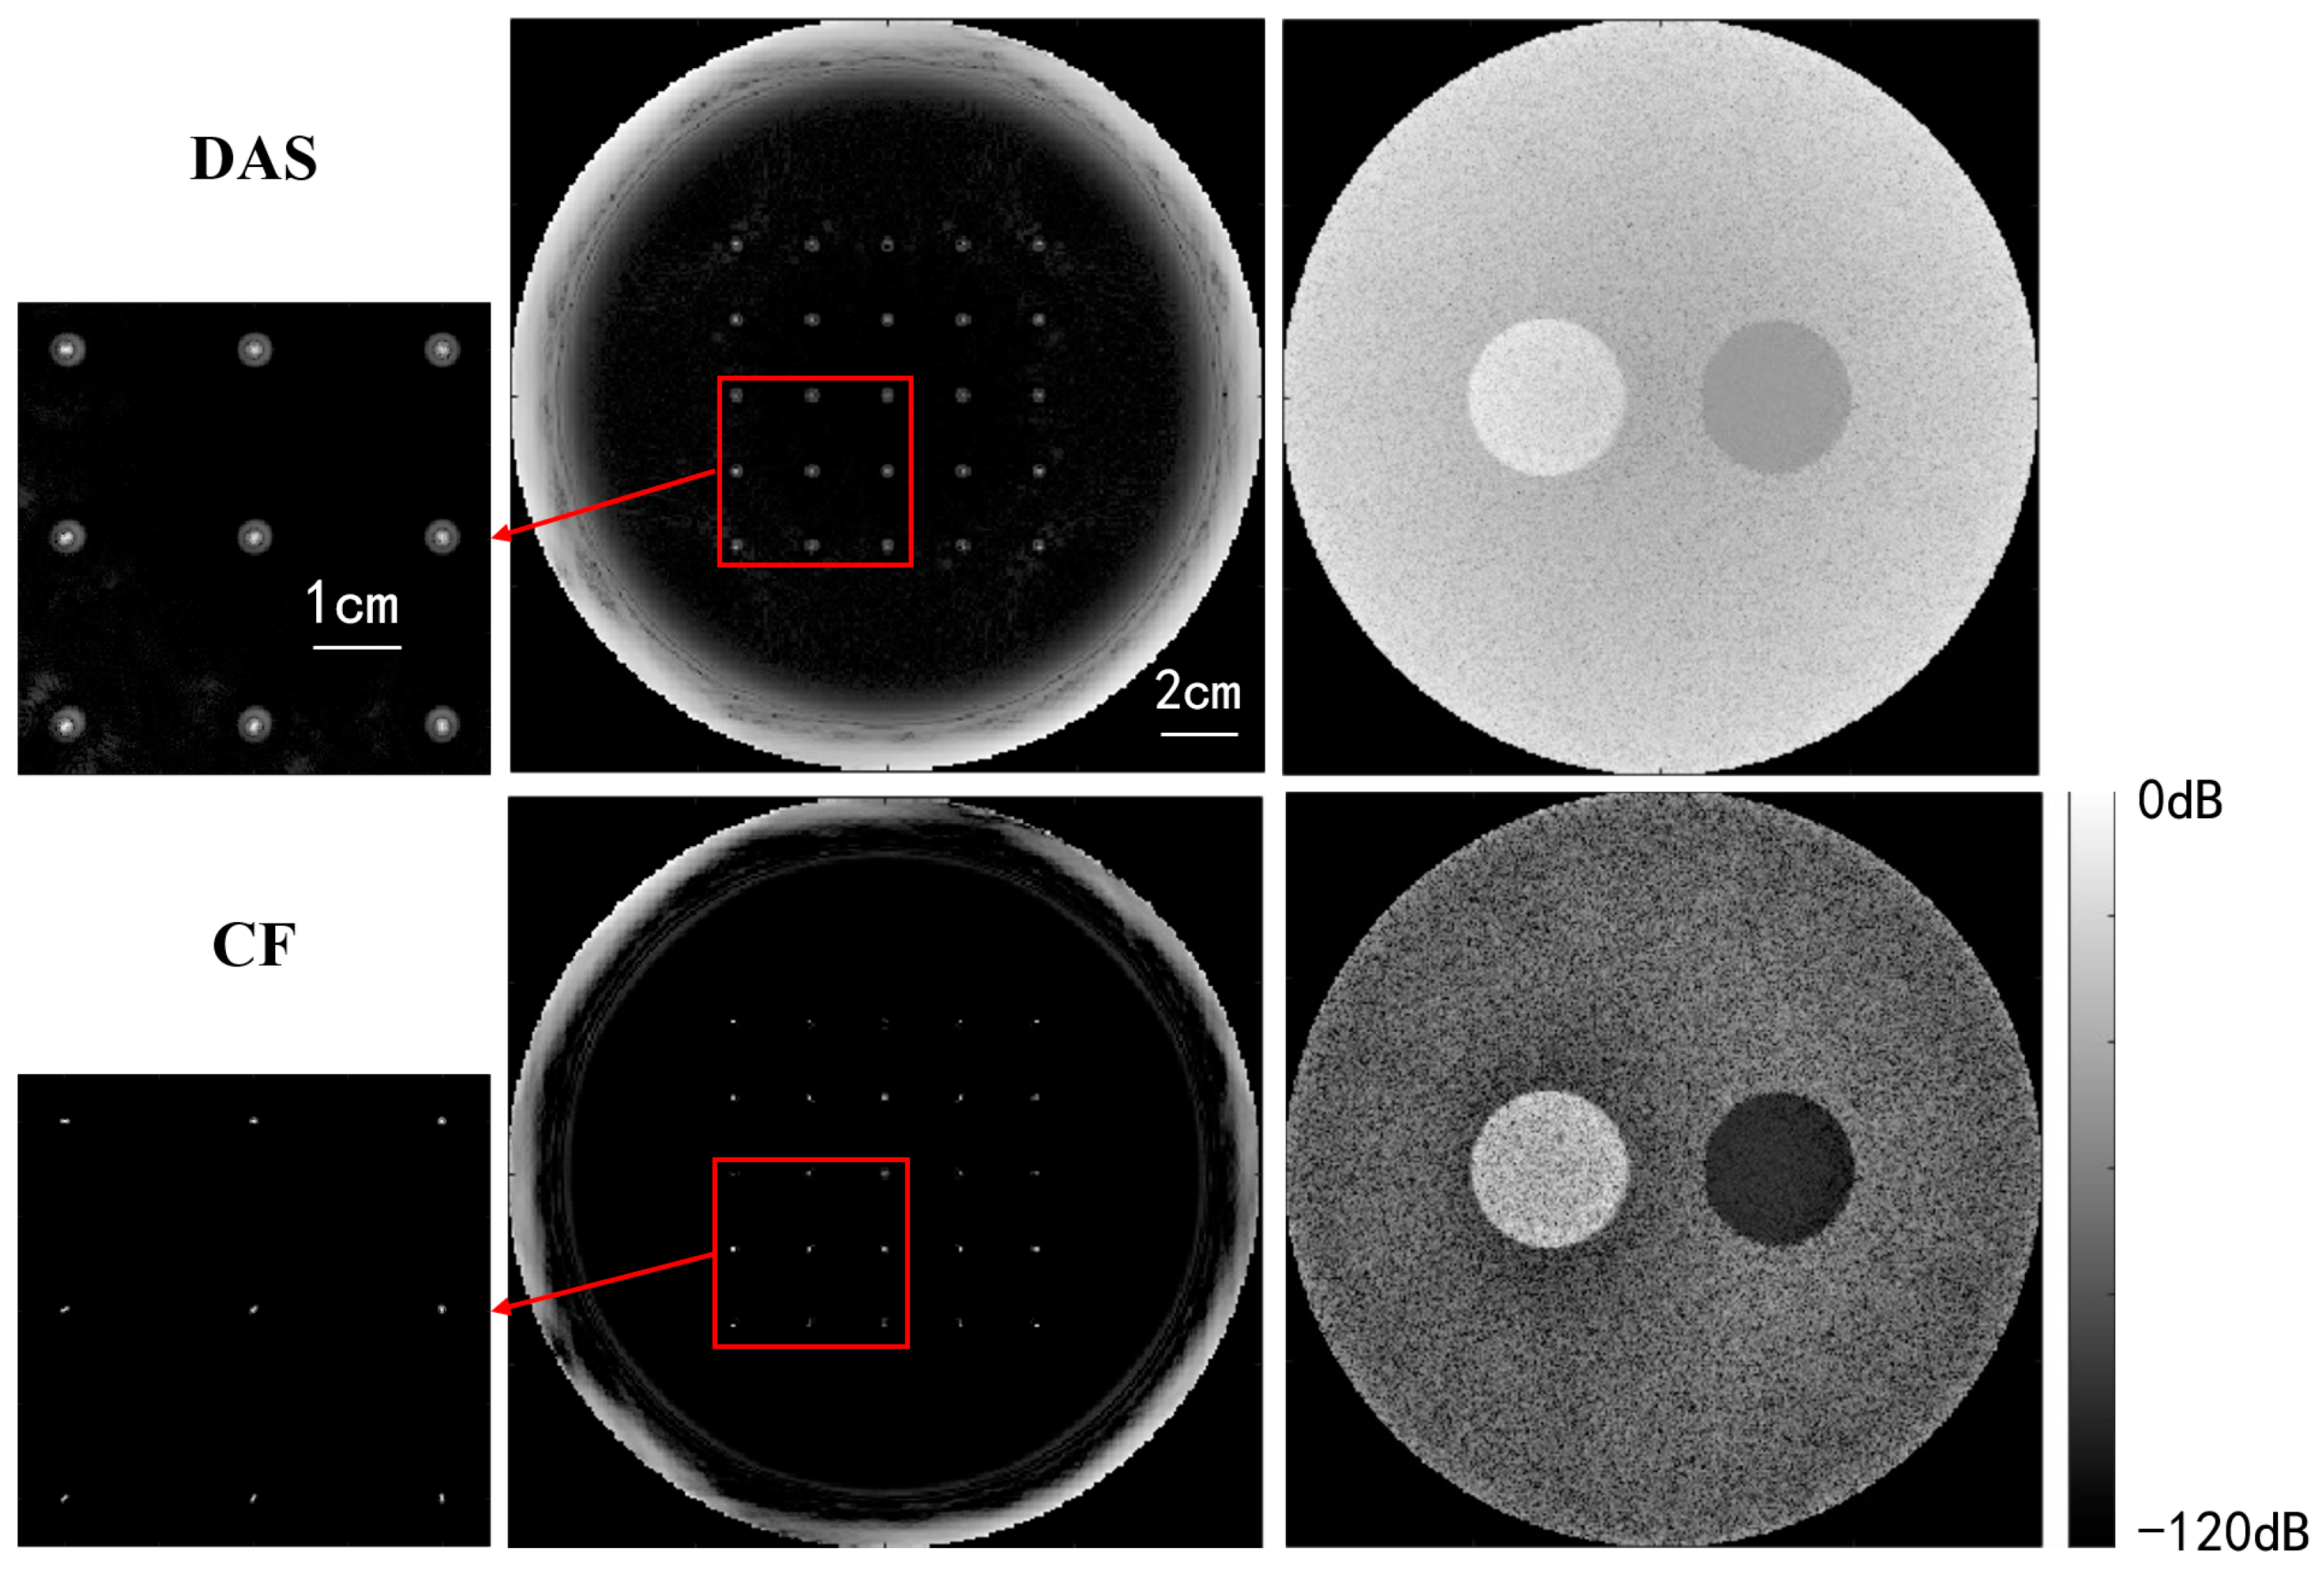
Figure 13 and Figure 14 present USCT reflection images obtained through DAS beamforming and CF beamforming. The reflection images include both point resolution evaluation images and breast contrast evaluation images with the experiment setup given in Figure 7.
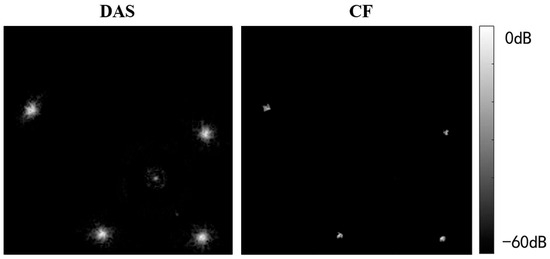
Figure 13.
Experimental point resolution evaluation phantom images.
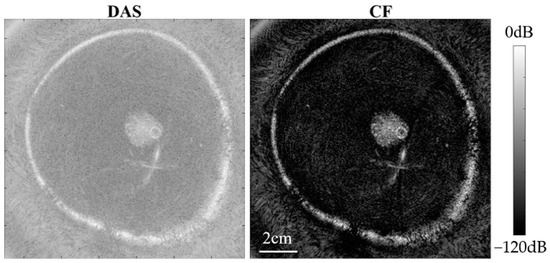
Figure 14.
Experimental breast contrast evaluation phantom images.
From Figure 13, it is evident that CF beamforming effectively reduces the main lobe of the point target, thereby improving image resolution. The FWHM for the nylon wire point target was measured as 0.35 mm with DAS beamforming, whereas it was 0.14 mm with CF beamforming. This demonstrates that the CF beamforming method can significantly enhance the resolution of USCT reflection images.
From Figure 14, notable noise suppression is observed in the background region of the breast phantom, and internal high-echo masses within the breast phantom are more distinctly visualized. Furthermore, we quantitatively calculated the CR between the internal mass region of the breast phantom and the background region. Ultimately, the CR of the image obtained with DAS beamforming was 24.54 dB, whereas the reflection image obtained with CF beamforming achieved a significantly higher CR of 63.18 dB. This is attributed to the fact that the CF beamforming applies weights to the image pixels by measuring the coherence of signals across different channels. Pixels with good focusing quality experience minimal noise interference, exhibit higher coherence, and are assigned relatively higher weights. Conversely, pixels with poor focusing quality are more affected by phase errors, resulting in lower coherence and smaller weights. As a result, this method effectively mitigates noise and side lobes generated by strong scattering points, leading to substantial improvements in image contrast and resolution.
6. Discussion
In this study, we introduced the CF beamforming method into USCT reflection imaging and evaluated its efficacy using both simulation and a built prototype. Both the simulation and experimental results demonstrate that the proposed method can significantly improve the resolution and contrast of USCT reflection images.
In this article, we have constructed a prototype for USCT reflection imaging, where data acquisition and reconstruction time are crucial metrics for imaging efficiency. Regarding data acquisition, both the CF and DAS methods require approximately 1 s, offering similar efficiency. However, future enhancements could involve utilizing transceiver front-ends with more channels to expedite this process further. As for image reconstruction, DAS and CF methods currently require 298 and 330 s, respectively, due to utilizing a single-core CPU for reconstruction. To expedite this process, future implementations could leverage GPU parallel computing for accelerated reconstruction.
USCT reflection imaging holds promise for providing high-quality breast images, and the application of CF beamforming further enhances both image resolution and contrast. However, there are several limitations associated with USCT. Firstly, the imaging object is limited to the breast, because bone and air may result in strong reflection waves and decreasing image quality when imaging other organs. An interesting area for future study would be to investigate the effects of bone and air on USCT imaging. Secondly, variations in breast size may lead to differences in imaging time, thereby affecting the overall efficiency of USCT breast imaging for different patients. Lastly, the implementation of CF beamforming involves coherence calculations, which increase the time required for image reconstruction. An interesting further work is to develop fast CF beamforming reconstruction techniques using GPU parallel computing to mitigate this issue.
The comparison of the efficacy of USCT reflection imaging with current methods in clinical studies is crucial. While we have not conducted clinical studies yet, we believe that such a comparison should include metrics such as sensitivity, specificity, imaging time, and cost. In terms of sensitivity and specificity, USCT offers the advantage of a large aperture and significantly improved resolution of ultrasound images. Therefore, we anticipate that USCT has the potential to enhance both sensitivity and specificity compared with current breast ultrasound techniques. However, further clinical studies are needed to validate this hypothesis. Regarding imaging time, our current setup allows us to obtain a single 2D slice in less than one second. Consequently, acquiring a complete set of 3D USCT reflection images for one breast, with a 2 mm interval and an average breast length of 150 mm, takes approximately 75 s. This means we can obtain images for both breasts within 3 min, and factoring in setup time, the total detection time for one patient is estimated to be about 5 min. This is comparable to the imaging times for mammography (around 5 min) and breast ultrasound (5–10 min). In terms of cost, the equipment cost for USCT is slightly higher than that of conventional breast ultrasound. However, because USCT imaging does not require a highly skilled operator, the overall total cost should be similar to that of conventional breast ultrasound. Mammography tends to have a slightly higher cost compared with both breast ultrasound and USCT.
7. Conclusions
In this study, we introduced the CF beamforming method into USCT reflection imaging with the SA technique. A USCT prototype was built to evaluate the effectiveness of CF beamforming in significantly improving reflection image quality. The CF beamforming assesses focusing quality, assigning higher weights to high-quality focusing, thereby reducing the main lobe and suppressing side lobes, leading to enhanced image resolution and contrast. Both numerical simulations and phantom experiments were conducted for evaluation. The numerical simulation results revealed that CF beamforming significantly improved both image resolution and contrast. The phantom experiment further demonstrated that CF beamforming improved image resolution, reducing FWHM from 0.35 mm to 0.14 mm, and increased CR from 24.54 to 63.18 dB. Therefore, CF beamforming can greatly enhance USCT reflection imaging quality with a ring transducer array, making it suitable for detecting lesions in clinical breast imaging scenarios and holding significant application value, especially in breast cancer screening. Furthermore, our future work will implement deep learning to reduce noise to improve image quality [34,35].
Author Contributions
Conceptualization, Z.H. and R.Y.; Methodology, Z.H., R.Y. and C.R.; Software, R.Y. and Z.W.; Validation, Z.H., Z.W. and C.R.; Investigation, Z.H. and J.Z.; Resources, Z.H.; Data curation, X.W.; Writing—original draft, R.Y. and Z.W.; Writing—review & editing, X.Q.; Visualization, X.W.; Supervision, X.Q.; Project administration, X.Q.; Funding acquisition, X.Q. All authors have read and agreed to the published version of the manuscript.
Funding
This research was funded by CAST grant from the Beijing Institute of Mechanics & Electricity and a Project 61901024 from the National Natural Science Foundation of China.
Data Availability Statement
No new data were created or analyzed in this study. Data sharing is not applicable to this article.
Conflicts of Interest
The authors declare no conflict of interest.
References
- Sung, H.; Ferlay, J.; Siegel, R.L.; Laversanne, M.; Soerjomataram, I.; Jemal, A.; Bray, F. Global cancer statistics 2020: GLOBOCAN estimates of incidence and mortality worldwide for 36 cancers in 185 countries. CA Cancer J. Clin. 2021, 71, 209–249. [Google Scholar] [CrossRef] [PubMed]
- Welch, H.G.; Schwartz, L.M.; Woloshin, S. Are Increasing 5-Year Survival Rates Evidence of Success Against Cancer? JAMA J. Am. Med. Assoc. (Chin. Ed.) 2000, 283, 2975–2978. [Google Scholar] [CrossRef] [PubMed]
- Huo, J.; Chen, W.; Li, N.; Shen, H.; Li, J.; Wang, Y.; Li, J.; Tian, J.; Zhou, B. Guidelines for Breast Cancer Screening, Early Diagnosis, and Early Treatment in Chinese Women (2021, Beijing). Chin. J. Oncol. 2021, 30, 161–191. [Google Scholar]
- Yaffe, M.J.; Mittmann, N.; Alagoz, O.; Trentham-Dietz, A.; Tosteson, A.N.; Stout, N.K. The effect of mammography screening regimen on incidence-based breast cancer mortality. J. Med. Screen. 2018, 25, 197–204. [Google Scholar] [CrossRef] [PubMed]
- Yao, Z.; Fan, S.; Nakajima, Y.; Qu, X. A Combined Regularization Method Using Prior Structural Information for Sound-speed Image Reconstruction of Ultrasound Computed Tomography. IEEE Access 2020, 8, 106832–106842. [Google Scholar] [CrossRef]
- Qu, X.; Yao, Z.; Tian, W.; Sun, J. Study on phase correction for USCT echo image by sound-speed image with different resolutions and noise levels. IEEE Access 2019, 9, 150657–150666. [Google Scholar] [CrossRef]
- Qu, X.; Fan, S.; Yao, Z.; Gao, S.; Sun, J.; Zhang, S.; Azuma, T. The effect of sound-speed-image resolution on phase aberration correction for ultrasound computed tomography. In Proceedings of the IEEE International Conference on Imaging Systems and Techniques (IST), Krakow, Poland, 16–18 October 2018. [Google Scholar]
- Duric, N.; Littrup, P.; Poulo, L.; Babkin, A.; Pevzner, R.; Holsapple, E.; Rama, O.; Glide, C. Detection of breast cancer with ultrasound tomography: First results with the Computed Ultrasound Risk Evaluation (CURE) prototype. Med. Phys. 2007, 34, 773–785. [Google Scholar] [CrossRef] [PubMed]
- Sree, S.V.; Ng EY, K.; Acharya, R.U.; Acharya, R.U.; Faust, O. Breast imaging: A survey. World J. Clin. Oncol. 2011, 2, 171. [Google Scholar] [CrossRef]
- Park, C.; Trumpour, T.; Aziz, A.; Bax, J.S.; Tessier, D.; Gardi, L.; Fenster, A. Cost-effective, portable, patient-dedicated three-dimensional automated breast ultrasound for point of care breast cancer screening. Sci. Rep. 2023, 13, 14390. [Google Scholar] [CrossRef]
- Luccas, V.; Azimbagirad, M.; Cabrelli, L.; Grillo, F.W.; Pavan, T.Z.; Otavio Murta, L., Jr.; Elias, J., Jr.; Carneiro, A.A.O. 3D automated breast ultrasound imaging: Equipment and image reconstruction. Res. Biomed. Eng. 2021, 37, 519–533. [Google Scholar] [CrossRef]
- Hendriks, G.; Chen, C.; Mann, R.; Hansen, H.H.; de Korte, C.L. Automated 3-D Ultrasound Elastography of the Breast: An in vivo Validation Study. Ultrasound Med. Biol. 2024, 50, 358–363. [Google Scholar] [CrossRef] [PubMed]
- Greenleaf, J.F.; Johnson, S.A.; Lent, A.H. Measurement of spatial distribution of refractive index in tissues by ultrasonic computer assisted tomography. Ultrasound Med. Biol. 1978, 3, 327–339. [Google Scholar] [CrossRef] [PubMed]
- Robinson, B.S.; Greenleaf, J.F. The scattering of ultrasound by cylinders: Implications for diffraction tomography. J. Acoust. Soc. Am. 1986, 80, 40–49. [Google Scholar] [CrossRef] [PubMed]
- Schmidt, S.; Duric, N.; Li, C.; Roy, O.; Huang, Z.-F. Modification of Kirchhoff migration with variable sound speed and attenuation for acoustic imaging of media and application to tomographic imaging of the breast. Med. Phys. 2011, 38, 998–1007. [Google Scholar] [CrossRef] [PubMed]
- Gemmeke, H.; Zapf, M.; Hopp, T.; Ruiter, N.V. Optimization of the aperture and transducers of a three-dimensional ultrasound computer tomography system. J. Acoust. Soc. Am. 2014, 135, 2178. [Google Scholar] [CrossRef]
- Hopp, T.; Zapf, M.; Gemmeke, H.; Ruiter, N.V. Experimental evaluation of straight ray and bent ray phase aberration correction for USCT SAFT imaging. In Proceedings of the Medical Imaging 2018: Ultrasonic Imaging and Tomography, Houston, TX, USA, 14–15 February 2018; Volume 10580, pp. 136–148. [Google Scholar]
- Hua, S.; Ding, M.; Weichi, M. Research on Ultrasound Inverse Scattering Imaging Based on Compressed Sensing. Beijing Biomed. Eng. 2015, 34, 24–31+37. [Google Scholar]
- Wang, S.; Song, J.; Peng, Y.; Zhou, L.; Ding, M.; Yuchi, M. Ultrasound computed tomography by frequency-shift low-pass filtering and least mean square adaptive filtering. In Proceedings of the Medical Imaging 2017: Ultrasonic Imaging and Tomography, Orlando, FL, USA, 15–16 February 2017; Volume 10139, pp. 40–46. [Google Scholar]
- Qu, X.; Azuma, T.; Yogi, T.; Azuma, S.; Takeuchi, H.; Tamano, S.; Takagi, S. Synthetic aperture ultrasound imaging with a ring transducer array: Preliminary ex vivo results. J. Med. Ultrason. 2016, 43, 461–471. [Google Scholar] [CrossRef]
- Stotzka, R.; Wuerfel, J.; Mueller, T.O.; Gemmeke, H. Medical imaging by ultrasound computer tomography. In Proceedings of the Medical Imaging 2002: Ultrasonic Imaging and Signal Processing, San Diego, CA, USA, 23–28 February 2002. [Google Scholar]
- Yang, M.; Gao, Y.; Tang, L.; Hou, J.; Hu, B. Wearable Eye-Tracking System for Synchronized Multimodal Data Acquisition. In IEEE Transactions on Circuits and Systems for Video Technology; IEEE: Piscataway, NJ, USA, 2023. [Google Scholar] [CrossRef]
- Treeby, B.E.; Cox, B.T. k-Wave: MATLAB toolbox for the simulation and reconstruction of photoacoustic wave fields. J. Biomed. Opt. 2010, 15, 021314. [Google Scholar] [CrossRef]
- Treeby, B.E.; Jaros, J.; Rendell, A.P.; Cox, B.T. Modeling nonlinear ultrasound propagation in heterogeneous media with power law absorption using ak-space pseudospectral method. J. Acoust. Soc. Am. 2012, 131, 4324–4336. [Google Scholar] [CrossRef]
- Treeby, B.E.; Jaros, J.; Rohrbach, D.; Cox, B.T. Modelling elastic wave propagation using the k-wave matlab toolbox. In Proceedings of the 2014 IEEE International Ultrasonics Symposium, Chicago, IL, USA, 3–6 September 2014; pp. 146–149. [Google Scholar]
- Treeby, B.E.; Budisky, J.; Wise, E.S.; Jaros, J.; Cox, B.T. Rapid calculation of acoustic fields from arbitrary continuous-wave sources. J. Acoust. Soc. Am. 2018, 143, 529–537. [Google Scholar] [CrossRef]
- Martin, E.; Jaros, J.; Treeby, B. Experimental validation of k-Wave: Nonlinear Wave Propagation in Layered, Absorbing Fluid Media. IEEE Trans. Ultrason. Ferroelectr. Freq. Control 2020, 67, 81–91. [Google Scholar] [CrossRef] [PubMed]
- Treeby, B.; Wise, E.; Kuklis, F.; Jaros, J.; Cox, B.T. Nonlinear Ultrasound Simulation in an Axisymmetric Coordinate System using k-space pseudospectral method. J. Acoust. Soc. Am. 2020, 148, 2288–2300. [Google Scholar] [CrossRef] [PubMed]
- Treeby, B. Modeling Nonlinear Wave Propagation on Nonuniform Grids using a Mapped k-Space Pseudospectral Method. IEEE Trans. Ultrason. Ferroelectr. Freq. Control 2013, 60, 2208–2213. [Google Scholar] [CrossRef] [PubMed]
- Firouzi, K.; Cox, B.; Treeby, B.; Saffari, N. A first-order k-space model for elastic wave propagation in heterogeneous media. J. Acoust. Soc. Am. 2012, 132, 1271–1283. [Google Scholar] [CrossRef] [PubMed]
- Treeby, B.; Cox, B. A k-space Green’s function solution for acoustic initial value problems in homogeneous media with power law absorption. J. Acoust. Soc. Am. 2011, 129, 3652–3660. [Google Scholar] [CrossRef] [PubMed]
- Cox, B.; Kasa, S.; Arridge, S.; Beard, P. k-space propagation models for acoustically heterogeneous media: Application to biomedical photoacoustics. J. Acoust. Soc. Am. 2007, 121, 3453–3464. [Google Scholar] [CrossRef]
- Alomariz, R.S. Plane Wave Imaging Beamforming Techniques for Medical Ultrasound Imaging; University of Leeds: Leeds, UK, 2017. [Google Scholar]
- Tao, Y.; Yang, M.; Li, H.; Wu, Y.; Hu, B. DepMSTAT: Multimodal Spatio-Temporal Attentional Transformer for Depression Detection. In IEEE Transactions on Knowledge and Data Engineering; IEEE: Piscataway, NJ, USA, 2024. [Google Scholar] [CrossRef]
- Yang, M.; Weng, Z.; Zhang, Y.; Tao, Y.; Hu, B. Three-Stream Convolutional Neural Network for Depression Detection with Ocular Imaging. IEEE Trans. Neural Syst. Rehabil. Eng. 2023, 31, 4921–4930. [Google Scholar] [CrossRef]


Disclaimer/Publisher’s Note: The statements, opinions and data contained in all publications are solely those of the individual author(s) and contributor(s) and not of MDPI and/or the editor(s). MDPI and/or the editor(s) disclaim responsibility for any injury to people or property resulting from any ideas, methods, instructions or products referred to in the content. |
© 2024 by the authors. Licensee MDPI, Basel, Switzerland. This article is an open access article distributed under the terms and conditions of the Creative Commons Attribution (CC BY) license (https://creativecommons.org/licenses/by/4.0/).