
Application of Graph Theory for Blockchain Technologies

Abstract
1. Introduction
2. Background
3. Blockchain Technology Overview
4. Relevant Concepts from Graph Theory
- 1.
- Degree centrality identifies highly connected nodes that interact with many others in the network [45].
- 2.
- Betweenness centrality identifies nodes that bridge different communities, enabling the flow of information [46].
- 3.
- 4.
- 5.
- 6.
- 7.
- Resilience evaluates a network’s vulnerability to random failures or targeted attacks on nodes or edges [55].
5. Graph Theory Application in Blockchain Systems
5.1. Analyzing Network Decentralization
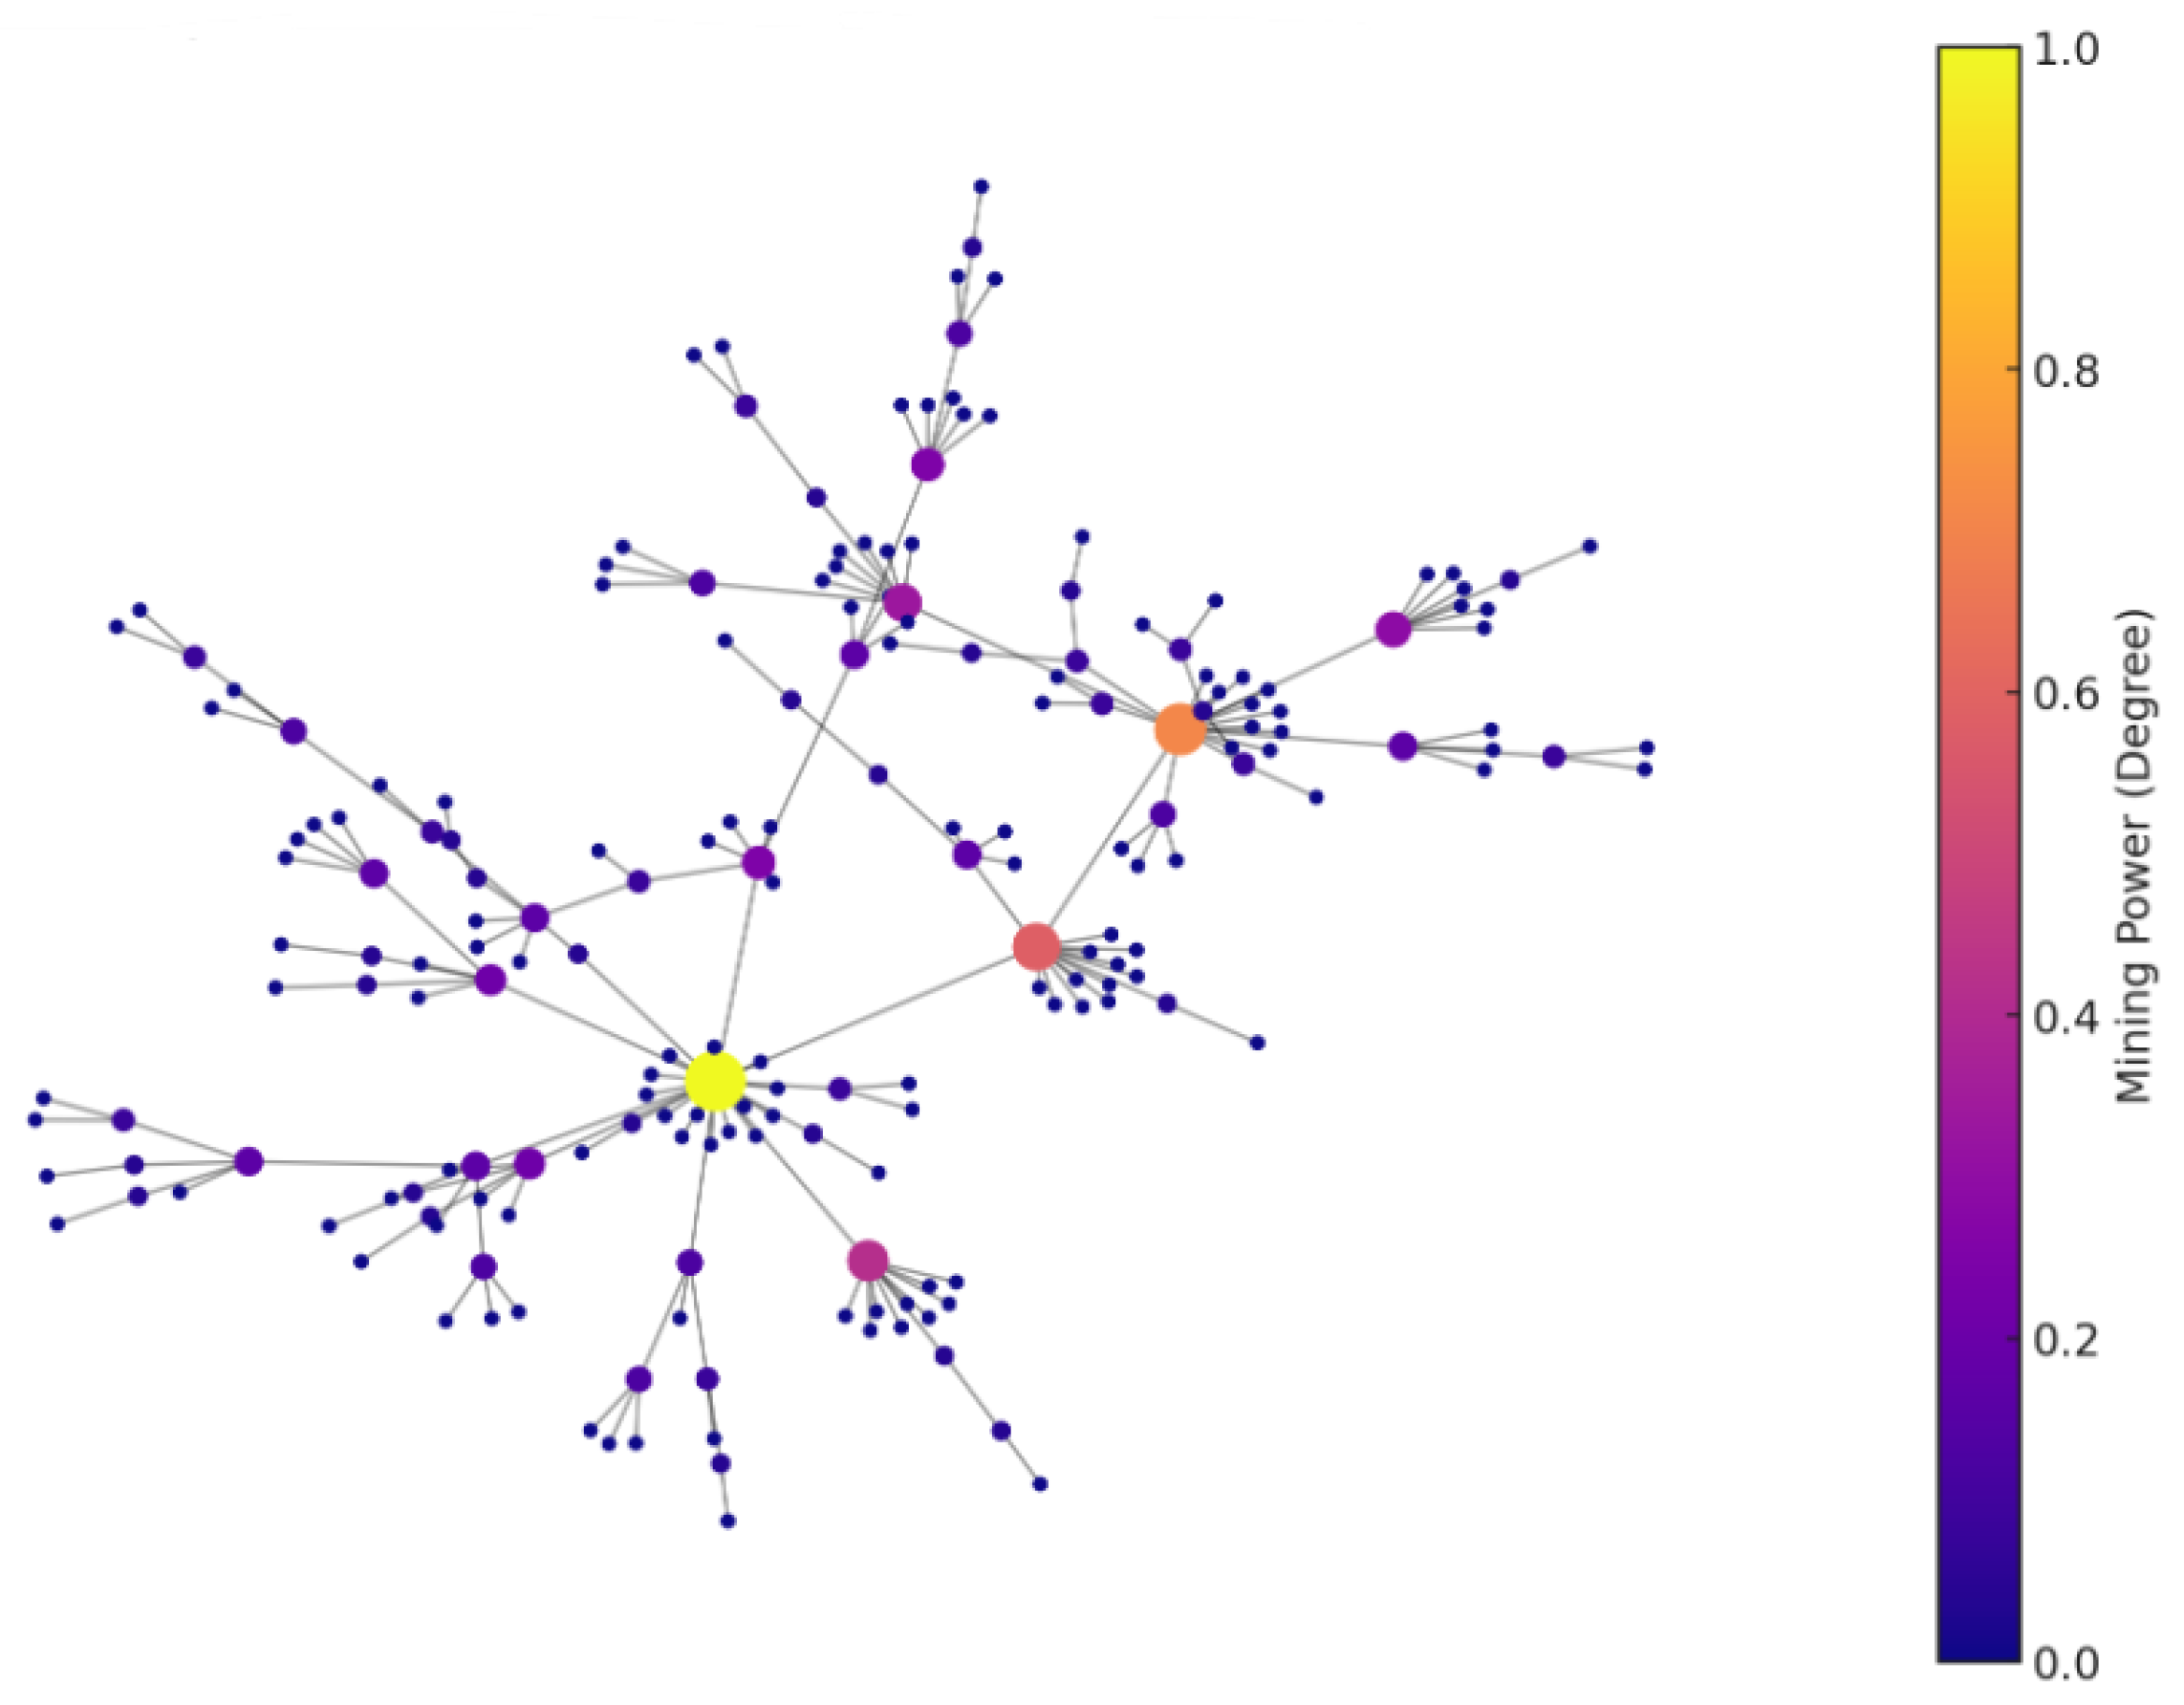
5.1.1. Mining Pool Power
- Graph Model: The blockchain network is modeled as a dynamic graph , where V represents the set of mining pools, and E represents the connections between them.
- Degree of a Node: The degree of a node in G represents the number of connections a mining pool has with other pools.
- Wealth and Power Correlation: The mining power of a pool is directly proportional to its degree in the graph.
- Network Growth: New nodes (mining pools) prefer to connect to existing nodes with higher degrees (a preferential attachment model, akin to the Barabási–Albert model).
- In a blockchain network modeled as a graph following the above assumptions, the network naturally evolves towards a state of increased centralization of mining power.
- (a)
- Initial State Analysis:Let be the initial state of the graph, where is relatively large and the degree distribution is uniform or near-uniform.
- (b)
- Preferential Attachment:Define the attachment probability for a new node connecting to an existing node v.New nodes prefer to attach to existing nodes v with higher . each new node is connected to k other ones, each one of those connections is chosen according to the probabilities
- (c)
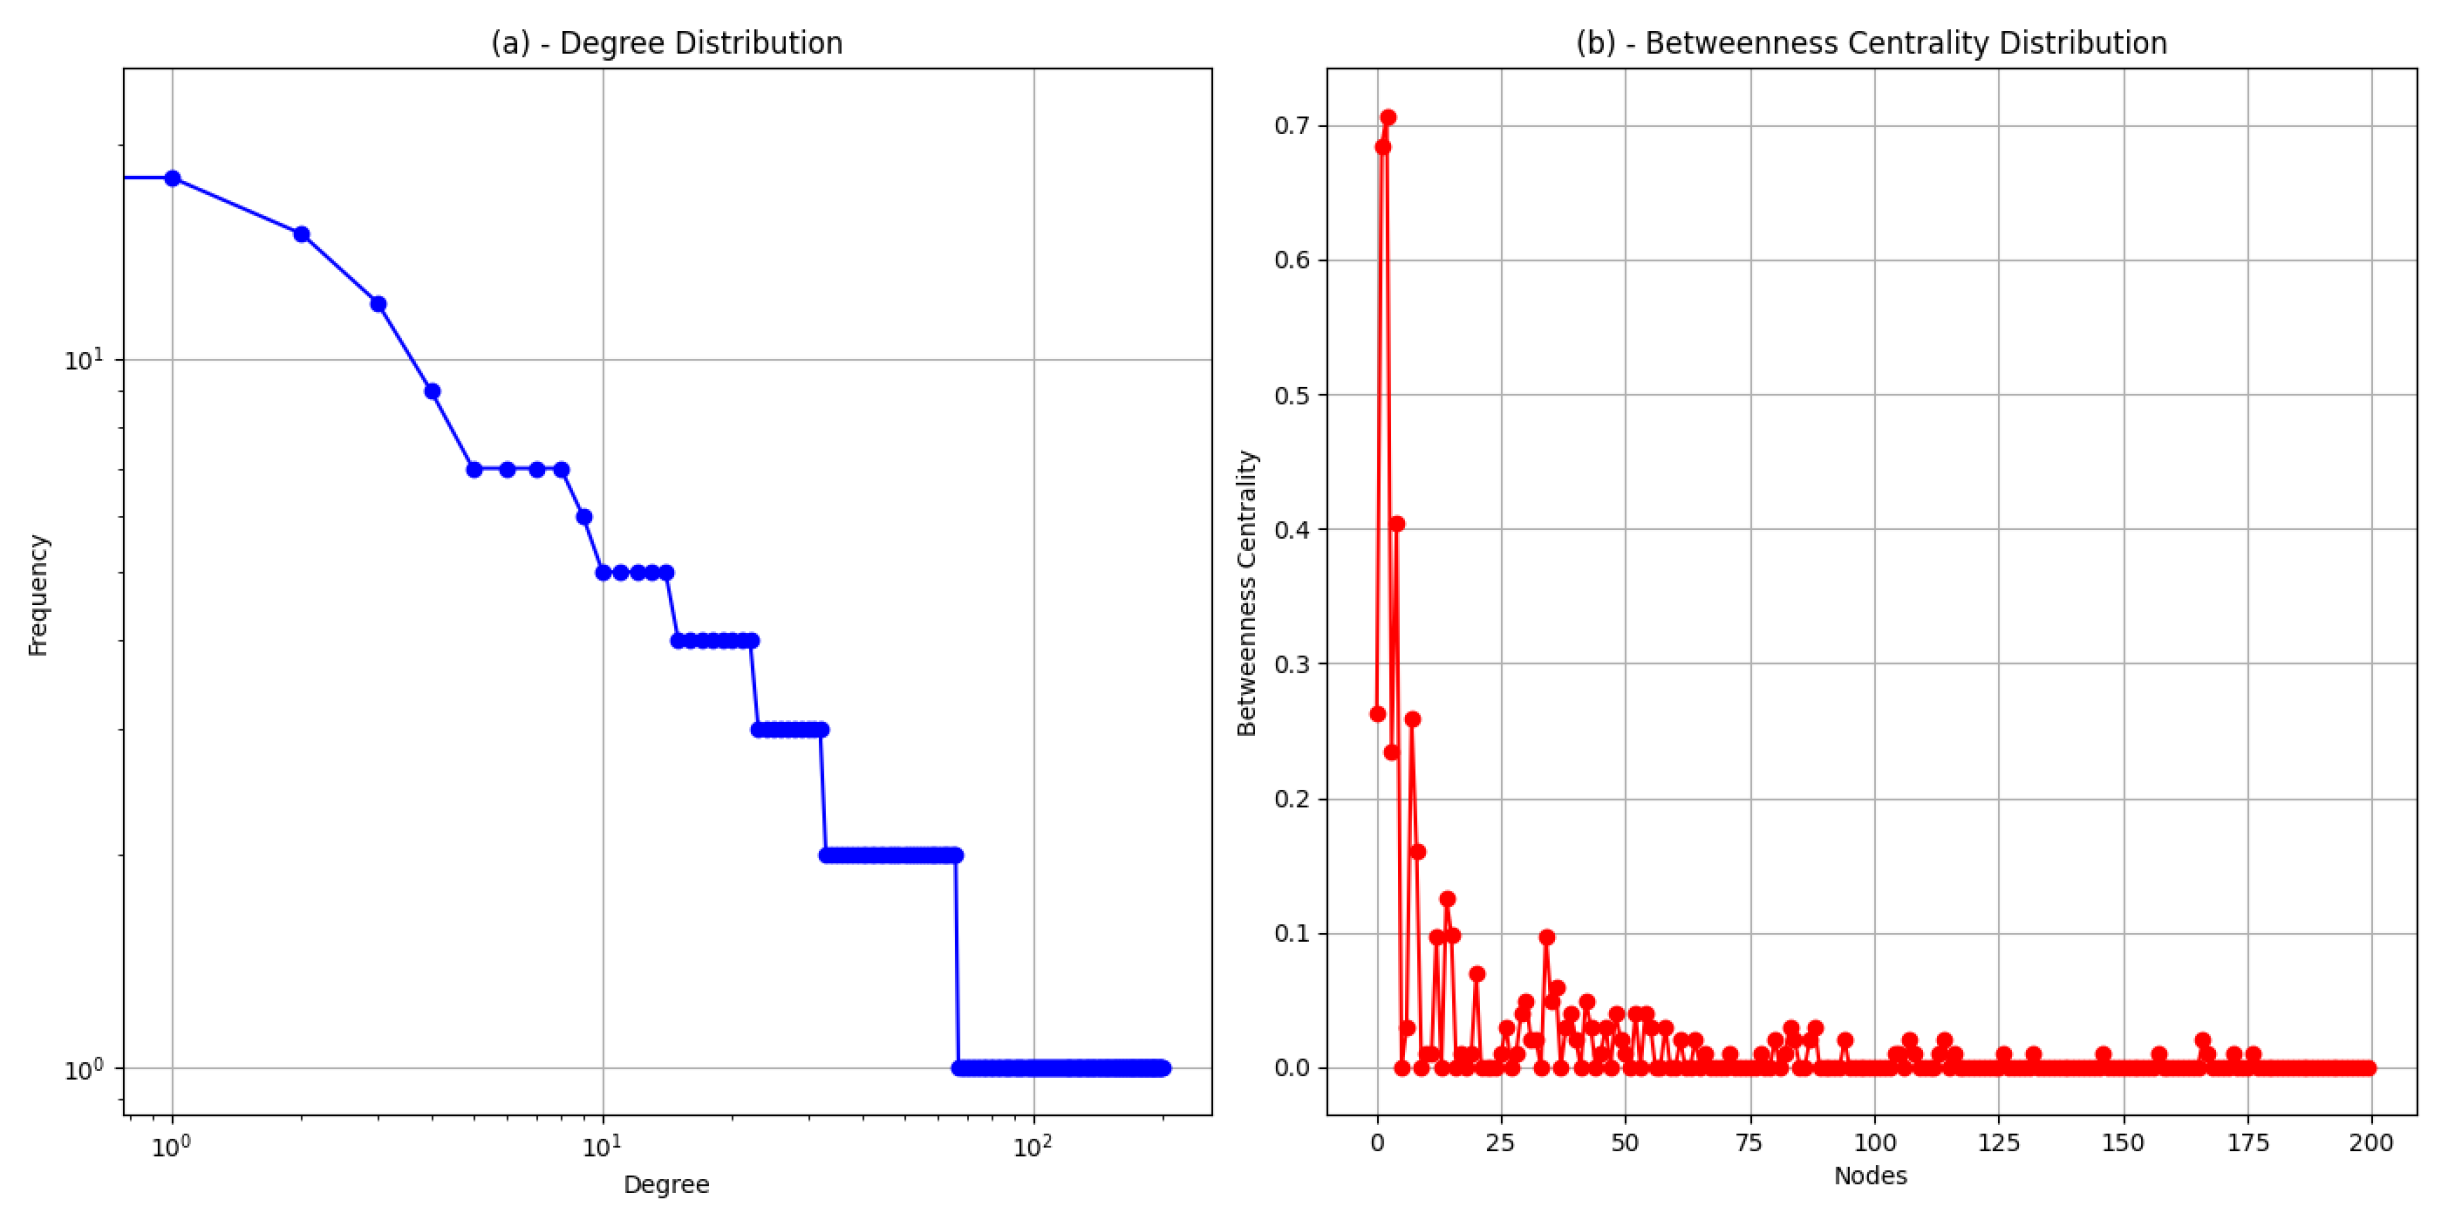
- Degree Distribution Evolution:Over time, the degree distribution for becomes skewed, favoring nodes with initially higher degrees.The skewness can be represented by the increase in variance over time: for . The variance could increase but still tend to a limit. It seems like the usual argument for the skewness of such a network is that the degree distribution follows a power law. It is indeed the case in the Barabási–Albert model
- (d)
- Correlation of Degree and Mining Power:Let mining power of a node v be proportional to its degree: .Thus, is also increasingly skewed as becomes skewed.
- (e)
- Centralization:Centralization can be quantified by a metric , where increases as the skewness in increases.Formally, for , indicating increased centralization over time.
- (f)
- Implications for Network Security and Decentralization:Security risk and decentralization level can be formally defined.Increased implies increased and decreased .
5.1.2. Stake Pool Power
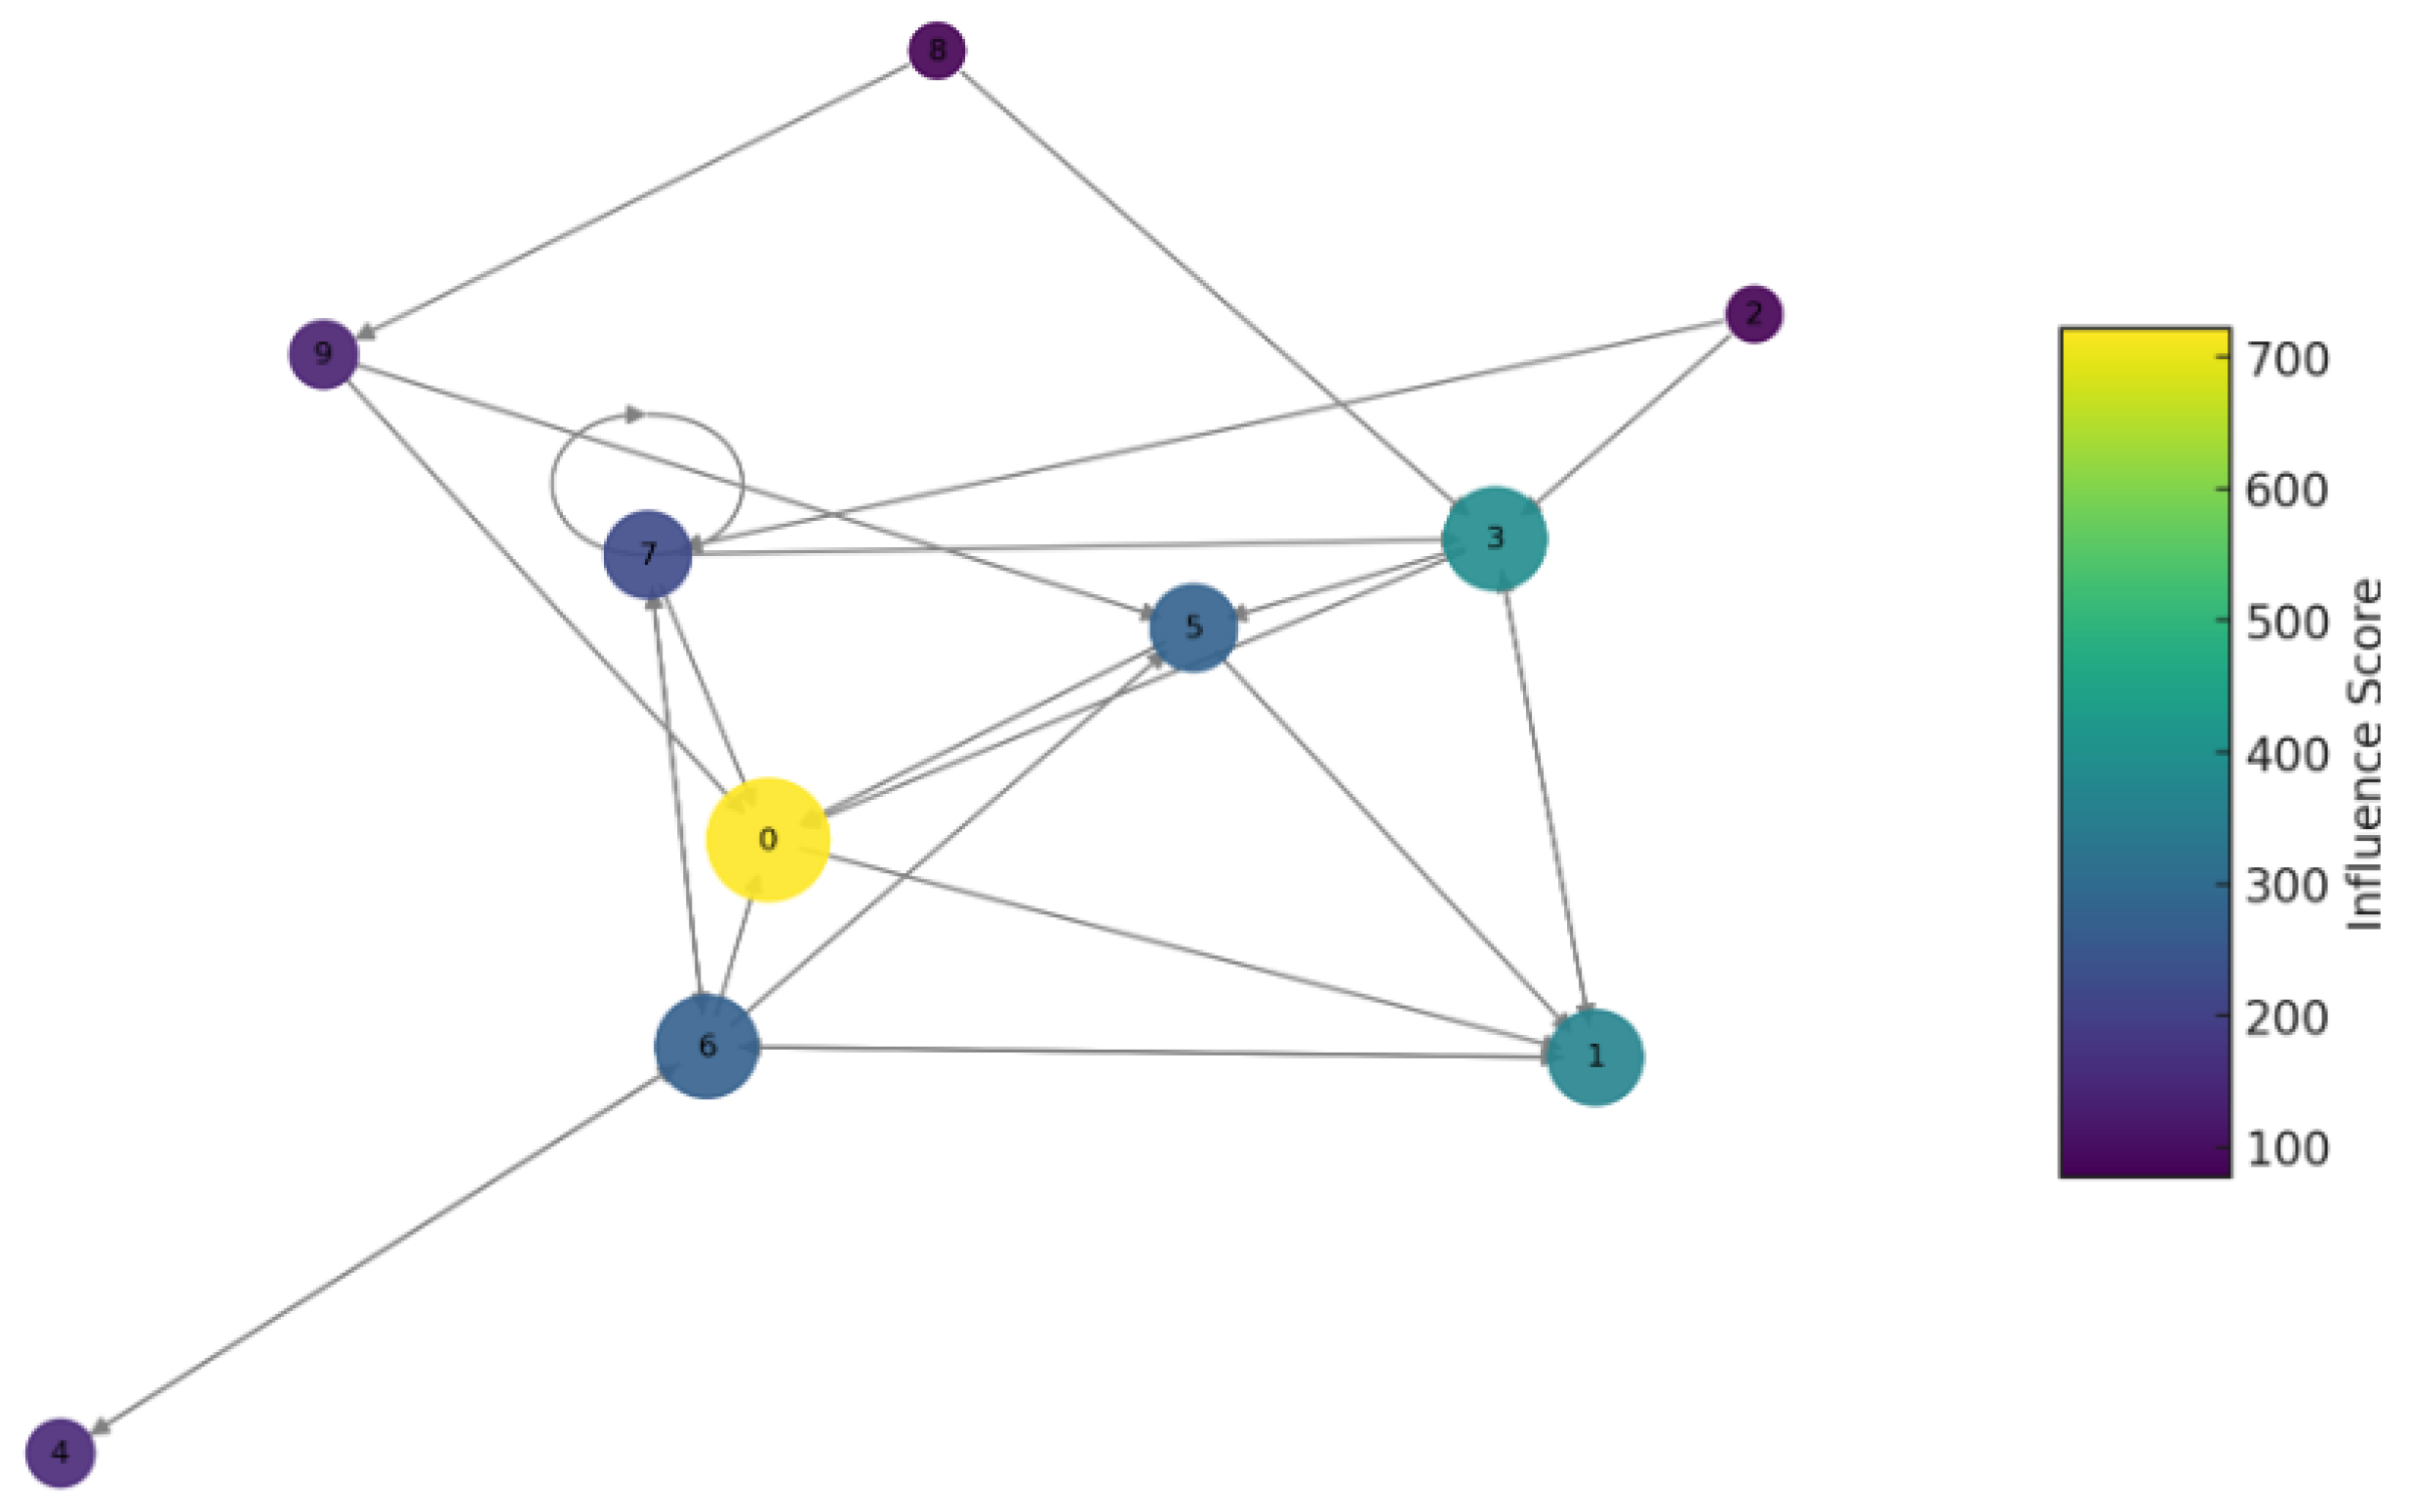
- Graph Model: The blockchain network is modeled as a (weighted) directed graph , where each node represents a stake pool and each arc represents staking delegation from pool u to pool v.
- Stake Representation: The weight of each node corresponds to the total stake delegated to the pool v.
- Influence by Stake: The influence or power of a stake pool is directly proportional to its total stake.
- Network Dynamics: New stakeholders tend to delegate their stake to pools with higher existing stakes, modeling a preferential attachment similar to the Barabási–Albert model.
- In a blockchain network modeled as a directed graph following the above assumptions, the network evolves towards a state where a small number of stake pools accumulate a disproportionately large amount of total stake, indicating a trend towards centralization of stake power.
- (a)
- Initial State Analysis:Let represent the initial state of the graph, with denoting the stake for each pool , where is relatively uniform across .
- (b)
- Preferential Attachment Dynamics:Define , the probability of a new stakeholder delegating their stake to pool v. New stakeholders are more likely to delegate to pools with higher , following preferential attachment.
- (c)
- Evolution of Stake Distribution:As time progresses, this dynamic leads to an evolved graph at time t, where the distribution of for becomes increasingly skewed. This skewness is represented by an increasing variance: for .
- (d)
- Centralization of Stake Power:Quantify centralization at time t with , which increases with the skewness of . Formally, for , indicating a trend towards increased centralization of stake power.
5.1.3. Wealth Concentration
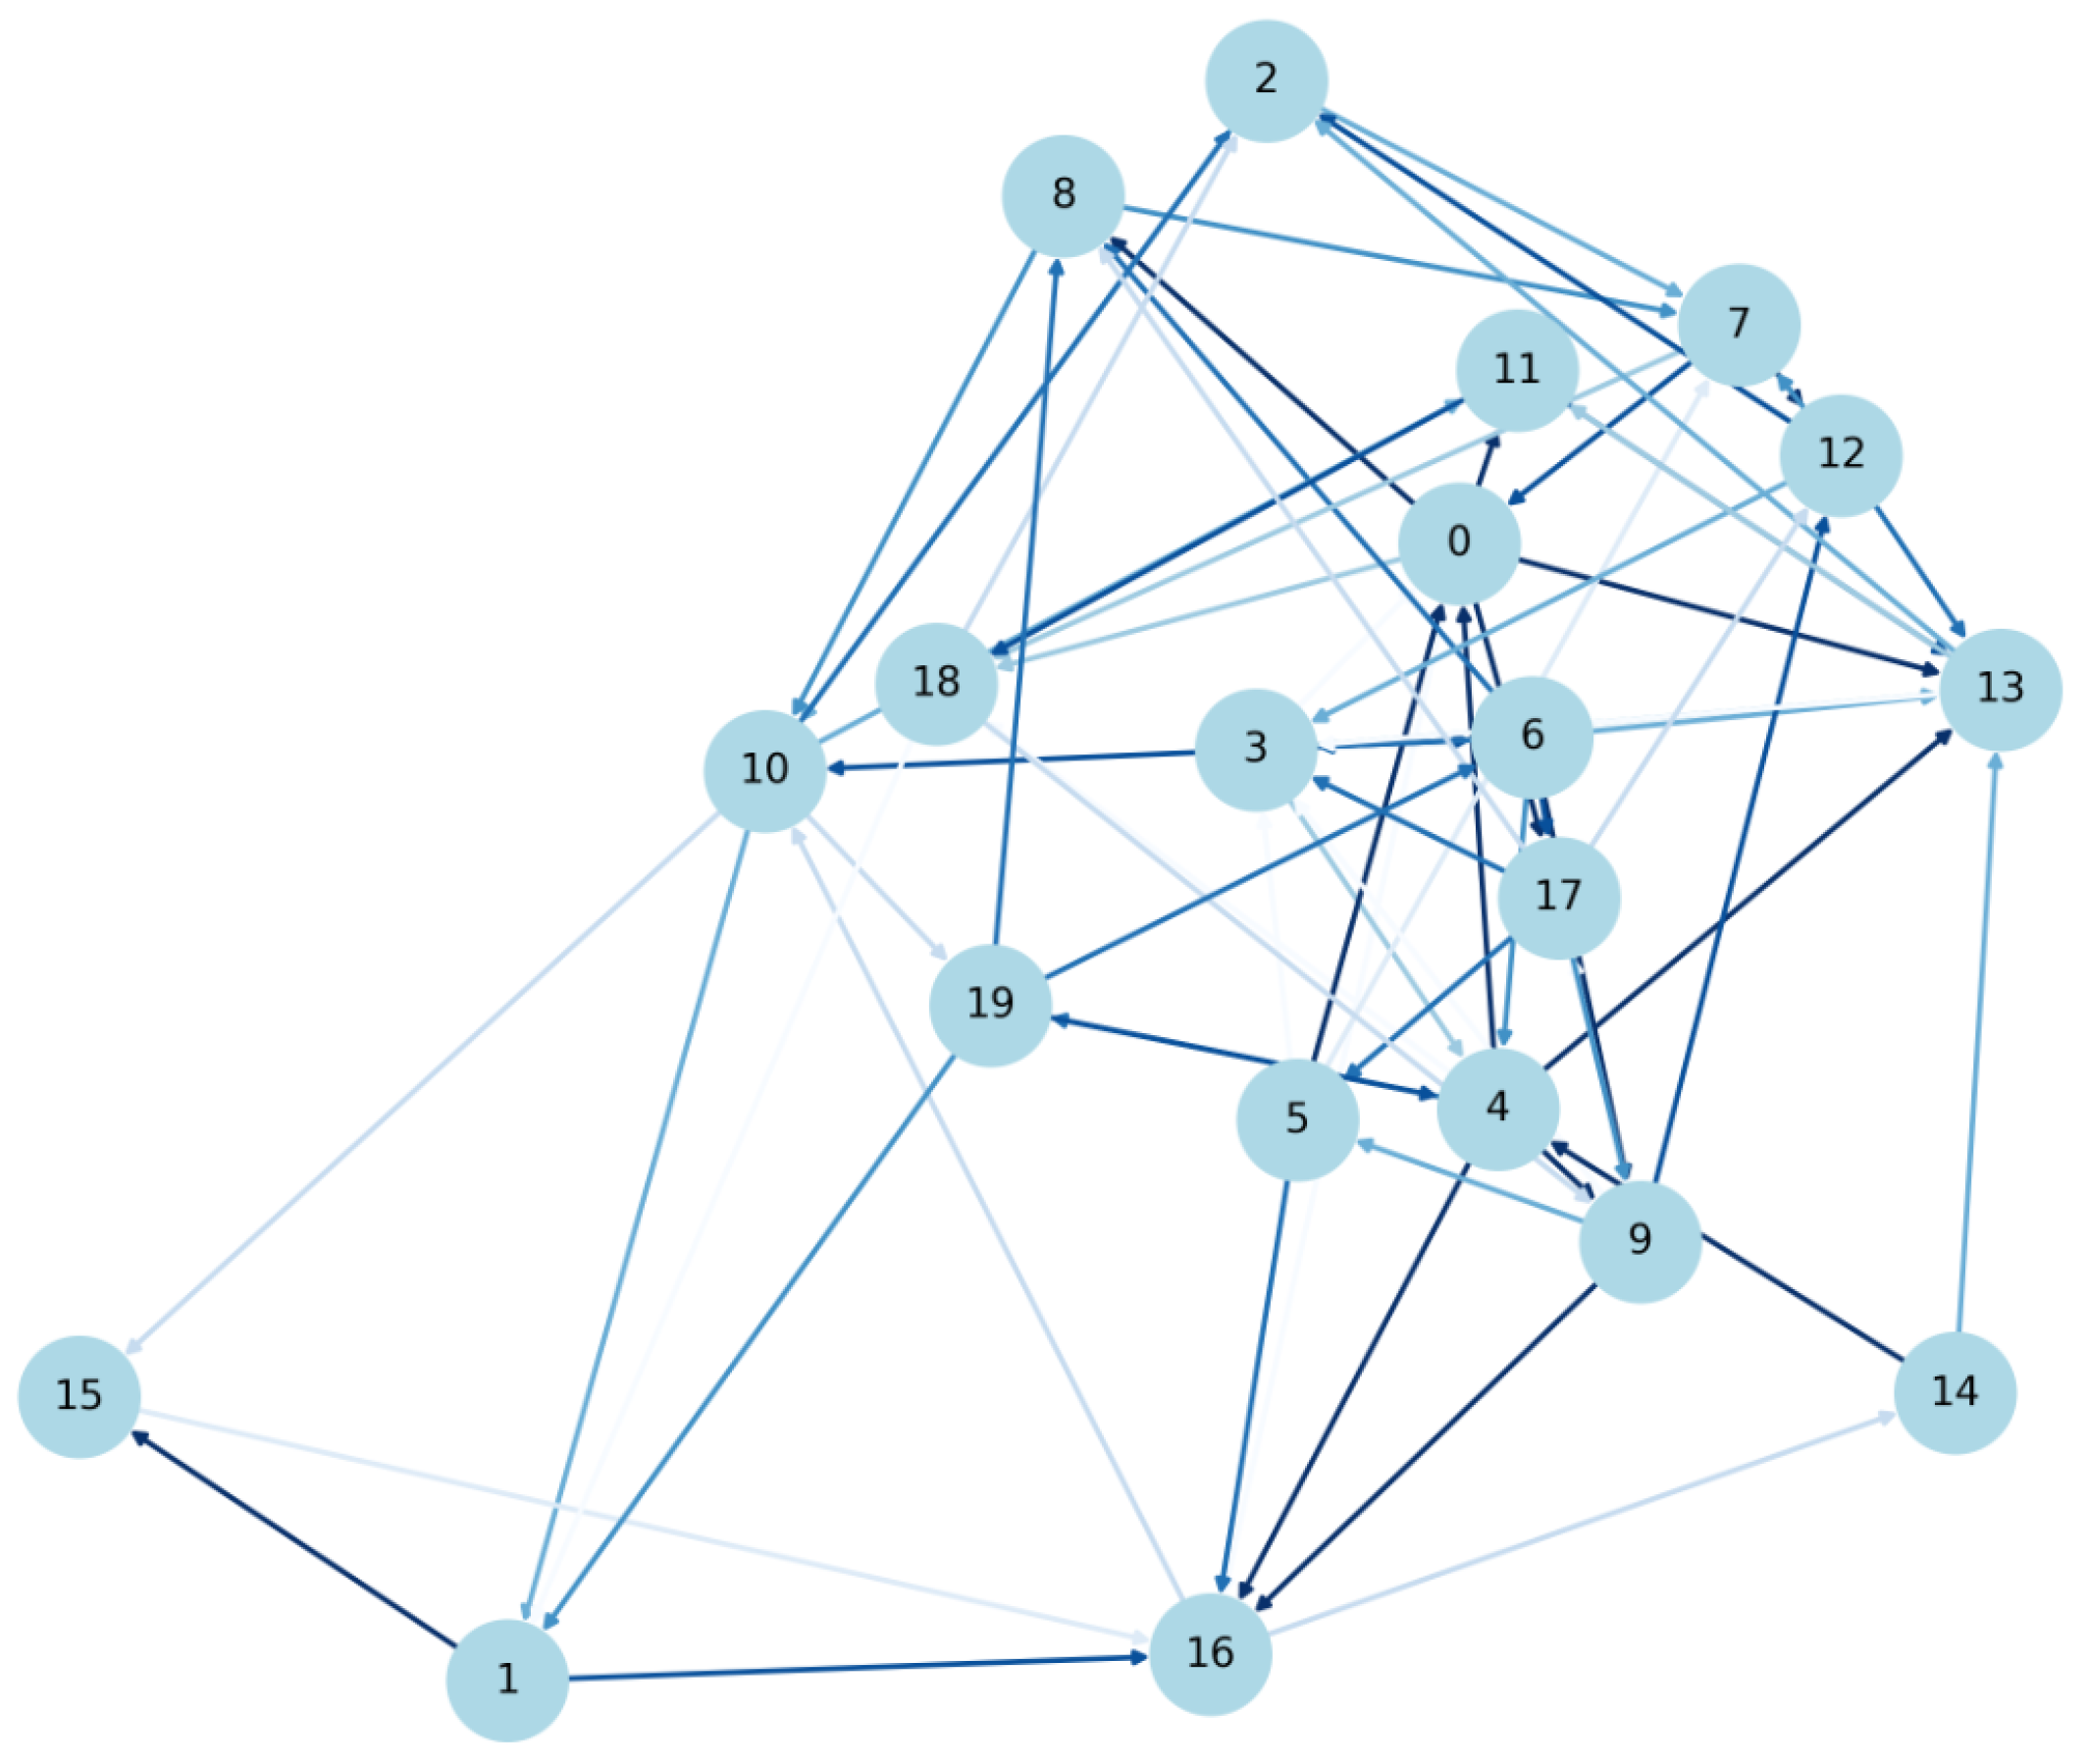
- Graph Model: The blockchain transaction network is modeled as a weighted directed graph , where:
- −
- V represents addresses (wallets) in the network.
- −
- E represents transactions between addresses.
- −
- W is a set of weights on the edges, where each weight represents the value of the transaction from address u to address v.
- Degree of a Node: The degree of a node (address) in G represents the number of transactions involving that address. The degree is the number of wallet transactions.
- Strength of a Node: The strength of a node is defined as the sum of the weights (transaction values) of the edges connected to the node. This represents the total value of transactions for that address.
- Wealth and Transaction Correlation: An address’s wealth is assumed to correlate with both its degree and strength in the graph.
- In a blockchain transaction network modeled as a weighted directed graph, a skewed degree and strength distribution indicates a concentration of token ownership and transactional flow among a limited number of addresses, suggesting wealth concentration.
- (a)
- Degree and Strength Analysis:Analyze the degree distribution and the strength distribution in graph G. A uniform distribution implies decentralized token flow, while a skewed distribution indicates concentration.
- (b)
- Skewness of Distributions:Apply skewness metrics to D and S. High skewness values in D and S indicate that a few addresses have much higher degrees and strengths, respectively.
- (c)
- Wealth Concentration Inference:Given the correlation between an address’s wealth and its degree/strength, the skewness in D and S can be interpreted as indicators of wealth concentration. A few addresses (high-degree, high-strength nodes) dominate the total token flow, indicating wealth concentration.
- (d)
- Temporal Evolution:By examining the evolution of D and S over time, trends in wealth concentration can be identified. Increasing skewness over time suggests increasing wealth concentration.
5.1.4. Developer Concentration
- Graph Model: The collaboration network is modeled as a directed graph , where:
- −
- V represents the set of developers.
- −
- E represents collaborative relationships (e.g., working on the same project or module).
- −
- W is a set of weights on the edges, where each weight quantifies the level of collaboration or contribution from developer u to developer v.
- Degree of a Node: The in-degree and out-degree of a node v represent the number of contributions received by and made by developer v, respectively.
- Strength of a Node: The strength of a node is defined as the sum of the weights of the outgoing edges connected to v, reflecting the total impact of a developer’s contributions.
- Core Developer Identification: A core developer is identified by high out-degree, high strength, or a combination of both, indicating significant influence or dependency in the network.
- In a blockchain platform’s collaboration network modeled as a weighted directed graph, a skewed distribution of degrees and strengths among developers indicates excessive dependencies on a few core developers.
- (a)
- Degree and Strength Analysis:Define the in-degree and out-degree of a node (developer) v in graph G as and , respectively. These represent the number of contributions received by and made by developer v. The strength of a node is the sum of the weights of the edges connected to v, quantifying the impact of a developer’s contributions: .
- (b)
- Skewness of Distributions:Analyze the skewness of the degree distributions and , and the strength distribution . High skewness indicates a small number of developers (nodes) with significantly higher degrees or strengths.
- (c)
- Dependency Inference:A core developer can be identified by high values of , , and . If the skewness in , , or S is high, it indicates a network structure with excessive dependency on a few developers.
- (d)
- Network Health and Robustness:A network’s robustness and sustainability can be at risk if it is overly dependent on a few core developers. The temporal evolution of , , and S can be examined to understand how these dependencies change over time.
5.2. Evaluating Security and Privacy
5.2.1. Topological Attacks
- Graph Model: The blockchain network is modeled as an undirected, connected graph , where:
- −
- V represents the set of nodes (miners, validator pools).
- −
- E represents connections between the nodes.
- Critical Nodes: Nodes whose removal fragments the network topology into multiple disconnected components.
- Articulation Points: Nodes whose removal increases the number of connected components in the graph.
- Bridges: Edges whose removal disconnects the graph.
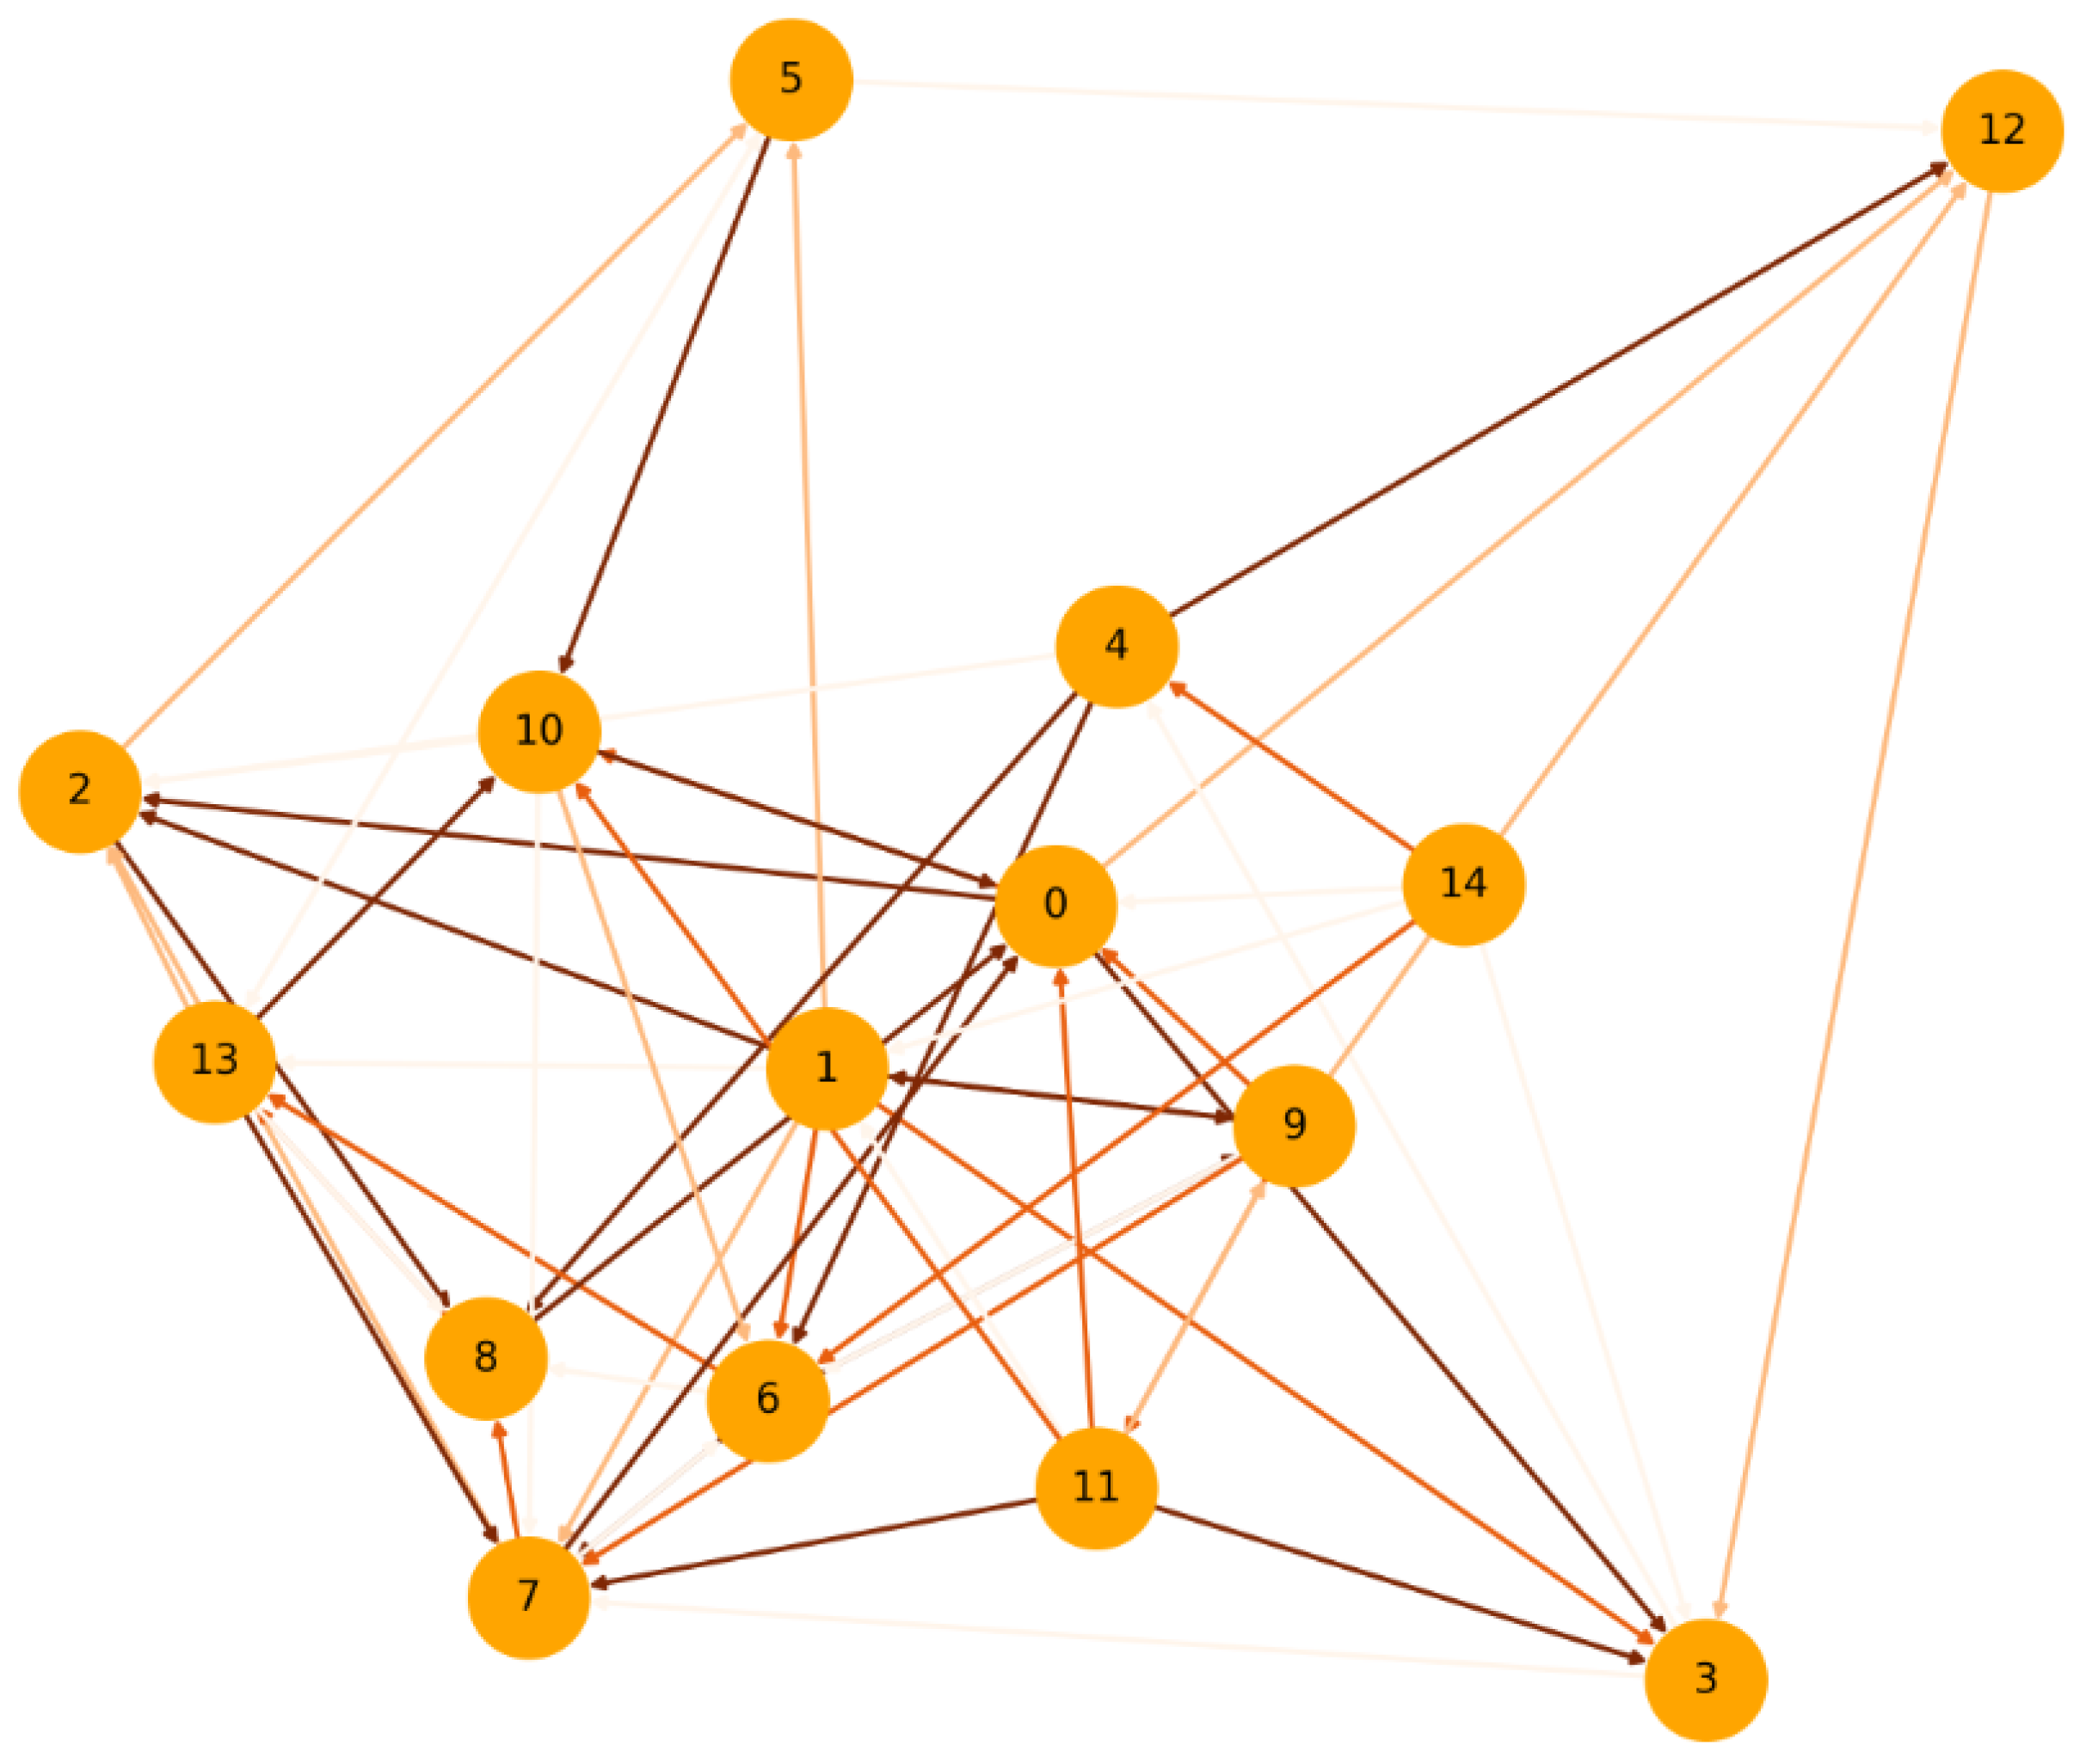
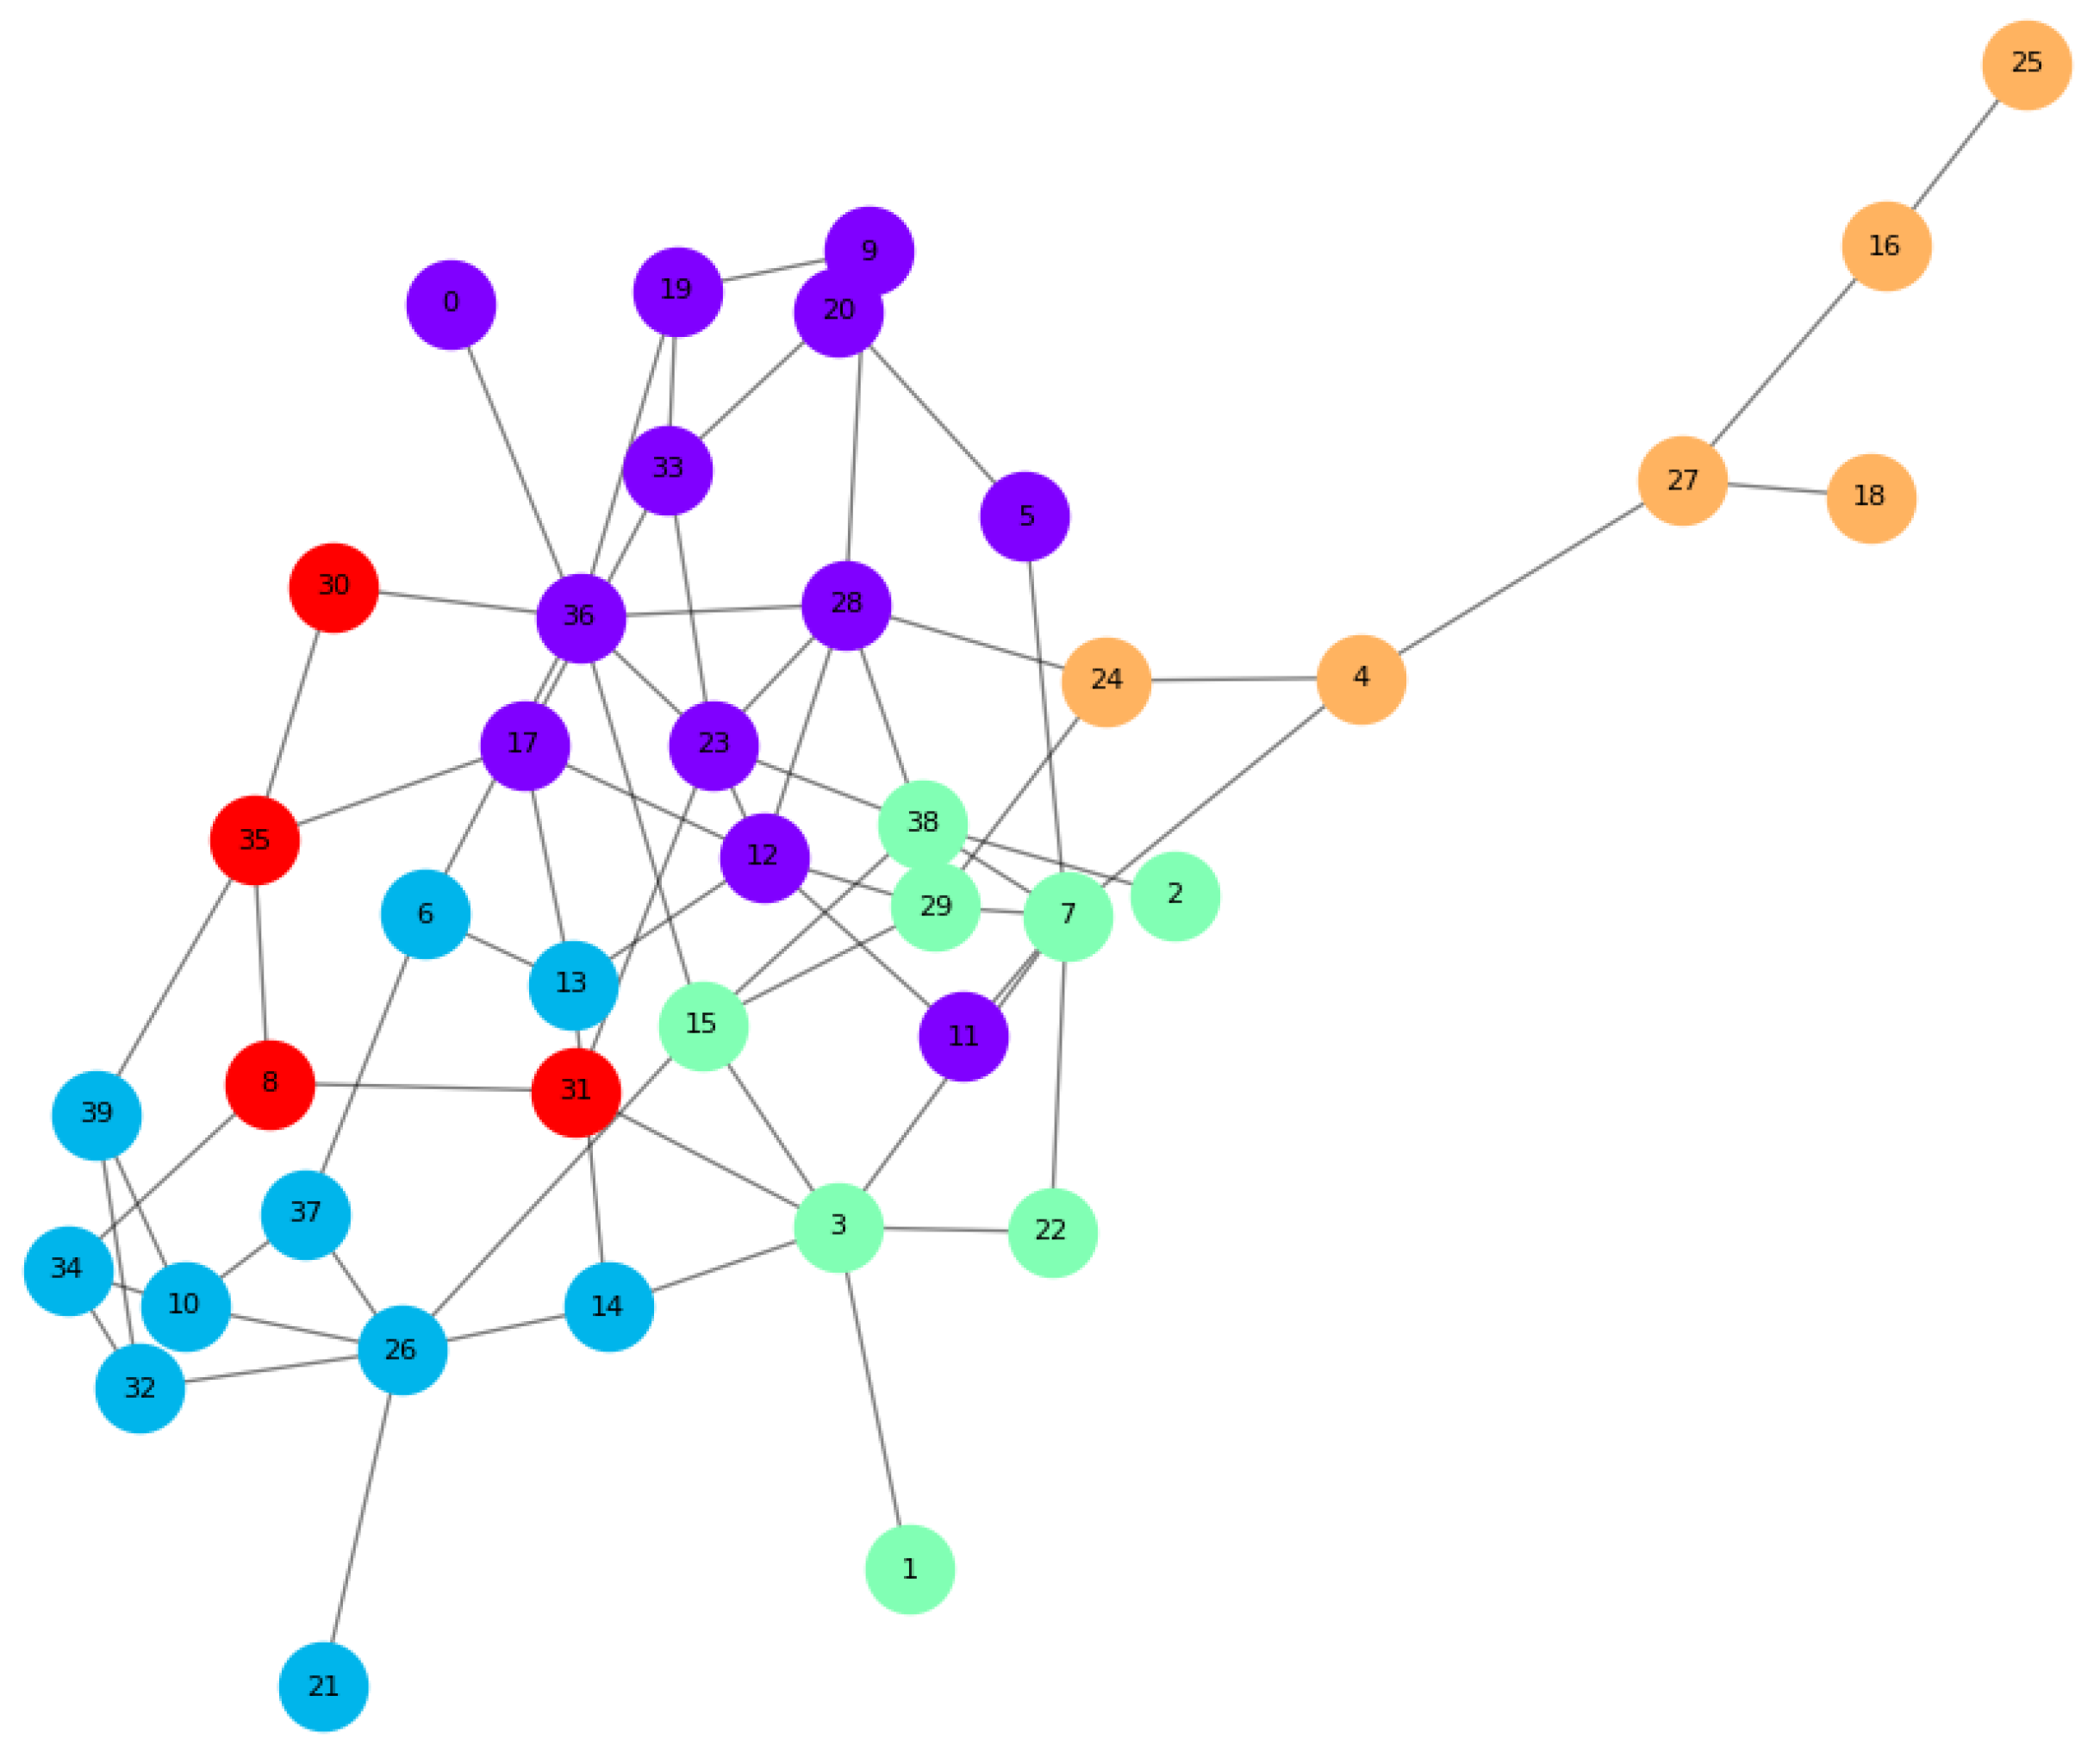
- Nodes with high betweenness centrality are critical articulation points or bridges in a blockchain network. Targeted removal of such nodes presents an effective topological attack vector to fragment the network.
- (a)
- Betweenness Centrality: The betweenness centrality of a node is defined as:Where is the total number of shortest paths from s to t, and is the number of those paths passing through node v.
- (b)
- Critical Node Identification:Nodes with higher values participate in more shortest paths in the network. The removal of such nodes leads to disconnecting components previously connected via them.
- (c)
- Network Robustness:Analyzing the distribution of betweenness centrality scores over time provides insight into the emergence of critical nodes and quantifies network resilience against topological attacks.
5.2.2. Threat Modelling
- Let us consider the following assumptions within our graph model:
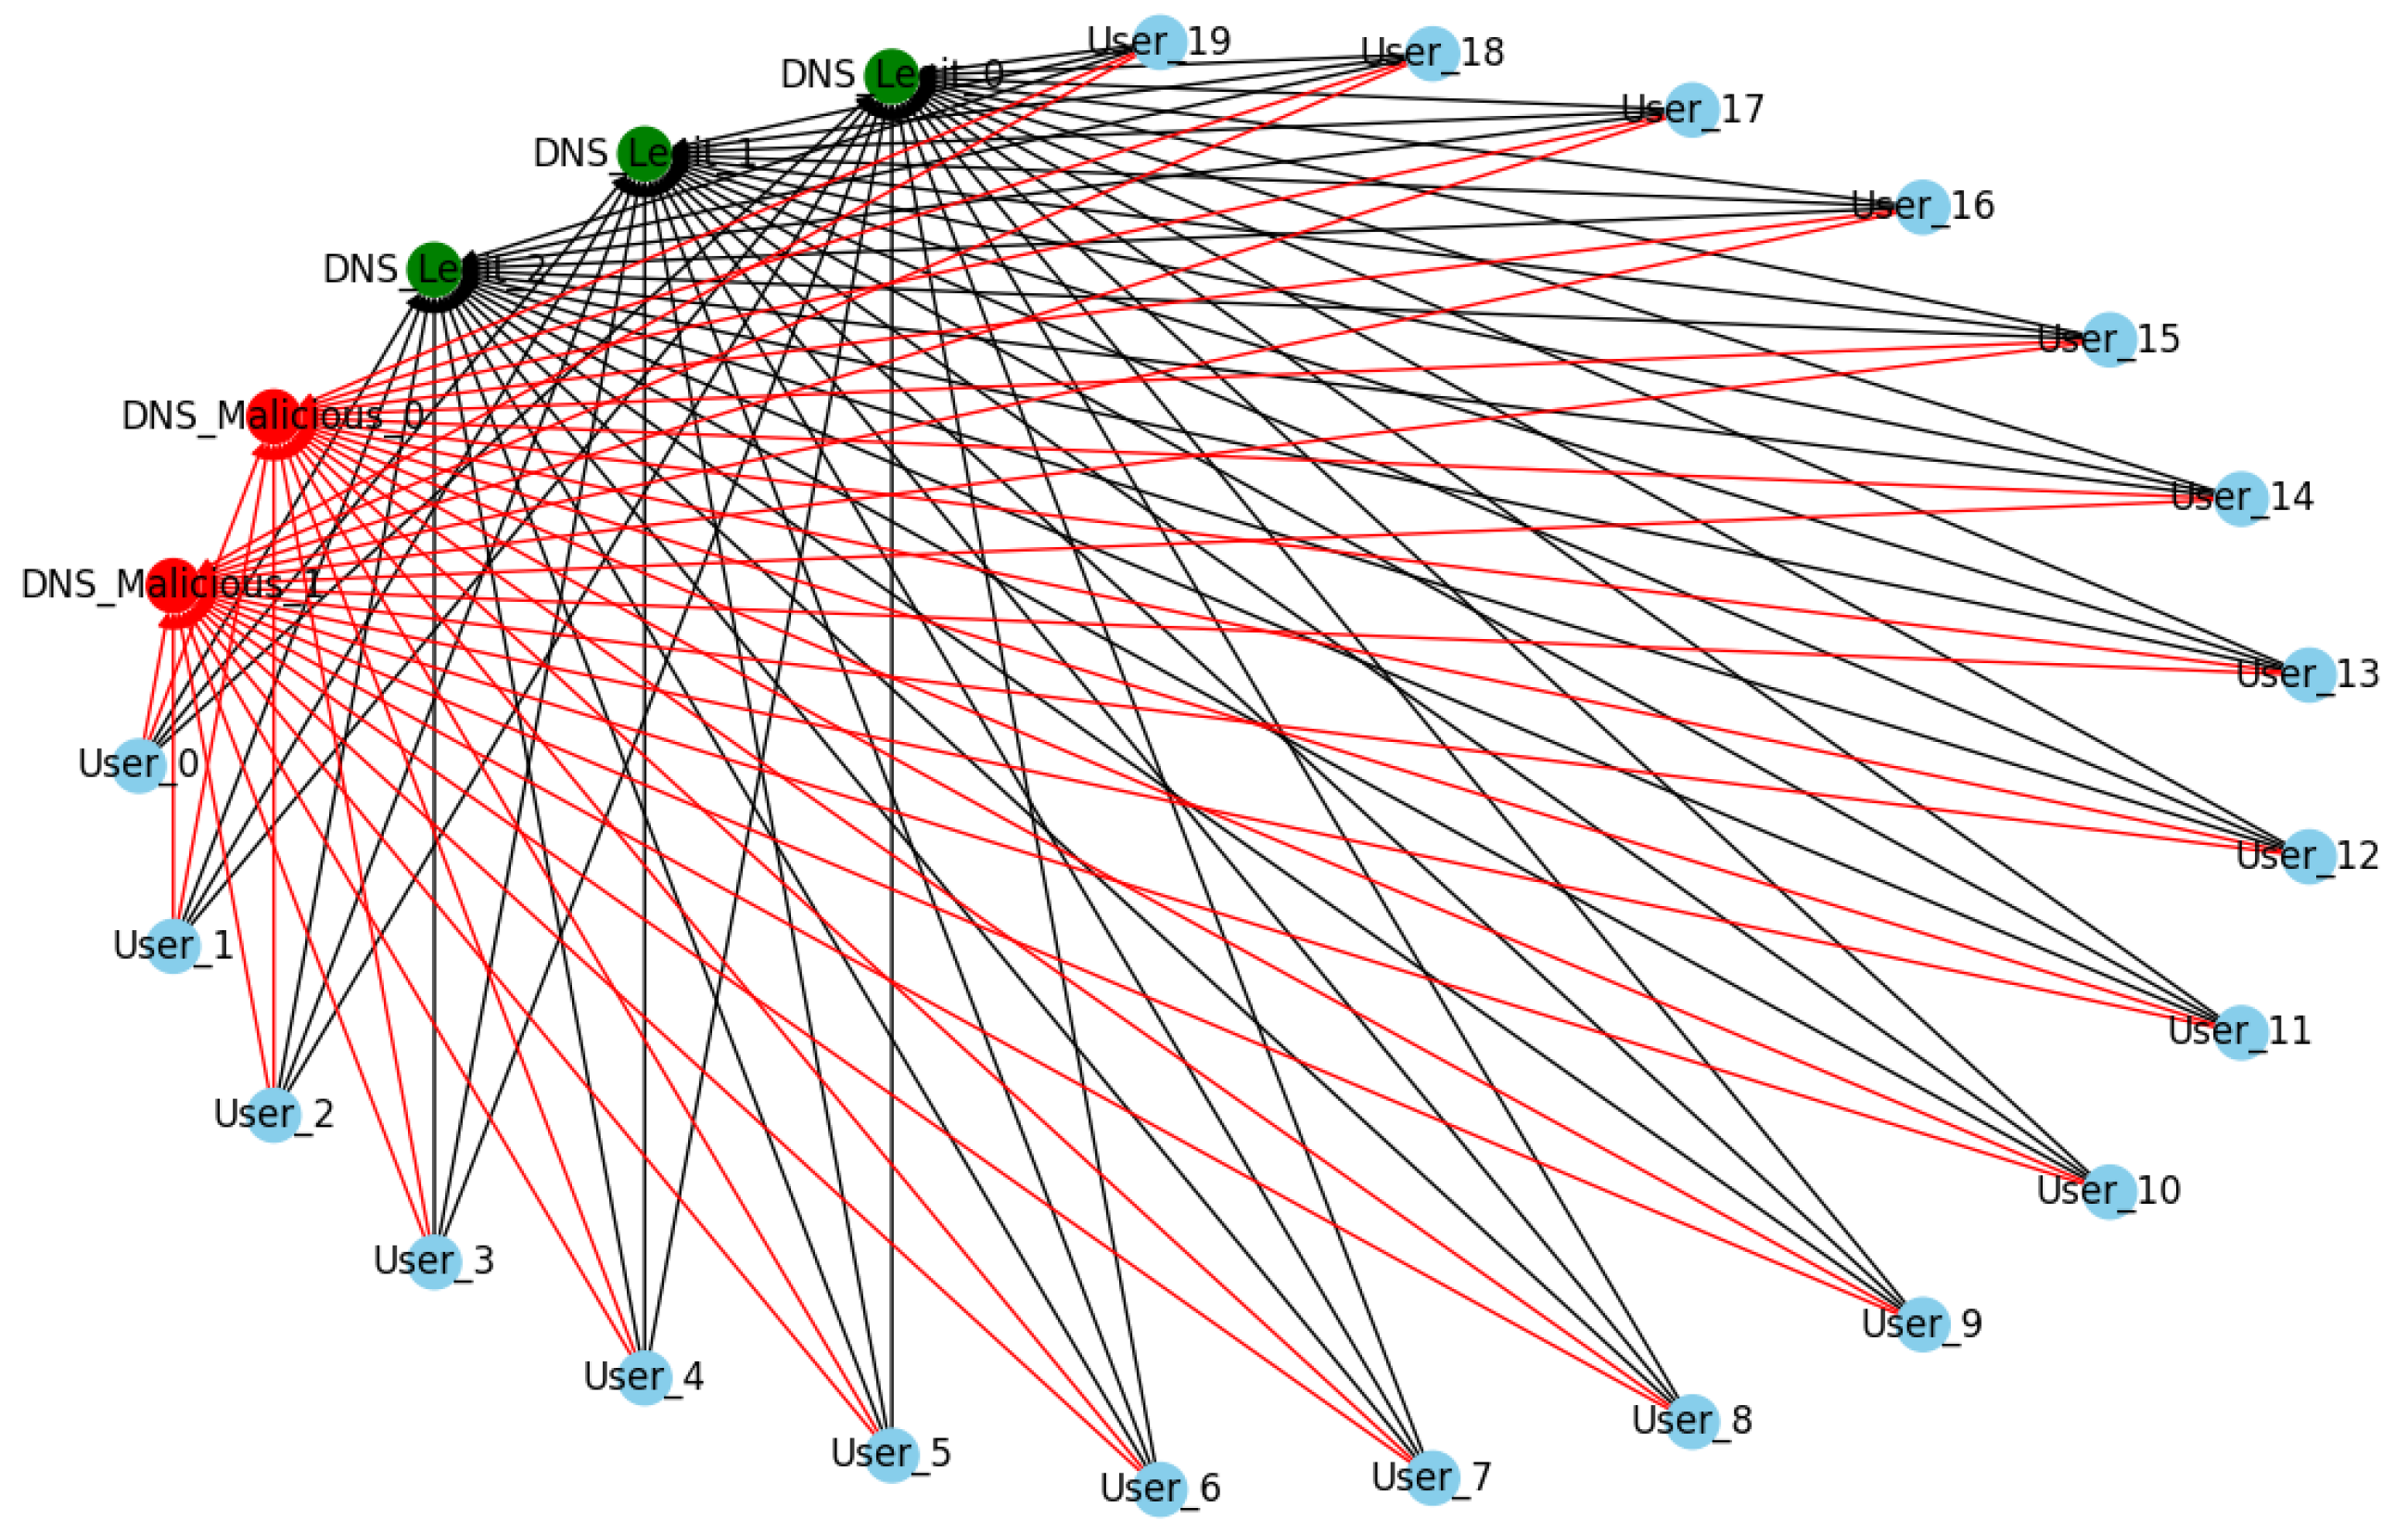
- A directed graph : A directed graph where V is the set of nodes representing users, miners, and DNS servers, and E represents the communication links between these nodes.
- Node Function : Each node is assigned a role indicating whether it is a user/miner (U) or a DNS server (D).
- DNS Integrity : Each DNS server node d has a status indicating whether it is legitimate (L) or compromised/malicious (M).
- For a blockchain network represented by graph G with assumptions as stated, DNS attacks can isolate a subset of nodes , such that U consists solely of users and miners from the genuine network by manipulating the resolutions provided by DNS servers.
- (a)
- Attack Initiation: An attacker manipulates a subset of DNS server nodes such that their status for all is changed from L to M.
- (b)
- Resolution Compromise: As users and miners initiate DNS queries, these requests are intercepted by . Thus, the set of edges from U now points to , and their integrity status for all changes from V to I.
- (c)
- Network Isolation: The DNS resolutions from redirect U to endpoints outside the genuine blockchain network resulting in an isolation set .
- (d)
- Isolation Quantification: The isolation metric is defined as the ratio of the number of isolated user/miner nodes to the total number of user/miner nodes, i.e., . If , it implies that the DNS attack was successful in isolating at least a portion of the network’s participants.
- Let us construct a graph to model the blockchain network where:
- −
- V: Set of nodes, representing users of the blockchain network.
- −
- E: Set of edges representing trust relationships or communication channels between users.
- Each node v has an associated trust level , representing the user’s vulnerability to phishing attacks, with a higher trust level indicating greater susceptibility.
- A phishing attack within a blockchain network graph G can result in private key theft if the attacker can successfully deceive a subset of nodes , where nodes in have a high trust level .
- (a)
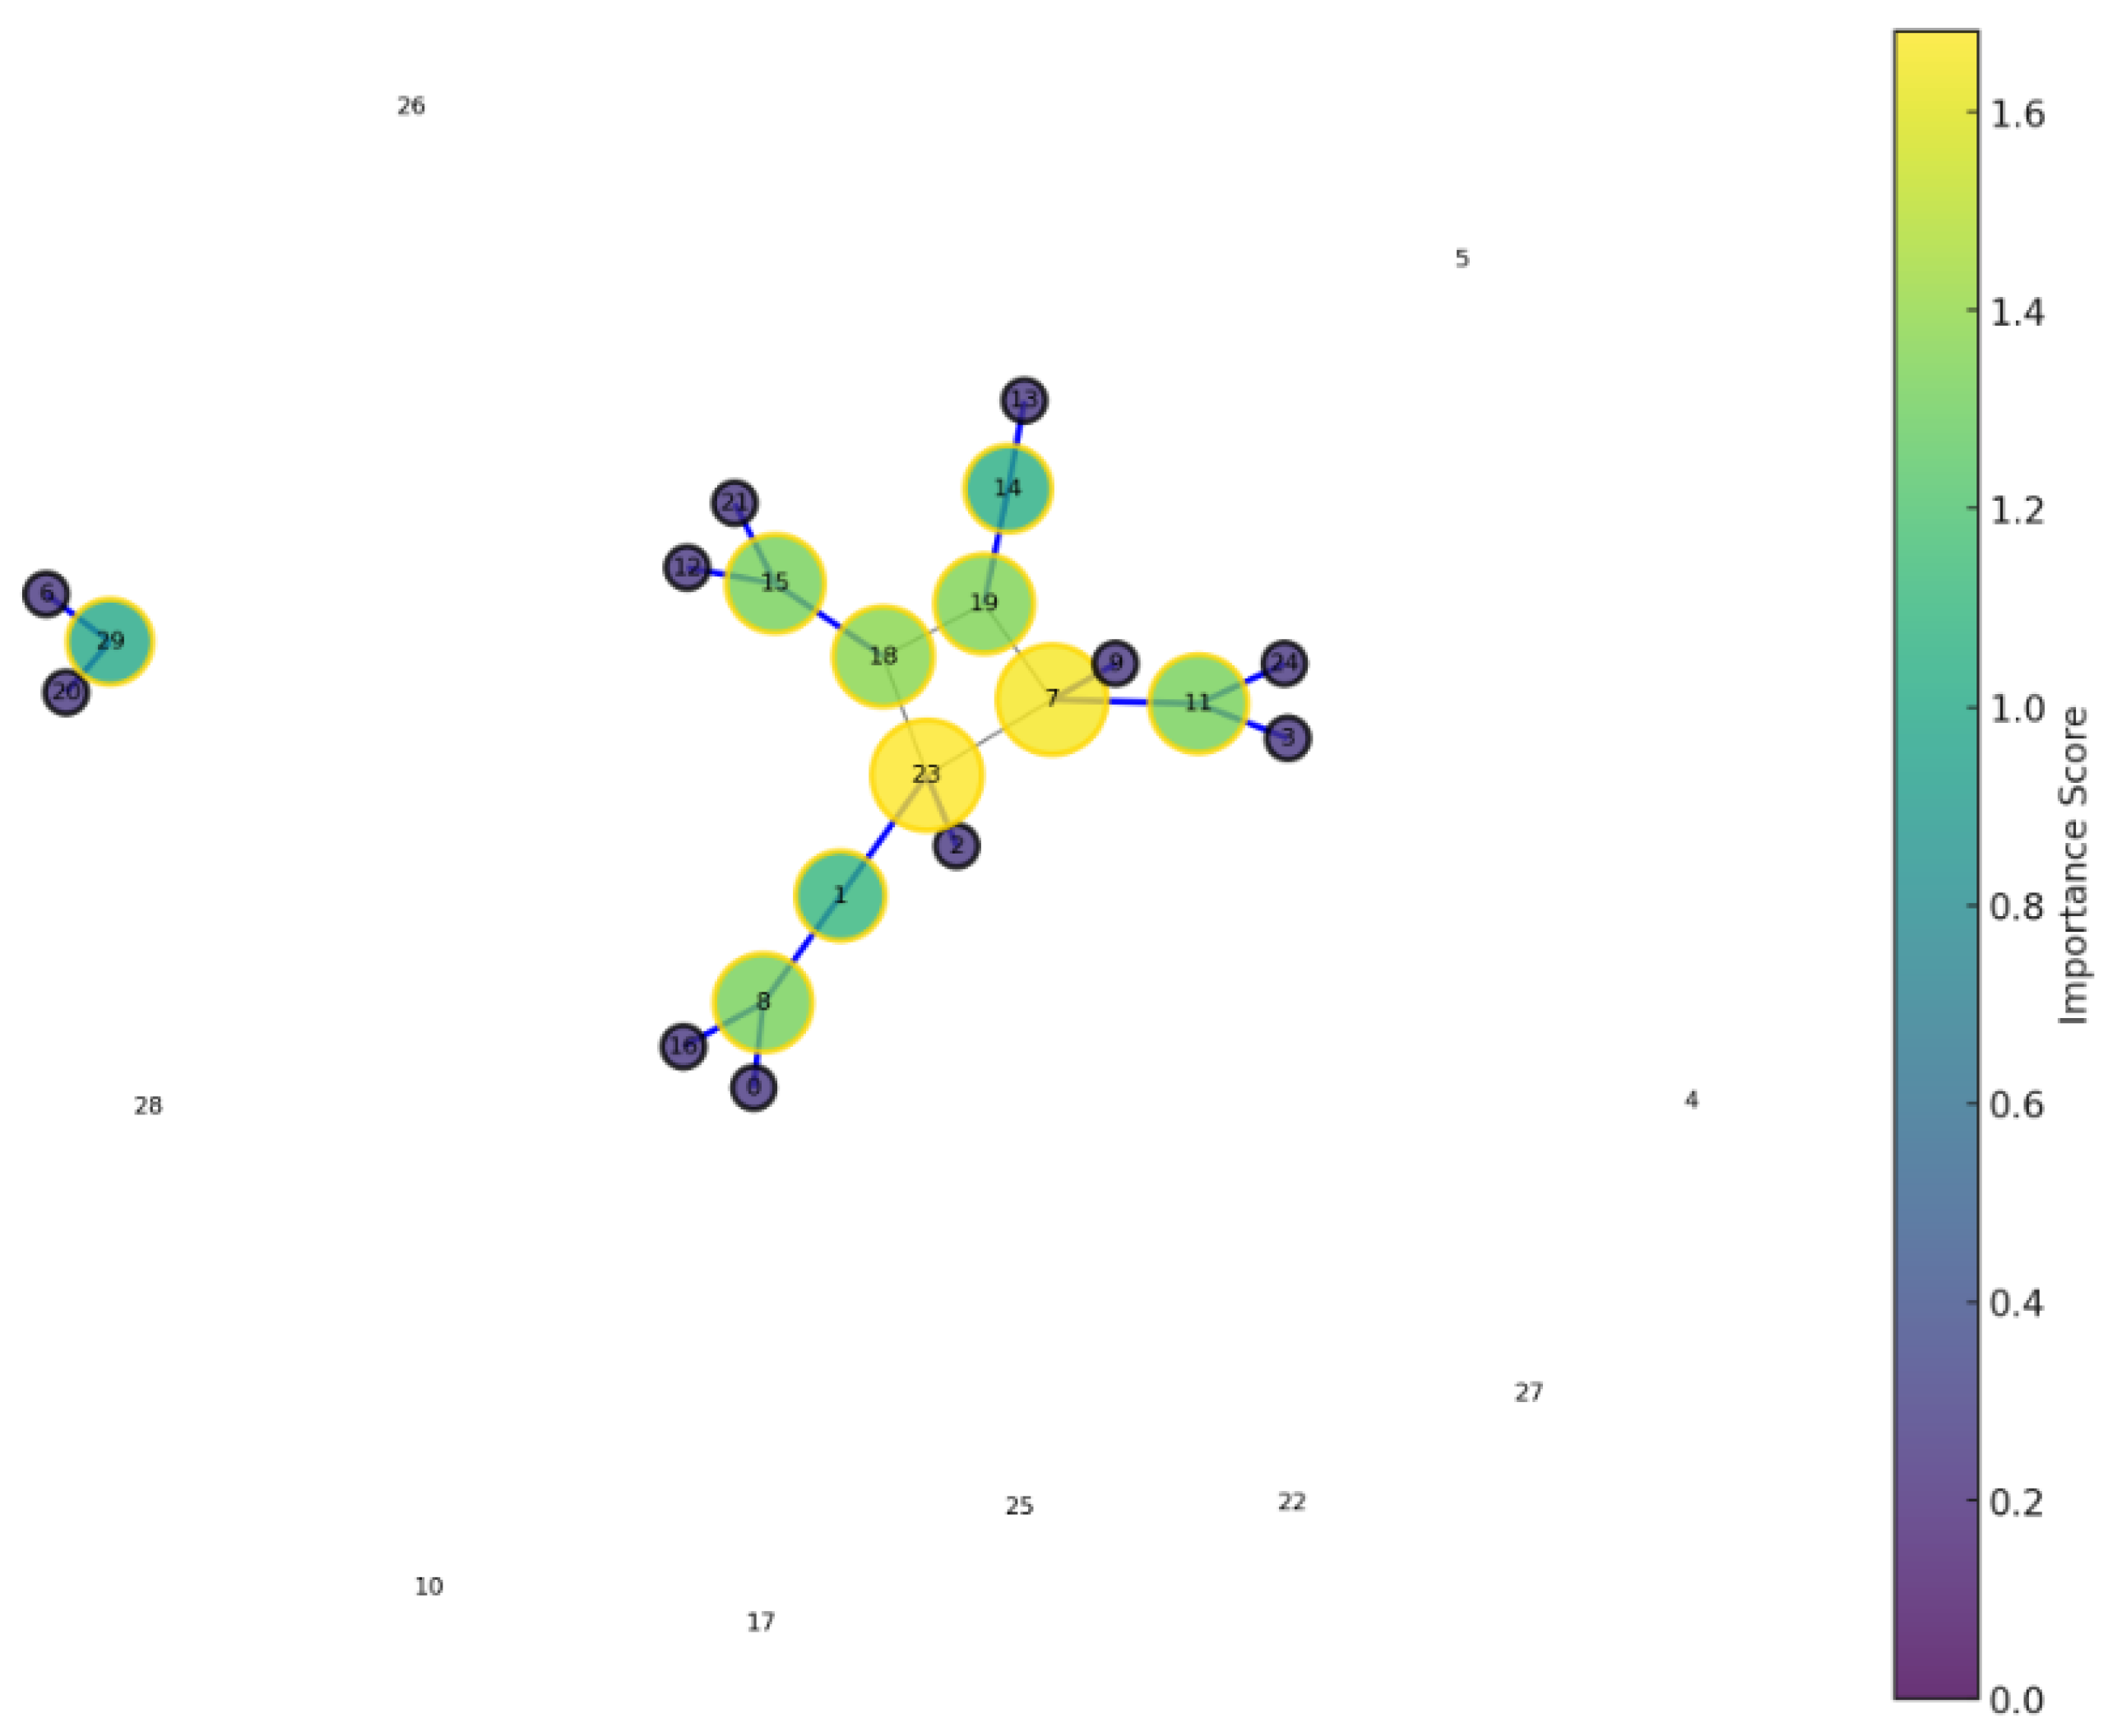
- Targeting High Trust Nodes: The attacker identifies nodes with high trust levels by analyzing the graph for nodes with the most edges, indicating a high interaction with other nodes, and therefore, higher visibility for phishing attacks.
- (b)
- Trust Exploitation: Through phishing techniques, the attacker attempts to compromise nodes in by exploiting their trust levels. Let be the threshold above which the nodes are highly susceptible. Then, .
- (c)
- Key Compromise: The attacker crafts deceptive messages that are sent across edges to nodes in . If a node is deceived, its private key is considered compromised, transitioning its status to .
- (d)
- Asset Theft: Using the compromised private keys, the attacker gains access to the nodes’ assets and can perform unauthorized transactions, leading to theft.
- Key Status : Indicates whether the private key of the node is compromised (C) or secure (S).
- Phishing Susceptibility : A probabilistic measure of the node’s vulnerability to phishing attacks, ranging from 0 (immune) to 1 (highly susceptible).
- Initial Compromise Set : The set of nodes initially targeted and successfully compromised by the phishing attack.
- Propagation Function F: A function that models how the attack propagates through the network from the initial set of compromised nodes.
- Total Compromised Set : The set of nodes that are eventually compromised as a result of both the initial attack and subsequent propagation. is derived by applying F to and the network G.
- Network Vulnerability Index (NVI): A metric to quantify the overall impact of the phishing attack on the network. It is given by:
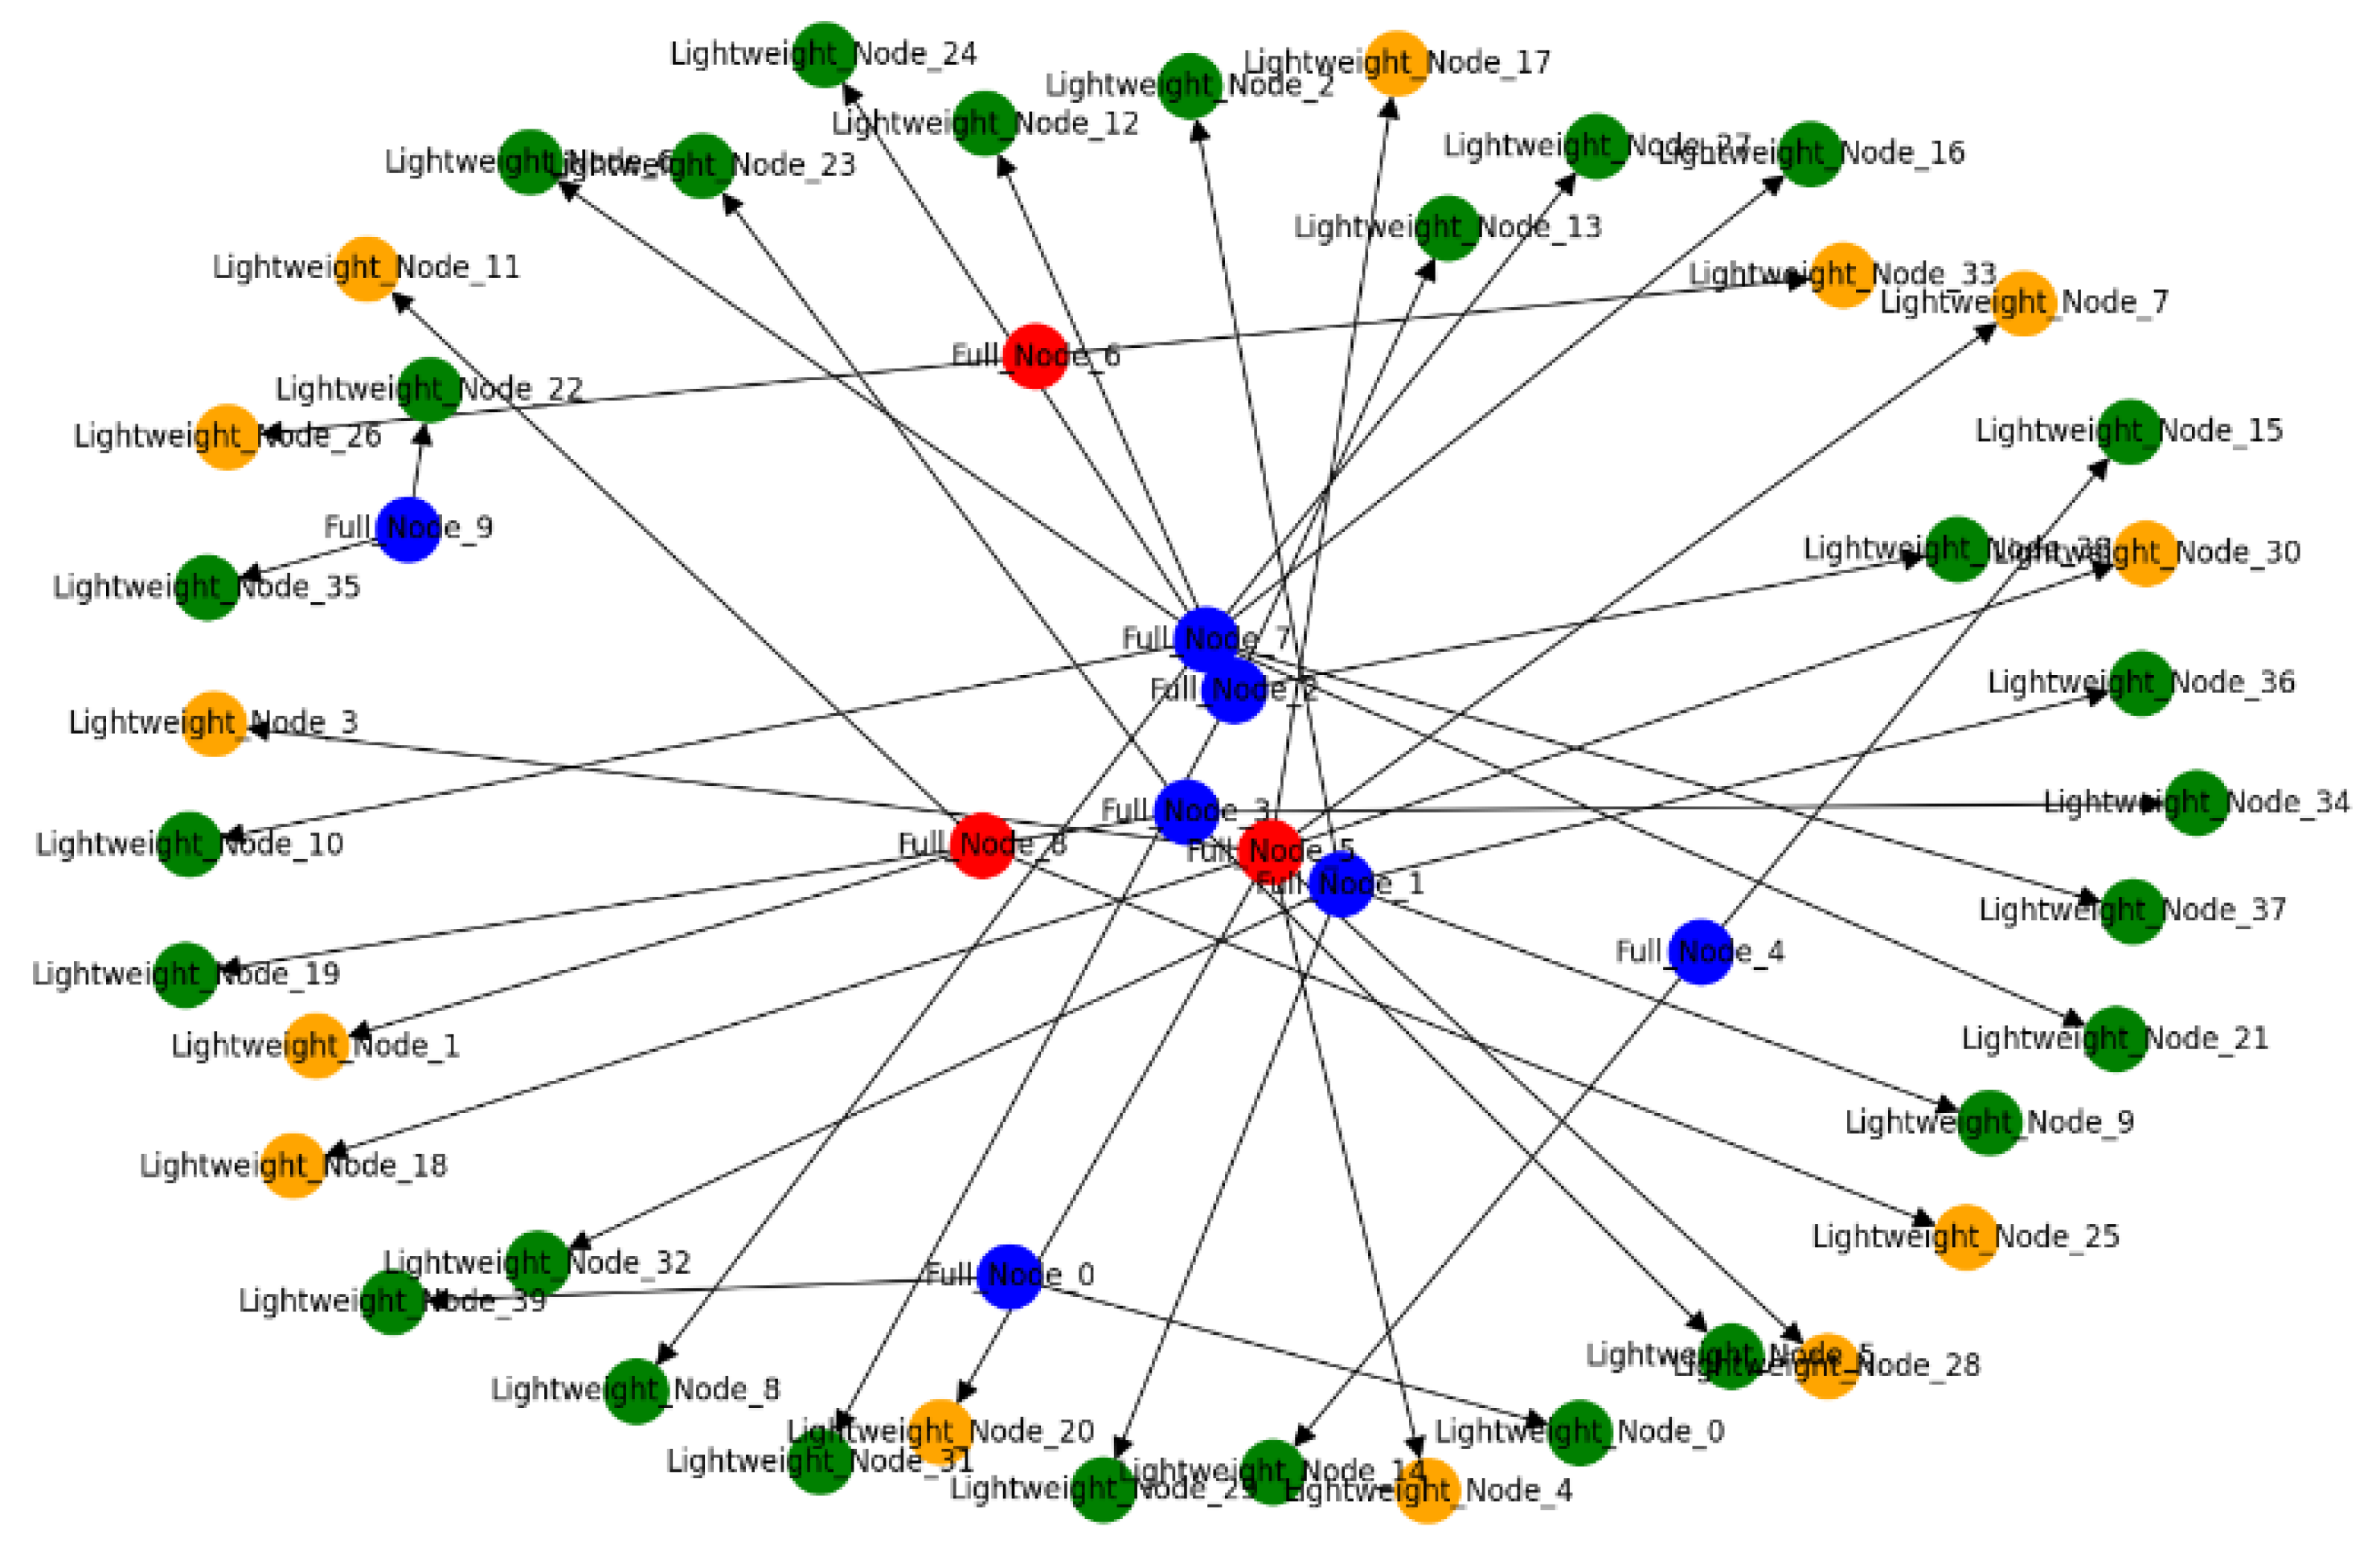
- We assume a graph , where:
- −
- V: Set of nodes, partitioned into full nodes and lightweight nodes , such that and .
- −
- E: Set of directed edges representing communication links, with representing links between full nodes and representing links from full nodes to lightweight nodes.
- Node Status : Indicates whether a node is secure (S) or compromised (C).
- Routing Path : Ordered list of nodes a message traverses from u to v.
- In a blockchain network subject to BGP hijacks, if an attacker compromises a subset of full nodes , it can induce a spatial partitioning where the associated lightweight nodes , which rely on compromised full nodes, are also controlled by the attacker.
- (a)
- BGP Hijacking Initiation: Attacker gains control of one or more full nodes by diverting their incoming and outgoing routing paths. For all , changes from S to C.
- (b)
- Routing Path Alteration: The routing paths for and are altered to pass through , if not already. For all , if , then is in .
- (c)
- Spatial Partitioning Effect: The network experiences spatial partitioning where only receives blockchain data from . The integrity of the data received by is compromised, and the attacker can control the blockchain view of .
- (d)
- Control over Lightweight Nodes: The attacker manipulates blockchain data flowing to , effectively controlling these nodes.
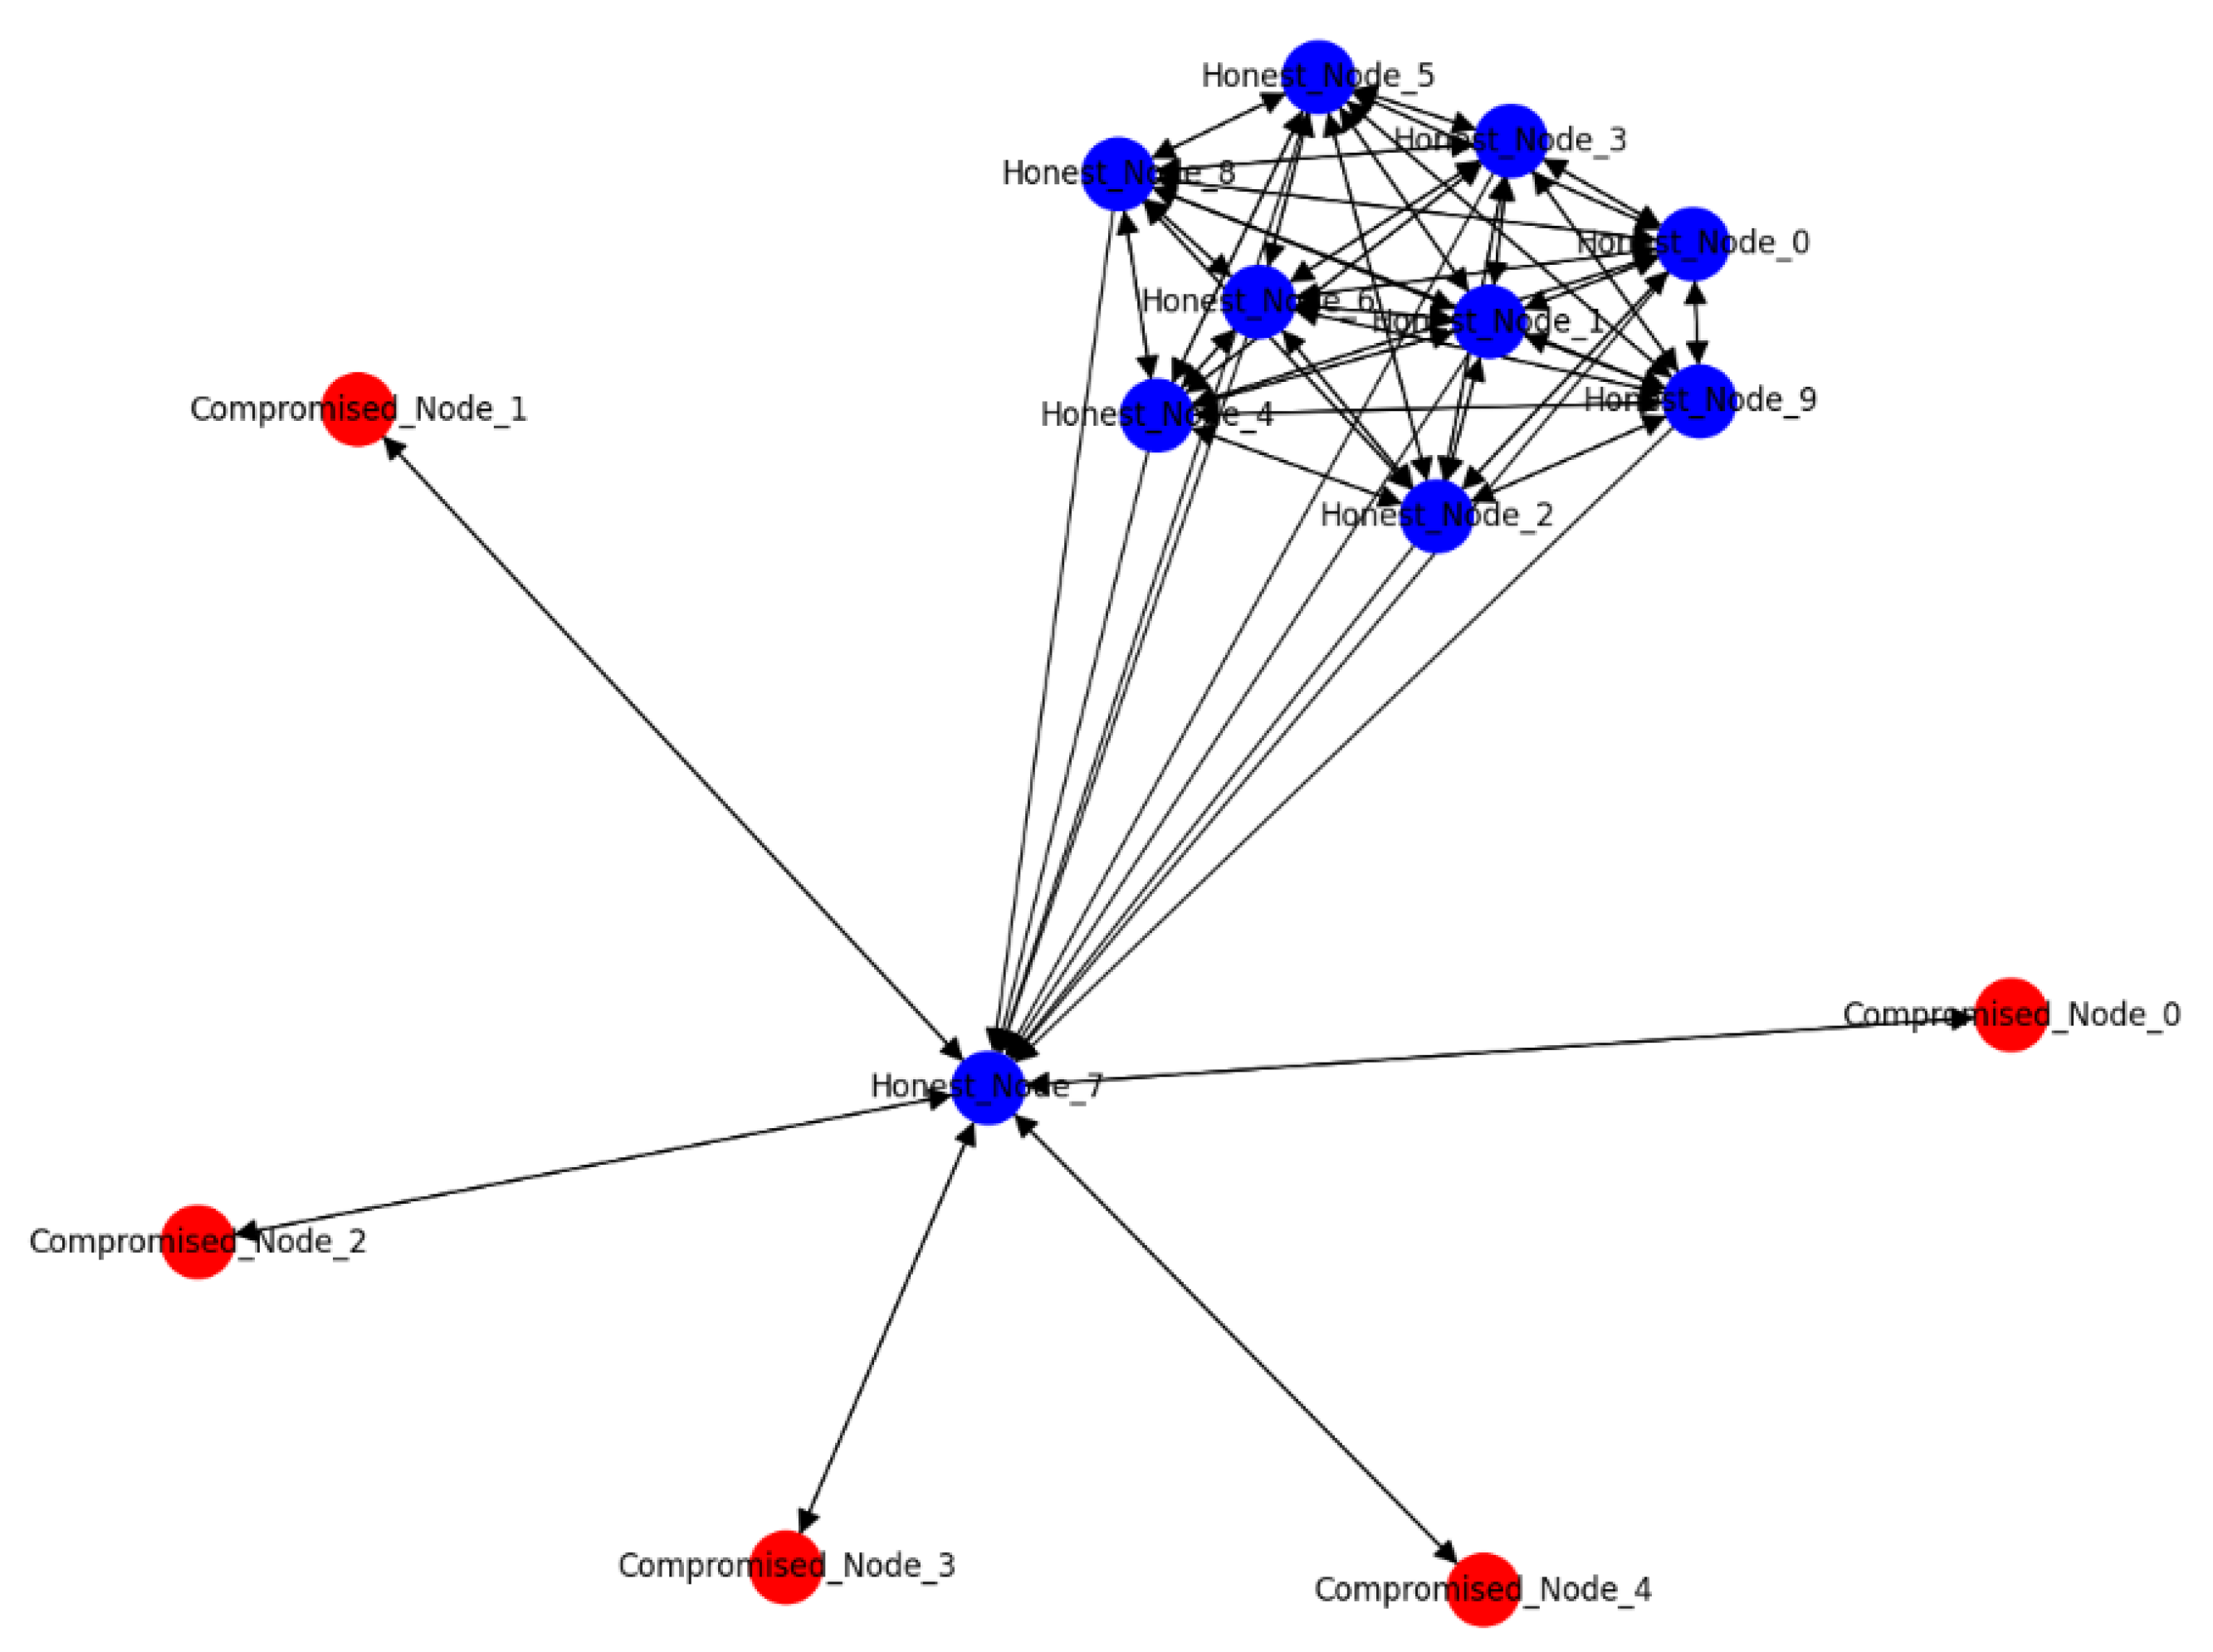
- Let us consider a graph where:
- −
- V: Set of nodes, representing the blockchain participants.
- −
- E: Set of directed edges representing network connections between nodes.
We further categorize the nodes as:- −
- : Set of honest nodes.
- −
- : Set of compromised nodes controlled by the attacker.
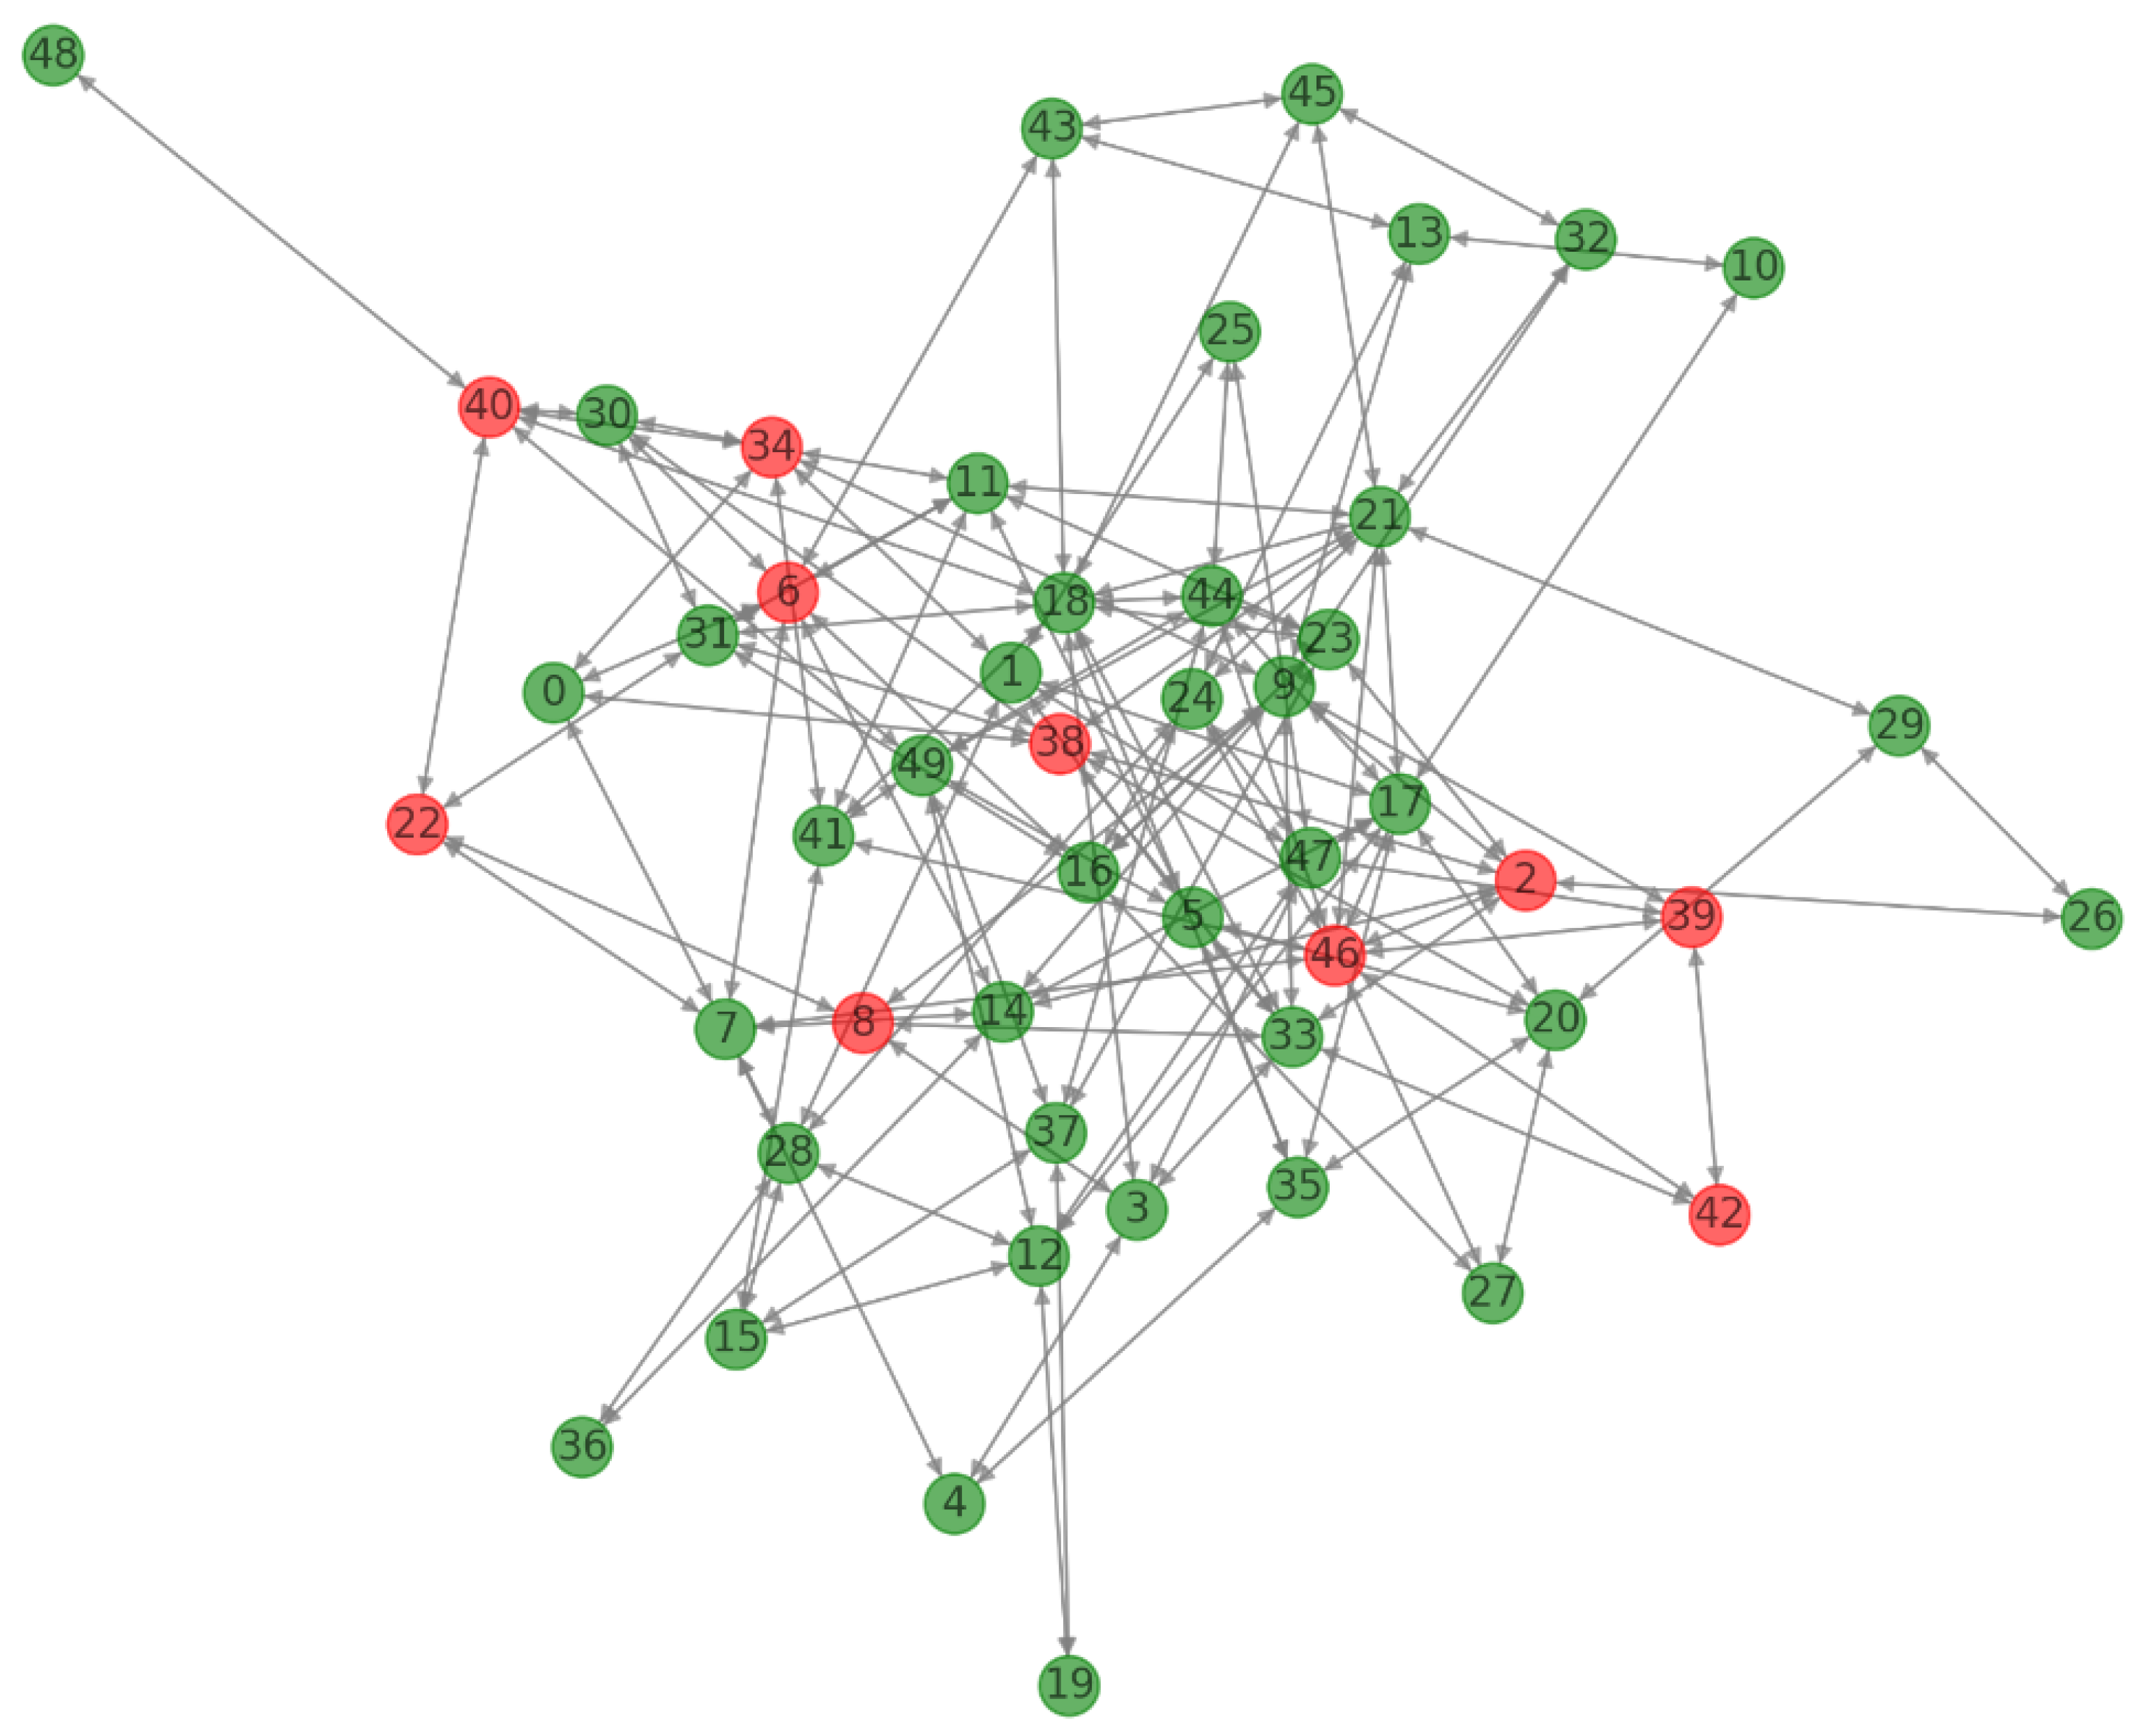
- For a blockchain network represented by graph G, an attacker can successfully conduct an Eclipse attack on a subset of honest nodes by ensuring all connections to and from are with nodes in , thus controlling the flow of information to the isolated nodes.
- (a)
- Isolation of Honest Nodes: The attacker infiltrates the network, adding or compromising nodes to become part of . The attacker then uses these nodes to form all direct connections with the target honest node .
- (b)
- Manipulation of Network Traffic: For each edge where and , the attacker redirects e such that , effectively controlling the communication channels.
- (c)
- Impact of Isolation: The information received by any is now fully controlled by , leading to a scenario where h is eclipsed from the genuine blockchain network. This prevents h from receiving valid transactions and blocks, effectively isolating it from the true state of the blockchain.
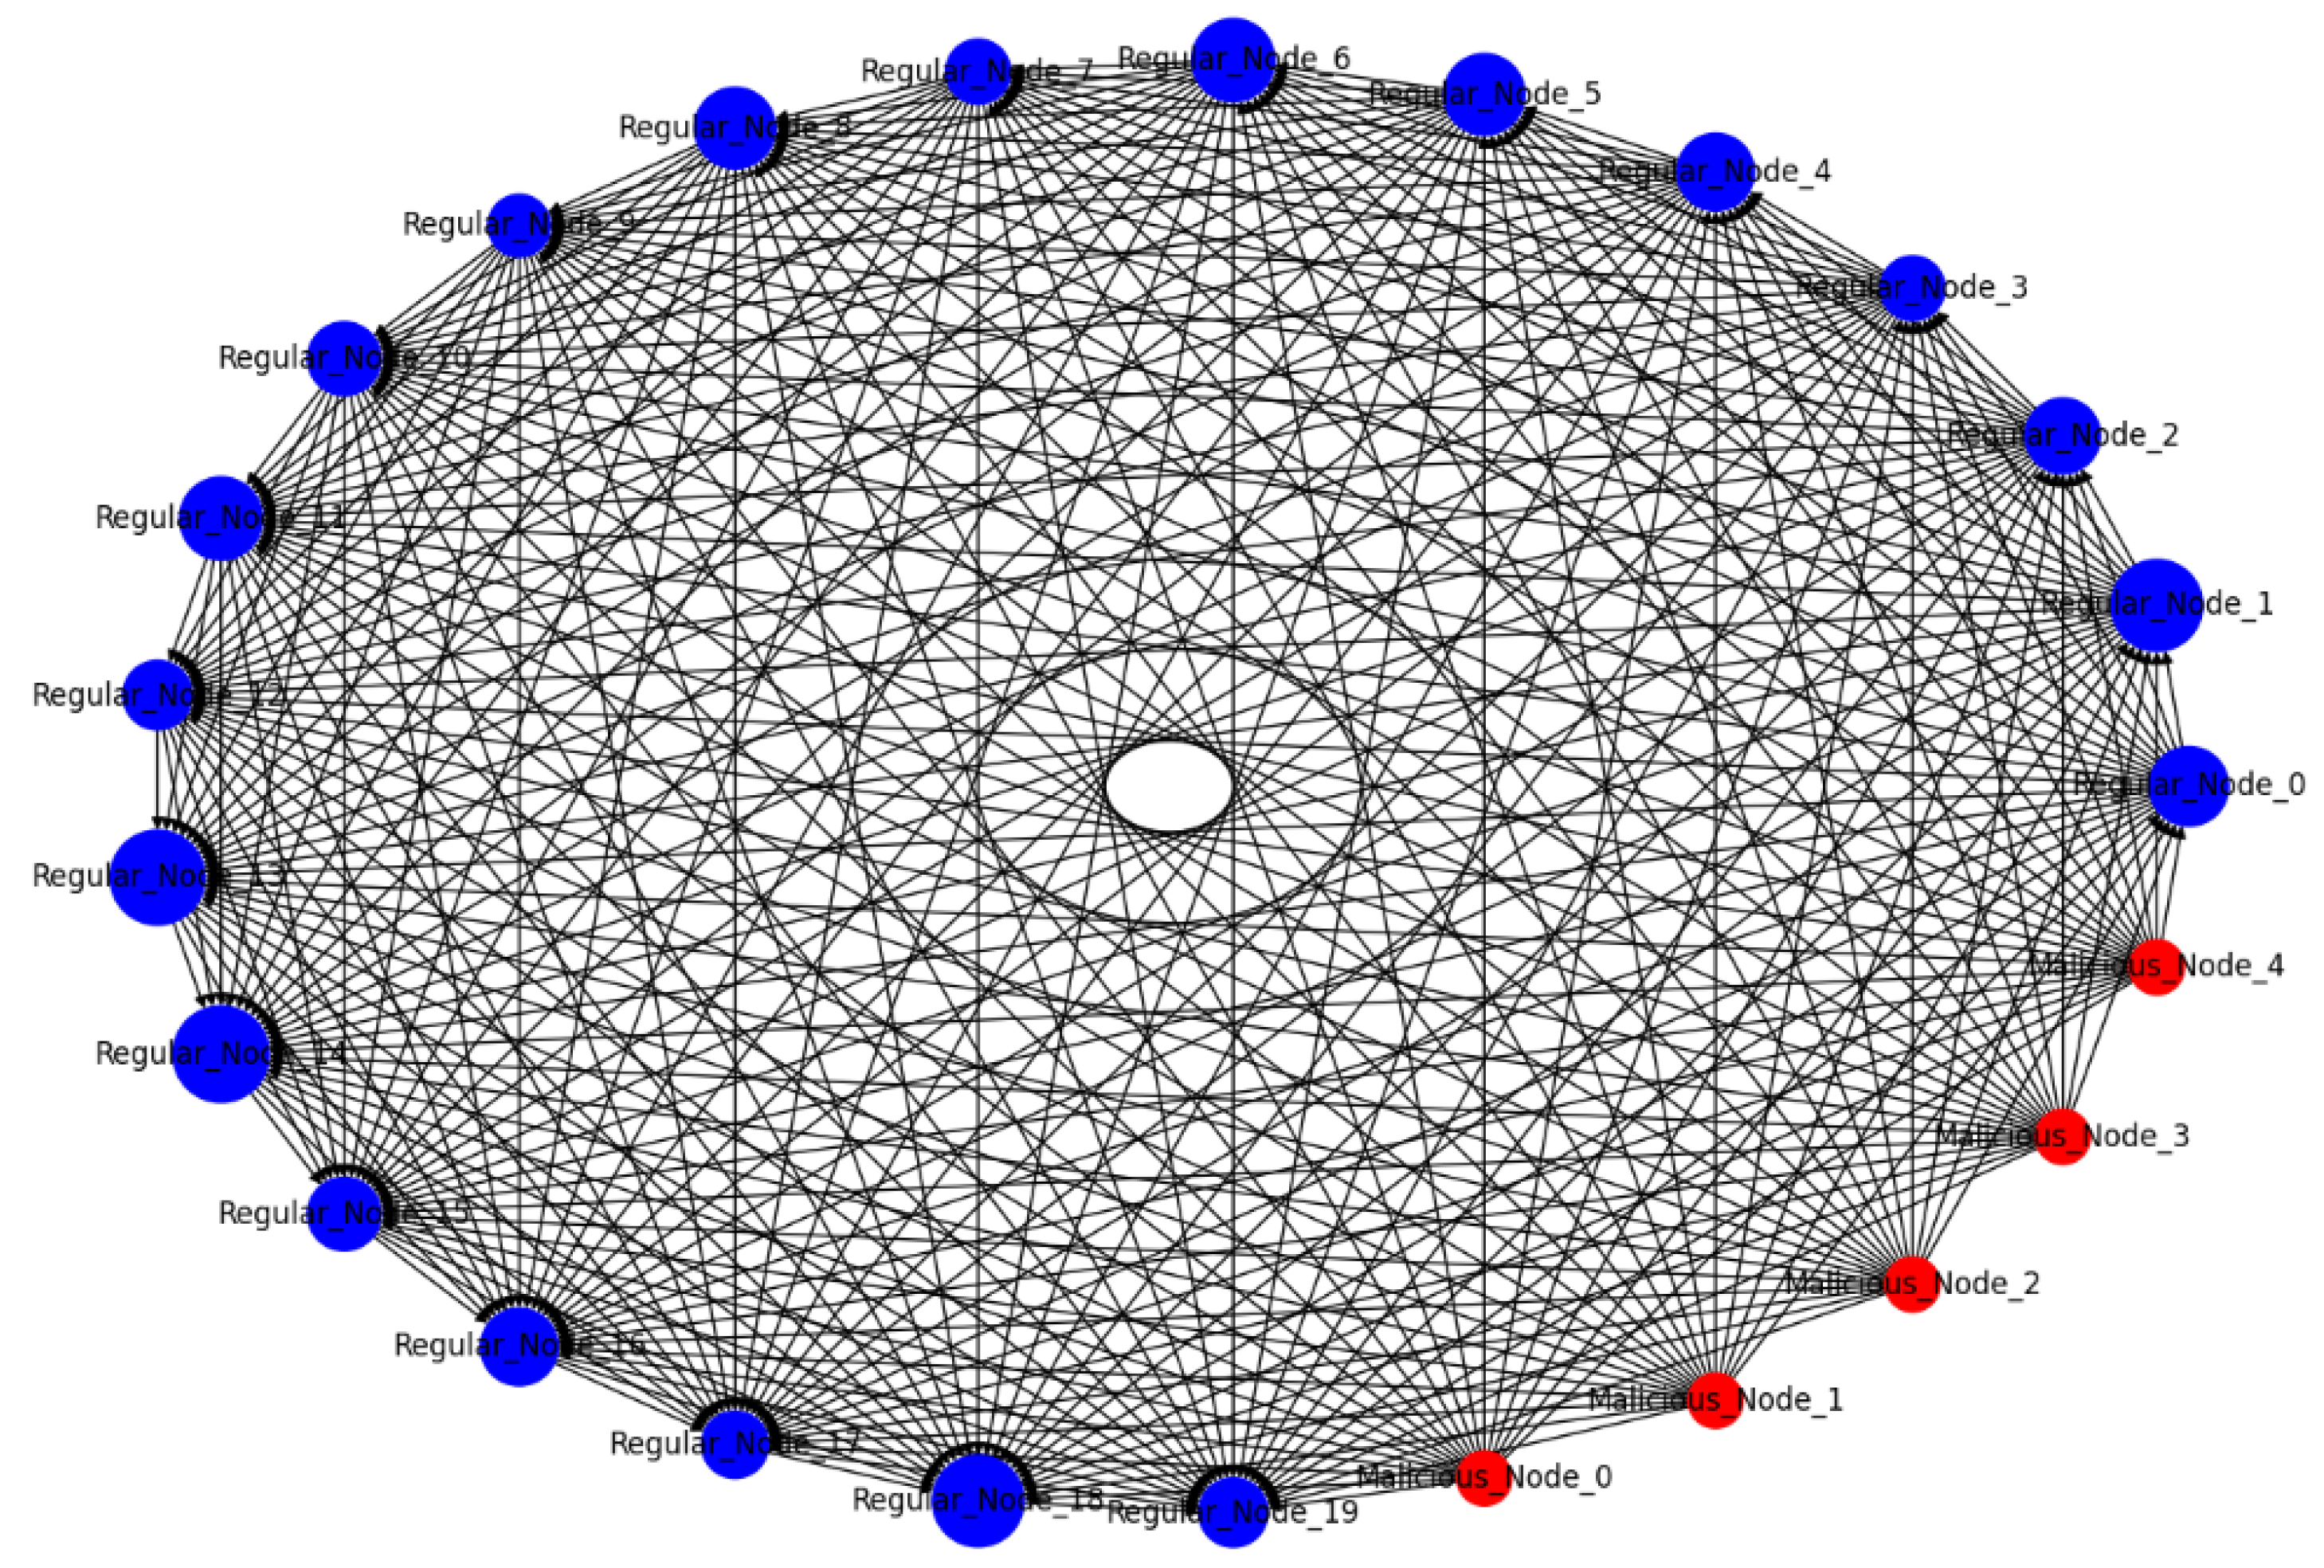
- We model the blockchain network as a graph where:
- −
- V: Set of nodes in the blockchain network, where each node v represents a participant (e.g., user, miner, full node).
- −
- E: Set of edges representing connections or potential transaction paths between nodes.
- Each node v has a capacity representing the maximum number of transactions it can process per time unit. A DDoS attack is modeled by increasing the demand on the node’s resources to exceed .
- For a blockchain network represented by graph G, a successful DDoS attack is achieved by creating a demand on nodes such that for a significant subset , leading to service failure for those nodes.
- (a)
- Attack Initialization: The attacker distributes a set of malicious nodes or botnets within the network that initiate the attack.
- (b)
- Overwhelming Network Resources: Each malicious node generates a number of transactions directed at nodes in V, such that .
- (c)
- Exploiting Network Control: If combined with a 51% attack, the attacker can prioritize malicious transactions or invalidate legitimate ones, increasing the network’s congestion. The attacker can create intentional forks by generating blocks at a rate that overwhelms the network’s ability to reach consensus, further contributing to the denial of service.
- (d)
- Service Failure: A significant number of nodes are unable to process legitimate transactions, leading to service failure as defined by the inability of the network to perform its intended operations.
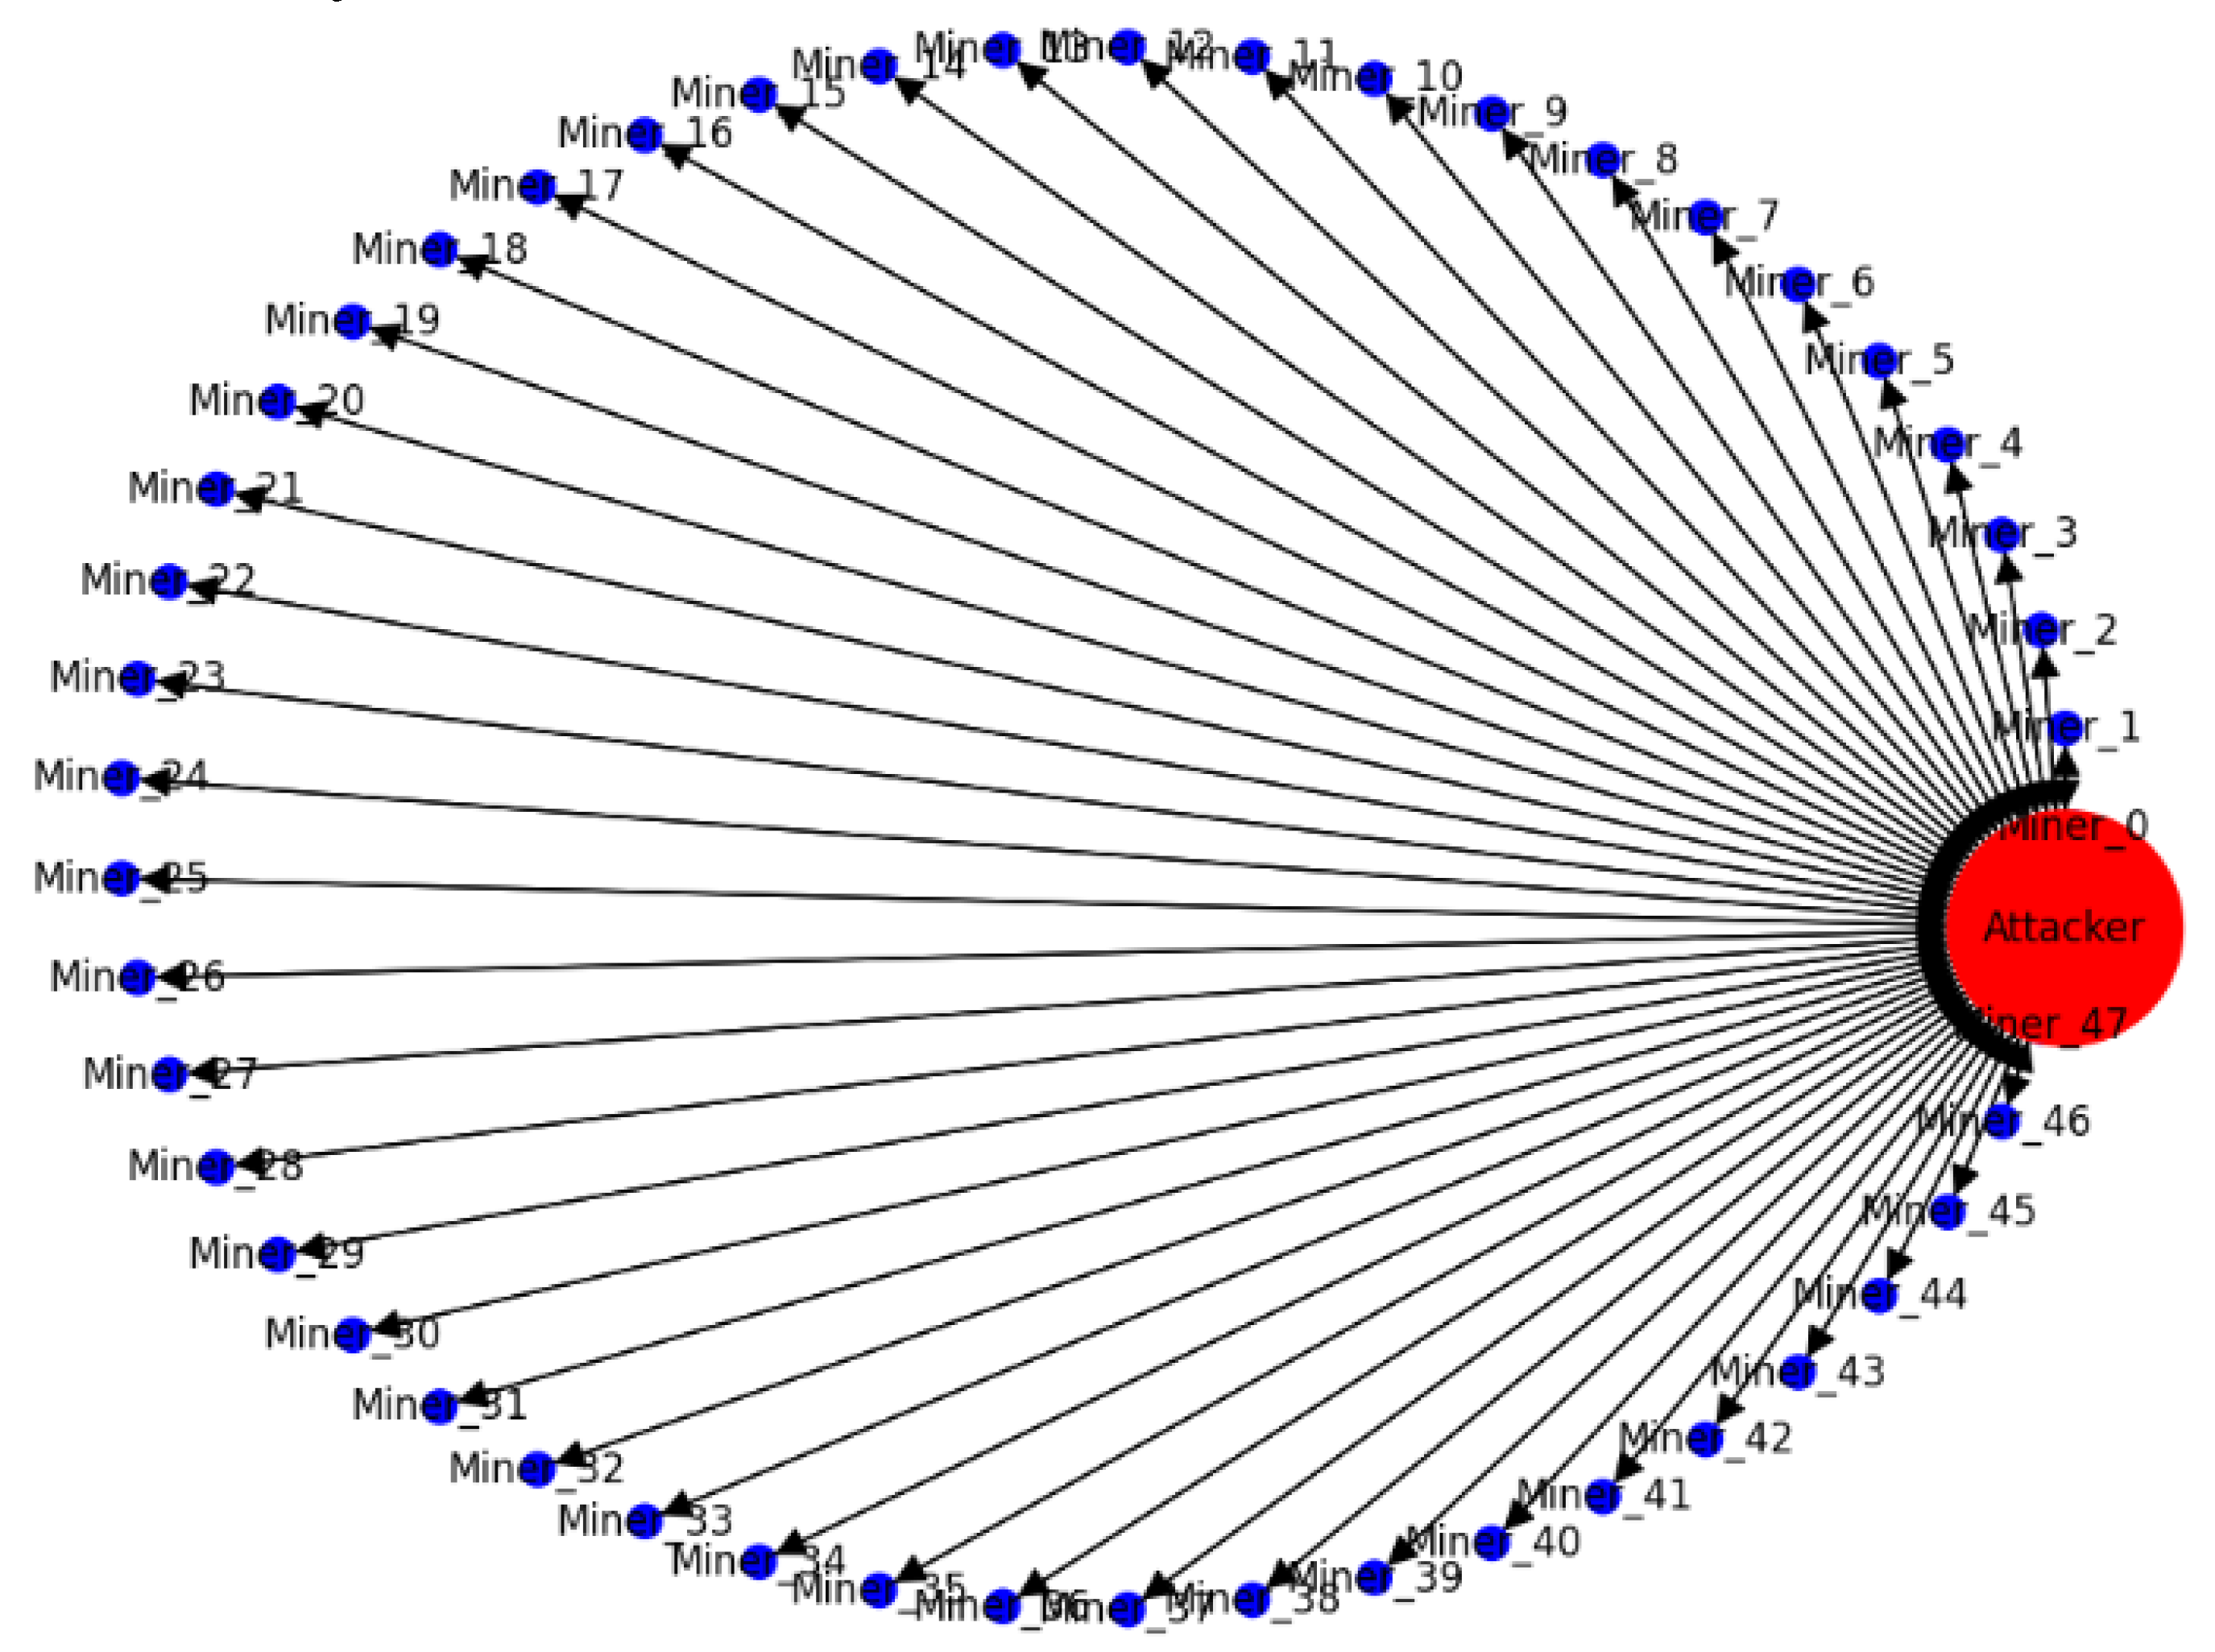
- Consider a blockchain network represented as a weighted directed graph where:
- −
- V: Set of nodes, where each node v represents a miner in the network.
- −
- E: Set of directed edges representing hash rate contributions from one node to another (in the case of pool mining).
- −
- : Weight of edge e, representing the hash rate directed from one node to another.
- In a blockchain network graph G, an entity controlling a set of nodes , such that the sum of outbound hash rate weights from surpasses 50% of the total network’s hash rate, can perform a 51% attack.
- (a)
- Let be the total network hash rate, computed as the sum of weights of all outbound edges in G:
- (b)
- An attacker controls a subset of nodes . Let be the hash rate controlled by the attacker, calculated as:
- (c)
- For the attacker to perform a 51% attack, must be greater than half of :
- Prevent transaction confirmations: By choosing not to include them in the blocks they mine.
- Halt payments: By ignoring blocks containing certain transactions, preventing them from being confirmed.
- Double-spend coins: by creating a private fork of the blockchain and then releasing it to replace the previously agreed-upon blocks.
5.2.3. Deanonymization
- The blockchain transaction network is a graph with wallets as nodes and transactions as edges .
- User identities are anonymized behind wallet addresses.
- Transactions have attributes like timestamps, and coin values transferred.
- Clustering algorithms applied on user transaction subgraphs can reveal common spending patterns that fingerprint user identities in blockchain networks.
- (a)
- Construct transaction subgraphs induced by each user k’s wallets .
- (b)
- Apply graph clustering methods (e.g., K-means) on based on transaction attributes and temporal patterns to separate coin mixes.
- (c)
- Use resulting clusters as features to train classifier model identifying user k.
- (d)
- Apply to full transaction graph G to predict the presence of user k’s payments.
5.2.4. Tracking Ransom Payments
- The blockchain transaction network is a temporal graph with wallet addresses as nodes , transactions as edges , and timestamps on edges.
- Ransomware groups mix coins across multiple wallets to hide payment trails.
- Correlating transaction timing, value flow patterns and connectivity trails between groups of addresses on temporal transaction graphs can reveal identifiable ransomware payment flows.
- (a)
- Apply the Modularity Optimization algorithm for community detection on transaction graph G to cluster related wallets A into campaigns.
- (b)
- Construct subgraphs induced by each ransomware wallet group .
- (c)
- Apply network flow modeling and tracking on based on transaction amounts, timings and unmixing of trails between clusters to trace laundered payments.
5.3. Managing Scalability
5.3.1. Bench Marking Delays
- The blockchain network is modeled as a transaction graph with average edge weight representing delays.
- Shortest path lengths characterize best-case timings.
- Tracking growth trends in shortest path lengths and diameter of the baseline transaction graph during network attacks or congestion quantifies lower bounds on performance degradation.
- (a)
- Measure average shortest path , diameter D and average degree on G.
- (b)
- Under attacks/congestion, adjust G by increasing edge weights to .
- (c)
- Re-compute shortest paths and diameter on updated G.
- (d)
- Benchmark slowdown as (Also compare and ).
5.3.2. Identifying Bottlenecks
- The blockchain network is modeled as a transaction graph with edges having capacities .
- Transaction throughput is limited by congested edges.
- Edges with high betweenness centrality in the blockchain transaction graph correspond to network bottlenecks limiting throughput. Offloading transactions along these edges to payment channels can improve capacity.
- (a)
- Compute edge betweenness centrality in graph G.
- (b)
- Edges with the highest participate in the largest number of shortest paths.
- (c)
- Congestion manifests as transaction backlogs along these top betweenness edges, reducing throughput.
- (d)
- Off-chain payment channels ease congestion along top bottleneck edges, improving network capacity.
5.3.3. Sharding Blockchains
- is a connected, undirected graph.
- is the set of clusters identified within G, where each is a subset of V, representing a shard.
- Partitioning G into k shards such that transactions within each shard are processed more quickly and efficiently, thereby enhancing the overall capacity and speed of the blockchain network.
- (a)
- Cluster Identification: Apply a graph clustering algorithm, such as modularity optimization, to partition G into k clusters. The modularity Q of a partition is given by:where m is the total number of edges, is the adjacency matrix of G, and are the degrees of nodes i and j, and is the Kronecker delta function, indicating if nodes i and j are in the same cluster. The goal is to maximize Q, which indicates a strong community structure with dense intra-cluster and sparse inter-cluster connections.
- (b)
- Shard Assignment: Each node is assigned to a shard based on its cluster membership determined in step 1. Formally, if , then v belongs to shard i.
- (c)
- Transaction Routing: Intra-shard transactions (those occurring between nodes within the same cluster) are routed internally within . This minimizes the path length and, by extension, the processing time for these transactions. Inter-shard transactions are minimized but when necessary, are processed through designated gateway nodes that facilitate communication between shards.
- (d)
- Throughput Enhancement: By confining the majority of transactions to densely connected clusters, each shard can independently process transactions in parallel, significantly increasing the network’s throughput. The reduction in inter-shard transactions decreases the overall network load, further contributing to speed improvements.
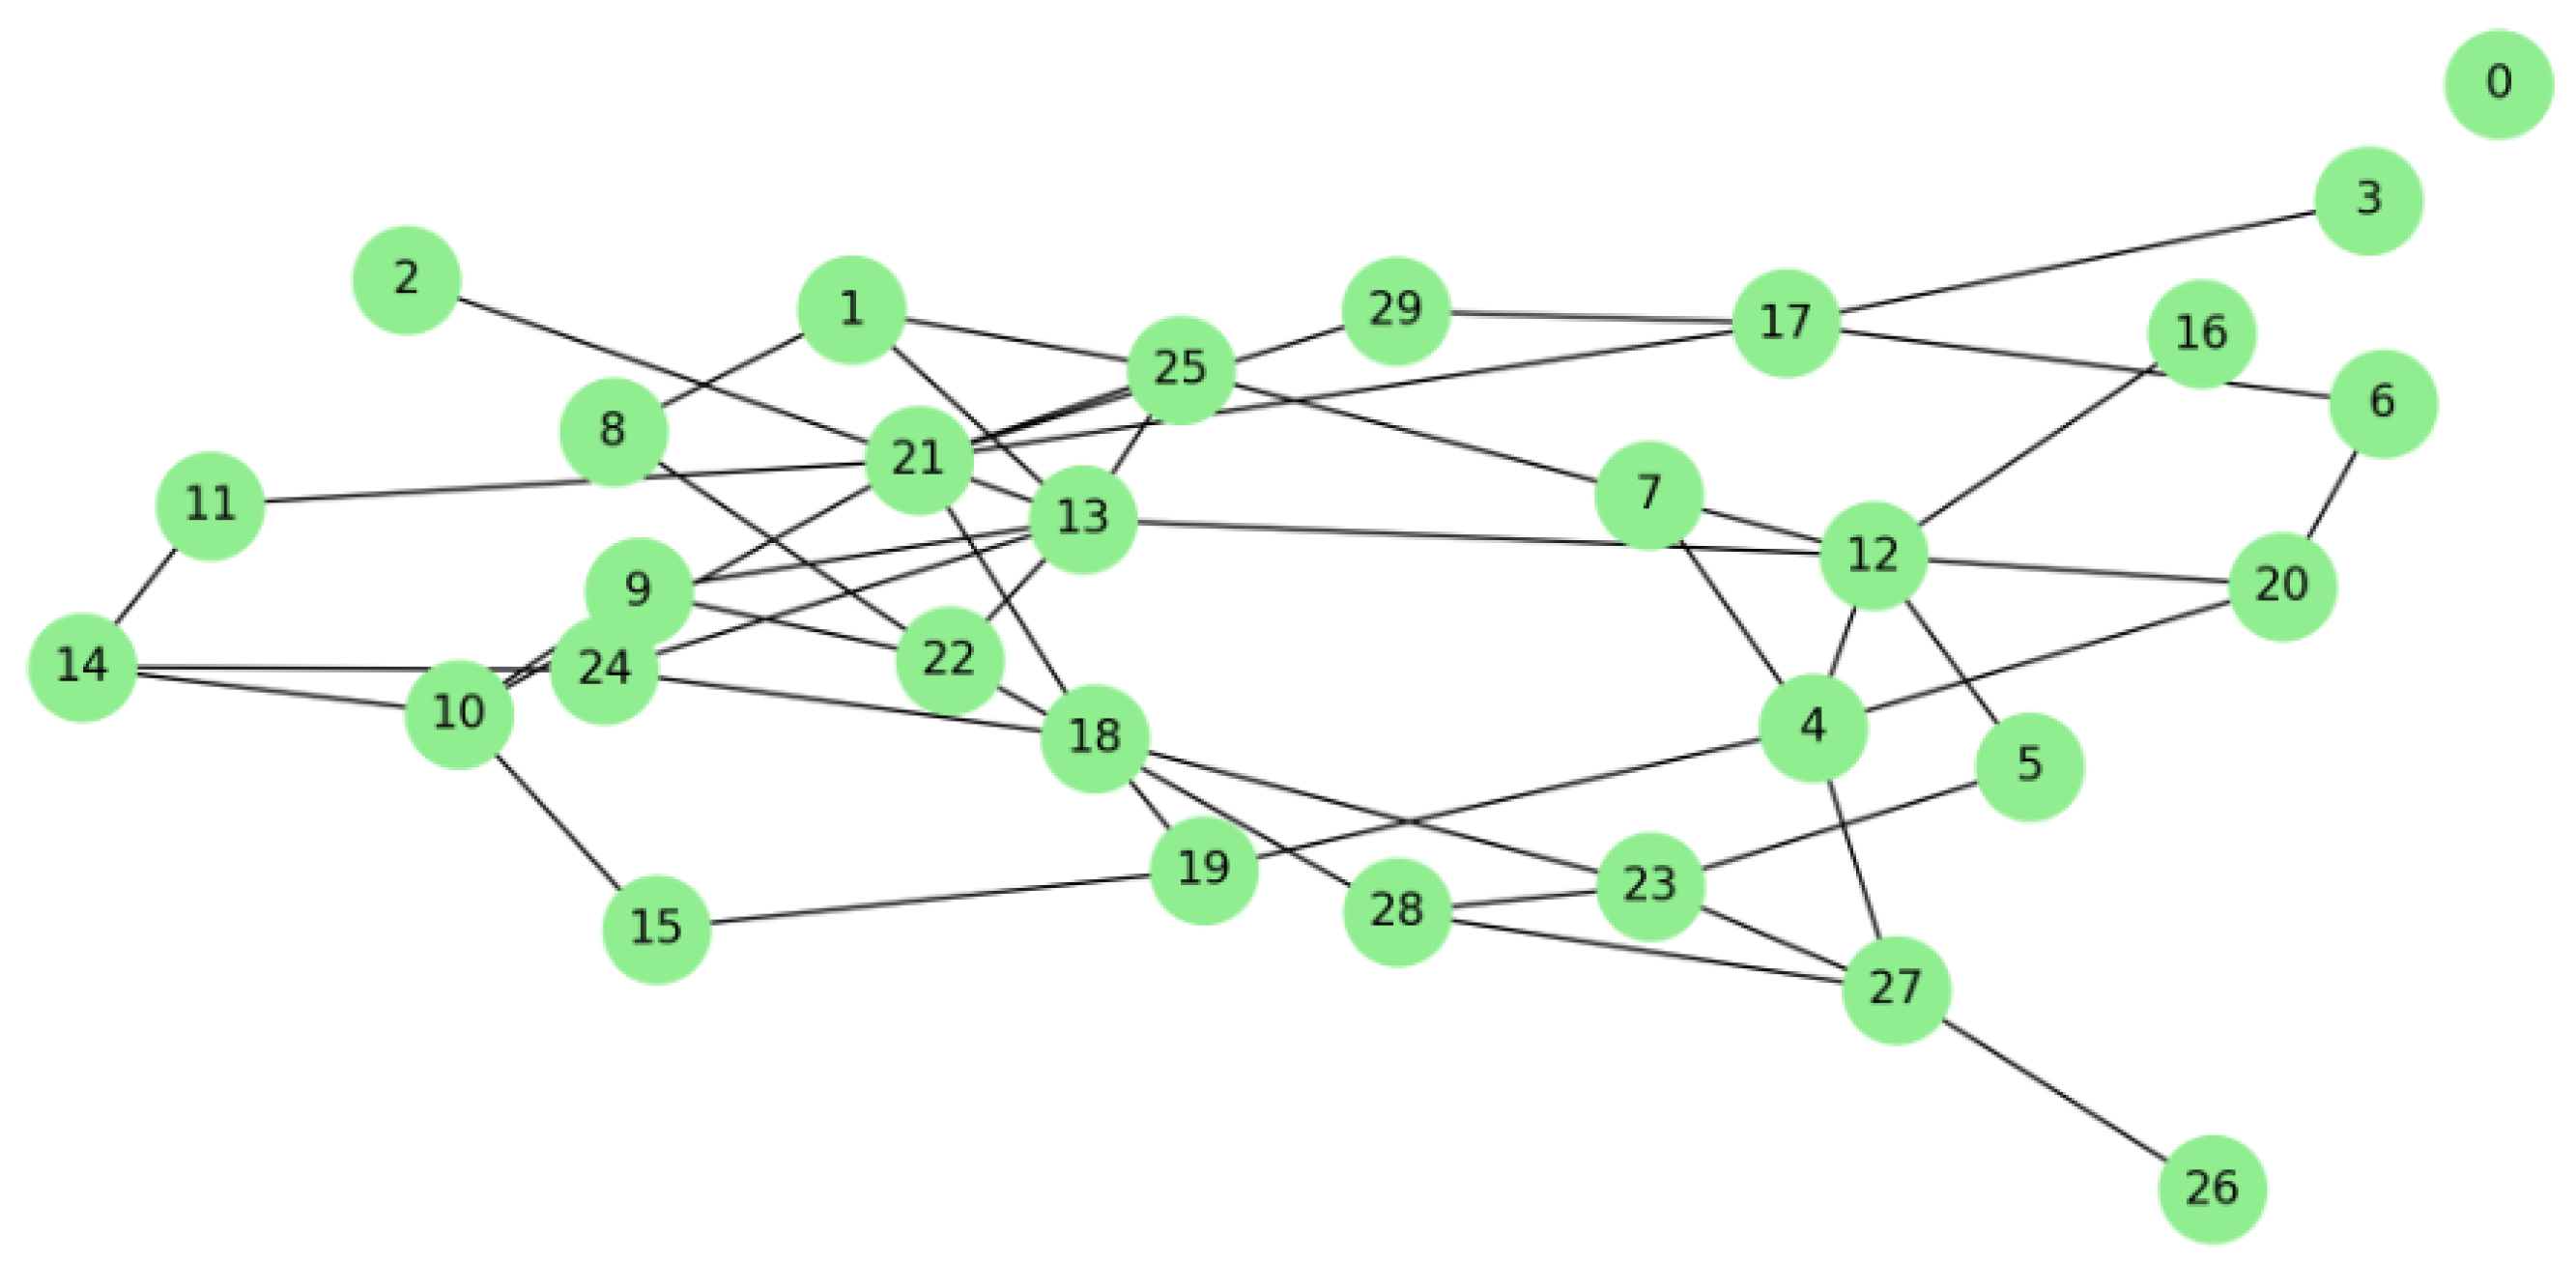
5.3.4. Shaping Peer Networks
- The P2P network is modeled as a graph where nodes are peers and edges depict connections.
- Efficient propagation of transactions requires optimal P2P topology.
- Analyzing degree distribution and connectivity patterns in the P2P topology graph allows for configuring the network structure for fast and reliable transaction dissemination.
- (a)
- Measure degree distribution and avg degrees of peer nodes in G.
- (b)
- Evaluate Giant connected component size and avg path lengths .
- (c)
- Configure graph via adding/removing edges and nodes to tailor , , and to optimal values.
- (d)
- This shapes the P2P topology for efficient and resolvable transaction propagation.
5.4. Simulating Blockchain Networks
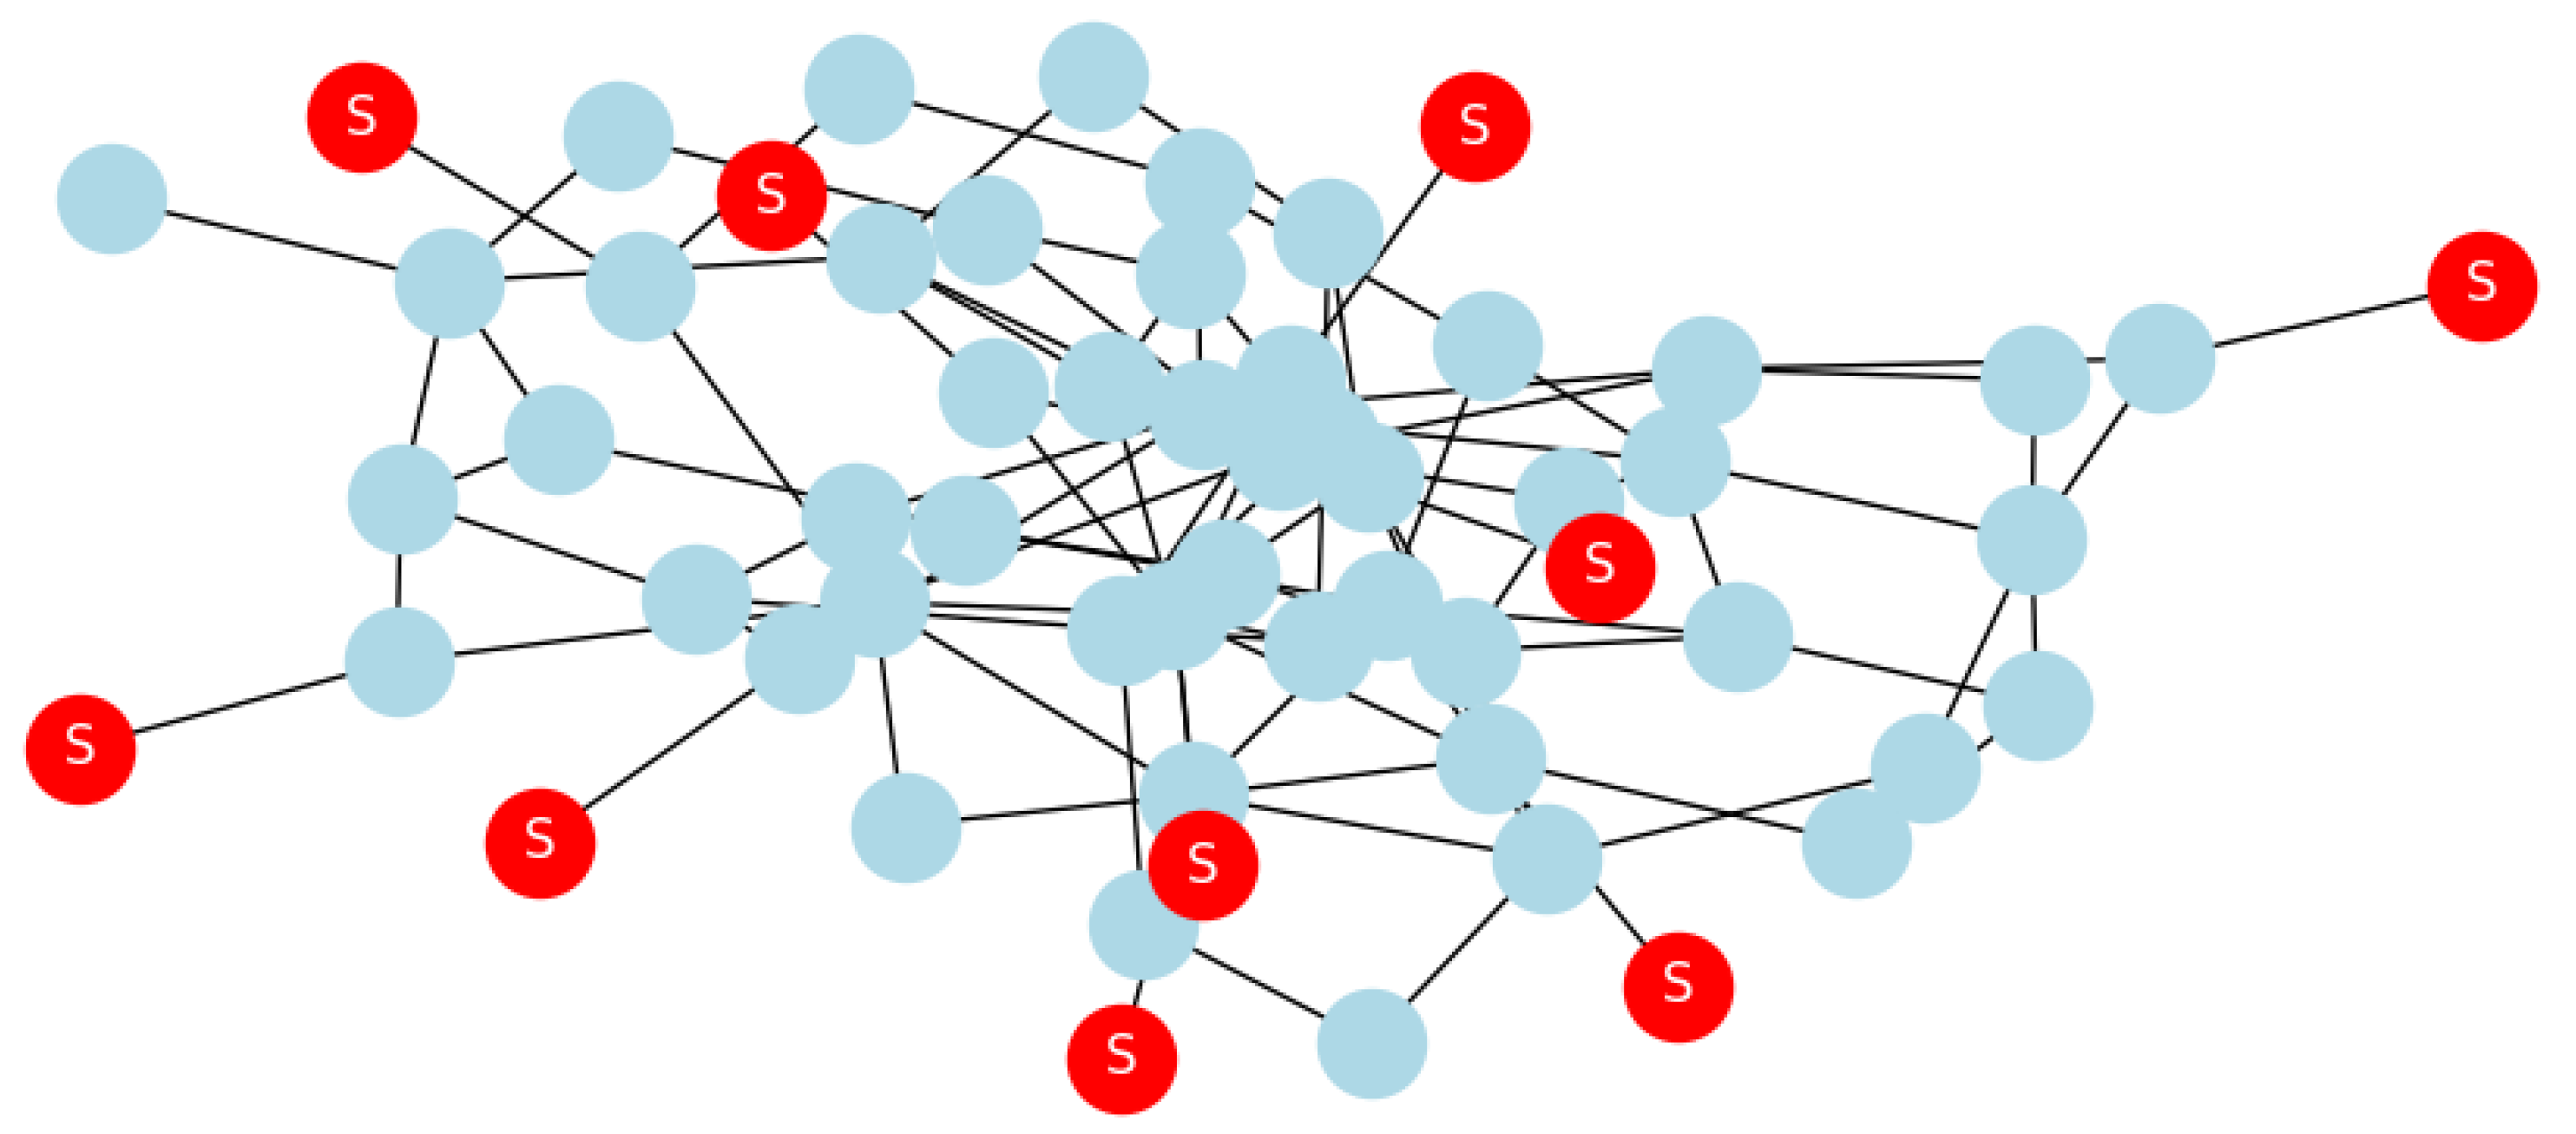
5.4.1. Sybil Attacks
- represents the transaction or interaction graph of a blockchain network.
- represents the set of Sybil nodes inserted by an adversary.
- represents the set of legitimate nodes in the network.
- Simulating Sybil attacks by introducing pseudo-nodes (S) into the modeled blockchain transaction graph G allows for the quantitative evaluation of the effectiveness of Sybil detection mechanisms designed to secure network consensus.
- (a)
- Interaction Graph modelling: Define as the interaction graph of the blockchain network, where nodes represent peers (legitimate and Sybil) and edges represent connections or transactions between these peers.
- (b)
- Sybil Node Insertion: An adversary introduces n Sybil nodes into G, resulting in the updated graph , where and includes edges connecting Sybil nodes to legitimate nodes. Mathematically, for each Sybil node , connect s to at least one via edge .
- (c)
- Community Detection and Sybil Identification: Apply a community detection algorithm to aiming to partition into disjointed subsets where each subset represents a tightly knit community. Formally, identify partitions such that and for . Detect Sybil groups by analyzing community structures; communities with unusually high edge densities to specific external nodes (potential gateways) are flagged as Sybil.
- (d)
- Sybil Detection Algorithm Performance: Evaluate the detection algorithm by calculating the True Positive Rate (TPR) and False Positive Rate (FPR) based on the algorithm’s ability to accurately identify inserted Sybil nodes. Define TPR as and FPR as , where is true positives, is false negatives, is false positives, and is true negatives.
- (e)
- Benchmarking: Benchmark the Sybil detection algorithm’s performance across various network topologies and Sybil attack scenarios by varying the number of Sybil nodes (n) and their connection patterns within .
5.4.2. Stress Testing
- The blockchain network is modeled as a transaction graph .
- Network robustness is evaluated under simulated peak traffic.
- Subjecting scaled blockchain transaction graphs to simulated peak traffic loads reveals system capacity margins and bottlenecks via quantitative mining inequality metrics.
- (a)
- Model baseline blockchain transaction network as graph . Obtain baseline mining power distribution.
- (b)
- Create scaled synthetic network with amplified transaction and mining traffic based on G.
- (c)
- Simulate surges and analyze emergent mining inequality and centralization metrics on the stressed graph.
5.4.3. Protocol Testing
- The blockchain peer network is modeled as a communication graph .
- Consensus requires agreement propagation among peers.
- Simulating consensus algorithms on graph models of blockchain peer networks under various conditions facilitates the performance evaluation of proposed protocols before finalization.
- (a)
- Model peer network as graph , capturing node connections.
- (b)
- Implement consensus protocol logic for state transitions of G’s nodes and edges.
- (c)
- Test consensus algorithm on G under different conditions of failures, delays and partitions.
- (d)
- Compare simulation metrics like agreement times, message complexity and partitions tolerated to analyze protocol progress and limitations.
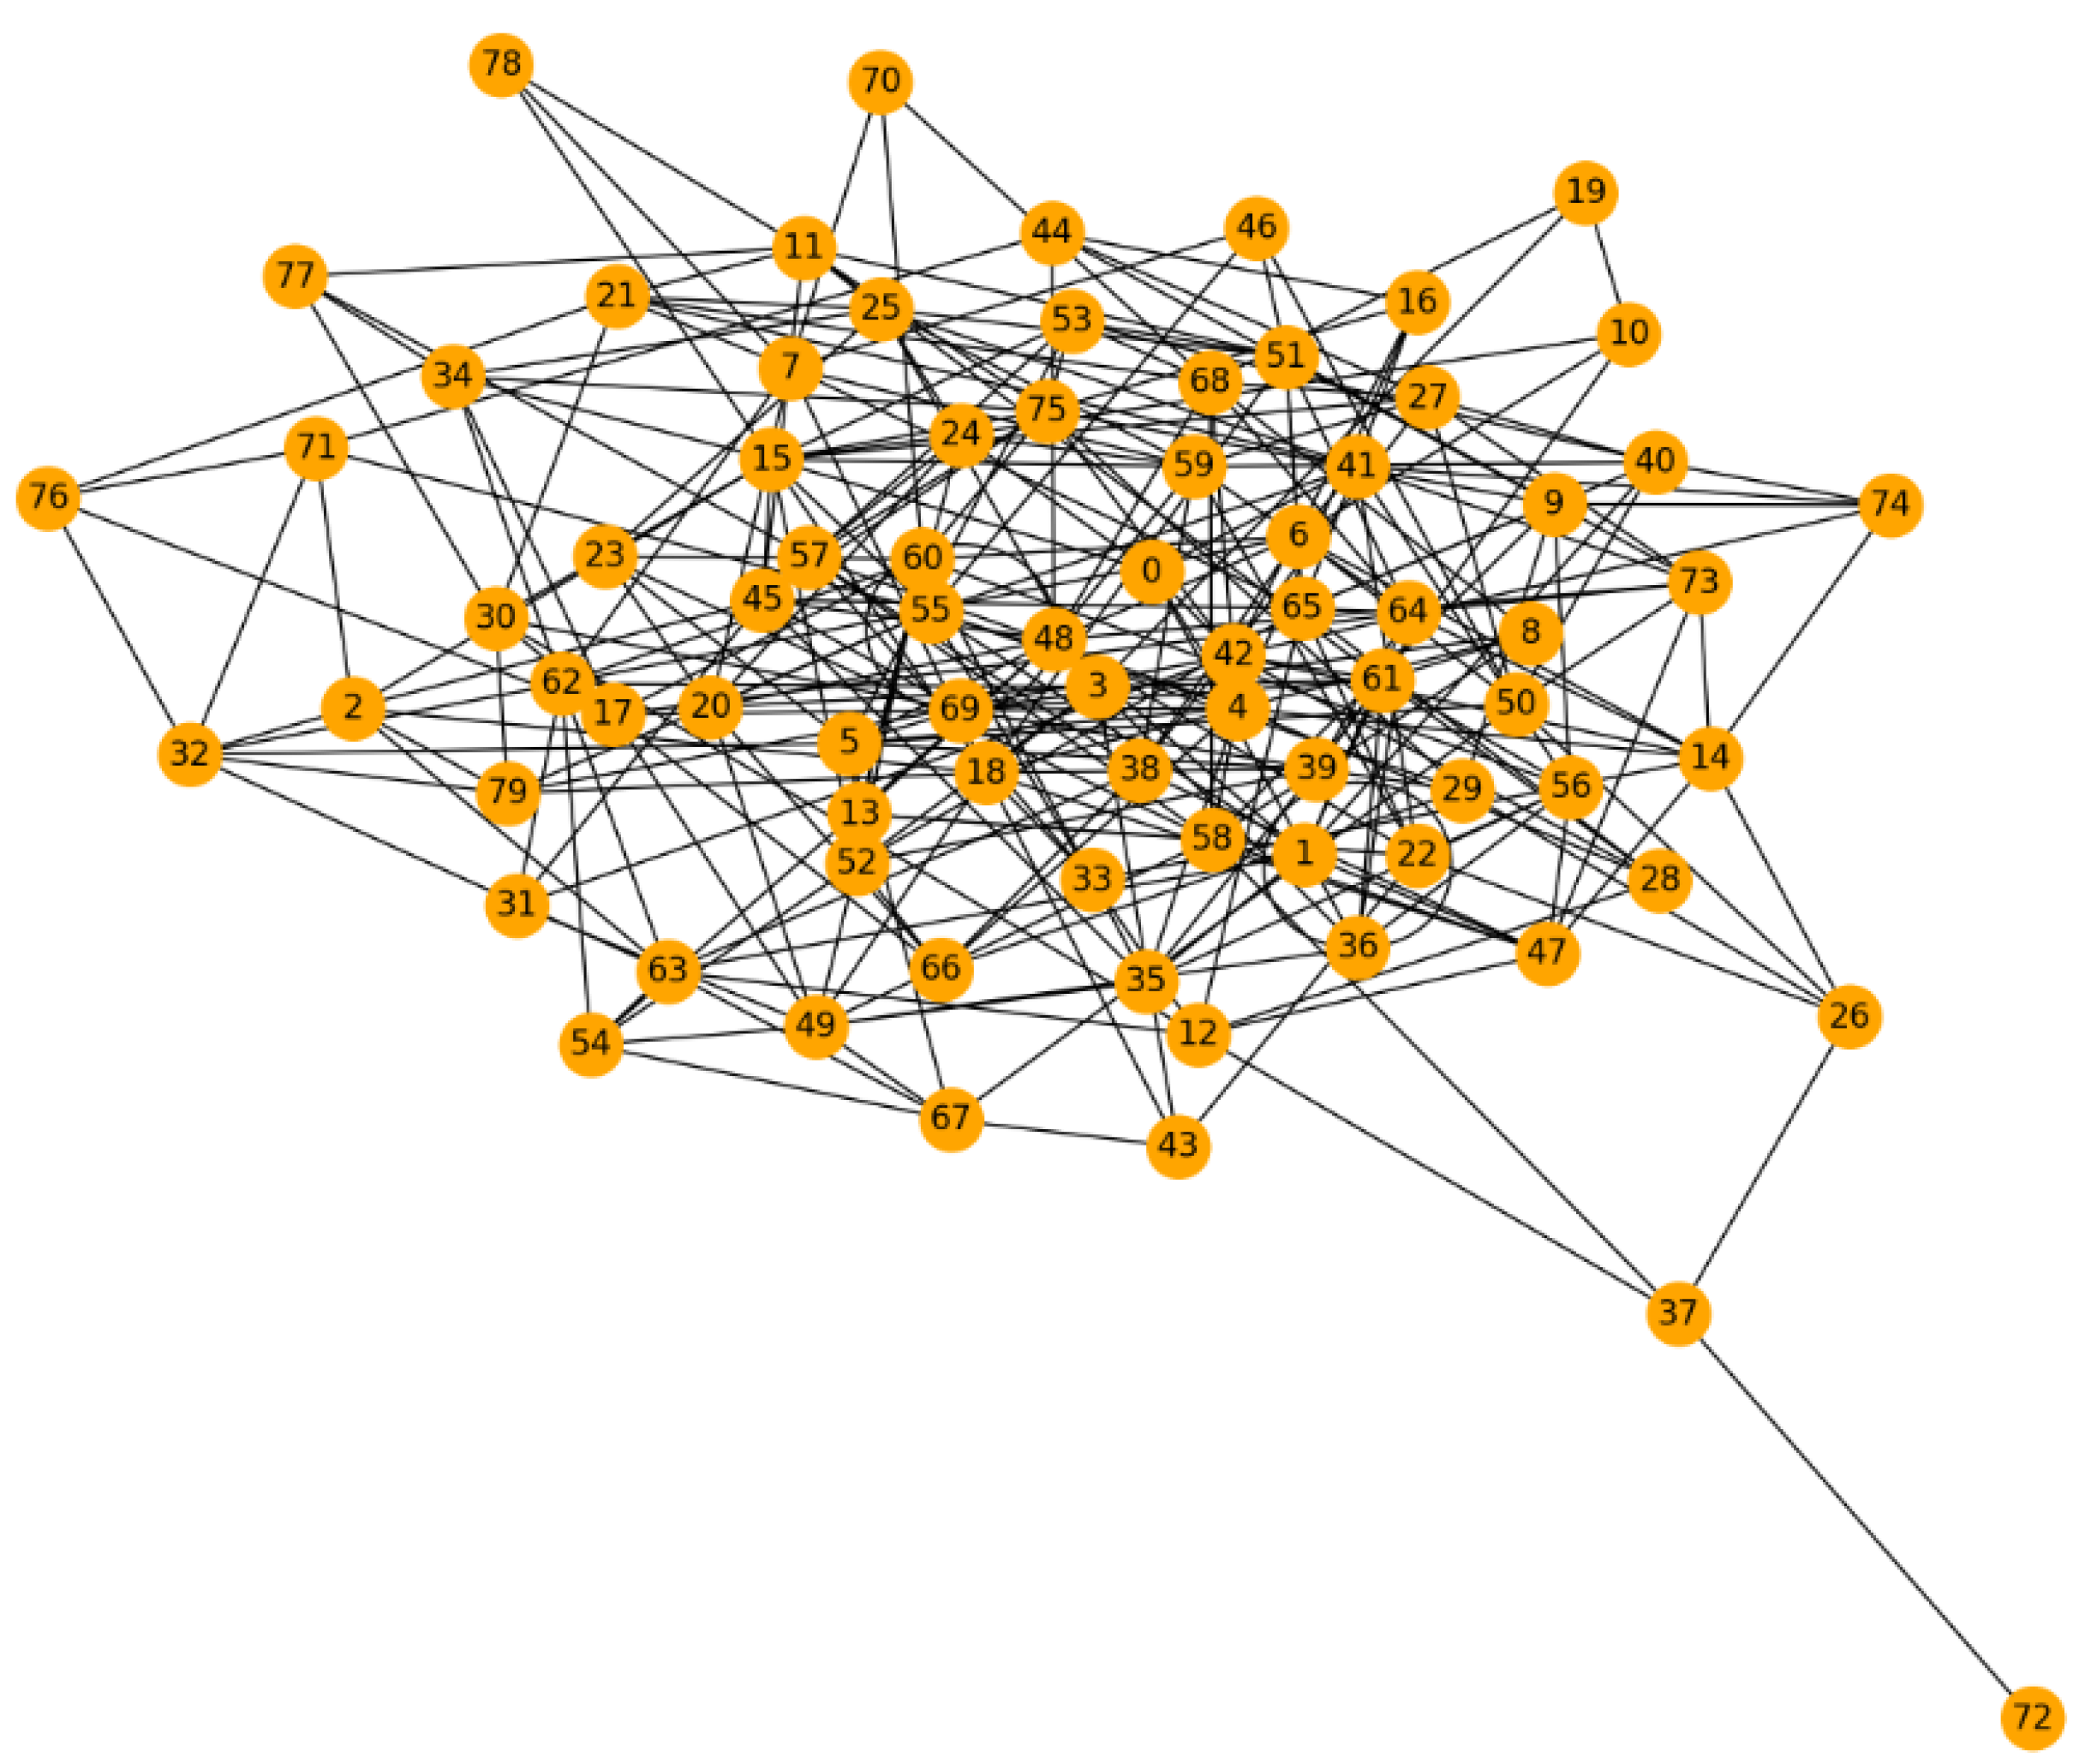
5.4.4. Forecasting Trends
- The historical blockchain network is modeled as transaction graph .
- Future growth and usage patterns need estimation.
- Extrapolating synthetic blockchain network graphs based on adding projected nodes and edges to model expected expansion enables predicting emerging usage patterns and required infrastructure upgrades.
- (a)
- Analyze historical transaction graph to develop blockchain adoption forecast models.
- (b)
- Initialize synthetic graph matching the latest state of G.
- (c)
- Evolve by adding nodes/edges based on growth predictions.
- (d)
- Analyze properties of the simulated expanded graph across multiple periods.
- (e)
- This forecasts transaction volumes and infrastructure demands to plan upgrades.
5.5. NFT Manipulation Mapping
5.5.1. Buying and Selling NFTs to Create Fake Volume (Wash Trading)
- Graph Model: The blockchain transaction network is modeled as a directed graph where:
- −
- V is a set of vertices representing accounts participating in the NFT market.
- −
- E is a set of directed edges representing transactions of NFTs between accounts. Each edge from vertex i to vertex j represents a transaction and is associated with attributes such as transaction value , timestamp , and the specific NFT involved.
- C is a set of cycles within G, where each cycle represents a sequence of transactions returning to the original account.
- A short time frame T is defined to identify rapid trading cycles indicative of wash trading.
- The transaction volume for a cycle C is the sum of the transaction values for all edges in C.
- For a given NFT marketplace transaction graph G, cycles that complete within a short time frame T and exhibit high transaction volumes relative to the network average are indicative of wash trading.
- (a)
- Cycle Detection. Detect all cycles C in G, utilizing a depth-first search or other graph traversal algorithms capable of identifying cycles.
- (b)
- Temporal Analysis. For each cycle C, calculate the duration asfor all . Identify cycles where .
- (c)
- Volume Analysis. Calculate the transaction volume for each cycle C identified in step b as
- (d)
- Benchmarking. Define the network’s average transaction volume and compare for each cycle C against . Cycles with are scrutinized for wash trading.
- (e)
- Ownership Consistency. Verify the change in ownership for NFTs involved in cycles C. Minimal change in ownership despite high reinforces the wash trading hypothesis.
5.5.2. Coordinated Trading
- Let be a directed graph where
- −
- V represents traders in the NFT market, and
- −
- E represents transactions of NFTs between traders. Each transaction from trader i to trader j is associated with attributes like transaction value , timestamp , and the specific NFT involved.
- −
- Define a subset where traders are involved in coordinated trading, engaging in transactions within a narrowly defined time frame T.
- In the NFT marketplace represented by graph G, the subset S of traders engaging in coordinated trading activities can be identified by analyzing the temporal clustering of transactions within T, which leads to an abnormal surge in trading volume and price movement for the involved NFTs.
- (a)
- Temporal Clustering. For each NFT involved in transactions within the subset S, cluster transactions based on their timestamps . Identify clusters where the number of transactions exceeds a threshold within time frame T, indicative of coordinated trading.
- (b)
- Volume and Price Analysis. Calculate the total transaction volume and average price change for NFTs involved in identified clusters. Compare and with the network-wide averages and to identify significant deviations.
- (c)
- Statistical Significance. Use statistical tests to evaluate the likelihood that observed surges in volume and price movement are due to chance. Significant deviations from the averages suggest the presence of coordinated trading.
5.5.3. Cross Trading
- Let us consider a collection of directed graphs where each graph represents a transaction network on a distinct NFT trading platform k. In each graph:
- −
- is a set of vertices representing traders on platform k.
- −
- is a set of directed edges representing transactions of NFTs between traders on platform k, with each edge from trader i to trader j associated with attributes like transaction value , timestamp , and the specific NFT involved.
- In a multi-platform NFT marketplace represented by a collection of graphs , the presence of identical subsets of traders engaging in transactions involving the same NFTs across these platforms is indicative of the cross-trading aimed at artificially inflating perceived demand and price.
- (a)
- Identification of Common Traders Across Platforms. Identify subsets of traders S who are active across multiple platforms, i.e., .
- (b)
- Transaction Matching. For each trader and for each pair of platforms , match transactions based on NFT identifiers and approximate timestamps. That is, find pairs of transactions where and is minimal, suggesting a deliberate attempt to show activity on multiple platforms.
- (c)
- Volume and Price Analysis. Calculate the aggregated transaction volume and average price for matched transactions across platforms. Compare these with platform-specific and network-wide averages to identify significant deviations.
- (d)
- Statistical Significance. Employ statistical methods to assess whether the observed patterns of cross-platform trading deviate significantly from expected distribution under normal market conditions.
5.5.4. Self-Trading
- Graph Representation. The NFT marketplace is modeled as a directed graph , where
- V represents individual trading accounts and
- E represents transactions between these accounts. Each transaction from account i to account j is associated with attributes such as transaction value , timestamp , and the specific NFT involved.
- Self-trading in the NFT marketplace can be identified by analyzing graph G for closed transaction loops within the subset of accounts A, indicating artificial trading activity aimed at inflating perceived market activity and NFT prices.
- (a)
- Identify Linked Accounts. Utilize community detection algorithms or heuristic analysis to identify subsets of accounts that exhibit patterns of closed-loop transactions indicative of single-entity control.
- (b)
- Detect Closed Transaction Loops. For each account , trace outgoing transactions where , forming closed loops that start and end at the same account or within A.
- (c)
- Analyze Transaction Attributes. Examine attributes , , and of transactions within closed loops for patterns such as repetitive trading of the same NFT, closely timed buy-sell actions, and transaction values inconsistent with market norms.
- (d)
- Quantify Artificial Activity. Aggregate the volume of transactions and the frequency of NFT trades within A to quantify the scale of self-trading activity.
- (e)
- Statistical Significance. Assess the statistical deviation of transaction patterns within A from those of the broader market to confirm the non-random nature of self-trading behavior.
6. Discussion
7. Conclusions
8. Limitations and Future Work
Author Contributions
Funding
Conflicts of Interest
References
- Yli-Huumo, J.; Ko, D.; Choi, S.; Park, S.; Smolander, K. Where is current research on blockchain technology?—A systematic review. PLoS ONE 2016, 11, e0163477. [Google Scholar] [CrossRef] [PubMed]
- Sanka, A.; Cheung, R. A systematic review of blockchain scalability: Issues, solutions, analysis and future research. J. Netw. Comput. Appl. 2021, 195, 103232. [Google Scholar] [CrossRef]
- Barabási, A.; Albert, R. Emergence of scaling in random networks. Science 1999, 286, 509–512. [Google Scholar] [CrossRef]
- Easley, D.; Kleinberg, J. Networks, Crowds, and Markets: Reasoning about a Highly Connected World; Cambridge University Press: Cambridge, UK, 2010; Volume 1. [Google Scholar]
- Gangrade, A.; Agrawal, B.; Kumar, S.; Mansuri, A. A study of applications of graph colouring in various fields. Int. J. Stat. Appl. Math. 2022, 7, 2022. [Google Scholar] [CrossRef]
- Majeed, A.; Rauf, I. Graph theory: A comprehensive survey about graph theory applications in computer science and social networks. Inventions 2020, 5, 10. [Google Scholar] [CrossRef]
- Raza, H.; Sharma, S.K.; Azeem, M. On Domatic Number of Some Rotationally Symmetric Graphs. J. Math. 2023, 2023, 3816772. [Google Scholar] [CrossRef]
- Ahmad, A.; Hasni, R.; Akhter, N.; Elahi, K. Analysis of distance-based topological polynomials associated with zero-divisor graphs. Comput. Mater. Contin. 2022, 70, 2898–2904. [Google Scholar] [CrossRef]
- Holmes, T.D.; Rothman, R.H.; Zimmerman, W.B. Graph theory applied to plasma chemical reaction engineering. Plasma Chem. Plasma Process. 2021, 41, 531–557. [Google Scholar] [CrossRef]
- El-Mesady, A.; Bazighifan, O. Construction of mutually orthogonal graph squares using novel product techniques. J. Math. 2022, 2022, 9722983. [Google Scholar] [CrossRef]
- Nithin, G.; Aslam, S.; Sathidevi, P.; Ameer, P.; Gopinath, S.; Radhakrishnan, K.; Parasuram, H. Localization of Epileptogenic Zone: A Graph Theoretical Approach. In Proceedings of the 2nd International Conference on Vision, Image and Signal Processing, Las Vegas, NV, USA, 27–29 August 2018; pp. 1–5. [Google Scholar]
- Nayana, P.; Iyer, R.R. An algorithm to find a dominating set that secures any connected graph G. In Proceedings of the 2022 IEEE 4th Ph.D. Colloquium on Emerging Domain Innovation and Technology for Society (Ph.D. EDITS), Bangalore, India, 4–5 November 2022; pp. 1–2. [Google Scholar]
- Thushara, A.; Amma, C.U.; John, A. Graph Theory-Based Brain Network Connectivity Analysis and Classification of Alzheimer’s Disease. Int. J. Image Graph. 2023, 23, 2240006. [Google Scholar] [CrossRef]
- Jose, G.M.; N, G.K. A Contemporary Technique to Place PMU in an Electrical Power Network using Graph Theory. In Proceedings of the 2023 Fifteenth International Conference on Contemporary Computing, Noida, India, 3–5 August 2023; pp. 598–602. [Google Scholar]
- Nabiyev, V.; Çakiroğlu, Ü.; Karal, H.; Erümit, A.K.; Ayça, Ç. Application of graph theory in an intelligent tutoring system for solving mathematical word problems. Eurasia J. Math. Sci. Technol. Educ. 2016, 12, 687–701. [Google Scholar]
- Wan, J.; Chen, H.; Li, T.; Sang, B.; Yuan, Z. Feature grouping and selection with graph theory in robust fuzzy rough approximation space. IEEE Trans. Fuzzy Syst. 2022, 31, 213–225. [Google Scholar] [CrossRef]
- Toppi, J.; Ciaramidaro, A.; Vogel, P.; Mattia, D.; Babiloni, F.; Siniatchkin, M.; Astolfi, L. Graph theory in brain-to-brain connectivity: A simulation study and an application to an EEG hyperscanning experiment. In Proceedings of the 2015 37th Annual International Conference of the IEEE Engineering in Medicine and Biology Society (EMBC), Milano, Italy, 25–29 August 2015; pp. 2211–2214. [Google Scholar]
- Kisku, D.R.; Gupta, P.; Sing, J.K. Applications of Graph Theory in Face Biometrics. In International Conference on Business Administration and Information Processing, Proceedings of the BAIP 2010: Information Processing and Management, Trivandrum, Kerala, India, 26–27 March 2010; Springer: Berlin/Heidelberg, Germany, 2010; pp. 28–33. [Google Scholar]
- Bhattacharya, S.; Poray, J. Application of graph theory in bigdata environment. In Proceedings of the 2016 International Conference on Computer, Electrical & Communication Engineering (ICCECE), Kolkata, India, 16–17 December 2016; pp. 1–8. [Google Scholar]
- Yan, S.; Wei, W.; Rui, W.; Zhengyi, W. Application of Matrix Algorithm Based on Graph Theory in Real-time Fault Diagnosis Knowledge Perfection Detection of Spacecraft Telemetry Data. In Proceedings of the 2022 IEEE International Conference on Signal Processing, Communications and Computing (ICSPCC), Xi’an, China, 25–27 October 2022; pp. 1–6. [Google Scholar]
- Priyadarsini, P. A survey on some applications of graph theory in cryptography. J. Discret. Math. Sci. Cryptogr. 2015, 18, 209–217. [Google Scholar] [CrossRef]
- Lahby, M. Enhancing modeling for network selection using graph theory in beyond 4g networks. Int. J. Bus. Data Commun. Netw. 2020, 16, 48–69. [Google Scholar] [CrossRef]
- Schizas, C.; Evans, F. APL and graph theory in dynamic systems analysis. IEE Proc.-Control Theory Appl. 1981, 3, 85–92. [Google Scholar] [CrossRef]
- Jovanović, N.; Zakić, A. Network simulation tools and spectral graph theory in teaching computer network. Comput. Appl. Eng. Educ. 2018, 26, 2084–2091. [Google Scholar] [CrossRef]
- Andrews, M.; Bhatnagar, S. Graph theory in microprogramming: An alternate approach to designing micro-code for microprocessing. Comput. Electr. Eng. 1980, 7, 175–183. [Google Scholar] [CrossRef]
- Yang, Z.X.; Ning, H.y.; Sun, J.Q.; Yang, J.B. Service portfolio optimization algorithm based on value model and graph theory in SOA. In Proceedings of the 2013 IEEE 4th International Conference on Software Engineering and Service Science, Beijing, China, 23–25 May 2013; pp. 64–67. [Google Scholar]
- Riaz, F.; Ali, K.M. Applications of graph theory in computer science. In Proceedings of the 2011 Third International Conference on Computational Intelligence, Communication Systems and Networks, Bali, Indonesia, 26–28 July 2011; pp. 142–145. [Google Scholar]
- Pavlova, N. Several Outlines of Graph Theory in Framework of MDA. In Advances in Information Systems Development: New Methods and Practice for the Networked Society; Springer: Berlin/Heidelberg, Germany, 2007; pp. 25–36. [Google Scholar]
- Chatain, J.; Varga, R.; Fayolle, V.; Kapur, M.; Sumner, R.W. Grounding graph theory in embodied concreteness with virtual reality. In Proceedings of the Seventeenth International Conference on Tangible, Embedded, and Embodied Interaction, Warsaw, Poland, 26 February–1 March 2023; pp. 1–13. [Google Scholar]
- Coufal, P.; Hubálovskỳ, Š.; Hubálovská, M. Application of basic graph theory in autonomous motion of robots. Mathematics 2021, 9, 919. [Google Scholar] [CrossRef]
- Doczkal, C.; Pous, D. Graph theory in Coq: Minors, treewidth, and isomorphisms. J. Autom. Reason. 2020, 64, 795–825. [Google Scholar] [CrossRef]
- Bowie, W.S. Applications of graph theory in computer systems. Int. J. Comput. Inf. Sci. 1976, 5, 9–31. [Google Scholar] [CrossRef]
- Erumit, A.K.; Nabiyev, V.; Cebi, A. Modeling of motion problems based on graph theory in maths. In Proceedings of the 2012 IV International Conference Problems of Cybernetics and Informatics (PCI), Baku, Azerbaijan, 12–14 September 2012; pp. 1–3. [Google Scholar]
- An, P.T.; Hai, N.N.; Van Hoai, T. The Role of Graph Theory in Solving Euclidean Shortest Path Problems in 2D and 3D. In Advances in Computer Science and Its Applications: CSA 2013; Springer: Berlin/Heidelberg, Germany, 2014; pp. 179–184. [Google Scholar]
- Qu, C.; Tao, M.; Yuan, R. A hypergraph-based blockchain model and application in internet of things-enabled smart homes. Sensors 2018, 18, 2784. [Google Scholar] [CrossRef] [PubMed]
- Tsoulias, K.; Palaiokrassas, G.; Fragkos, G.; Litke, A.; Varvarigou, T.A. A graph model based blockchain implementation for increasing performance and security in decentralized ledger systems. IEEE Access 2020, 8, 130952–130965. [Google Scholar] [CrossRef]
- Abay, N.C.; Akcora, C.G.; Gel, Y.R.; Kantarcioglu, M.; Islambekov, U.D.; Tian, Y.; Thuraisingham, B. Chainnet: Learning on blockchain graphs with topological features. In Proceedings of the 2019 IEEE International Conference on Data Mining (ICDM), Beijing, China, 8–11 November 2019; pp. 946–951. [Google Scholar]
- Shen, M.; Zhang, J.; Zhu, L.; Xu, K.; Du, X. Accurate decentralized application identification via encrypted traffic analysis using graph neural networks. IEEE Trans. Inf. Forensics Secur. 2021, 16, 2367–2380. [Google Scholar] [CrossRef]
- Liu, X.; Tang, Z.; Li, P.; Guo, S.; Fan, X.; Zhang, J. A graph learning based approach for identity inference in dapp platform blockchain. IEEE Trans. Emerg. Top. Comput. 2020, 10, 438–449. [Google Scholar] [CrossRef]
- Chung, F.R. Spectral Graph Theory; American Mathematical Society: Providence, RI, USA, 1997; Volume 92. [Google Scholar]
- Wang, X.; Zha, X.; Ni, W.; Liu, R.P.; Guo, Y.J.; Niu, X.; Zheng, K. Survey on blockchain for Internet of Things. Comput. Commun. 2019, 136, 10–29. [Google Scholar] [CrossRef]
- Jayabalasamy, G.; Koppu, S. High-performance Edwards curve aggregate signature (HECAS) for nonrepudiation in IoT-based applications built on the blockchain ecosystem. J. King Saud. Univ. Comput. Inf. Sci. 2022, 34, 9677–9687. [Google Scholar] [CrossRef]
- Guruprakash, J.; Koppu, S. EC-ElGamal and Genetic algorithm-based enhancement for lightweight scalable blockchain in IoT domain. IEEE Access 2020, 8, 141269–141281. [Google Scholar] [CrossRef]
- Khan, D.; Jung, L.T.; Hashmani, M.A. Systematic literature review of challenges in blockchain scalability. Appl. Sci. 2021, 11, 9372. [Google Scholar] [CrossRef]
- Gochhayat, S.; Shetty, S.; Mukkamala, R.; Foytik, P.; Kamhoua, G.; Njilla, L. Measuring decentrality in blockchain based systems. IEEE Access 2020, 8, 178372–178390. [Google Scholar] [CrossRef]
- Madine, M.; Salah, K.; Jayaraman, R.; Al-Hammadi, Y.; Arshad, J.; Yaqoob, I. appxchain: Application-level interoperability for blockchain networks. IEEE Access 2021, 9, 87777–87791. [Google Scholar] [CrossRef]
- Hu, X.; Islam, A.; Britz, T. Bounds on the closeness centrality of a graph. arXiv 2022, arXiv:2204.11283. [Google Scholar]
- Bazari, A.S.; Aggarwal, A.; Asif, W.; Lestas, M.; Rajarajan, M. Node criticality assessment in a blockchain network. In Proceedings of the 2nd Workshop on Blockchain-Enabled Networked Sensor, New York, NY, USA, 10 November 2019; pp. 22–27. [Google Scholar]
- Shahsavari, Y.; Zhang, K.; Talhi, C. Toward quantifying decentralization of blockchain networks with relay nodes. Front. Blockchain 2022, 5, 812957. [Google Scholar] [CrossRef]
- Bhavadharini, R.; Karthik, S. Blockchain enabled metaheuristic cluster based routing model for wireless networks. Comput. Syst. Sci. Eng. 2023, 44, 1233–1250. [Google Scholar] [CrossRef]
- Ezeh, C.; Ren, T.; Li, Z.; Yiqun, W.; Qu, Y. Multi-type node detection in network communities. Entropy 2019, 21, 1237. [Google Scholar] [CrossRef]
- Devillers, R. Articulation of transition systems and its application to Petri net synthesis. In Application and Theory of Petri Nets and Concurrency, Proceedings of the 40th International Conference, PETRI NETS 2019, Aachen, Germany, 23–28 June 2019; Proceedings 40; Springer: Berlin/Heidelberg, Germany, 2019; pp. 113–126. [Google Scholar]
- Chen, L.; Shan, S. Optimization of the trust propagation on supply chain network based on blockchain plus. J. Intell. Manag. Decis. 2022, 1, 17–27. [Google Scholar] [CrossRef]
- Giuntini, F.; Moraes, K.; Cazzolato, M.; Kirchner, L.; Reis, M.; Traina, A.; Campbell, A.; Ueyama, J. Modeling and assessing the temporal behavior of emotional and depressive user interactions on social networks. IEEE Access 2021, 9, 93182–93194. [Google Scholar] [CrossRef]
- Serrano, W. The blockchain random neural network in cybersecurity and the Internet of Things. In Artificial Intelligence Applications and Innovations, Proceedings of the 15th IFIP WG 12.5 International Conference, AIAI 2019, Hersonissos, Crete, Greece, 24–26 May 2019; Proceedings 15; Springer: Berlin/Heidelberg, Germany, 2019; pp. 50–63. [Google Scholar]
- Lahmadi, A.; Bertin, E.; Li, R. Brains 2020 special issue: Blockchain research and applications for innovative networks and services. Int. J. Netw. Manag. 2021, 32. [Google Scholar] [CrossRef]
- Li, C.; Palanisamy, B. Comparison of decentralization in dpos and pow blockchains. In Proceedings of the Blockchain, ICBC 2020, Honolulu, HI, USA, 18–20 September 2020; pp. 18–32. [Google Scholar] [CrossRef]
- Furno, A.; Faouzi, N.E.; Sharma, R.; Zimeo, E. Graph-based ahead monitoring of vulnerabilities in large dynamic transportation networks. PLoS ONE 2021, 16, e0248764. [Google Scholar] [CrossRef]
- Shinkar, S.V.; Thankachan, D. Scmbqa: Design of a customised scm-aware sidechaining model for qos enhancement under attack scenarios. Int. J. Recent Innov. Trends Comput. Commun. 2022, 10, 200–212. [Google Scholar] [CrossRef]
- Hashim, F.; Shuaib, K.; Sallabi, F. Medshard: Electronic health record sharing using blockchain sharding. Sustainability 2021, 13, 5889. [Google Scholar] [CrossRef]
- Casale-Brunet, S.; Ribeca, P.; Doyle, P.; Mattavelli, M. Networks of Ethereum Non-Fungible Tokens: A graph-based analysis of the ERC-721 ecosystem. In Proceedings of the 2021 IEEE International Conference on Blockchain (Blockchain), Melbourne, Australia, 6–8 December 2021; pp. 188–195. [Google Scholar]
- Tan, Y.; Wu, Z.; Liu, J.; Wu, J.; Zheng, Z.; Chen, T. Bubble or Not: Measurements, Analyses, and Findings on the Ethereum ERC721 and ERC1155 Non-fungible Token Ecosystem. arXiv 2023, arXiv:2301.01991. [Google Scholar]
- Kim, H.; Cui, J.; Jang, E.; Lee, C.; Lee, Y.; Chung, J.W.; Shin, S. DRAINCLoG: Detecting Rogue Accounts with Illegally-obtained NFTs using Classifiers Learned on Graphs. arXiv 2023, arXiv:2301.13577. [Google Scholar]
- Bustamante, P.; Cai, M.; Gomez, M.; Harris, C.; Krishnamurthy, P.; Law, W.; Madison, M.; Murtazashvili, I.; Murtazashvili, J.; Mylovanov, T.; et al. Government by code? blockchain applications to public sector governance. Front. Blockchain 2022, 5, 869665. [Google Scholar] [CrossRef]
- Leonardos, N.; Leonardos, S.; Piliouras, G. Oceanic games: Centralization risks and incentives in blockchain mining. In Mathematical Research for Blockchain Economy, Proceedings of the 1st International Conference MARBLE 2019, Santorini, Greece, 6–9 May 2019; Springer: Berlin/Heidelberg, Germany, 2020; pp. 183–199. [Google Scholar] [CrossRef]
- Takaishi, T. Statistical properties and multifractality of Bitcoin. Phys. Stat. Mech. Its Appl. 2018, 506, 507–519. [Google Scholar] [CrossRef]
- Gilad, Y.; Hemo, R.; Micali, S.; Vlachos, G.; Zeldovich, N. Algorand: Scaling byzantine agreements for cryptocurrencies. In Proceedings of the 26th Symposium on Operating Systems Principles, Shanghai, China, 28–31 October 2017; pp. 51–68. [Google Scholar]
- Tao, B.; Ho, I.W.H.; Dai, H.N. Complex network analysis of the bitcoin blockchain network. In Proceedings of the 2021 IEEE International Symposium on Circuits and Systems (ISCAS), Daegu, Republic of Korea, 22–28 May 2021; pp. 1–5. [Google Scholar]
- Bock, T. Measuring and modeling group dynamics in open-source software development: A tensor decomposition approach. ACM Trans. Softw. Eng. Methodol. 2021, 31, 1–50. [Google Scholar] [CrossRef]
- Aslam, S.; Tošić, A.; Mrissa, M. Secure and privacy-aware blockchain design: Requirements, challenges and solutions. J. Cybersecur. Priv. 2021, 1, 164–194. [Google Scholar] [CrossRef]
- Xiao, Y.; Zhang, N.; Lou, W.; Hou, Y.T. A survey of distributed consensus protocols for blockchain networks. IEEE Commun. Surv. Tutor. 2020, 22, 1432–1465. [Google Scholar] [CrossRef]
- Cheng, J.; Xie, L.; Tang, X.; Xiong, N.; Liu, B. A survey of security threats and defense on Blockchain. Multimed. Tools Appl. 2021, 80, 30623–30652. [Google Scholar] [CrossRef]
- Averin, A.; Averina, O. Review of blockchain technology vulnerabilities and blockchain-system attacks. In Proceedings of the 2019 International Multi-Conference on Industrial Engineering and Modern Technologies (FarEastCon), Vladivostok, Russia, 1–4 October 2019; pp. 1–6. [Google Scholar]
- Saad, M.; Spaulding, J.; Njilla, L.; Kamhoua, C.; Shetty, S.; Nyang, D.; Mohaisen, D. Exploring the attack surface of blockchain: A comprehensive survey. IEEE Commun. Surv. Tutor. 2020, 22, 1977–2008. [Google Scholar] [CrossRef]
- Shrivas, M.K.; Dean, T.Y.; Brunda, S.S. The disruptive blockchain security threats and threat categorization. In Proceedings of the 2020 First International Conference on Power, Control and Computing Technologies (ICPC2T), Raipur, India, 3–5 January 2020; pp. 327–338. [Google Scholar]
- Choi, J. Inferring the Hidden Cascade Infection over Erdös-Rényi (ER) Random Graph. Electronics 2021, 10, 1894. [Google Scholar] [CrossRef]
- Putz, B.; Pernul, G. Detecting blockchain security threats. In Proceedings of the 2020 IEEE International Conference on Blockchain (Blockchain), Rhodes Island, Greece, 2–6 November 2020; pp. 313–320. [Google Scholar]
- Dorri, A.; Roulin, C.; Pal, S.; Baalbaki, S.; Jurdak, R.; Kanhere, S.S. Device identification in blockchain-based internet of things. IEEE Internet Things J. 2022, 9, 24767–24776. [Google Scholar] [CrossRef]
- Paquet-Clouston, M.; Haslhofer, B.; Dupont, B. Ransomware payments in the bitcoin ecosystem. J. Cybersecur. 2019, 5, tyz003. [Google Scholar] [CrossRef]
- Rožman, N.; Corn, M.; Škulj, G.; Diaci, J.; Podržaj, P. Scalability solutions in blockchain-supported manufacturing: A survey. Stroj. Vestn. J. Mech. Eng. 2022, 68, 585–609. [Google Scholar] [CrossRef]
- Croman, K.; Decker, C.; Eyal, I.; Gencer, A.E.; Juels, A.; Kosba, A.; Miller, A.; Saxena, P.; Shi, E.; Gün Sirer, E.; et al. On Scaling Decentralized Blockchains: (A Position Paper). In International Conference on Financial Cryptography and Data Security, Proceedings of the FC 2016 International Workshops, BITCOIN, VOTING, and WAHC, Christ Church, Barbados, 26 February 2016; Springer: Berlin/Heidelberg, Germany, 2016; pp. 106–125. [Google Scholar]
- Gervais, A.; Karame, G.O.; Wüst, K.; Glykantzis, V.; Ritzdorf, H.; Capkun, S. On the security and performance of proof of work blockchains. In Proceedings of the 2016 ACM SIGSAC Conference on Computer and Communications Security, Vienna, Austria, 24–26 October 2016; pp. 3–16. [Google Scholar]
- Wang, Q.; Yu, J.; Chen, S.; Xiang, Y. SoK: Diving into DAG-based blockchain systems. arXiv 2020, arXiv:2012.06128. [Google Scholar]
- Maeng, S.; Essaid, M.; Lee, C.; Park, S.; Ju, H. Visualization of ethereum p2p network topology and peer properties. Int. J. Netw. Manag. 2021, 31, e2175. [Google Scholar] [CrossRef]
- Albshri, A.; Alzubaidi, A.; Awaji, B.; Solaiman, E. Blockchain simulators: A systematic mapping study. In Proceedings of the 2022 IEEE International Conference on Services Computing (SCC), Barcelona, Spain, 11–15 July 2022. [Google Scholar] [CrossRef]
- Alharby, M.; Moorsel, A. Blocksim: An extensible simulation tool for blockchain systems. Front. Blockchain 2020, 3, 28. [Google Scholar] [CrossRef]
- Skowroński, R.; Brzeziński, J. Spide: Sybil-proof, incentivized data exchange. Clust. Comput. 2021, 25, 2241–2270. [Google Scholar] [CrossRef]
- Lin, Q.; Li, C.; Zhao, X.; Chen, X. Measuring decentralization in bitcoin and ethereum using multiple metrics and granularities. In Proceedings of the 2021 IEEE 37th International Conference on Data Engineering Workshops (ICDEW), Chania, Greece, 19–22 April 2021; pp. 80–87. [Google Scholar]
- Kang, J.; Xiong, Z.; Niyato, D.; Wang, P.; Ye, D.; Kim, D.I. Incentivizing consensus propagation in proof-of-stake based consortium blockchain networks. IEEE Wirel. Commun. Lett. 2019, 8, 157–160. [Google Scholar] [CrossRef]
- Rosa, E.; D’Angelo, G.; Ferretti, S. Agent-Based Simulation of Blockchains. In Methods and Applications for Modeling and Simulation of Complex Systems, Proceeding of the 19th Asia Simulation Conference, AsiaSim 2019, Singapore, 30 October–1 November 2019; Tan, G., Lehmann, A., Teo, Y.M., Cai, W., Eds.; Springer: Singapore, 2019; pp. 115–126. [Google Scholar]
- Liu, D.; Piccoli, F.; Chen, K.; Tang, A.; Fang, V. Nft wash trading detection. arXiv 2023, arXiv:2305.01543. [Google Scholar]
- Hasan, H.R.; Salah, K.; Battah, A.; Madine, M.; Yaqoob, I.; Jayaraman, R.; Omar, M. Incorporating registration, reputation, and incentivization into the nft ecosystem. IEEE Access 2022, 10, 76416–76433. [Google Scholar] [CrossRef]
- Sifat, I.; Tariq, S.A.; van Donselaar, D. Suspicious trading in nonfungible tokens (NFTs). Inf. Manag. 2024, 61, 103898. [Google Scholar] [CrossRef]
- Tariq, S.A.; Sifat, I. Suspicious trading in nonfungible tokens (nfts): Evidence from wash trading. SSRN Electron. J. 2022. [Google Scholar] [CrossRef]
- von Wachter, V.; Jensen, J.R.; Regner, F.; Ross, O. NFT Wash Trading: Quantifying suspicious behaviour in NFT markets. In International Conference on Financial Cryptography and Data Security, Proceedings of the FC 2022: Financial Cryptography and Data Security. FC 2022 International Workshops, CoDecFin, DeFi, Voting, WTSC, Grenada, Grenada, 6 May 2022; Springer: Berlin/Heidelberg, Germany, 2022; pp. 299–311. [Google Scholar]
- Hsieh, Y.; Vergne, J. The future of the web? The coordination and early-stage growth of decentralized platforms. Strateg. Manag. J. 2022, 44, 829–857. [Google Scholar] [CrossRef]
- Chen, Z.; Omote, K. Toward achieving anonymous nft trading. IEEE Access 2022, 10, 130166–130176. [Google Scholar] [CrossRef]
- Das, D.; Bose, P.; Ruaro, N.; Kruegel, C.; Vigna, G. Understanding security issues in the NFT ecosystem. In Proceedings of the 2022 ACM SIGSAC Conference on Computer and Communications Security, Los Angeles, CA, USA, 7–11 November 2022; pp. 667–681. [Google Scholar]


| Facet | Insights from Graph Modelling | Enabled Improvements |
|---|---|---|
| Decentralization | Power laws in degree distribution highlight consensus vulnerabilities | Mitigate centralization risks |
| Security | Simulate infection spread to assess attack resilience | Fortify consensus mechanisms |
| Privacy | Stylometry helps create transaction fingerprints | Address anonymity leaks |
| Scalability | Partition graphs to localize bottlenecks | Optimize network sharding |
| Simulation | Model attacks and peak loads via graph generators | Stress test systems pre-deployment |
| Mapping | Assert mapping and understanding assert movement via graphs | Assert authentication |
| Domain | Subdomain | Ref. |
|---|---|---|
| Computer Science and Information Technology | Artificial Intelligence and Machine Learning | [15,16,17,18] |
| Data Science and Analytics | [19] | |
| Network and Security | [20,21,22] | |
| Software Development | [23,24,25,26] | |
| Theoretical Computer Science | [27,28,29,30,31,32,33,34] |
Disclaimer/Publisher’s Note: The statements, opinions and data contained in all publications are solely those of the individual author(s) and contributor(s) and not of MDPI and/or the editor(s). MDPI and/or the editor(s) disclaim responsibility for any injury to people or property resulting from any ideas, methods, instructions or products referred to in the content. |
© 2024 by the authors. Licensee MDPI, Basel, Switzerland. This article is an open access article distributed under the terms and conditions of the Creative Commons Attribution (CC BY) license (https://creativecommons.org/licenses/by/4.0/).
Share and Cite
Jayabalasamy, G.; Pujol, C.; Latha Bhaskaran, K. Application of Graph Theory for Blockchain Technologies. Mathematics 2024, 12, 1133. https://doi.org/10.3390/math12081133
Jayabalasamy G, Pujol C, Latha Bhaskaran K. Application of Graph Theory for Blockchain Technologies. Mathematics. 2024; 12(8):1133. https://doi.org/10.3390/math12081133
Chicago/Turabian StyleJayabalasamy, Guruprakash, Cyril Pujol, and Krithika Latha Bhaskaran. 2024. "Application of Graph Theory for Blockchain Technologies" Mathematics 12, no. 8: 1133. https://doi.org/10.3390/math12081133
APA StyleJayabalasamy, G., Pujol, C., & Latha Bhaskaran, K. (2024). Application of Graph Theory for Blockchain Technologies. Mathematics, 12(8), 1133. https://doi.org/10.3390/math12081133