Article

Automatic Evaluation Method for Functional Movement Screening Based on a Dual-Stream Network and Feature Fusion

1
Fujian Institute of Education, Fuzhou 350025, China
2
College of Computer and Cyber Security, Fujian Normal University, Fuzhou 350117, China
3
Department of Information Engineering, Fuzhou Polytechnic, Fuzhou 350108, China
4
Fuzhou Institute of Oceanography, College of Computer and Data Science, Minjiang University, Fuzhou 350108, China
5
Department of Software Systems & Cybersecurity, Monash University, Melbourne, VIC 3800, Australia
*
Authors to whom correspondence should be addressed.
Mathematics 2024, 12(8), 1162; https://doi.org/10.3390/math12081162
Submission received: 21 March 2024 / Revised: 4 April 2024 / Accepted: 10 April 2024 / Published: 12 April 2024
(This article belongs to the Special Issue Advances in Graph Theory: Algorithms and Applications)

Abstract

:
Functional Movement Screening (FMS) is a movement pattern quality assessment system used to assess basic movement capabilities such as flexibility, stability, and pliability. Movement impairments and abnormal postures can be identified through peculiar movements and postures of the body. The reliability, validity, and accuracy of functional movement screening are difficult to test due to the subjective nature of the assessment. In this sense, this paper presents an automatic evaluation method for functional movement screening based on a dual-stream network and feature fusion. First, the RAFT algorithm is used to estimate the optical flow of a video, generating a set of optical flow images to represent the motion between consecutive frames. By inputting optical flow images and original video frames separately into the I3D model, it can better capture spatiotemporal features compared to the single-stream method. Meanwhile, this paper introduces a simple but effective attention fusion method that combines features extracted from optical flow with the original frames, enabling the network to focus on the most relevant parts of the input data, thereby improving prediction accuracy. The prediction of the four categories of FMS results was performed. It produced better correlation results compared to other more complex fusion protocols, with an accuracy improvement of 3% over the best-performing fusion method. Tests on public datasets showed that the evaluation metrics of the method proposed in this paper were the most advanced, with an accuracy improvement of approximately 4% compared to the currently superior methods. The use of deep learning methods makes it more objective and reliable to identify human movement impairments and abnormal postures.

1. Introduction

Functional movement systems [1] include two movement evaluation systems, i.e., Functional Movement Screen and Selective Functional Movement Assessment [2] (SFMA), as well as Y-Balance Test [3] (YBT) and Fundamental Capacity Screen (FCS). With pain as a cut-off point, the functional movement system can be used for training (with FMS and FCS as the criteria) or pain assessment (with SFMA as the criteria).
FMS was developed by a physiotherapist named Gray Cook [4]. It is a tool used to assess functional movement impairments based on proprioception, mobility, and stability. The FMS test is widely used for on-site evaluation due to its low cost, easy operation, and non-invasiveness. It consists of seven basic movements that subjects are required to complete. The subjects are scored based on the quality of their execution of these movements, aiming to identify any weaknesses or asymmetries in their fundamental motor skills. Due to its strict requirements on movements, potential problems with the subjects that are difficult to detect in their daily lives may be revealed. Weak or asymmetrical basic movements seriously affect the outcome of the training and increase the risk of training-induced injuries.
In recent years, many scholars have continuously improved and created new FMS evaluation methods. Spilz and Munz [5] used an architecture consisting of convolutional, long short-term memory, and dense layers. To optimize the performance of the network, the authors conducted extensive hyperparameter optimizations, training the network on data from different functional movement screening exercises and comparing the performance on unknown data from both known and unknown subjects. However, due to the authors’ extensive hyperparameter optimizations, the model may overfit against the training data and perform poorly on unknown data. Huang et al. [6] proposed a dual-stream multi-scale distillation convolutional neural network (CNN). This network first constructs different fine-grained representations of key features through multi-scale distillation modules and internal feature activation blocks. Then, it fuses adjacent layers through close-distance fusion to further extract and enhance multi-scale information. However, it increases the computational complexity of the network, especially in situations where a large quantity of computational resources are needed. Hong et al. [7] proposed an automatic FMS evaluation method based on an improved Gaussian mixture model (GMM). The authors trained the GMM using feature data with various scores. However, due to insufficient data feature extraction during the training performed by the author, the optimized results yielded poor performance in some special circumstances. Li et al. [8] proposed an indoor relocalization system based on a dual-stream CNN with color images and depth maps as network inputs. The distance information is incorporated into the network through the dual-stream architecture. Although the method proposed in the paper achieved significant results on some datasets, the performance was not satisfactory in certain special cases due to the limited size of the datasets.
To overcome the above challenges, this paper proposes an automatic evaluation method for functional movement screening that combines dual streams with feature fusion. The study combines the feature fusion methods of optical flow and RGB stream to address [5,6] the challenge of fusing RGB with dual streams in the case of an insufficient dataset scale and diversity, which makes training data features become more specific. According to [7,8], the deficiencies of poor training outcomes on unknown training sets, and unsatisfactory feature extraction, this study aimed to enhance the robustness of training results by achieving RGB and dual-stream fusion using some fusion methods from feature fusion. The core contributions of this paper can be summarized in the following three aspects, which involve innovation in data fusion techniques and its significant effects on performance improvement:
  • We combined the optical flow technique to extract dynamic information and color information from the RGB data in our data processing. This method not only focuses on the superficial features provided by static images, but also explores the underlying temporal dynamics in image sequences, providing a more accurate and comprehensive data foundation.
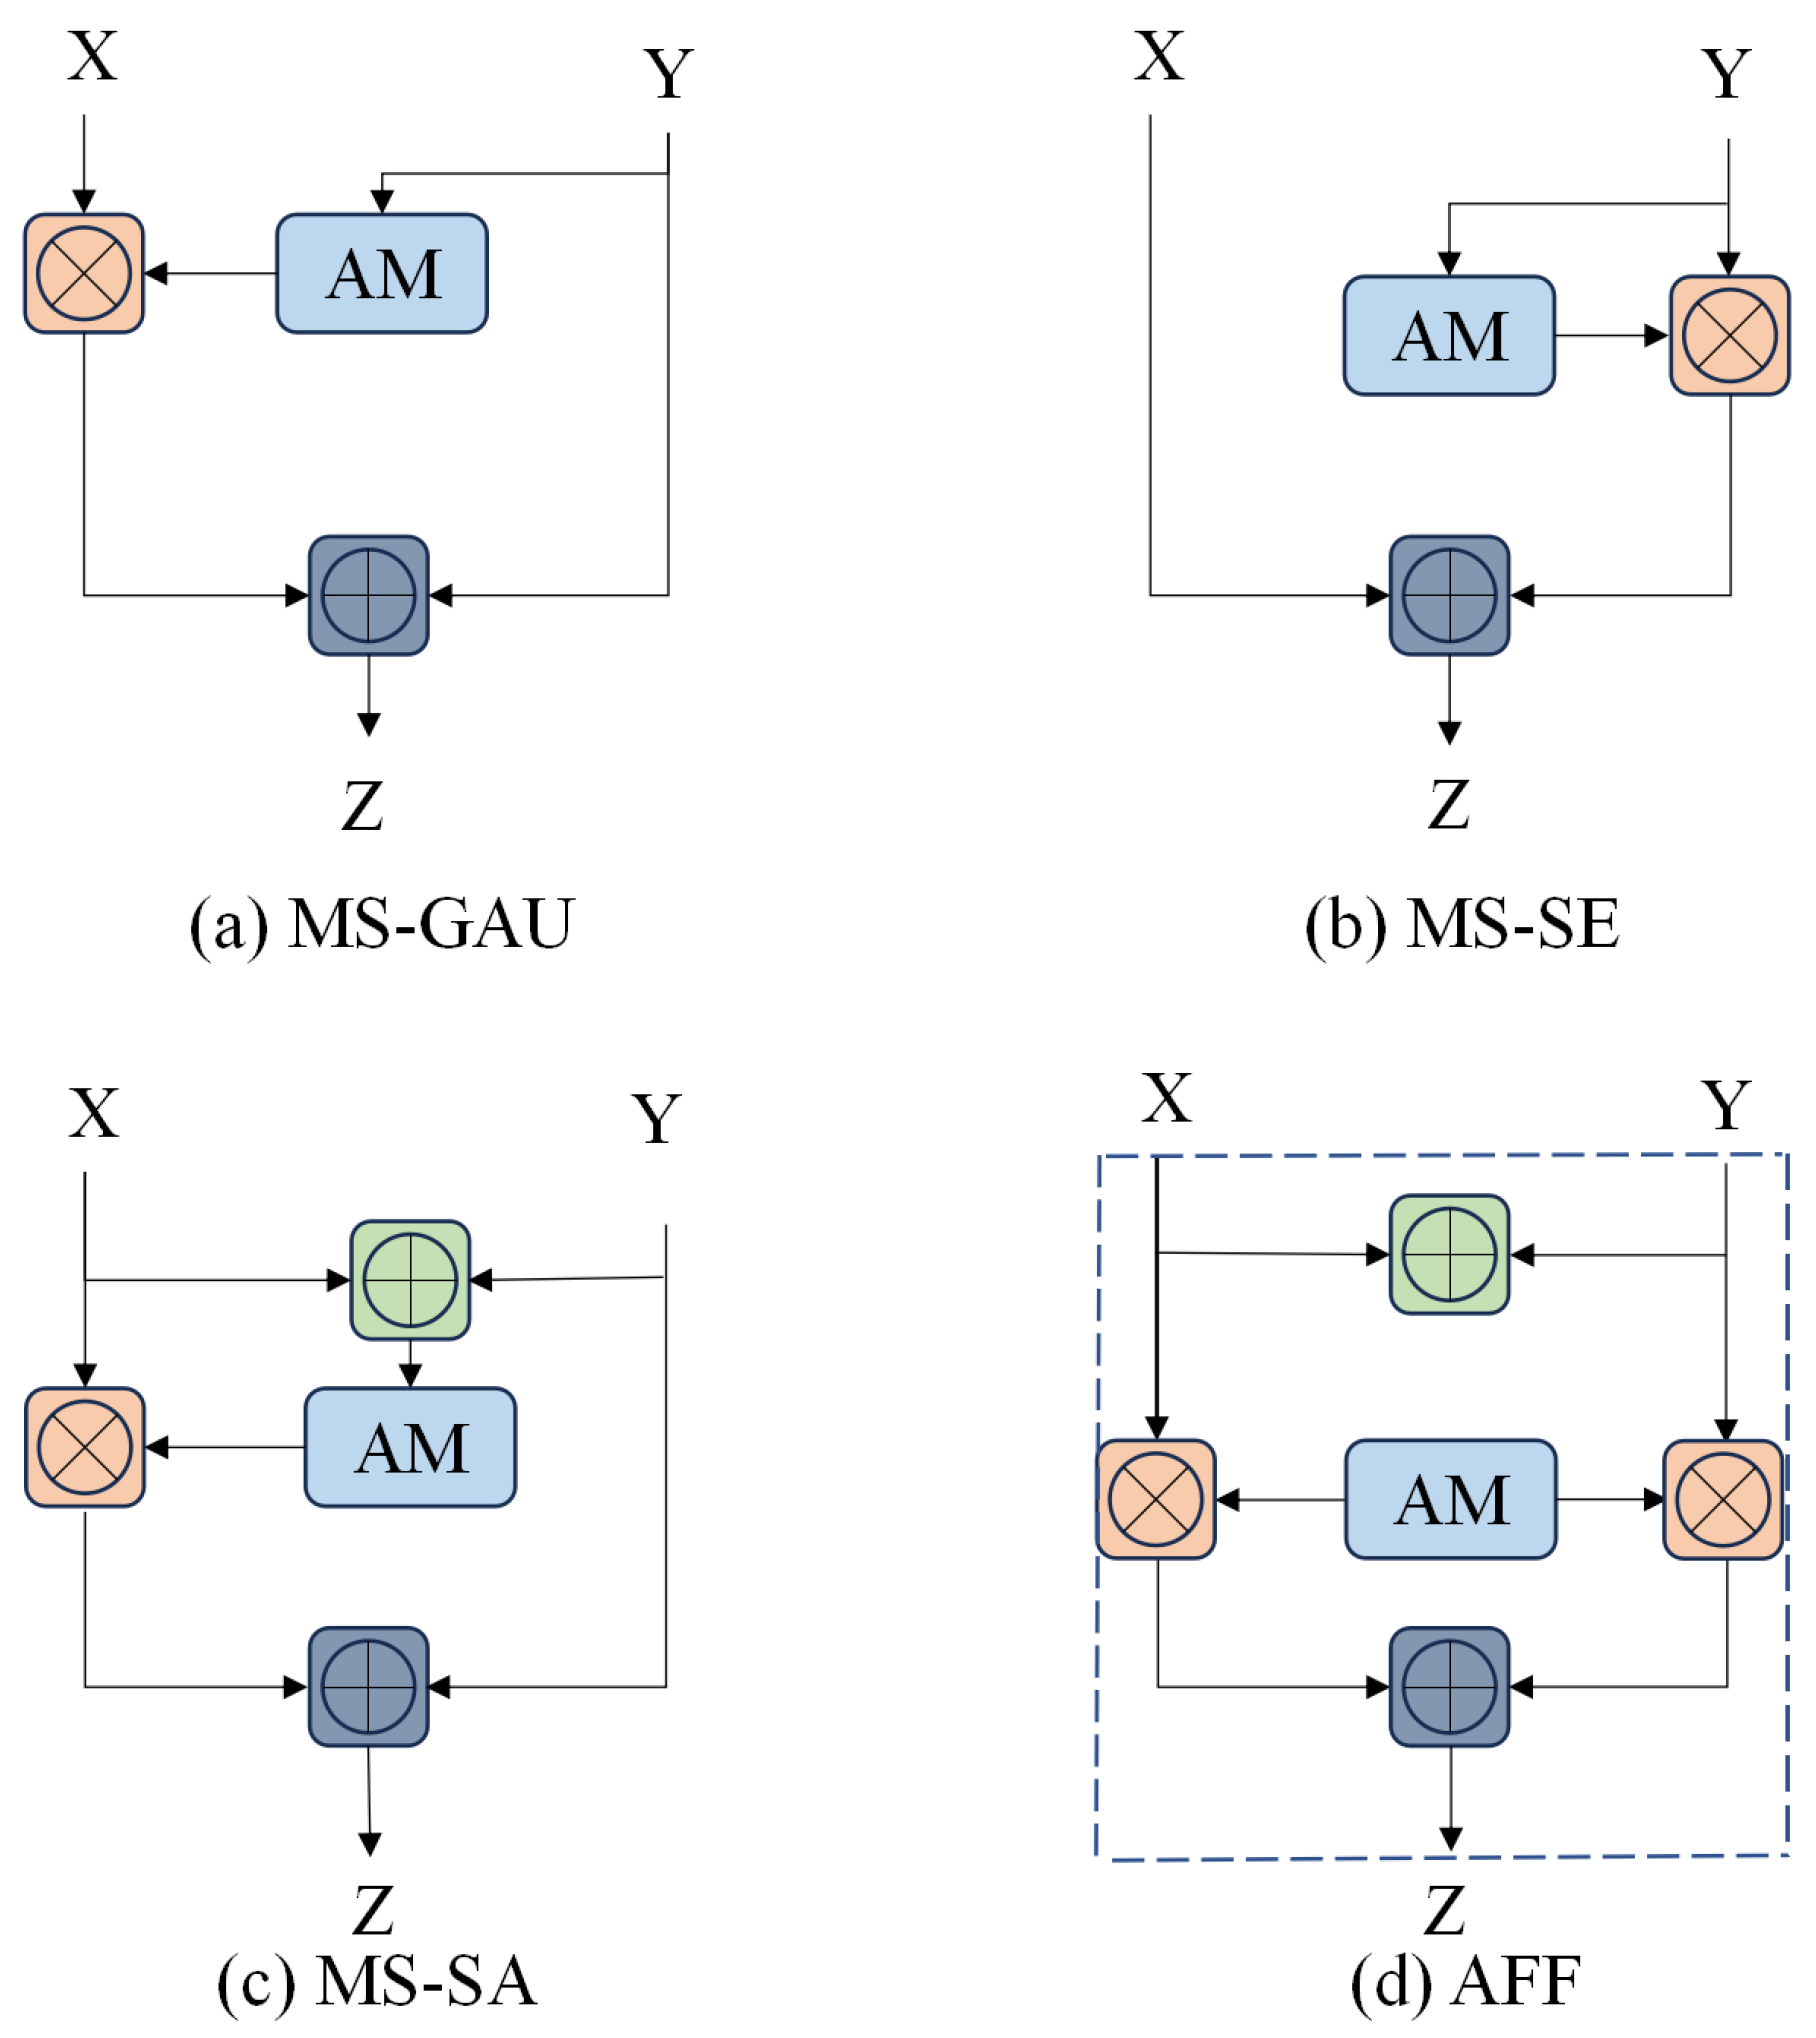
  • We propose a novel attention fusion strategy specifically designed for the features of dual-stream (optical flow and RGB) data. By introducing an attention mechanism, it effectively integrates two data streams, allowing the model to focus more on the key information while dealing with complex visual tasks. This method not only improves the efficiency of feature fusion, but also enhances the model’s adaptability to different data sources and the accuracy of information extraction.
  • Specifically, the comprehensive protocol we propose achieved a 4% increase in accuracy in experiments. This result not only proves the effectiveness of our method, but also provides a reliable means of improving performance in related fields.

2. Relevant Theories

Table 1 presents recent advancements in FMS and related work, with the work [9], which focused on the combination of attention mechanisms and FMS, being most closely related to our paper. However, our work shifts the focus to the integration of dual-stream networks and feature fusion with FMS.

2.1. Dual Streams

Dual streams refer to the concept of splitting a piece of data into two separate streams, each of which is processed by a separate neural network or processing module. These two streams typically focus on different types of features or information. For example, for audiovisual data, one stream focuses on audio data processing while another stream focuses on video data processing.
Simonyan et al. [13] introduced a dual-stream method, where they split a video into two parts, one being the spatial stream and the other being the optical flow. The two parts are fed into an identical network separately; finally, weighted averaging is performed to obtain the predictions, achieving some decent progress. The I3D model was first proposed in [14], which expands the traditional 2D CNN to the third dimension by adding a time dimension. Compared to [13], this model is able to learn deeper features and understand more complex movements.
Simonyan et al. [13] used a multi-frame dense optical flow-based time-flow CNN to extract optical flow, which is a traditional algorithm. Next, C et al. [15] proposed a method called TV-L1, which calculates optical flow based on total variation (TV) regularization and L1 norm. The key of this method is the top–down pyramid approach, which estimates flow in multiple scales from coarse to fine and utilizes energy optimization that iteratively minimizes an energy function to solve the optical flow. Its drawbacks are the slow speed and sensitivity to high-texture regions (namely, not accurate enough). Wang et al. [16] made some modifications to the optical flow fusion portion. They changed the simple and crude direct fusion into vector fusion, which resulted in a significant improvement in performance. Sun et al. [17] proposed a method called PWC-Net for optical flow extraction, which is a deep learning-based optical flow estimation network that uses CNNs to learn features and perform optical flow estimation. Its key technique lies in combining three key components–feature pyramids, flow warping, and cost volumes for optical flow estimation. It also uses a refined module for optical flow estimation to improve accuracy. Its drawbacks are that it relies heavily on training data and its performance is largely dependent on the quality and diversity of the training data. At the same time, it is very computationally intensive. Z et al. [18] proposed a new method called RAFT for extracting optical flow. This is a trainable optical flow estimation method. The core of this method is establishing correlations between all pairs of pixels and then recursively updating the flow field using iterative update operators. It shows performance superior to traditional methods.

2.2. Attention Mechanism

The SE (Squeeze-and-Excitation) [19] attention mechanism first performs a Squeeze operation, where it uses global average pooling to compress each channel of the feature map, resulting in a channel descriptor that captures global receptive field information. It then proceeds with the Excitation operation, utilizing two fully connected layers to learn the dependencies between channels and generate a set of weights. These weights are used to recalibrate the features of each channel. CBAM (Convolutional Block Attention Module) [20] consists of two sub-modules: CAM (Channel Attention Module) and SAM (Spatial Attention Module), which perform attention operations on the channels and spatial dimensions, respectively. This not only saves parameters and computational power but also ensures that it can be integrated into existing network architectures as a plug-and-play module. We conducted experiments comparing the methods of feature fusion using SE and CBAM. Additionally, ResNet implements a non-local [21] attention mechanism, which directly captures long-range dependencies by computing interactions between any two positions, without being limited to adjacent points. This is analogous to constructing a convolution kernel of the same size as the feature map, thus maintaining more information. We have also compared our approach with the method using ResNet with non-local attention.

2.3. Feature Fusion

Feature fusion refers to the concept of combining features from different sources or different types of data to improve the performance of a model or the accuracy of decision-making. Its goal is to integrate multiple feature sets, making the fused features more effective and information-rich than any single feature.
The following several feature fusion methods are typically used for optical flow:
Simple concatenation: Different feature sets are directly concatenated to form a longer feature vector. There is no need to use complex algorithms, and all original feature information is preserved.
Weighted fusion: Different weights are allocated to different feature sets, and then weighted averaging or weighted combination is performed. By reflecting the importance of different features through weights, the sensitivity of the model to key features is enhanced.
Model-driven fusion: Machine learning models (e.g., neural networks) are used to learn how to effectively combine different features.
Decision-level fusion: Feature fusion occurs at the decision-making level of the model, for example, through a voting system or multi-model integration. The advantage of this method is improved robustness of the model. It reduces the risk of overfitting by integrating multiple models, and it can combine the strengths of different models to enhance overall performance.
Based on the above-mentioned methods, this study adopted an attention mechanism-based feature fusion method. Specifically, we used a relatively simple model-driven fusion method, which only requires one attention mechanism in the fusion process, while implementing the fusion operations through incorporating three feature fusion methods, namely, MS-GAU, MS-SE, and MS-SA in the Multi-Scale Channel Attention Module (MS-CAM) proposed in [22]. For comparison with the methods mentioned in this article, we adopted the SE attention mechanism for feature fusion.
In this study, three feature fusion methods mentioned above were implemented based on SE, with two feature maps X , Y R C × H × W considered, where X represents the RGB stream feature map extracted from consecutive frames, and Y represents the corresponding optical flow feature map. Normally, we assume that the optical flow feature map Y has a larger receptive field, which means it can capture broader motion information. Based on the SE attention module, the three fusion methods mentioned above can be represented as follows:
Z = A M ( Y ) X + Y
Z = A M ( Y ) Y + X
Z = A M ( Y + X ) X + Y
where Z R C × H × W represents feature fusion, + represents initial feature integration, and A M represents the SE attention module. MS-GAU, MS-SE, and MS-SA are shown in Figure 1a–c, where (a) represents the multiplied fusion of optical flow and RGB flow through the AM layer; (b) represents self-fusion with a focus on optical flow; (c) represents weighted fusion of optical flow and RGB flow through the AM layer, followed by multiplied fusion with the original RGB flow.
Although there are many differences in implementation between various methods for feature fusion in different scenarios, once abstracted as mathematical forms, these differences in detail disappear. Therefore, to be applicable to most common scenarios, [22] proposed a unified general protocol called Attention Feature Fusion (AFF), as shown in Figure 1d, where the dotted line represents 1 A M ( X + Y ) . Based on SE, AFF can be represented as follows:
Z = A M ( X + Y ) X + ( 1 A M ( X + Y ) ) Y

2.4. I3D Infrastructure

Joao and Andrew [14] proposed I3D, demonstrating how 3D benefits from ImageNet’s 2D design and how it benefits from their learning parameters. They adopted two types of flow configurations. Although 3D ConvNets can directly learn temporal patterns from the RGB stream, their performance can still be greatly improved by including an optical flow.
Deep learning requires the full utilization of the spatiotemporal information of movements in videos for movement recognition. In order to fully utilize the spatiotemporal features in videos to improve the accuracy of movement recognition and save relevant information at a lower cost, a spatiotemporal feature fusion movement recognition framework using a sparse sampling scheme is proposed. Sparse sampling is used to obtain the RGB image and optical flow map of the video, which are then input into the VGG-16 network to extract the spatiotemporal features of the video. The fusion spatiotemporal CNN is used to extract intermediate spatiotemporal fusion features, which are then input to the C3D CNN to recognize the classification of the movements. The experimental results from the HMDB51 and UCF101 datasets show that the framework can make full use of the temporal and spatial information of videos, achieving a high accuracy in movement recognition.
In this study, the I3D network was used to extract video features in the temporal and spatial dimensions at different scales and levels. Each input video is first split into S parts. Then, a few frames are selected from each part to create a clip. Next, the S clips representing the entire video are input into a 3D-CNN. The 3D-CNN extends 2D-CNN in the temporal dimension and is more suitable for capturing three-dimensional data features in videos. The 3D-CNN weights are the same for all clips.

3. The Protocol Proposed in This Paper

The network structure proposed in this paper is shown in Figure 2. The FMS video stream to be tested is input into the network. Afterwards, the video stream is input into the network in the form of a sliding window, and the RGB stream of the video is extracted. Furthermore, the RAFT algorithm is used to process video optical flow estimation. This generates a set of optical flow images that represent the motion between consecutive frames of a video. These optical flow images are then input into the I3D model, aiming to capture spatiotemporal features from the image sequence. The original video frames are also processed by the same I3D model to capture spatial features. However, it should be noted that the optical flow information is not included in the model for training and updating parameters.
Then, the attention mechanism is used to combine the features extracted from the optical flow by the I3D model with the original frames. The attention mechanism allows the network to focus on the most relevant parts of the input data, potentially improving the accuracy of predictions. Subsequent experiments showed that this concise fusion protocol had improved performance compared to many more complex fusion protocols. The combined features are further transformed in their feature representation through MLP. Then, the output of the MLP is sent; the output could be the name of a specific process or a placeholder for parts of the model whose function has not been defined. Finally, the processed data are used for score prediction, which indicates that the model is designed to evaluate input video frames and generate scores, potentially as part of a classification or regression task. This network structure combines optical flow information with spatiotemporal features of the original frames for prediction. Before the final prediction, a three-dimensional CNN and attention mechanism are used to refine the feature representation.

3.1. Data Preprocessing

In this paper, we resized images using different interpolation algorithms based on randomly generated 4 numbers between 0 and 3. We used four different interpolation methods, including nearest neighbor interpolation, bilinear interpolation, bicubic interpolation, and Lanczos window interpolation. To ensure data consistency, we normalized the data using the probability density function (PDF) of the normal distribution, thus making the sum of all the data equal to 1. In the process of obtaining image sets, we created a multivariate combination, which includes center cropping, conversion to tensors, and normalization. In addition, image enhancement was performed by using temporal and spatial enhancement techniques to improve the overall outcome of the experiment. Each movement was further divided into left and right sides. Upon examining the dataset, it was found that there were too many videos with a score of 2. To achieve better results, we selected the dataset for 8 movements: M01, M03, M05, M07, M09, M11, M12, and M14, and we only analyzed the left side of the body. The train set comprised 276 videos. The test set consisted of 90 videos.

3.2. Feature Extraction

In the feature extraction, we used the I3D model as the main network, which inflates the 2D curve network into 3D. Instead of repeating the process of spatiotemporal modeling, it simply converts the successful image (2D) classification model into a three-dimensional ConvNet to capture information in the temporal dimension.
In the method in this paper, two independent streams are used: the RGB flow branch is used to extract visual features for each frame, while the optical flow branch is used to extract features of surrounding pixels using RAFT, build a multi-scale 4D correlation space for all pixel pairs, and iteratively update the optical flow field through the GRU recurrent units to simulate the iterative optimization process in traditional methods. These two branches are finally merged at the feature level to obtain a comprehensive feature representation that includes both appearance and motion information. This dual-stream architecture allows the models to simultaneously consider the spatial and temporal characteristics of the video, thus enabling a more accurate understanding and classification of the movements in the video.

3.3. Dual-Stream Fusion Protocol

Previously we introduced four feature fusion techniques in detail: multi-scale channel attention fusion (MS-GAU), multi-scale spatial expansion (MS-SE), multi-scale spatial attention (MS-SA), and adaptive feature fusion. Inspired by these methods, this paper proposes an innovative fusion strategy, whose core idea is embodied in Formula (5):
Z = X A M ( Y )
This strategy adopts the basic framework mentioned earlier and integrates the optical flow and RGB flow obtained from the feature extraction process mentioned in Section 2.2. By using the attention mechanism only once, we achieved an effective fusion of these two streams and generated a comprehensive feature representation.
The introduction of the attention mechanism module enables the model to focus attention on movement changes in the data and improves model performance and generalization ability. This method in this paper provides an efficient, concise, and effective way to merge different feature representations while preserving the interpretability and flexibility of the model. This method is particularly suitable for computing environments that require real-time performance and have limited resources, effectively handling video features and playing an important role in FMS.

3.4. Score Prediction

In the model proposed in this paper, a four-class classification system is used to predict score distribution. By analyzing patterns and trends in the dataset, the model is able to effectively categorize the observations into predefined score intervals.

3.4.1. Gaussian Distribution of the Initial Data

In the last fully connected layer, there are 4 outputs representing the four levels that comply with the FMS scoring criteria. During the data preprocessing stage, the label data are transformed into a score distribution and processed using a Gaussian function. Formula (6) represents the probability density function value of the true score.
g ( c ) = 1 2 π σ exp ( ( c s ) 2 2 σ 2 )
s represents the mean of the initial label scores for data, and σ represents the standard deviation. The scores are discretized at intervals as c = [ c 1 , c 2 , c 3 , c 4 ] . The magnitude of each score is described as g ( c ) = [ g ( c 1 ) , g ( c 2 ) , g ( c 3 ) , g ( c 4 ) ] , representing probability density values. Then, the probability density function values are normalized to obtain the normalized probability values.
t m p i = g ( c i ) j = 1 4 g ( c j )

3.4.2. Kullback–Leibler (KL) Divergence

In this paper, numerical representations of two image features are obtained by extracting features of optical flow and spatial flow. KL divergence is a measure of the difference between two probability distributions. In the KL loss, the standard deviation of the assumed Gaussian distribution is an unknown parameter that the network needs to learn to estimate. KL divergence is only the expectation of the logarithmic difference between the probabilities of the data in the original distribution and the approximate distribution. It has both a probability distribution p and an upper approximation distribution q.
D K L ( p q ) = i = 1 N p ( x i ) ( log p ( x i ) q ( x i ) )

4. Experiment

4.1. Data and Experimental Environment

The dataset used in the paper was constructed by Xing et al. [23]. The data were collected by two Azure Kinect depth cameras from 45 subjects aged between 18 and 45 years. The dataset includes exercises such as squat, hurdling, split squat, shoulder mobility, straight leg raise, trunk stability push-up, and rotary stability. We split the dataset based on [9]. The experiment ran on a server utilizing cloud computing power, with AutoDL. The running environment was as follows: 32 vCPU, AMD EPYC 9654, 96-core processor, 120 G internal storage, two GPUs: RTX 4090 (24 GB), PyTorch v1.10.0, Python v3.8 (ubuntu20.04).

4.2. Evaluation Metrics

The evaluation metrics in this paper include accuracy, ma F 1 , and Kappa coefficient.
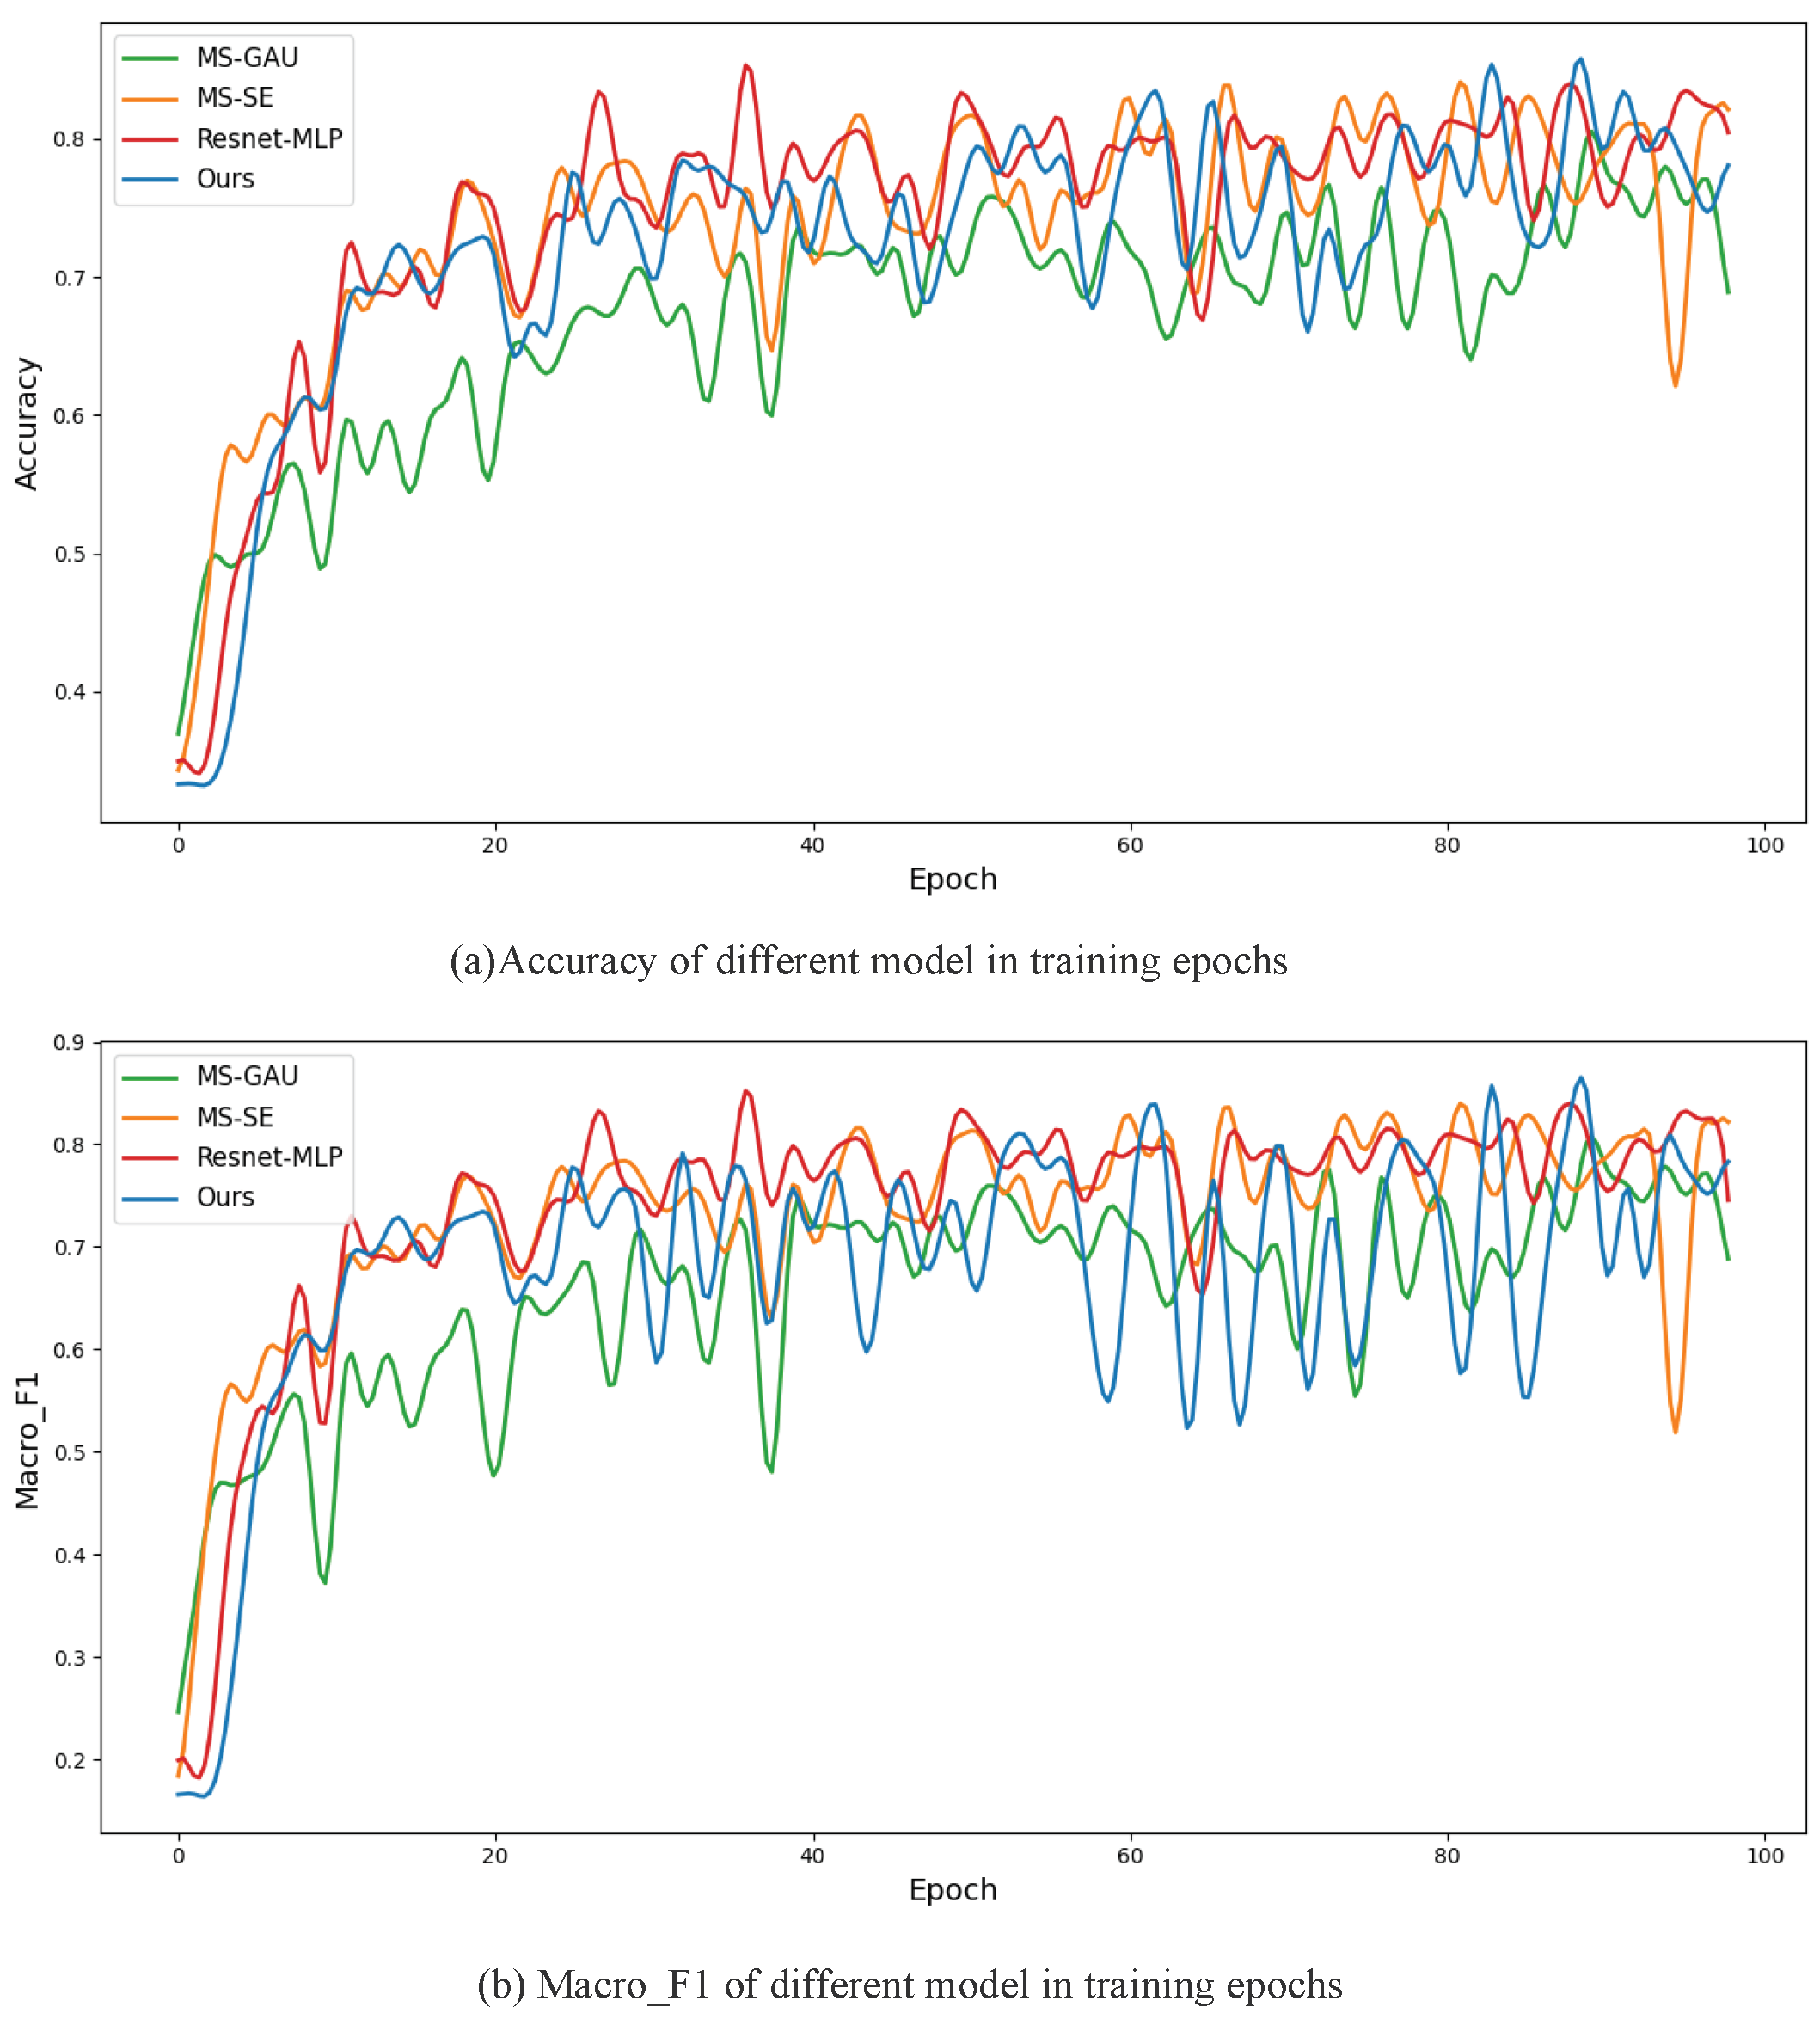
  • Accuracy: Accuracy serves the purpose of providing a quick and intuitive evaluation of performance, informing us of how well the model performs on the entire test set. As shown in Formula (9), P r e i represents the number of correct classes for the i-th classification, 4 represents the number of classes, and N represents the total number of samples.
    A c c u r a c y = i = 1 4 P r e i N
  • Macroscopic F 1 (ma F 1 ): When we are dealing with multiclass problems, we usually need an evaluation metric to measure the average performance of the model across all classes. F 1 is the macro score. We first calculate the F 1 score for each class and then calculate the mean of these scores. As shown in Formula (10), N represents the total number of classes, and F 1 represents the score of the i class.
    ma F 1 = i = 1 N F 1 i N
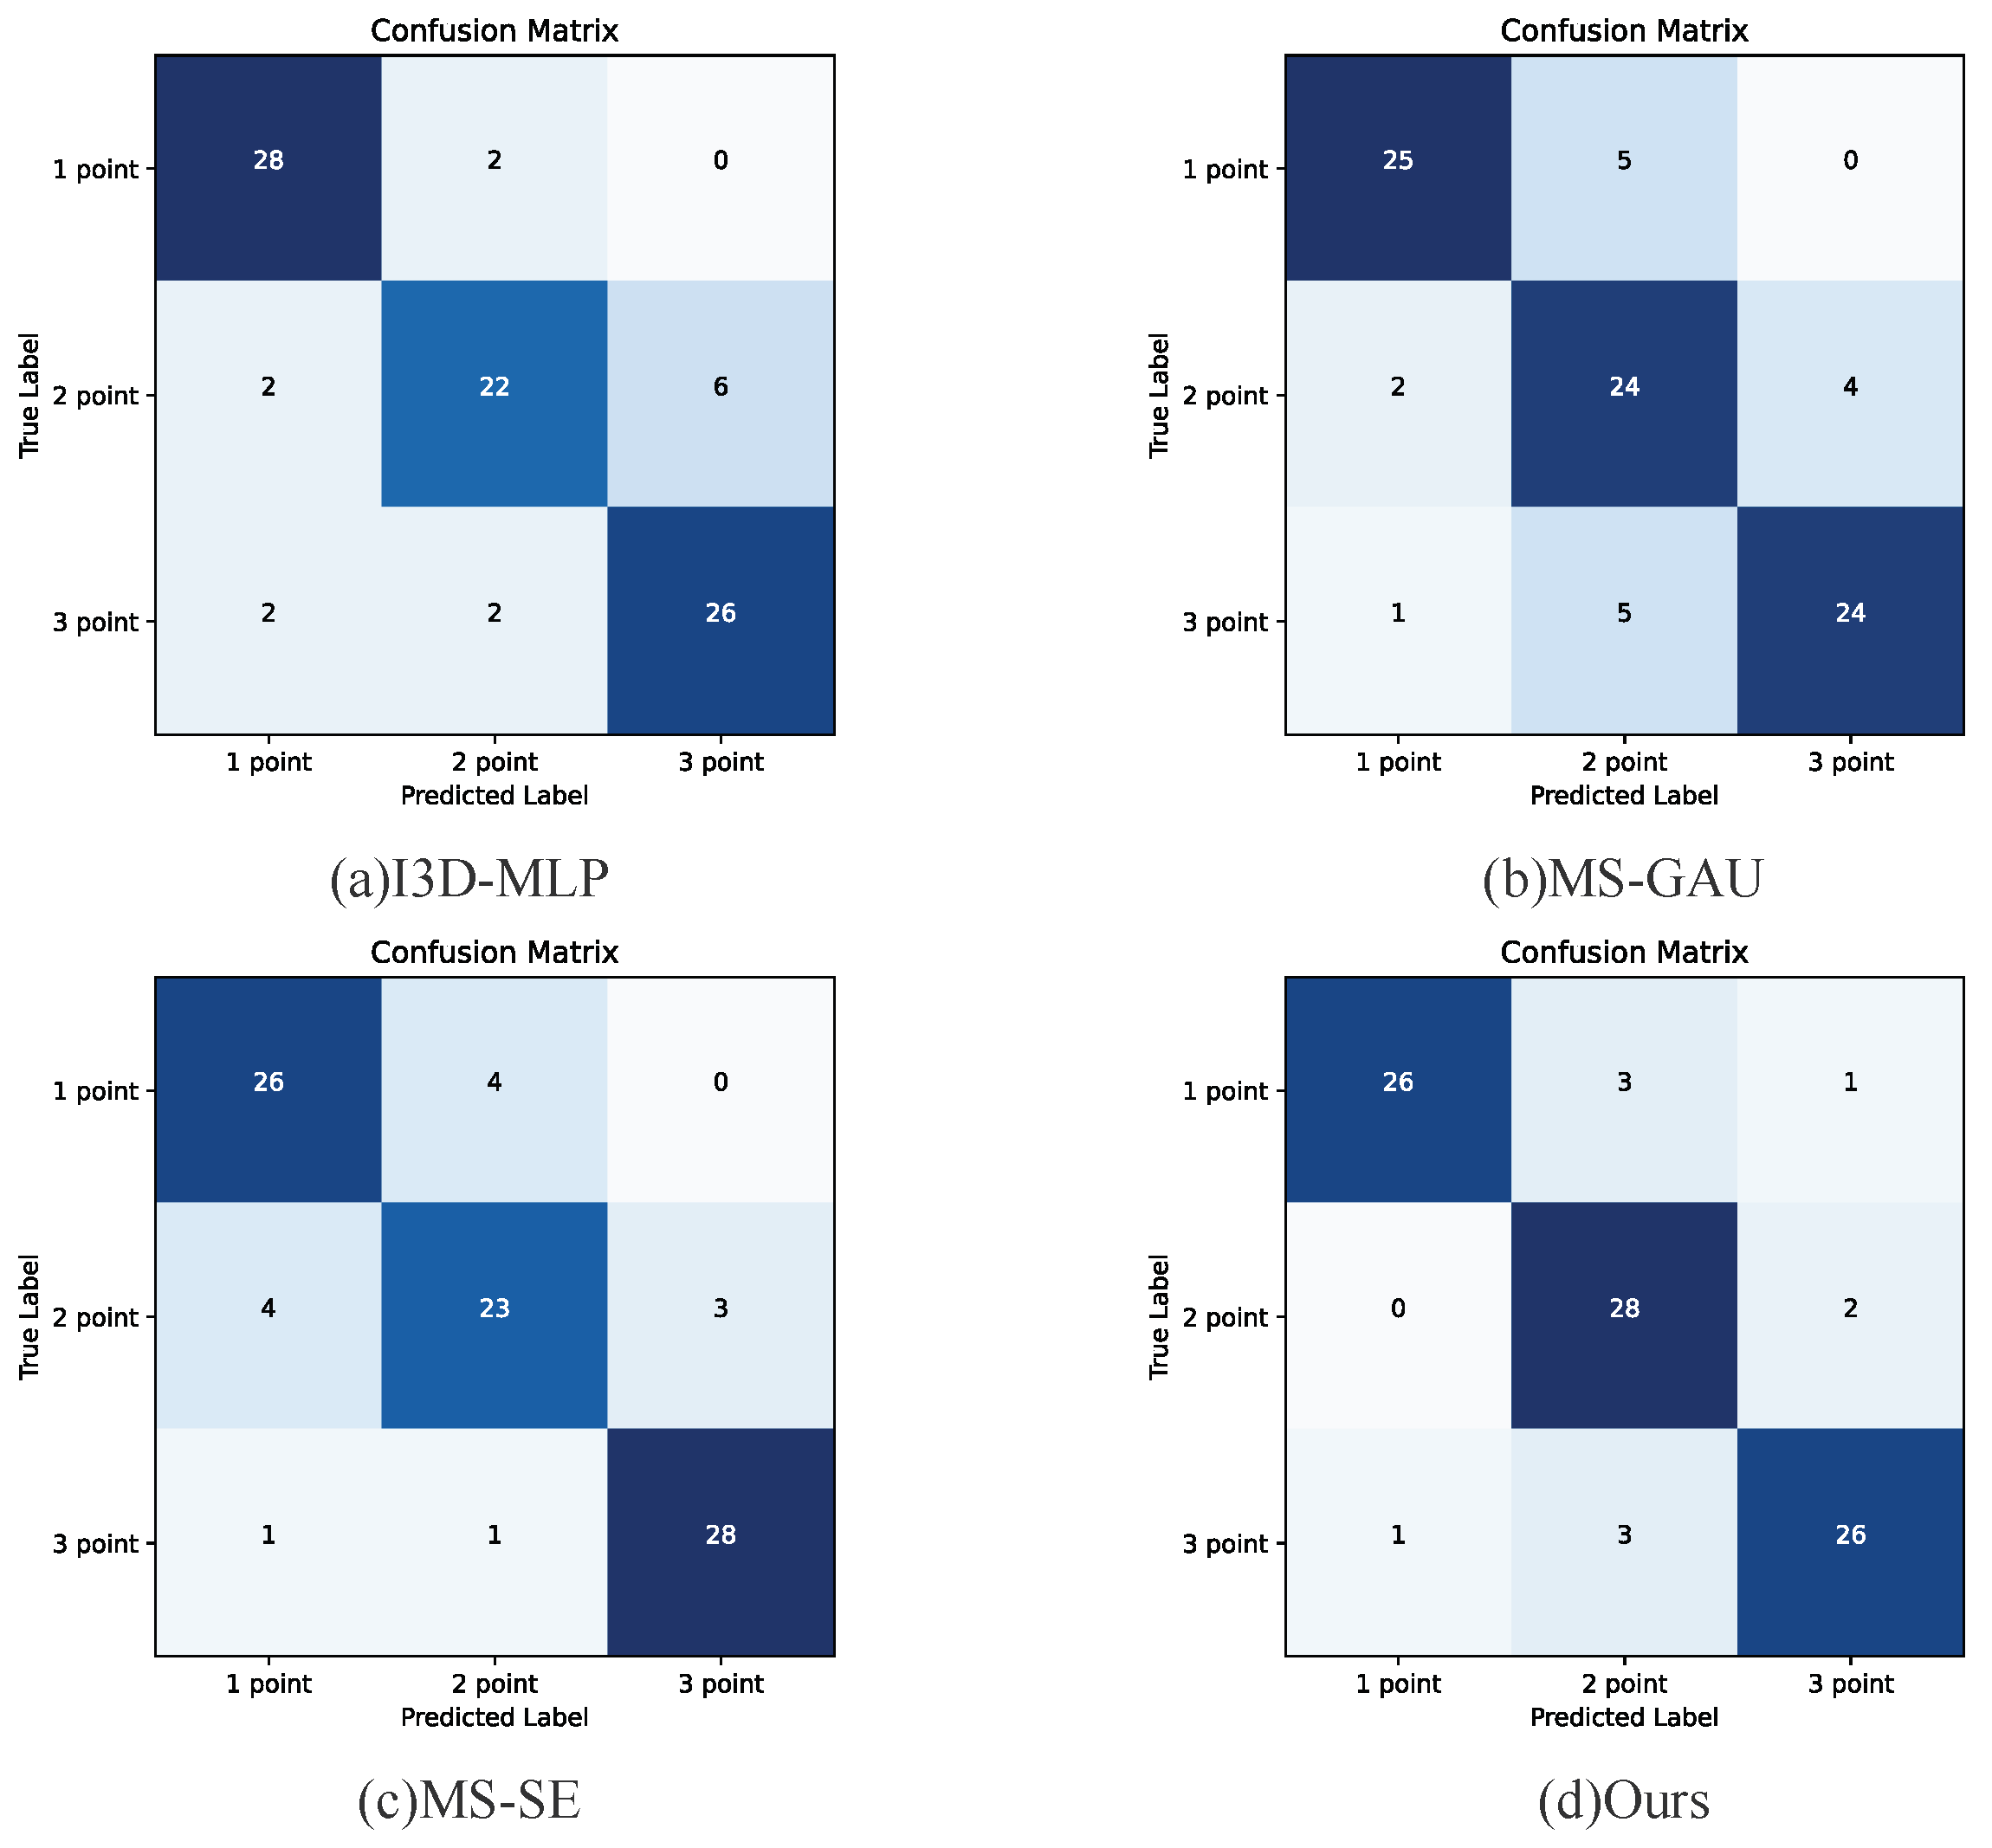
  • Kappa coefficient: It is a statistical measure used to assess the agreement between two evaluators or models in a classification task, taking into account chance agreement. It can be used to measure the consistency between predicted values and actual labels. In classification problems, the most common evaluation metric is Accuracy, which directly reflects the proportion of correct classifications and is computationally straightforward. However, in real-world classification tasks, the number of samples in each class often tends to be imbalanced. When dealing with such imbalanced datasets without adjustment, models can easily be biased towards the majority class at the expense of the minority class. In such cases, a metric is needed that penalizes this “bias” in the model rather than just using accuracy. The kappa coefficient, calculated based on a formula that accounts for chance agreement, provides a lower score for more imbalanced confusion matrices. Consequently, models with a strong “bias” toward the majority class receive lower kappa scores, appropriately reflecting their shortcomings in capturing the minority class. The formula for calculating the kappa coefficient is shown as Formula (11):
    K = P o P e 1 P e
    where P o represents the observed consistency (namely, proportion of correct predictions for the model, consistent with Formula (7)), and P e is the expected consistency due to random chance. P e is calculated based on the probability of random prediction in each class.

4.3. Experiment and Result Analysis

In our experiment, we set multiple parameters to control the training and evaluation of the model. The learning rate “lr” was set to 0.0004 , and the L2 weight decay “weight_decay” was set to 0.00005 . These two parameters control the learning process and complexity of the model.
To ensure experiment reproducibility, we set the random seed “seed” to 1. During the data loading process, we set the number of subprocesses “num_workers” to 8 to improve data loading efficiency. The parameter “gpu” is used to specify the GPU device to be used, which can improve the training speed of the model. We set batch sizes “train_batch_size” and “test_batch_size” (with default values of 8 and 20) separately for the training and testing phases. The number of training epochs “num_epochs” was set to 100, which determined the duration of the model training.
During each training epoch, our model is first trained on a training set and then tested on a test set. During the training phase, the model parameters are updated based on the loss function. During the testing phase, the Spearman rank correlation coefficient of the model’s predicted scores and true scores is calculated to evaluate the performance of the model. If the performance of the model exceeds the previous best performance, the current model parameters will be saved.

4.3.1. Comparative Experiment Analysis

In this section, we compared our method with current popular video quality assessment algorithms and conducted an empirical analysis using the FMS dataset. Based on complete experimental data, as shown in Figure 3, (a) and (b), respectively, represent the data changes in Macro_ f 1 and Accuracy in MS-GAU, MS-SE, RESNET-MLP, and our method. The horizontal axis (Epoch) of the coordinate system represents the number of training epochs for all samples in the training set, and the vertical axis of (a) and (b), respectively, represents the values of the two evaluation metrics mentioned above. The experimental method in this paper reached its optimum at the 89th epoch, with Macro_ f 1 and Accuracy reaching 88.89% and 88.95%, respectively. It can be seen from the figure that when training using MS-SE along with our method, the fitting speed is fast. However, when using MS-GAU and RESNET-MLP, the fitting speed is too slow. This indicates that self-fusion using optical flow can better extract the spatiotemporal features of FMS. In addition, the method proposed in this paper is more stable in terms of the variation in evaluation metrics during the training process compared to MS-SE.
As shown in Figure 4, the x-axis represents the predicted scores of the model, while the y-axis represents the actual scores. The terms “1 point”, “2 point”, and “3 point” correspond to the three levels of FMS scoring. The “0 point” is considered abnormal and should be directly ignored. The sum of elements in each row in the figure reflects the actual number of samples in the corresponding class. By comparing the results of four different methods (with the diagonal representing the correct matched class), we can clearly see that the protocol proposed in this paper has the highest number of correct recognitions (26, 28, and 26, respectively). This result demonstrates that the method yielded performance superior to the other three leading techniques and shows more excellent classification outcomes than those of the other two feature fusion protocols, MS-GAU and MS-SE. This result confirms the high accuracy and reliability of our model in understanding and evaluating movements. We believe that this improvement in performance is due to the model’s ability to capture fine-grained dynamic features and effectively encode complex movement sequences. This will help further enhance the performance and usability of the model in future research.
By further comparing the experimental results, as shown in Table 2, we found that our method had an accuracy improvement of 4.45% and a significant improvement in maF1% and Kappa indicators of 4.42% and 6.67%, respectively, when compared with I3D-MLP. In addition, compared to the RESNET-MLP, which comes with a non-local self-attention mechanism, our method yielded a significant improvement, indicating that the protocol proposed in this paper not only focuses on spatial relationships but also takes care of the temporal information in the time series. These compelling data provide sufficient evidence of the outstanding performance and clear advantages of our method on the FMS dataset.
The comparison of model parameters and computational cost for the proposed model is presented in Table 3. FLOPs refers to the number of floating-point operations, with “s” indicating seconds, meaning the number of floating-point operations per second, which is a standard measure of a network model’s computational cost. Params denotes the total number of parameters that need to be trained in the network model. As can be seen from the table, our method is comparable to the classic I3D-MLP, with the main difference being in the number of parameters due to the attention mechanism module.
The activation histograms for the MLP layers of the model are presented in Figure 5. Both models have four layers in their MLP, with the linear layer sizes changing as [1024, 512, 256, 128, 4]. The horizontal axis represents the activation values of the neural network layers, which are the outputs of the neurons. The vertical axis indicates the frequency of occurrence of neuron outputs within a specific activation value or range of activation values. Typically, it is desirable for activation values to have a certain level of diversity, avoiding concentration on specific values. However, as seen in Figure 5, the activation values in Figure 5b are more concentrated compared to those in Figure 5a, yet the model’s performance is better. This suggests that the model has learned effective feature representations within specific activation ranges. Even if the activation values are concentrated, as long as they can effectively distinguish between different classes, the model’s performance can still be good. The model uses ReLU activation functions, which alleviate the vanishing gradient problem and allow the network to learn deep representations. Even if the activation values appear concentrated in some layers, the overall network is still able to effectively propagate gradients and learn.

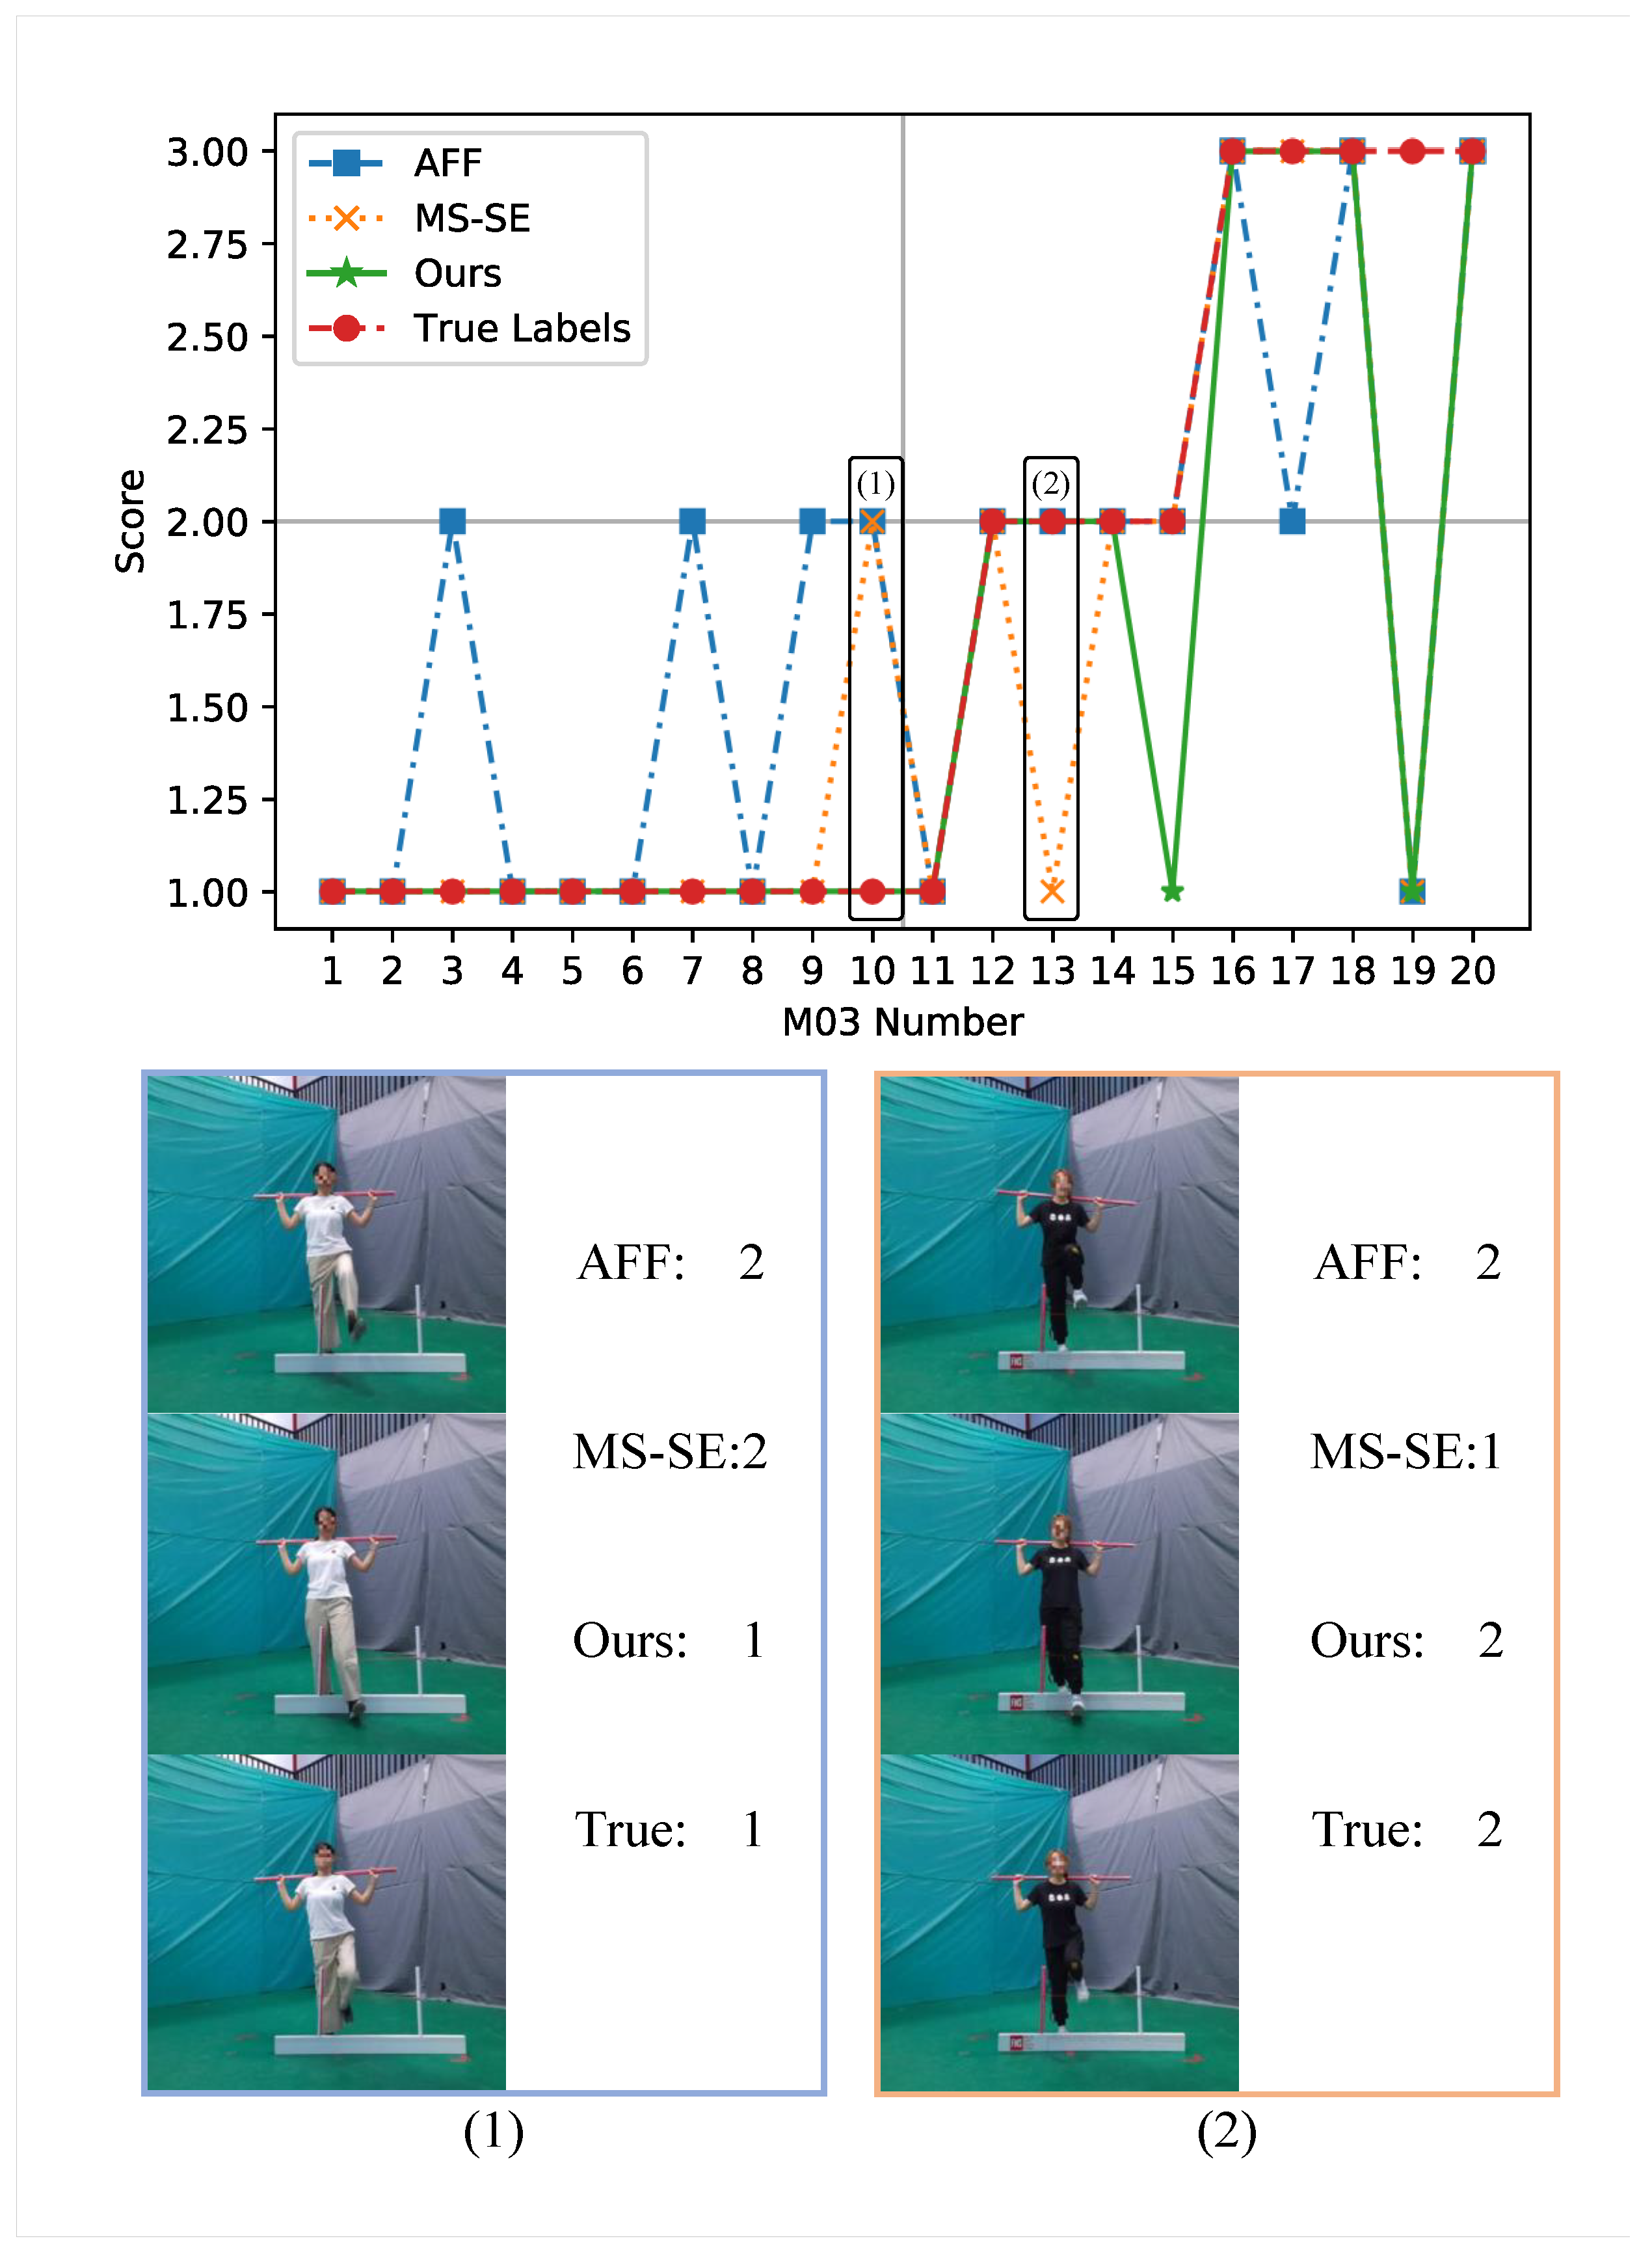
4.3.2. Visualization Experiment Analysis

To demonstrate the comparison of our method with other protocols, we selected 20 results from the M03 class movements for visualization and compared them with the AFF and MS-SE methods. As shown in Figure 6, the line graph above shows the results of AFF, MS-SE, Ours, and the ground truth labels. By observing the results in the graph, we can see that the AFF method shows significant deviations from the ground truth labels at multiple points. This indicates that this complex fusion method is not suitable for the merging of dual streams in FMS. On the contrary, the method proposed in this paper can better match the ground truth labels, with only a few errors observed in classification 3. Figure 6. Examples of movements in two subjects classified using the method proposed in this paper. In (1), the movements of the subjects that should be assigned a score of 1 are misclassified as a score of 2 by AFF and MS-SE. In (2), the movements of the subjects that should be assigned a score of 2 are misclassified as a score of 1 by MS-SE. In contrast, the method proposed in this paper can accurately recognize cases where the subject’s foot is not placed flat in movement M03 and assign a score to the movement in the correct classification.

4.3.3. Ablation Experiment Analysis

In this study, the contribution of feature fusion to model performance was investigated through ablation experiments. The role of feature fusion in the model mainly lies in how to effectively combine features from different sources or types for the model to learn and generalize better. As shown in Table 4, models that incorporate feature fusion have a higher accuracy, maF1, and Kappa coefficients than models without feature fusion, even when they have the same number of MLP layers. This indicates that introducing an attention mechanism has a significant positive impact on the performance of the model. In addition, this paper introduces four attention feature fusion methods and combines our method with the MS-SE method, which has the best model performance. The accuracy, maF1%, and Kappa metrics were improved by 4.45%, 4.42%, and 6.67%, respectively. In addition, the effects of the Convolutional Block Attention Module (CBAM) [20] and SE attention fusion were compared. Compared with CBAM, the effect of the SE fusion improved Accuracy by 3.33%, and it improved maF1% and Kappa indicators by approximately 24% and 5%, respectively. The model achieved an optimal performance. The experimental results show that the feature fusion method helps models achieve better performance on complex tasks. Feature fusion using attention mechanisms can strengthen the importance of key features. The model can learn to assign higher weights to those features that are most useful for predicting tasks, while ignoring less important features, thus improving the accuracy and consistency of classification for the model.

5. Conclusions

In this paper, we propose a novel approach to input the FMS video stream to be tested into a network for further processing. First, the video stream is input into the network in the form of a sliding window, and the RGB stream of the video is extracted. Next, the RAFT algorithm is used to estimate the optical flow of the video, generating a set of optical flow images that represent the motion between consecutive frames. Further, we input these optical flow images and original video frames into the I3D model to capture spatiotemporal and spatial features. It is worth noting that although optical flow information plays an important role in the feature extraction stage, we did not use optical flow information to update parameters during the model training process.
We also employed an attention mechanism to combine the features extracted from the optical flow with the original frames. This mechanism allows the network to focus on the most relevant parts of the input data, thereby improving the accuracy of predictions. Subsequent experiments verified that this concise feature fusion protocol significantly improved the performance compared to many complex fusion protocols. After feature fusion, we used MLP to further transform the feature representation and then used the output of the MLP for subsequent prediction tasks.
The I3D model used in the work has a large number of parameters. In a future work, we will attempt to generalize and lighten the model structure to adapt it to more datasets and scoring tasks. Additionally, we can introduce the popular Transformer model architecture to improve the FMS automatic evaluation method, achieving a finer-grained assessment.

Author Contributions

Methodology, X.L.; Validation, R.C., C.F., Z.C. and H.C.; Formal analysis, X.Y.; Writing—original draft, X.L.; Writing—review & editing, X.Y. and H.C. All authors have read and agreed to the published version of the manuscript.

Funding

This work was supported in part by the National Natural Science Foundation of China (62277010, 62302203), Science and Technology Project of Fuzhou Institute of Oceanography (2023F03), Fuzhou-Xiamen-Quanzhou National Independent Innovation Demonstration Zone Collaborative Innovation Platform Project (2022FX6), Fujian Province Education Science 14th Five-Year Plan 2022 Ollaborative Innovation Special Project (Fjxczx22-450), Fujian Institute of Education Special Research Project on Training Reform (2023PX-06) and the Fujian Provincial Health Commission Technology Plan Project (2021CXA001).

Data Availability Statement

No new data were created or analyzed in this study.

Acknowledgments

During the preparation of this work, the authors used GPT-4 in order to polish it. After using this tool, the authors reviewed and edited the content as needed and take full responsibility for the content of the publication.

Conflicts of Interest

The authors declare no conflicts of interest.

References

  1. Cook, G.; Burton, L.; Hoogenboom, B.J.; Voight, M. Functional movement screening: The use of fundamental movements as an assessment of function-part 2. Int. J. Sport. Phys. Ther. 2014, 9, 549. [Google Scholar]
  2. Glaws, K.R.; Juneau, C.M.; Becker, L.C.; Di Stasi, S.L.; Hewett, T.E. Intra-and inter-rater reliability of the Selective Functional Movement Assessment (SFMA). Int. J. Sport. Phys. Ther. 2014, 9, 195. [Google Scholar]
  3. Kim, C.Y.; Kang, T.; Kim, B.H.; Lee, S.Y. Y-balance Test. Korean Soc. Sport Biomech. 2019, 29, 33. [Google Scholar]
  4. Cook, G.; Burton, L.; Hoogenboom, B. Pre-Participation Screening: The Use of Fundamental Movements as an Assessment of Function—Part 1. N. Am. J. Sports Phys. Ther. NAJSPT 2006, 1, 62–72. [Google Scholar] [PubMed]
  5. Spilz, A.; Munz, M. Automatic Assessment of Functional Movement Screening Exercises with Deep Learning Architectures. Sensors 2022, 23, 5. [Google Scholar] [CrossRef] [PubMed]
  6. Huang, Q.; Chen, Y.; Li, C.; Wang, Y.; Li, Q. Dual-Stream Multi-Scale Distillation Network for Human Action Recognition. SSRN, 2023; preprint. [Google Scholar] [CrossRef]
  7. Hong, R.; Xing, Q.; Shen, Y.; Shen, Y. Effective Quantization Evaluation Method of Functional Movement Screening with Improved Gaussian Mixture Model. Appl. Sci. 2023, 13, 7487. [Google Scholar] [CrossRef]
  8. Li, R.; Liu, Q.; Gui, J.; Gu, D.; Hu, H. Indoor Relocalization in Challenging Environments with Dual-Stream Convolutional Neural Networks. IEEE Trans. Autom. Sci. Eng. 2017, 15, 651–662. [Google Scholar] [CrossRef]
  9. Lin, X.; Huang, T.; Ruan, Z.; Yang, X.; Chen, Z.; Zheng, G.; Feng, C. Automatic Evaluation of Functional Movement Screening Based on Attention Mechanism and Score Distribution Prediction. Mathematics 2023, 11, 4936. [Google Scholar] [CrossRef]
  10. Parmar, P.; Morris, B. Action quality assessment across multiple actions. In Proceedings of the 2019 IEEE Winter Conference on Applications of Computer Vision (WACV), Waikoloa Village, HI, USA, 7–11 January 2019; pp. 1468–1476. [Google Scholar]
  11. Chang, W.D.; Chou, L.W.; Chang, N.J.; Chen, S. Comparison of functional movement screen, star excursion balance test, and physical fitness in junior athletes with different sports injury risk. BioMed Res. Int. 2020, 2020, 8690540. [Google Scholar] [CrossRef] [PubMed]
  12. Yu, X.; Rao, Y.; Zhao, W.; Lu, J.; Zhou, J. Group-aware contrastive regression for action quality assessment. In Proceedings of the IEEE/CVF International Conference on Computer Vision, Montreal, BC, Canada, 11–17 October 2021; pp. 7919–7928. [Google Scholar]
  13. Simonyan, K.; Zisserman, A. Two-stream convolutional networks for action recognition in videos. In Advances in Neural Information Processing Systems 27, Proceedings of the Annual Conference on Neural Information Processing Systems 2014, Montreal, QC, Canada, 8–13 December 2014; NIPS: Cambridge, MA, USA, 2014; pp. 568–576. [Google Scholar]
  14. Carreira, J.; Zisserman, A. Quo vadis, action recognition? A new model and the kinetics dataset. In Proceedings of the IEEE Conference on Computer Vision and Pattern Recognition, Honolulu, HI, USA, 21–26 July 2017; pp. 6299–6308. [Google Scholar]
  15. Zach, C.; Pock, T.; Bischof, H. A Duality Based Approach for Realtime TV-L1 Optical Flow. In Pattern Recognition; Hamprecht, F.A., Schnörr, C., Jähne, B., Eds.; In Lecture Notes in Computer Science; Springer: Berlin/Heidelberg, Germany, 2007; pp. 214–223. [Google Scholar]
  16. Wang, L.; Qiao, Y.; Tang, X. Action Recognition with Trajectory-Pooled Deep-Convolutional Descriptors. In Proceedings of the 2015 IEEE Conference on Computer Vision and Pattern Recognition (CVPR), Boston, MA, USA, 7–12 June 2015; pp. 4305–4314. [Google Scholar]
  17. Sun, D.; Yang, X.; Liu, M.-Y.; Kautz, J. Pwc-net: CNNs for optical flow using pyramid, warping, and cost volume. In Proceedings of the IEEE Conference on Computer Vision and Pattern Recognition, Salt Lake City, UT, USA, 18–23 June 2018; pp. 8934–8943. [Google Scholar]
  18. Teed, Z.; Deng, J. Raft: Recurrent all-pairs field transforms for optical flow. In Computer Vision–ECCV 2020: 16th European Conference, Glasgow, UK, 23–28 August 2020, Proceedings, Part II; Springer: Berlin/Heidelberg, Germany, 2020; pp. 402–419. [Google Scholar]
  19. Hu, J.; Shen, L.; Sun, G. Squeeze-and-excitation networks. In Proceedings of the IEEE Conference on Computer Vision and Pattern Recognition, Salt Lake City, UT, USA, 18–23 June 2018; pp. 7132–7141. [Google Scholar]
  20. Woo, S.; Park, J.; Lee, J.-Y.; Kweon, I.S. Cbam: Convolutional block attention module. In Proceedings of the European Conference on Computer Vision (ECCV), Munich, Germany, 8–14 September 2018; pp. 3–19. [Google Scholar]
  21. Wang, X.; Girshick, R.; Gupta, A.; He, K. Non-local neural networks. In Proceedings of the IEEE Conference on Computer Vision and Pattern Recognition, Salt Lake City, UT, USA, 18–23 June 2018; pp. 7794–7803. [Google Scholar]
  22. Dai, Y.; Gieseke, F.; Oehmcke, S.; Wu, Y.; Barnard, K. Attentional feature fusion. In Proceedings of the IEEE/CVF Winter Conference on Applications of Computer Vision, Virtual, 5–9 January 2021; pp. 3560–3569. [Google Scholar]
  23. Xing, Q.J.; Shen, Y.Y.; Cao, R.; Zong, S.X.; Zhao, S.X.; Shen, Y.F. Functional movement screen dataset collected with two azure kinect depth sensors. Sci. Data 2022, 9, 104. [Google Scholar] [CrossRef]
  24. Wang, X.; Miao, Z.; Zhang, R.; Hao, S. I3D-lstm: A new model for human action recognition. IOP Conf. Ser. Mater. Sci. Eng. 2019, 569, 032035. [Google Scholar] [CrossRef]
  25. Tang, Y.; Ni, Z.; Zhou, J.; Zhang, D.; Lu, J.; Wu, Y.; Zhou, J. Uncertainty-aware score distribution learning for action quality assessment. In Proceedings of the IEEE/CVF Conference on Computer Vision and Pattern Recognition, Seattle, WA, USA, 13–19 June 2020; pp. 9839–9848. [Google Scholar]
Figure 1. Feature fusion map.
Mathematics 12 01162 g001
Figure 2. Overall infrastructure of FMS scoring.
Mathematics 12 01162 g002
Figure 3. Comparison of changes in evaluation metrics.
Mathematics 12 01162 g003
Figure 4. Confusion matrix for different methods during the testing phase.
Mathematics 12 01162 g004
Figure 5. Comparison of different methods.
Mathematics 12 01162 g005
Figure 6. Comparison of different methods.
Mathematics 12 01162 g006
Table 1. The summary of FMS.
PaperApproachContributionDatasetYear
[4]FMSAssess functional movement impairments based on proprioception, mobility, and stabilityFMS Dataset2006
[8]Dual-stream CNNImproved the relocalization accuracy by about 20% compared with the state-of-the-art deep learning method for pose regression, and greatly enhanced the system robustness in challenging scenesMicrosoft 7-Scenes and indoor data sets2017
[10]C3D-LSTMShowed that there is utility in learning a single model across multiple actionsAQA-72019
[11]FMS, SEBTAssessed the relationships between FMS, SEBT, agility test, and vertical jump test scores and sports injury risk in junior athletesFMS Dataset2020
[12]CoreOutperformed previous methods by a large margin and established a new state of the art on all three benchmarksAQA-7, MTL-AQA, and JIGSAW2021
[5]CNN-LSTMCapable of performing complex motion analytic tasks based on inertial measurement unit dataNew dataset and IMU data2022
[7]GMMEffectively performed the FMS assessment task, and it is potentially feasible to use depth cameras for FMS assessmentFMS Dataset2023
[9]I3D-AM-MLPI3D model evaluation of FMS combined with attention mechanismFMS dataset2023
Table 2. Comparative experiment results.
ProtocolAccuracy (%)ma F 1 (%)Kappa (%)
I3D-LSTM [24]71.1170.9056.66
I3D-MLP [25]84.4484.5376.66
Improved-GMM [7]80.0077.0067.00
RESNET-MLP [21]84.4484.1276.67
Ours88.8988.9583.33
Table 3. Comparison of model parameters and computational cost.
ModelParamsParams
I3D-MLP [25]12.98 M27,877.32 M
Ours13.11 M27,877.45 M
Table 4. Ablation experiment analysis.
Feature-Fusion ProtocolAccuracy (%)ma F 1 (%)Kappa (%)
I3D-MLP [25]84.4484.4676.67
MS-GAU [22]82.2282.4273.33
MS-SE [22]85.5685.3778.33
MS-SA [22]82.2282.3973.33
AFF [22]82.2282.4273.33
Ours + CBAM [20]85.5664.3278.45
Ours + SE88.8988.9583.33
Disclaimer/Publisher’s Note: The statements, opinions and data contained in all publications are solely those of the individual author(s) and contributor(s) and not of MDPI and/or the editor(s). MDPI and/or the editor(s) disclaim responsibility for any injury to people or property resulting from any ideas, methods, instructions or products referred to in the content.

