

Multilevel Fuzzy Inference System for Estimating Risk of Type 2 Diabetes


Abstract
1. Introduction
2. Multilevel Fuzzy Approach: Mathematical Fundamentals
3. Defining T2D Risk Parameters
3.1. Risk Parameters
3.2. Data Collecting and Processing
- Binary answer types: yes, no, or I do not know;
- Questions requiring answers with exact values: What is your average systolic blood pressure? (mmHg);
- Questions where a range of frequency needs to be selected: never, rarely (few times per year), frequently (monthly, few times per month), daily (multiple times per week, daily), or multiple times per day.
- General: age, birth weight, and hereditary;
- BMI: systolic blood pressure systolic, diastolic blood pressure, body mass index (BMI), obesity, and waist circumference;
- Blood analysis: blood glucose (BG) level, glycosylated hemoglobin (HbA1c), and vitamin D;
- Lipids: high-density lipoprotein (HDL) cholesterol, low-density lipoprotein (LDL) cholesterol, triglycerides, and total cholesterol;
- Insulin deficiency: pancreatic dysfunction, insulin deficiency, insulin resistance, non-alcoholic fatty liver disease (NAFLD), and non-alcoholic steatohepatitis (NASH);
- Illnesses: chronic inflammation, metabolic syndrome, and skin diseases;
- Female: pregnancy, breastfeeding, polycystic ovary syndrome (PCOS), and history of gestational diabetes mellitus (GDM);
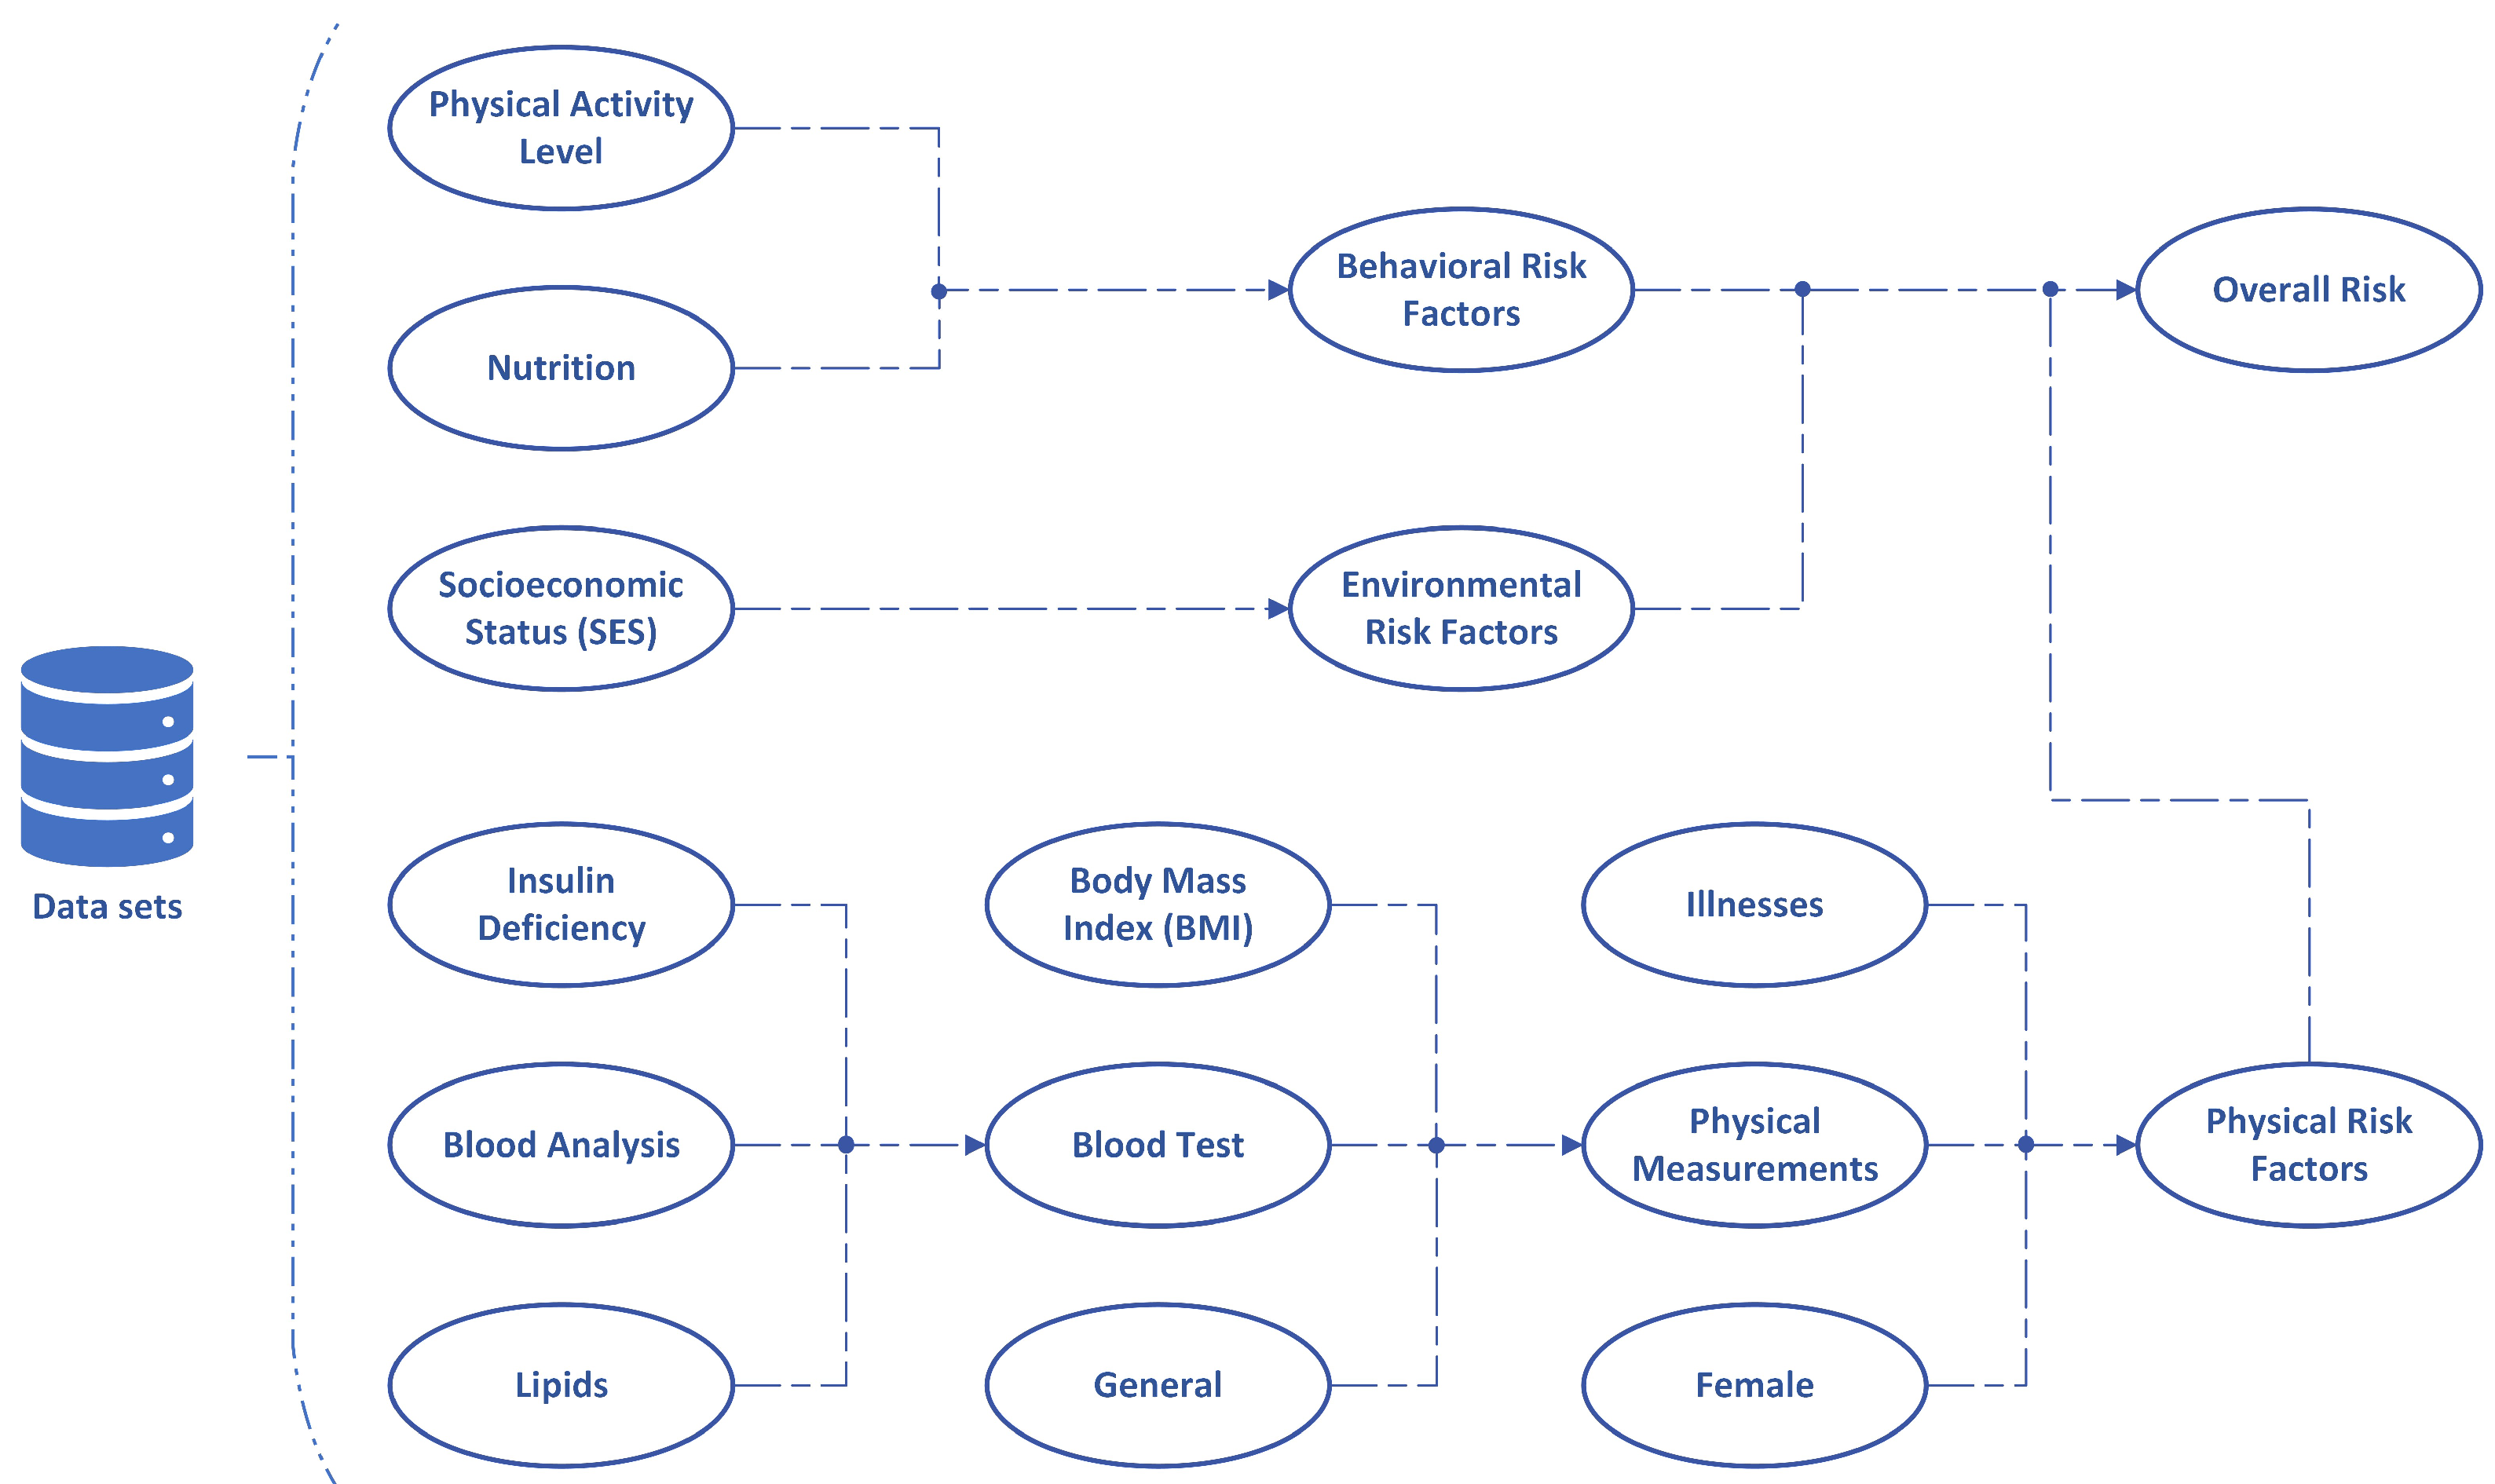
- Blood test: blood analysis, lipids, and insulin deficiency;
- Physical measurements: blood test, BMI, and general;
- Physical risk factors: physical measurements, illnesses, and female.
- Physical activity level: sports activity, sitting jobs, and sedentary behavior;
- Nutrition: fast food, fruits and vegetables, sugar-sweetened beverages, processed red meat, refined grains, fiber and wholegrain foods, and a vegetarian and or Mediterranean diet;
- Behavioral risk factors: physical activity level, nutrition, alcohol consumption, smoking, stress level, medications, and sleep quality;
- Socioeconomic status (SES): income/financial status, education, and general knowledge about diabetes risk factors;
- Environmental risk factors: socioeconomic status (SES), pollution, and residential noise.
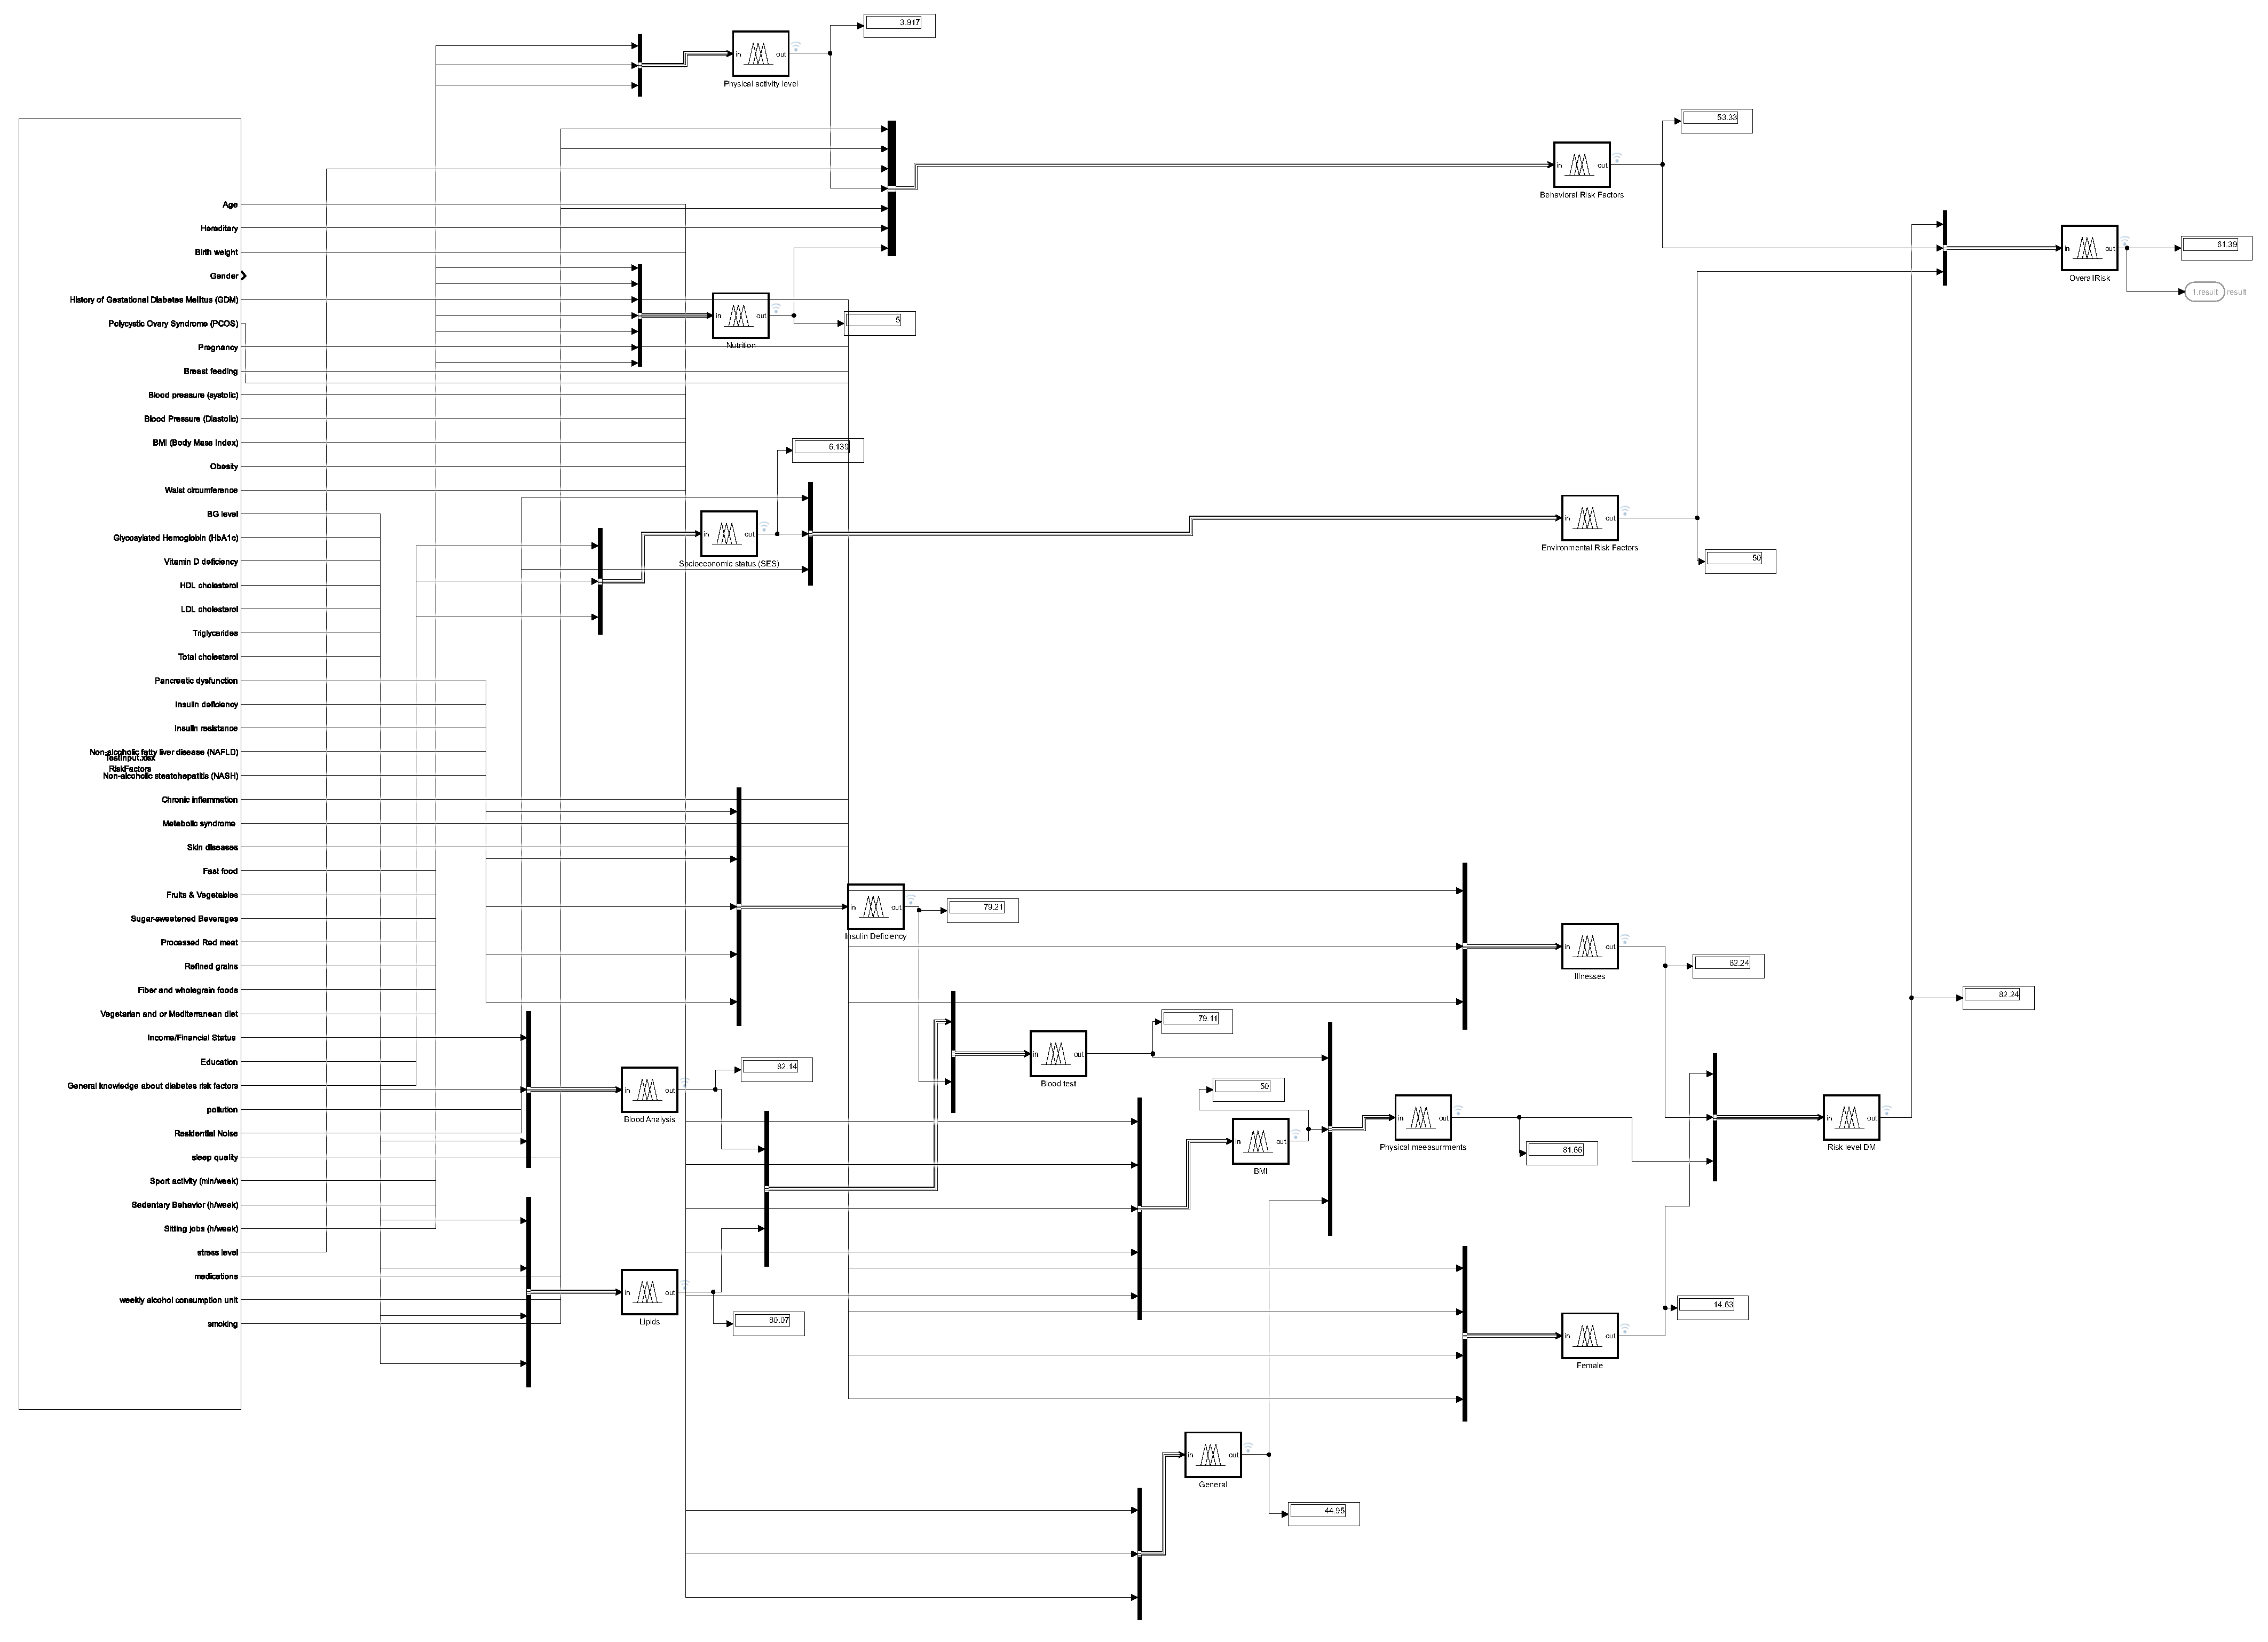
4. Multilevel Inference System Construction
5. Results and Discussion
- In the case of lower-level (below 40%) aggregated risk factors, there is no significant difference between the results given by the fuzzy inference system and by the doctor.
- The expert provided explanations and suggestions for the differences in the range over the 40% level of the risk level:
- (a)
- In the first approach, medical practitioners do not emphasize environmental factors and lifestyle-related parameters. Therefore, the estimation of the fuzzy system and the estimate of the specialist doctor would be closer if the physiological factor group was also taken into account with greater weight in the fuzzy system. The aim of the study is precisely to pay more attention to these environmental and lifestyle-related factors.
- (b)
- The expert estimated a higher risk value for some patients because the expert recognized that the danger of insulin resistance based on the input parameters usually leads to the development of T2D. This is a useful insight for the further development of the system since the system could prioritize these patients by incorporating a preliminary subsystem.
- (c)
- The expert also drew attention to the fact that some patients do not truthfully answer questions about non-physiological parameters (alcohol consumption or physical activity, for example). However, after comparing the results given by the system and the results given by the doctor’s estimate, the specialist’s opinion can be overridden as necessary due to the significant difference.
- (d)
- The primary grouping of the parameters is correct, but there are interacting parameters between them. That is, the model can be supplemented with subsystems that model the interaction of the input parameters. The fuzzy-based cognitive map to be built based on the set of parameters is definitely chosen based on the authors’ plans since in this model the interaction of the parameters is shown by a directed weighted graph, and a learning algorithm may also be applied.
6. Conclusions
Author Contributions
Funding
Data Availability Statement
Conflicts of Interest
Abbreviations
| T1D | Type 1 diabetes |
| T2D | Type 2 diabetes |
| FIS | Fuzzy inference system |
| MF | Membership function |
References
- Tašić, J.; Takács, M.; Kovács, L. A kinetic model-based approach for estimating hemoglobin A1c based on average glucose. In Proceedings of the IEEE 17th International Symposium on Applied Computational Intelligence and Informatics (SACI), Timisoara, Romania, 23–26 May 2023; pp. 000153–000158. [Google Scholar]
- Diabetes. Available online: https://www.who.int/health-topics/diabetes#tab=tab_1 (accessed on 14 November 2023).
- Facts & Figures. Available online: https://idf.org/about-diabetes/diabetes-facts-figures (accessed on 14 November 2023).
- Tabakov, M.; Chlopowiec, A.B.; Chlopowiec, A.R.; Dlubak, A. Classification with fuzzification optimization combining fuzzy Information systems and type-2 fuzzy inference. Appl. Sci. 2021, 11, 3484. [Google Scholar] [CrossRef]
- Monica, J.C.; Melin, P.; Sanchez, D. Optimal design of a fuzzy system with a real-coded genetic algorithm for diabetes classification. In Proceedings of the Hybrid Intelligent Systems, 14–16 December 2020; Online; Springer: Cham, Switzerland, 2021; Volume 1375, pp. 320–329. [Google Scholar]
- Melin, P.; Sanchez, D. Optimization of type-1, interval type-2 and general type-2 fuzzy inference systems using a hierarchical genetic algorithm for modular granular neural networks. Granul. Comput. 2019, 4, 211–236. [Google Scholar] [CrossRef]
- Barraza, J.; Melin, P.; Valdez, F.; Gonzalez, C.I. Modeling of fuzzy systems based on the competitive neural network. Appl. Sci. 2023, 13, 3091. [Google Scholar] [CrossRef]
- Melin, P.; Sánchez, D. Optimal design of type-2 fuzzy systems for diabetes classification based on genetic algorithms. Int. J. Hybrid Intell. Syst. 2021, 17, 15–32. [Google Scholar] [CrossRef]
- Ontiveros, E.; Melin, P.; Castillo, O. Comparative study of interval type-2 and general type-2 fuzzy systems in medical diagnosis. Inform. Sci. 2020, 525, 37–53. [Google Scholar] [CrossRef]
- Bressan, G.M.; Flamia de Azevedo, B.C.; Molina de Souza, R. A fuzzy approach for diabetes mellitus type 2 classification. Braz. Arch. Biol. Technol. 2020, 63, 1–11. [Google Scholar] [CrossRef]
- Regateiro, D.D.; Pereira, Ó.M.; Aguiar, R.L. BDFIS: Binary decision access control model based on fuzzy inference systems. In Proceedings of the 31st International Conference on Software Engineering and Knowledge Engineering, Lisbon, Portugal, 10–12 July 2019. [Google Scholar]
- Suleiman, D.; Al-Zewairi, M.; Shaout, A. Enhanced multilevel fuzzy inference system for risk adaptive hhybrid RFID access control system. Int. J. Online Biomed. Eng. (iJOE) 2022, 18, 31–51. [Google Scholar] [CrossRef]
- Melin, P.; Sánchez, D.; Castillo, O. Interval type-3 fuzzy inference system design for medical classification using genetic algorithms. Axioms 2023, 13, 5. [Google Scholar] [CrossRef]
- Ambilwade, R.P.; Manza, R.R. Prognosis of diabetes using fuzzy inference system and multilayer perceptron. In Proceedings of the 2nd International Conference on Contemporary Computing and Informatics (IC3I), Greater Noida, India, 14–17 December 2016; pp. 248–252. [Google Scholar]
- Haimes, Y.Y. Risk Modeling, Assessment, and Management, 3rd ed.; John Wiley & Sons: Hoboken, NJ, USA, 2009. [Google Scholar]
- Venczel, T.B.; Berényi, L.; Hriczó, K. The Project and Risk Management Challenges of Start-ups. Acta Polytech. Hung. 2024, 21, 151–166. [Google Scholar] [CrossRef]
- Macura, D.; Laketić, M.; Pamučar, D.; Marinković, D. Risk analysis model with interval type-2 fuzzy FMEA—Case study of railway infrastructure projects in the republic of Serbia. Acta Polytech. Hung. 2022, 19, 103–118. [Google Scholar] [CrossRef]
- Cameron, E.; Peloso, G.F. Risk management and the precautionary principle: A fuzzy logic model. Risk Anal. 2005, 25, 901–911. [Google Scholar] [CrossRef] [PubMed]
- Takács, M. Soft computing based risk management. In Risk Management Trends; IntechOpen: Rijeka, Croatia, 2011; pp. 27–48. [Google Scholar]
- Tóth-Laufer, E.; Takács, M.; Rudas, I.J. Fuzzy Logic-based Risk Assessment Framework to Evaluate Physiological Parameters. Acta Polytech. Hung. 2015, 12, 159–178. [Google Scholar]
- Carr, V.; Tah, J.H.M. A fuzzy approach to construction project risk assessment and analysis: Construction project risk management system. Adv. Eng. Softw. 2001, 32, 847–857. [Google Scholar] [CrossRef]
- Takács, M. Multilevel fuzzy approach to the risk and disaster management. Acta Polytech. Hung. 2010, 7, 91–102. [Google Scholar]
- Age. Available online: https://www.nih.gov/nih-style-guide/age (accessed on 10 November 2023).
- Mi, D.; Fang, H.; Zhao, Y.; Zhong, L. Birth weight and type 2 diabetes: A meta-analysis. Exp. Ther. Med. 2017, 14, 5313–5320. [Google Scholar] [CrossRef] [PubMed]
- Kyrou, I.; Tsigos, C.; Mavrogianni, C.; Cardon, G.; Stappen, V.V.; Latomme, J.; Kivelä, J.; Wikström, K.; Tsochev, K.; Nanasi, A.; et al. Designing, implementing and evaluating a community-based intervention to prevent diabetes in vulnerable families across Europe. The Feel4Diabetes-study. BMC Endocr. Disord. 2020, 20, 13. [Google Scholar]
- Defining Adult Overweight & Obesity. Available online: https://www.cdc.gov/obesity/basics/adult-defining.html (accessed on 10 November 2023).
- Zhou, Y.Y.; Zhou, T.C.; Zhou, T.C.; Chen, N.; Zhou, G.Z.; Zhou, H.J.; Li, X.D.; Wang, J.R.; Bai, C.F.; Long, R.; et al. Risk factor analysis and clinical decision tree model construction for diabetic retinopathy in Western China. World J. Diabetes 2022, 13, 986–1000. [Google Scholar] [CrossRef] [PubMed]
- Understanding Blood Pressure Readings. Available online: https://www.heart.org/en/health-topics/high-blood-pressure/understanding-blood-pressure-readings (accessed on 10 November 2023).
- Blood Sugar Level Ranges. Available online: https://www.diabetes.co.uk/diabetes_care/blood-sugar-level-ranges.html (accessed on 10 November 2023).
- Low Hemoglobin. Available online: https://my.clevelandclinic.org/health/symptoms/17705-low-hemoglobin (accessed on 10 November 2023).
- What Do Cholesterol Numbers Mean? Available online: https://www.clevelandclinicabudhabi.ae/en/health-hub/health-resource/diseases-and-conditions/what-do-cholesterol-numbers-mean (accessed on 10 November 2023).
- Patient Education: High Cholesterol and Lipids (beyond the Basics). Available online: https://www.uptodate.com/contents/high-cholesterol-and-lipids-beyond-the-basics (accessed on 10 November 2023).
- Lipid Panel. Available online: https://www.hopkinsmedicine.org/health/treatment-tests-and-therapies/lipid-panel (accessed on 10 November 2023).
- Low Vitamin D May Contribute to Insulin Resistance. Available online: https://diabetes.org/food-nutrition/diabetes-vitamins-supplements/low-vitamin-d-insulin-resistance (accessed on 10 November 2023).
- Berbudi, A.; Rahmadika, N.; Tjahjadi, A.I.; Ruslami, R. Type 2 diabetes and its impact on the immune system. Curr. Diabetes Rev. 2020, 16, 442–449. [Google Scholar]
- Antuna-Puente, B.; Disse, E.; Rabasa-Lhoret, R.; Laville, M.; Capeau, J.; Bastard, J.-P. How can we measure insulin sensitivity/resistance? Diabetes Metab. 2011, 37, 179–188. [Google Scholar] [CrossRef]
- Pancreatic Elastase, Feces. Available online: https://pediatric.testcatalog.org/show/ELASF (accessed on 10 November 2023).
- Hadizadeh, F.; Faghihimani, E.; Adibi, P. Nonalcoholic fatty liver disease: Diagnostic biomarkers. World J. Gastrointest. Pathophysiol. 2017, 8, 11–26. [Google Scholar] [CrossRef]
- Dharmalingam, M.; Yamasandhi, P.G. Nonalcoholic fatty liver disease and type 2 diabetes mellitus. Indian J. Endocrinol. Metab. 2018, 22, 421–428. [Google Scholar] [CrossRef] [PubMed]
- Diagnosis. Available online: https://www.nhlbi.nih.gov/health/metabolic-syndrome/diagnosis (accessed on 10 November 2023).
- Tsalamandris, S.; Antonopoulos, A.S.; Oikonomou, E.; Papamikroulis, G.A.; Vogiatzi, G.; Papaioannou, S.; Deftereos, S.; Tousoulis, D. The role of inflammation in diabetes: Current concepts and future perspectives. Eur. Cardiol. 2019, 14, 50–59. [Google Scholar] [CrossRef] [PubMed]
- Diabetes: 12 Warning Signs That Appear on Your Skin. Available online: https://www.aad.org/public/diseases/a-z/diabetes-warning-signs (accessed on 10 November 2023).
- Buchanan, T.A.; Xiang, A.H. Gestational diabetes mellitus. J. Clin. Investig. 2005, 115, 485–491. [Google Scholar] [CrossRef] [PubMed]
- Breastfeeding May Help Prevent Type 2 Diabetes after Gestational Diabetes. Available online: https://www.nih.gov/news-events/nih-research-matters/breastfeeding-may-help-prevent-type-2-diabetes-after-gestational-diabetes (accessed on 10 November 2023).
- PCOS (Polycystic Ovary Syndrome) and Diabetes. Available online: https://www.cdc.gov/diabetes/basics/pcos.html (accessed on 10 November 2023).
- Magkos, F.; Hjorth, M.F.; Astrup, A. Diet and exercise in the prevention and treatment of type 2 diabetes mellitus. Nat. Rev. Endocrinol. 2020, 16, 545–555. [Google Scholar] [CrossRef] [PubMed]
- Beulens, J.W.J.; Pinho, M.G.M.; Abreu, T.C.; den Braver, N.R.; Lam, T.M.; Huss, A.; Vlaanderen, J.; Sonnenschein, T.; Siddiqui, N.Z.; Yuan, Z.; et al. environmental risk factors of type 2 diabetes—An exposome approach. Diabetologia 2021, 65, 263–274. [Google Scholar] [CrossRef] [PubMed]
- Afroz-Hossain, A.; Dawkins, M.; Myers, A.K. Sleep and environmental factors affecting glycemic control in people with type 2 diabetes mellitus. Curr. Diab. Rep. 2019, 19, 40. [Google Scholar] [CrossRef] [PubMed]
- Repaske, D.R. Medication-induced diabetes mellitus. Pediatr. Diabetes 2016, 17, 389–465. [Google Scholar] [CrossRef]
- Wannamethee, S.G.; Camargo, C.A.; Manson, J.E.; Willett, W.C.; Rimm, E.B. Alcohol drinking patterns and risk of type 2 diabetes mellitus among younger women. Arch. Intern. Med. 2003, 163, 1329–1336. [Google Scholar] [CrossRef]
- Hussein, W.N.; Mohammed, Z.M.; Mohammed, A.N. Identifying risk factors associated with type 2 diabetes based on data analysis. Meas. Sens. 2022, 24, 100543. [Google Scholar] [CrossRef]
- Babey, S.H.; Diamant, A.L.; Hastert, T.A.; Harvey, S. Designed for Disease: The Link Between Local Food Environments and Obesity and Diabetes; UCLA Center for Health Policy Research: Berkeley, CA, USA, 2008; pp. 1–10. [Google Scholar]
- Ntarladima, A.M.; Karssenberg, D.; Poelman, M.; Grobbee, D.E.; Lu, M.; Schmitz, O.; Strak, M.; Janssen, N.; Hoek, G.; Vaartjes, I. Associations between the fast-food environment and diabetes prevalence in the Netherlands: A cross-sectional study. Lancet Planet Health 2022, 6, e29–e39. [Google Scholar] [CrossRef]
- Yokoyama, Y.; Barnard, N.D.; Levin, S.M.; Watanabe, M. Vegetarian diets and glycemic control in diabetes: A systematic review and meta-analysis. Cardiovasc. Diagn. Ther. 2014, 4, 373–382. [Google Scholar] [PubMed]
- Seiglie, J.A.; Marcus, M.E.; Ebert, C.; Prodromidis, N.; Geldsetzer, P.; Theilmann, M.; Agoudavi, K.; Brereton, G.A.; Aryal, K.K.; Bicaba, B.W.; et al. Diabetes prevalence and its relationship with education, wealth, and BMI in 29 low- and middle-income countries. Diabetes Care 2020, 43, 767–775. [Google Scholar] [CrossRef] [PubMed]
- Roystonn, K.; AshaRani, P.V.; Kumar, F.D.S.; Wang, P.; Abdin, E.; Sum, C.F.; Lee, E.S.; Chong, S.A.; Subramaniam, M. Factor structure of the diabetes knowledge questionnaire and the assessment of the knowledge of risk factors, causes, complications, and management of diabetes mellitus: A national population-based study in Singapore. PLoS ONE 2022, 17, e0272745. [Google Scholar] [CrossRef] [PubMed]


| Parameters | Impact Level 1 | Impact Level 2 | Impact Level 3 | Impact |
|---|---|---|---|---|
| Age | Young adults | Middle-aged adults | Old adults | Positive [23] |
| Birth weight | Low | Normal | High | Positive [24] |
| Hereditary | Low | Medium | High | Positive [25] |
| BMI * | Underweight | Healthy weight | Overweight | Positive [26] |
| Obesity | Class 1 | Class 2 | Class 3 | Positive [26] |
| Waist circumference | Low | High | Very high | Positive [27] |
| Systolic blood pressure | Normal | Elevated | High | Positive [28] |
| Diastolic blood pressure | Normal | Elevated | High | Positive [28] |
| Blood glucose | Normal | Prediabetes | Diabetes | Positive [29] |
| HbA1c * | Low | Normal | High | Positive [30] |
| HDL cholesterol * | Low | Borderline high | High | Negative [31] |
| LDL cholesterol * | Optimal | Near-optimal | Borderline high | Positive [31] |
| Triglycerides | Normal | Mildly increased | Moderately increased | Positive [32] |
| Total cholesterol | Normal | Borderline high | High | Positive [33] |
| Vitamin D | Low | Normal | Very high | Negative [34] |
| Insulin deficiency | Low | Medium | High | Positive [35] |
| Insulin resistance | Normal | Borderline | Resistance | Positive [36] |
| Pancreatic dysfunction | Severe | Moderate | Normal | Positive [37] |
| NAFLD * | Low | Medium | High | Positive [38] |
| NASH * | Low | Medium | High | Positive [39] |
| Metabolic syndrome | Low | Medium | High | Positive [40] |
| Chronic inflammation | Low | Medium | High | Positive [41] |
| Skin diseases | Low | Medium | High | Positive [42] |
| Pregnancy | Low | Medium | High | Positive [43] |
| Breastfeeding | Low | Medium | High | Negative [44] |
| GDM * | Low | Medium | High | Positive [43] |
| PCOS * | Low | Medium | High | Positive [45] |
| Parameters | Impact Level 1 | Impact Level 2 | Impact Level 3 |
|---|---|---|---|
| Age | [11.18 15.79 34.88 39.24] | [37.9 48.96 60] | [58.54 65.49 93.81 100] |
| Birth weight [kg] | [0 0.68 2.29 2.79] | [2.5 3.35 4.21] | [4 4.6 5.68 6] |
| Hereditary | [−0.38 −0.04 0.12 0.38] | [0.3 0.5 0.7] | [0.63 0.96 1.04 1.38] |
| BMI [kg/m2] | [11 13.62 17.01 18.7] | [18.5 21.79 25] | [24.5 25.89 30.23 31.5] |
| Obesity [kg/m2] | [29 30.16 33.54 34.9] | [34.2 36.95 39.9] | [39 40.06 41.82 43.25] |
| Waist circumference [cm] | [10 50 80 87.33] | [84.54 94.59 102] | [100 120 150 200] |
| Systolic blood pressure [mmHg] | [20 45.81 105.2 119] | [115 121.74 130] | [128.2 139.3 178.39 190] |
| Diastolic blood pressure [mmHg] | [20 38 62.97 79.69] | [78.29 84.28 91.16] | [88.17 98.4 110.31 120] |
| Blood glucose [mmol/L] | [2 3 4.54 5.4] | [5.18 6 6.9] | [6.75 7.48 9.26 10] |
| HbA1c [g/dL] | [30 50 100 120] | [116.61 135.92 156.38] | [152.2 164.5 186.63 200] |
| HDL cholesterol [mmol/L] | [−1.5 −1.01 0.68 1.01] | [0.95 1.2 1.42] | [1.12 2.05 4.89 6] |
| LDL cholesterol [mmol/L] | [−1.5 −0.65 1.93 2.5] | [2.37 2.81 3.3] | [3.22 3.56 5.41 6] |
| Triglycerides [mmol/L] | [−1.5 −0.48 1.15 1.7] | [1.52 3.52 5.5] | [5.27 6.26 9.54 10.5] |
| Total cholesterol [mmol/L] | [−1.5 −0.15 3.79 5.16] | [4.95 5.6 6.43] | [6.14 7 10.12 11] |
| Vitamin D [nmol/L] | [0 12.84 29.2 45.91] | [40.63 82.95 123.8] | [120.47 140 180 200] |
| Insulin deficiency | [−0.38 −0.04 0.04 0.38] | [0.29 0.5 0.71] | [0.63 0.96 1.04 1.38] |
| Insulin resistance [mIU/L] | [20 31.08 55.63 64.84] | [60 81.59 103.07] | [97.64 120 180 200] |
| Pancreatic dysfunction [mcg/g] | [−15 −1.34 75 102.52] | [98.36 152.67 208.44] | [200 225.46 320.92 350] |
| NAFLD | [−0.38 −0.04 0.04 0.38] | [0.31 0.5 0.71] | [0.63 0.96 1.04 1.38] |
| NASH | [−0.38 −0.04 0.04 0.38] | [0.3 0.5 0.7] | [0.63 0.96 1.04 1.38] |
| Metabolic syndrome | [−0.38 −0.04 0.04 0.38] | [0.08 0.5 0.92] | [0.63 0.96 1.04 1.38] |
| Chronic inflammation | [−0.38 −0.04 0.04 0.38] | [0.08 0.5 0.92] | [0.63 0.96 1.04 1.38] |
| Skin diseases | [−0.38 −0.04 0.04 0.38] | [0.08 0.5 0.92] | [0.63 0.96 1.04 1.38] |
| Pregnancy | [−0.38 −0.04 0.04 0.38] | [0.3 0.5 0.7] | [0.63 0.96 1.04 1.38] |
| Breastfeeding | [−0.38 −0.04 0.04 0.38] | [0.3 0.5 0.7] | [0.63 0.96 1.04 1.38] |
| GDM | [−0.38 −0.04 0.04 0.38] | [0.3 0.5 0.71] | [0.63 0.96 1.04 1.38] |
| PCOS | [−0.38 −0.04 0.04 0.38] | [0.3 0.5 0.7] | [0.63 0.96 1.04 1.38] |
| Parameters | Low | Medium | High | Impact |
|---|---|---|---|---|
| Physical activity [min/w] | [−375 −41.67 41.67 64.68] | [35.61 227.7 348.11] | [242.01 550.2 1042 1375] | Negative [46] |
| Sedentary behavior [h/w] | [−37.5 −4.17 4.17 37.5] | [8.33 50 91.67] | [62.5 95.83 104.2 137.5] | Positive [25] |
| Sitting jobs [h/w] | [−37.5 −4.17 4.17 24.52] | [8.33 26.92 50.72] | [34.89 60.03 104.2 137.5] | Positive [25] |
| Chronic stress *1 | [−3.75 −0.42 0.42 3.75] | [0.83 5 9.17] | [6.25 9.58 10.42 13.75] | Positive [47] |
| Sleep quality [h] | [−3.75 −0.42 0.42 3.06] | [2.04 4.68 7.78] | [6.25 8.93 10.42 13.75] | Negative [48] |
| Medications *3 | [−3.75 −0.42 0.42 2.71] | [0.83 4.02 7.59] | [6.25 9.58 10.42 13.75] | Positive [49] |
| Alcohol *2 | [−8.46 −0.17 2.24 5.99] | [3.08 17.74 23.15] | [17.15 28.47 41.67 55] | Positive [50] |
| Smoking *3 | [−18.75 −2.08 1.69 3.4] | [0.26 9.53 20.46] | [14.72 32.5 51.46 67.22] | Positive [51] |
| Fast food *2 | [−1.5 −0.17 0.17 1.5] | [0.33 2 3.67] | [2.5 3.83 4.17 5.5] | Positive [52,53] |
| Sugar−sweetened beverages *2 | [−1.5 −0.17 0.17 1.5] | [0.33 2 3.67] | [2.5 3.83 4.17 5.5] | Positive [25] |
| Processed red meat *2 | [−1.5 −0.17 0.17 1.5] | [0.33 2 3.67] | [2.5 3.83 4.17 5.5] | Positive [25] |
| Vegetarian diet *3 | [−1.5 −0.17 0.17 1.5] | [0.33 2 3.67] | [2.5 3.83 4.17 5.5] | Negative [54] |
| Mediterranean diet *3 | [−1.5 −0.17 0.17 1.5] | [0.33 2 3.67] | [2.5 3.83 4.17 5.5] | Negative [54] |
| Fruits and vegetables *2 | [−1.5 −0.17 0.17 1.5] | [0.33 2 3.67] | [2.5 3.83 4.17 5.5] | Negative [25,46] |
| Refined grains *2 | [−1.5 −0.17 0.17 1.5] | [0.33 2 3.67] | [2.5 3.83 4.17 5.5] | Negative [25] |
| Fiber and wholegrain *2 | [−1.5 −0.17 0.17 1.5] | [0.33 2 3.67] | [2.5 3.83 4.17 5.5] | Negative [25] |
| Income/financial status *1 | [−1.5 −0.17 0.17 1.5] | [0.33 2 3.67] | [2.5 3.83 4.17 5.5] | Negative [55] |
| Education *1 | [−1.5 −0.17 0.17 1.5] | [0.33 2 3.67] | [2.5 3.83 4.17 5.5] | Negative [25,55] |
| Knowledge about diabetes *1 | [−1.5 −0.17 0.17 1.5] | [0.33 2 3.67] | [2.5 3.83 4.17 5.5] | Negative [56] |
| Air/chemical pollutants *1 | [−1.5 −0.17 0.17 1.5] | [0.5 1.83 2.17 3.5] | [2.5 3.83 4.17 5.5] | Positive [47] |
| Residential noise *1 | [31.25 47.9 52.08 68.7] | [56.25 72.9 77.1 93.7] | [81.25 97.9 102.1 118.7] | Positive [47] |
| Rules |
|---|
| If physical risk level is low, behavioral risk level is low, and environmental risk factor is low then overall risk is low |
| If physical risk level is medium, behavioral risk level is low, and environmental risk factor is low then overall risk is low |
| If physical risk level is high, behavioral risk level is low, and environmental risk factor is low then overall risk is medium |
| If physical risk level is low, behavioral risk level is medium, and environmental risk factor is medium then overall risk is medium |
| If physical risk level is medium, behavioral risk level is medium, and environmental risk factor is medium then overall risk is medium |
| If physical risk level is high, behavioral risk level is medium, and environmental risk factor is medium then overall risk is high |
| If physical risk level is low and behavioral risk level is high then overall risk is medium |
| If physical risk level is medium, behavioral risk level is high then overall risk is medium |
| If physical risk level is high and behavioral risk level is high then overall risk is high |
| If physical risk level is low, behavioral risk level is low, and environmental risk factor is medium then overall risk is low |
| If physical risk level is low, behavioral risk level is low, and environmental risk factor is high then overall risk is medium |
| If physical risk level is low, behavioral risk level is medium, and environmental risk factor is low then overall risk is low |
| If physical risk level is low, behavioral risk level is medium, and environmental risk factor is high then overall risk is medium |
| If physical risk level is low, behavioral risk level is high, and environmental risk factor is low then overall risk is medium |
| If physical risk level is low, behavioral risk level is high, and environmental risk factor is medium then overall risk is medium |
| If physical risk level is low, behavioral risk level is high, and environmental risk factor is high then overall risk is medium |
| If physical risk level is medium, behavioral risk level is low, and environmental risk factor is medium then overall risk is medium |
| If physical risk level is medium, behavioral risk level is low, and environmental risk factor is high then overall risk is medium |
| If physical risk level is medium, behavioral risk level is medium, and environmental risk factor is low then overall risk is medium |
| If physical risk level is medium, behavioral risk level is medium, and environmental risk factor is high then overall risk is medium |
| If physical risk level is medium, behavioral risk level is high, and environmental risk factor is low then overall risk is medium |
| If physical risk level is medium, behavioral risk level is high, and environmental risk factor is medium then overall risk is medium |
| If physical risk level is medium, behavioral risk level is high, and environmental risk factor is high then overall risk is high |
| If physical risk level is high, behavioral risk level is low, and environmental risk factor is medium then overall risk is medium |
| If physical risk level is high, behavioral risk level is low, and environmental risk factor is high then overall risk is high |
| If physical risk level is high, behavioral risk level is medium, and environmental risk factor is low then overall risk is medium |
| If physical risk level is high, behavioral risk level is medium, and environmental risk factor is high then overall risk is high |
| If physical risk level is high, behavioral risk level is high, and environmental risk factor is low then overall risk is high |
| If physical risk level is high, behavioral risk level is high, and environmental risk factor is medium then overall risk is high |
| If physical risk level is high, behavioral risk level is high, and environmental risk factor is high then overall risk is high |
| If physical risk level is low then overall risk is low |
| If physical risk level is medium then overall risk is medium |
| If physical risk level is high then overall risk is high |
| If behavioral risk level is low then overall risk is low |
| If behavioral risk level is medium then overall risk is medium |
| If behavioral risk level is high then overall risk is high |
| If environmental risk factor is low then overall risk is low |
| If environmental risk factor is medium then overall risk is medium |
| If environmental risk factor is high then overall risk is high |
Disclaimer/Publisher’s Note: The statements, opinions and data contained in all publications are solely those of the individual author(s) and contributor(s) and not of MDPI and/or the editor(s). MDPI and/or the editor(s) disclaim responsibility for any injury to people or property resulting from any ideas, methods, instructions or products referred to in the content. |
© 2024 by the authors. Licensee MDPI, Basel, Switzerland. This article is an open access article distributed under the terms and conditions of the Creative Commons Attribution (CC BY) license (https://creativecommons.org/licenses/by/4.0/).
Share and Cite
Tašić, J.; Nagy-Perjési, Z.; Takács, M. Multilevel Fuzzy Inference System for Estimating Risk of Type 2 Diabetes. Mathematics 2024, 12, 1167. https://doi.org/10.3390/math12081167
Tašić J, Nagy-Perjési Z, Takács M. Multilevel Fuzzy Inference System for Estimating Risk of Type 2 Diabetes. Mathematics. 2024; 12(8):1167. https://doi.org/10.3390/math12081167
Chicago/Turabian StyleTašić, Jelena, Zsófia Nagy-Perjési, and Márta Takács. 2024. "Multilevel Fuzzy Inference System for Estimating Risk of Type 2 Diabetes" Mathematics 12, no. 8: 1167. https://doi.org/10.3390/math12081167
APA StyleTašić, J., Nagy-Perjési, Z., & Takács, M. (2024). Multilevel Fuzzy Inference System for Estimating Risk of Type 2 Diabetes. Mathematics, 12(8), 1167. https://doi.org/10.3390/math12081167