1. Introduction
The aluminum electrolytic production process mainly uses cryolite-alumina as a raw material, carbon as the anode and cathode of the electrolytic reaction, and is carried out by passing a strong direct current into the electrolytic cell to induce the electrochemical reaction in the cell, so as to complete the electrolytic aluminum production [
1]. In actual production, costs play an important role to affect the development of capacity. And the cost of the largest proportion is the price of electricity, which varies and accounts for about 30% to 35% of the cost in different regions [
2]. At present, with the decreasing resources of the Earth and the rising price of electricity, the cost of aluminum electrolysis production is getting higher and higher. Thus, it is important to achieve energy-saving and consumption reduction in the production of aluminum electrolysis. The method of energy saving in aluminum electrolysis is generally by improving current efficiency and reducing cell voltage [
3]. Due to the complexity of improving current efficiency, most companies nowadays reduce the cell voltage to save energy and decrease consumption. However, the optimal cell voltage cannot be found by manually adjusting and changing a single parameter.
Cell voltage refers to the voltage through which the current passes in the electrolytic cell, and it is an important factor in the production process of aluminum electrolysis [
4]. The parameters affecting cell voltage are the pole pitch, electrolyte level, molecular ratio, resistance, alumina concentration, aluminum output, electrolyte temperature, aluminum level, and electric current. All these parameters change in real time with cell state and cannot be measured online in real time [
5]. DC power consumption is the most important part of production energy consumption, which is directly proportional to the size of the cell voltage, so appropriately reducing the cell voltage is one of the methods to achieve energy saving and consumption reduction in aluminum electrolysis [
6]. At present, aluminum electrolysis production mainly relies on manual experience to control. However, due to the nonlinear and strong coupling relationship between aluminum electrolysis production parameters, to achieve the purpose of reducing consumption and increasing production, the manual adjustment of certain parameters may lead to the transformation of the state of the aluminum electrolysis cell to the evil cell. It is necessary to appropriately reduce the voltage of the electrolytic cell, and then use the corresponding method to optimally control the state of the electrolytic cell to produce electrolytic aluminum under the best conditions, conducive to energy-saving and consumption-reducing production.
Aluminum electrolysis data are characterized by strong coupling and nonlinearity, making it difficult to obtain to establish the relationship between sampled parameters and the cell state. To address this challenge of whether the cell state judgment is accurate or not. Researchers have predicted the aluminum electrolysis cell state by the methods of mechanism modeling, machine learning, and deep learning. Cui et al. proposed a method combined the multi-support vector machine with the cell condition classification based on fuzzy C-mean algorithm to predict aluminum electrolysis concentration, so as to judge the state of the cell [
7]. He et al. proposed the use of deep learning to determine whether the aluminum electrolysis process would have an anodic effect, and thus whether the cell state would be in a normal or abnormal state [
8]. Gao et al. used a neural network algorithm to predict the state of aluminum electrolysis cells [
9]. Hou et al. proposed an LSTM-based prediction of aluminum electrolysis cell conditions [
10]. Xu et al. proposed a multiple limit learning machine based on a genetic algorithm to realize the prediction of cell voltage [
11]. However, due to the interference of external environment, the prediction effect often cannot reach the ideal state. Therefore, some other scholars have considered the use of different indicators such as current efficiency, temperature, anode effect, etc., to judge the state of aluminum electrolysis cell. Li et al. used the temperature as the main variable to determine whether the thermal equilibrium of the cell is in the normal state by thermocouple thermometry, infrared thermometry, and fiber grating thermometry [
12]. Fan et al. achieved the optimization of reducing DC energy consumption by improving the current efficiency [
13]. Some researchers have optimized cell voltage of aluminum electrolysis by using an intelligent algorithm to achieve energy-saving and consumption-reducing production [
14,
15]. Zhou et al. proposed an improved temporal convolutional network method to classify current sequences for the identification of cell states [
16]. However, most of the above methods for optimizing and controlling aluminum electrolysis production are aimed at controlling a single parameter of the electrolytic cell, without judging the cell state from a global perspective. In order to obtain a more accurate cell state, more indicators need to be considered to reflect the production and operation state of the electrolytic cell.
In the actual production process, in order to reduce the industrial energy consumption, enterprises and researchers mostly adopt the strategy of reducing the cell voltage. However, the relationship between the cell voltage and the relevant technical conditions cannot be simply modeled using mathematical expressions [
17]. Multi-index modeling can comprehensively consider multiple indicators or factors, making the model more comprehensive and closer to the actual situation. By considering multiple aspects, the complexity of the system can be better understood [
18,
19]. The relationship between the cell state and technical conditions can be well described by establishing a comprehensive evaluation index of groove state with multiple indexes. Compared with the traditional FCM algorithm, the adaptive FCM algorithm has stronger robustness, faster convergence speed, and wider applicability [
20,
21]. Therefore, the use of a multi-index comprehensive judgment model combined with an adaptive FCM algorithm can better judge the status of electrolytic cell. At present, the ARMA model is widely used in time-series data modeling and prediction for its advantages of wide applicability, simple use, and strong model interpretability. Gao et al. used the ARMA algorithm to analyze the historical data of abnormal population aggregation to predict the trend of abnormal human aggregation [
22]. Sansa et al. established the ARMA model for small changes in solar radiation and predicted the changes in solar radiation more accurately [
23]. The FNN algorithm has the advantages of strong adaptability, high parallel computing efficiency, strong generalization ability, flexible processing function approximation, and prediction problems [
24]. Therefore, the ARMA-FNN prediction model is established to monitor the state of the prediction cell in real time. In addition, the establishment of relevant models according to the process itself can not only optimize the process parameters, but also optimize the model through continuous collection of analysis data [
6]. In the aspect of cell voltage setting, the multi-objective optimization model of cell voltage can be established with the minimum difference between the average voltage and the target value and the good state of the cell as the goal, and the production operation requirement as the constraint condition, so as to obtain a set of better operating parameters, so as to achieve the purpose of energy saving and consumption reduction.
In this paper, when the cell condition is transformed into a wicked cell, a multi-objective optimization method of the cell voltage of the aluminum electrolysis process based on the comprehensive index judging model is proposed. First, a comprehensive index of cell states is established, and the cell states are categorized by the fuzzy C-means (FCM) clustering algorithm. Then, because of the severe hysteresis characteristics of the electrolysis cell, a cell-state model based on a fuzzy neural network is established to predict the trend of the cell state in the next 24 h. Finally, the important parameters of cell voltage are analyzed and simplified by using the PP algorithm. Aiming at the strong coupling characteristics between the parameters of aluminum electrolysis, the optimization setting model of the operating parameters is established to provide guidance for the energy-saving production of aluminum electrolysis.
2. Comprehensive Evaluation Model of Cell State
2.1. Mechanism Analysis
Aluminum electrolysis is a production process accompanied by many complex physical and chemical changes. There are many parameters to affect the cell state in the process, so that the cell state of aluminum electrolysis has complex and variable characteristics. A change in raw materials and operating parameters will probably transform a cell in good condition into a cold cell, hot cell, sick cell, or other bad cell.
The operating state of an electrolytic cell includes thermal balance state, material balance state, and stability state. The thermal equilibrium state of an electrolysis cell is defined as the state under the externally supplied electrical energy equaling the energy consumed by the decomposition of the alumina; that is, the heat income equals the heat expenditure. When the thermal equilibrium is disturbed, it will cause abnormal fluctuations in the electrolyte temperature. Material equilibrium is defined as a balanced relationship between the raw materials fed into the electrolysis cell and the raw materials consumed by the electrolysis process. The electrolyte height and the excess of aluminum fluoride can reflect the amount of material input, and the aluminum level and the amount of aluminum output reflect the amount of material consumption. If the amount of input is not equal to the amount of consumption, it will lead to fluctuations in the molecular ratio and the concentration of alumina in the electrolytic cell so as to cause the anode effect. Noise from the anode effect is a main parameter reflecting the stability of the electrolytic cell. In summary, aluminum fluoride excess (), electrolyte temperature (), aluminum level (), aluminum output (), alumina concentration (), molecular ratio (), noise (), and electrolyte height () can be used as parameters to classify cell states.
DC power consumption is the most important part of production energy consumption. The relationship of cell voltage and current efficiency is defined as follows [
25].
In the production process, the cell state is evaluated according to the experiences. The smaller the DC power consumption of the process is, the better the corresponding cell state is. That is, the average cell voltage is as small as possible, while the current efficiency is as large as possible. In addition, the anode effect reflects the stability of the electrolytic cell. The shorter the cumulative duration of the anode effect is, the better the cell condition is. Therefore, the degree of deviation of three parameters including the average cell voltage, current efficiency, and cumulative duration of anode effect from the ideal situation can be used as a comprehensive index for evaluating the state of an electrolytic cell.
2.2. Comprehensive Index of Cell State
After the state of an electrolytic cell is analyzed, the difference between its parameters in the equilibrium state and those in the ideal state is evaluated. These parameters contain cumulative effect time (
T), average cell voltage (
V), and current efficiency (
W). The extent to the values of the three parameters deviating from the ideal conditions in the cell can be used as a basis for judging the cell state. In order to finish the optimization and control of the cell state, the cumulative incidence of anodic effects in a day is hoped to be less, the average cell voltage close to the optimized value, and the current efficiency achieving to 1. Therefore, the comprehensive cell state space is shown in Equation (2).
where
is the optimized cell voltage. The
,
, and
represents the degree of deviation of the three quantities
,
, and
from the ideal state. A group of different
can represent a different cell state. The distance between
and the coordinate point of origin is used to measure the degree of superiority of the cell state.
Therefore, the composite index of cell state is defined as follows.
where
is the distance between
and the point of origin. It means that the larger
is, the greater the corresponding cell state of the sample point deviates from the ideal state, and the worse the cell state is. On the contrary, the cell state is better.
2.3. Comprehensive Judgment Model Based on FCM Cell State
In the process of cell state assessment, it is necessary to cluster similar cell states together. It is called clustering analysis of electrolytic cell states. Fuzzy cluster analysis is a mathematical method of classification using fuzzy mathematical language. Aiming at the fuzzy characteristics of the cell state, the adaptive FCM algorithm is adopted to determine the affinity degree of the samples to realize the electrolytic cell state classification. The superiority of the proposed algorithm is that the number of clustering categories
C of adaptive FCM takes values according to different experimental samples compared with traditional FCM. The affiliation matrix is defined as follows.
where the samples of it are obtained for each experiment, and
represents the affiliation of the
i-th sample for the
j-th class. The variable
I explains the correlation of the
i-th sample to the
j-th class and is defined in the following equation.
where the larger
is, the higher the correlation that the sample is assigned to that class. The samples set of cell state is set for
.
The implementation steps of the adaptive FCM algorithm are as follows.
Step 1: Determine the number of cell state categories C, n is the number of samples, V0 is the original clustering center, and set the initial iteration number t equal to 0.
Step 2: Calculate the cell state category classification matrix
U of the sample according to Equation (6).
where
is the
i-th sample,
is the
j-th center of clustering,
is the k-th center of clustering, and
is the degree of affiliation of
to
.
is equal to 2.
Step 3: Calculate the clustering center for the next iteration
according to Equation (7).
where
is the current clustering center.
Step 4: If
is true, then output the category partition matrix and the clustering center
V. Otherwise, go to Step 1, where
is the iteration stopping threshold.
Step 5: If is maximal, stop. Otherwise, go to Step 1.
Step 6: The degree of deviation of the three quantities T, V, and W from the ideal state, that is , is derived from Equation (2).
Step 7: According to Equation (3), the composite index of cell state is calculated for each category, with the larger being assessed as a poor cell, and the smaller being assessed as an excellent cell.
3. Cell-State Prediction Model Based on ARMA-FNN
When the electrolytic cell is disturbed and transited into a bad cell, the settings of controllable parameters can be adjusted in time according to the current state to prevent the electrolytic cell state from turning in a worse cell. To correctly predict the electrolytic cell state is the key to preventing the cell from transforming into a bad result. Therefore, a model for predicting the cell state is developed. As analyzed in Chapter 1, the variable can reflect the production status of the electrolytic cell from a global perspective. Moreover, when the inputs of control system are unchanged, the variable will evolve in a stable trend. When the inputs of control system are changed, the variable will change with the original because a worker modifies the setting of controllable parameter in response to a change in cell state. Thus, the future cell state contains two parts. One is the historical continuation of the current state , and the other is the control effect of the current input of the system. To predict the future cell state, the composite index is predicted by using a time-series method, and then a neural network is used to fuse with the input parameters of the system.
3.1. Comprehensive Cell Condition Indicator Time-Series Prediction Model Based on ARMA
The time series of the comprehensive index
d is similar to being stable. In a word, if the inputs to the system are constant,
will evolve in a relatively stable trend. The ARMA model is one of most widely used methods in time series. It firstly makes a difference operation to change the original series into a smooth time series. Then, an auto-correlation function (ACF) and partial auto-correlation function (PACF) are used to determine the initial order. Finally, the above function is estimated by the maximum likelihood method or weighted least squares method. The ARMA (m, n) model consists of an auto-regressive (AR) and moving average (MA). The general representation of the model is described in Equation (9) [
26].
where
is the cell-state indicator
d observed at moment
t.
is the auto-regressive coefficient,
is the moving average coefficient, and
is the white noise sequence.
The m and n in an ARMA model are generally determined by the Akaike information criterion (AIC) [
27,
28,
29]. If the AIC of the ARMA (
m,
n) is minimized, then it means that the model is the most effective in forecasting the time series. The AIC criterion is shown in Equation (10).
where
,
denotes the error variance of the model and
N is the number of observations.
Because there is complex noise in the time series of the cell state, the AIC can easily fall into the local optimum. The ALO algorithm [
30] is adopted to determine the order ARMA (
m,
n) of the model, and to predict the indicator
d of the cell state in the time series. The steps of the algorithm are described. An individual
represents a set of parameters of ARMA, and the fitness of the individual measures the performance of the algorithm for that set of parameters.
Step 1: Population random initialization. Randomly generate n ants and m antlions, set the upper and lower bounds of the search space and , set the population size N of antlions and ants, and set the maximum number T of iterations.
Step 2: Individual fitness values are calculated according to Equation (11).
where
represents the fitness value of the i-th individual,
represents the predicted value of the i-th individual, and
represents the mean value of all samples.
Step 3: Update the location of ants, antlions, and elite antlions according to the ALO algorithm.
Step 4: Determine whether the termination condition is satisfied, if not then go to Step 3, if satisfied then obtain the optimization parameter (m, n) and execute the next step.
Step 5: The ARMA (m, n) model is applied to predict .
3.2. A Prediction Model for Cell State Based on FNN
In the process of aluminum electrolytic production, the state of the electrolytic cell is affected by the workers adjusting the amount of aluminum discharged (
). The controllable parameters of electrolytic cell include alumina concentration (
), molecular ratio (
), and cell resistance (
). To obtain the future cell state, the method of fuzzy neural networks is modeled to predict and measure the cell state after controlled parameters happen to change. The inputs of the prediction model is the result of combining
with
,
,
, and
. The output of the prediction model is the future cell state (
). The
is defined in the following equation.
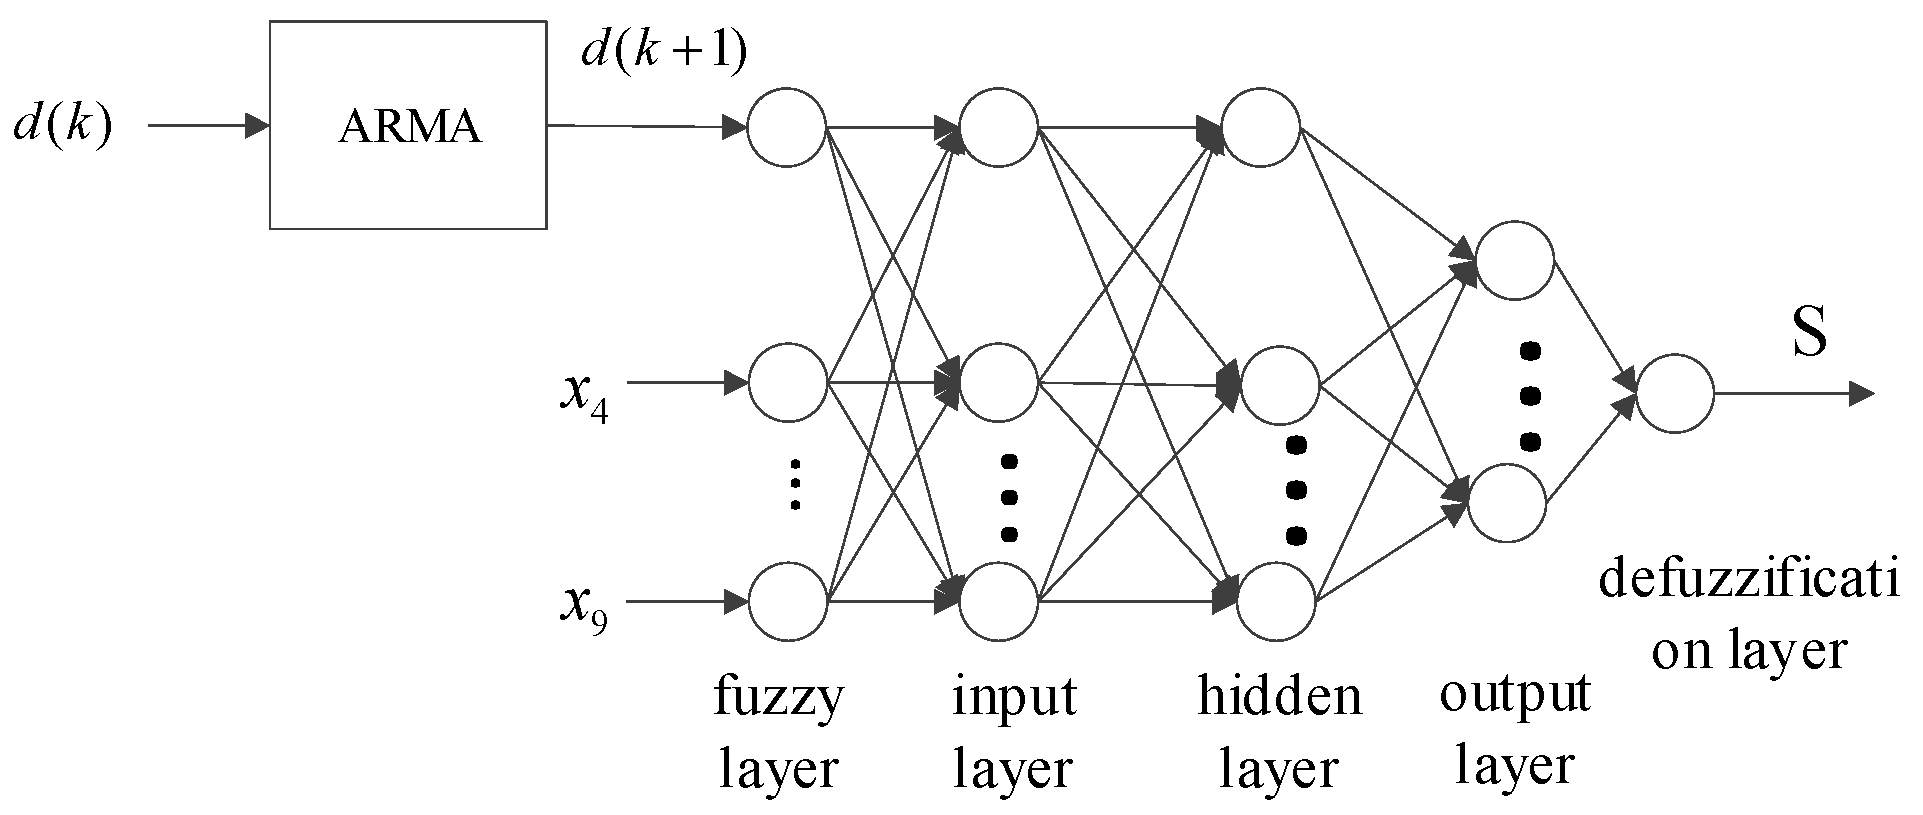
The FNN method combines the excellent learning obtained using the computation ability of a neural network with the excellent fuzzy knowledge expression ability of fuzzy theory. Thus, this algorithm is often used in fault diagnosis of production and good diagnostic results are obtained [
31]. FNN is used to model the future cell state, and its model structure is shown in
Figure 1.
Considering the single-peak characteristic of cell state, a Gaussian affiliation function is used in the fuzzification layer when modeling cell state. The Gaussian affiliation function is defined as follows.
where the parameter
c represents the horizontal coordinate of the peak of the Gaussian affiliation function and the parameter
σ represents the standard deviation.
The structure of the prediction model is based on a BP neural network. It has the advantage of setting the number of intermediate layers and the number of neurons in each layer according to the training effect of the model. The model has a good learning ability in dealing with nonlinear problems. The number of neurons in the fuzzification layer is the number of input parameters, equal to 5. The number of neurons in the defuzzification layer is 1. The number of neurons in the input layer is the result of the number of the output parameters multiplying the number of the fuzzification layer equal to 5. The number of neurons in the hidden layer is determined by the following empirical formula.
where
is the number of neurons in the hidden layer,
is the number of input parameters, and
is the number of output parameters.
. Here,
is equal to 12.
4. Optimization Setting Model
For the excellent cell state, the operator can adjust the parameters to realize energy-saving production by reducing the cell voltage under the condition of ensuring a good cell state. When the electrolytic cell develops into an evil cell, the controllable parameter settings should be adjusted in time according to the current state to avoid the cell state from turning into a worse cell. For this reason, based on the above result of predicting the cell state in the
Section 3.2, an optimized setting model is established according to the control target of adjusted parameters and the requirements of actual operation, and solved by the MOALO algorithm.
4.1. Influencing Cell Voltage Parameters
In electrolytic aluminum production, the electrolyte temperature, alumina concentration, and mole ratio are the main production parameters reflecting the equilibrium of the cell state. When the three parameters change, the conductivity of the electrolyte will be disturbed, so as to change the resistance of the electrolytic cell. If the production current remains constant, the cell voltage changes. The stability of alumina concentration is the key factor to ensure the stability of electrolytic production. When the alumina concentration is too low, anodic effects will happen; at the same time, the cell voltage will rise sharply. Pole pitch is defined as the distance from the bottom palm of the anode to the mirror surface of the aluminum liquid. When pole pitch transits, the resistance between the two poles will change, so as to affect the electrolyte pressure drop and ultimately lead to the change in the cell voltage. Changing the pole pitch is a more accurate and quicker way to change the cell voltage. Therefore, the main method used in the production process is to adjust the cell voltage by adjusting the pole pitch. Aluminum is a good heat conductor, so the height of the aluminum liquid affects the temperature and the heat balance of the electrolytic cell and the stability of the cell voltage.
The electrolyte level relates to the stability of the electrolytic cell. If the electrolyte level is too low, the anode effect occurs when the anode is not sufficiently wetted, which will lead to a high cell voltage. In summary, the main technical conditions affecting the cell voltage () were determined by electrolyte temperature (), aluminum level (), aluminum output (), alumina concentration (), molecular ratio (), cell resistance (), pole pitch (), electrolyte level (), and electric current ().
4.2. Data Preprocessing Based on PP Algorithm
The actual production data contain a large amount of information, and there are numerous and only non-linear parameters affecting the cell voltage. In order to accurately analyze the parameters affecting the cell voltage to improve the accuracy of cell voltage prediction, the projection pursuit algorithm (PP) is used for data preprocessing [
32]. The correlation of electrolyte temperature (
), aluminum level (
), aluminum output (
), alumina concentration (
), molecular ratio (
), cell resistance (
), pole pitch (
), electrolyte level (
), and electric current (
) to cell voltage are obtained by finding the optimal projection direction in the PP algorithm. The projection function in the PP algorithm is used to optimize the model, and the optimal projection direction can be found by a genetic algorithm to be (0.347, 0.089, 0.196, 0.550, 0.284, 0.628, 0.211, 0.083, 0.189). This is the value of the contribution of these parameters to the cell voltage. Since the contributions of
and
are significantly smaller than those of
,
,
,
,
,
, and
, the input parameters of the model can be chosen as the electrolyte temperature
, the aluminum output
, the concentration of alumina
, the molecular ratio
, the cell resistance
, the pole pitch
, and the electric current
.
4.3. Model for Optimized Setting of Operating Parameters
In the process of electrolyte use, an electrolytic cell deviating from the optimal production state can be brought back to the optimal state through adjusting these operation parameters including temperature (
), aluminum output (
), alumina concentration (
), molecular ratio (
), cell resistance (
), pole pitch (
), and electric current (
). It is very important for energy saving to keep the fluctuation of cell voltage stable. Therefore, the cell state needs to be restored to the normal and cell fluctuation needs to be kept in stable range. Considering the production operation requirements as the constraints, the optimization setting model is established as follows.
where
,
, and
obtained by process analysis are the baseline cell resistance, baseline molecular ratio, and baseline alumina concentration, respectively. Here,
is equal to 0.0113,
is equal to 2.10, and
is equal to 3.32.
is obtained by Equation (2) and equal to 3.8446 in this paper [
10].
is the average cell voltage from data collected at the factory,
is the cell-state prediction model from Equation (12), and
represents the future cell state infinitely close to the optimal cell state. This optimization problem is that the value of the operating parameter needs to be adjusted to meet the requirements through effective intelligent optimization algorithm to restore the cell status to normal.
4.4. Optimization of Operating Parameters Based on MOALO
When solving multi-objective optimization problems, multiple objectives often conflict. As a multi-objective optimization set, Pareto optimal solutions [
33,
34] are often used to address the best trade-off between objectives.
The MOALO algorithm shows better convergence, accuracy, and robustness on solving multi-objective optimization problems. To search for a highly diverse set of Pareto-optimal solutions, the algorithm uses leader selection and archive maintenance to store Pareto-optimal solutions and roulette rules to select non-dominated solutions from them. The probability of choosing an antlion among them is as follows.
where
denotes the number of solutions in the neighborhood of the
j-th solution and
c denotes a constant. If the archive storing the optimal solution is full, the archived solution set will be deleted with the probability of
. Unlike ALO, the antlion position is updated in MOALO, and is described as follows.
where
less than
means that
prevails over
.
The optimization setting model is solved using MOALO as follows.
Step 1: Population random initialization. Randomly generate n ants and m antlions, set the upper and lower bounds of the search space and , set the population size N of antlions and ants, and set the maximum number T of iterations.
Step 2: Calculate individual fitness values.
Step 3: Update and archive locations of ants, antlions, and elite antlions according to the ALO algorithm. If the updated ant position is better than the selected antlion, the position of the antlion updates to the ant position.
Step 4: If the archive space is full, a portion of the solution is removed with the probability of using a roulette rule.
Step 5: Determine whether the stopping condition is reached. If it is reached, then the algorithm ends and the optimal operation parameter is obtained. Otherwise, jump to Step 3.
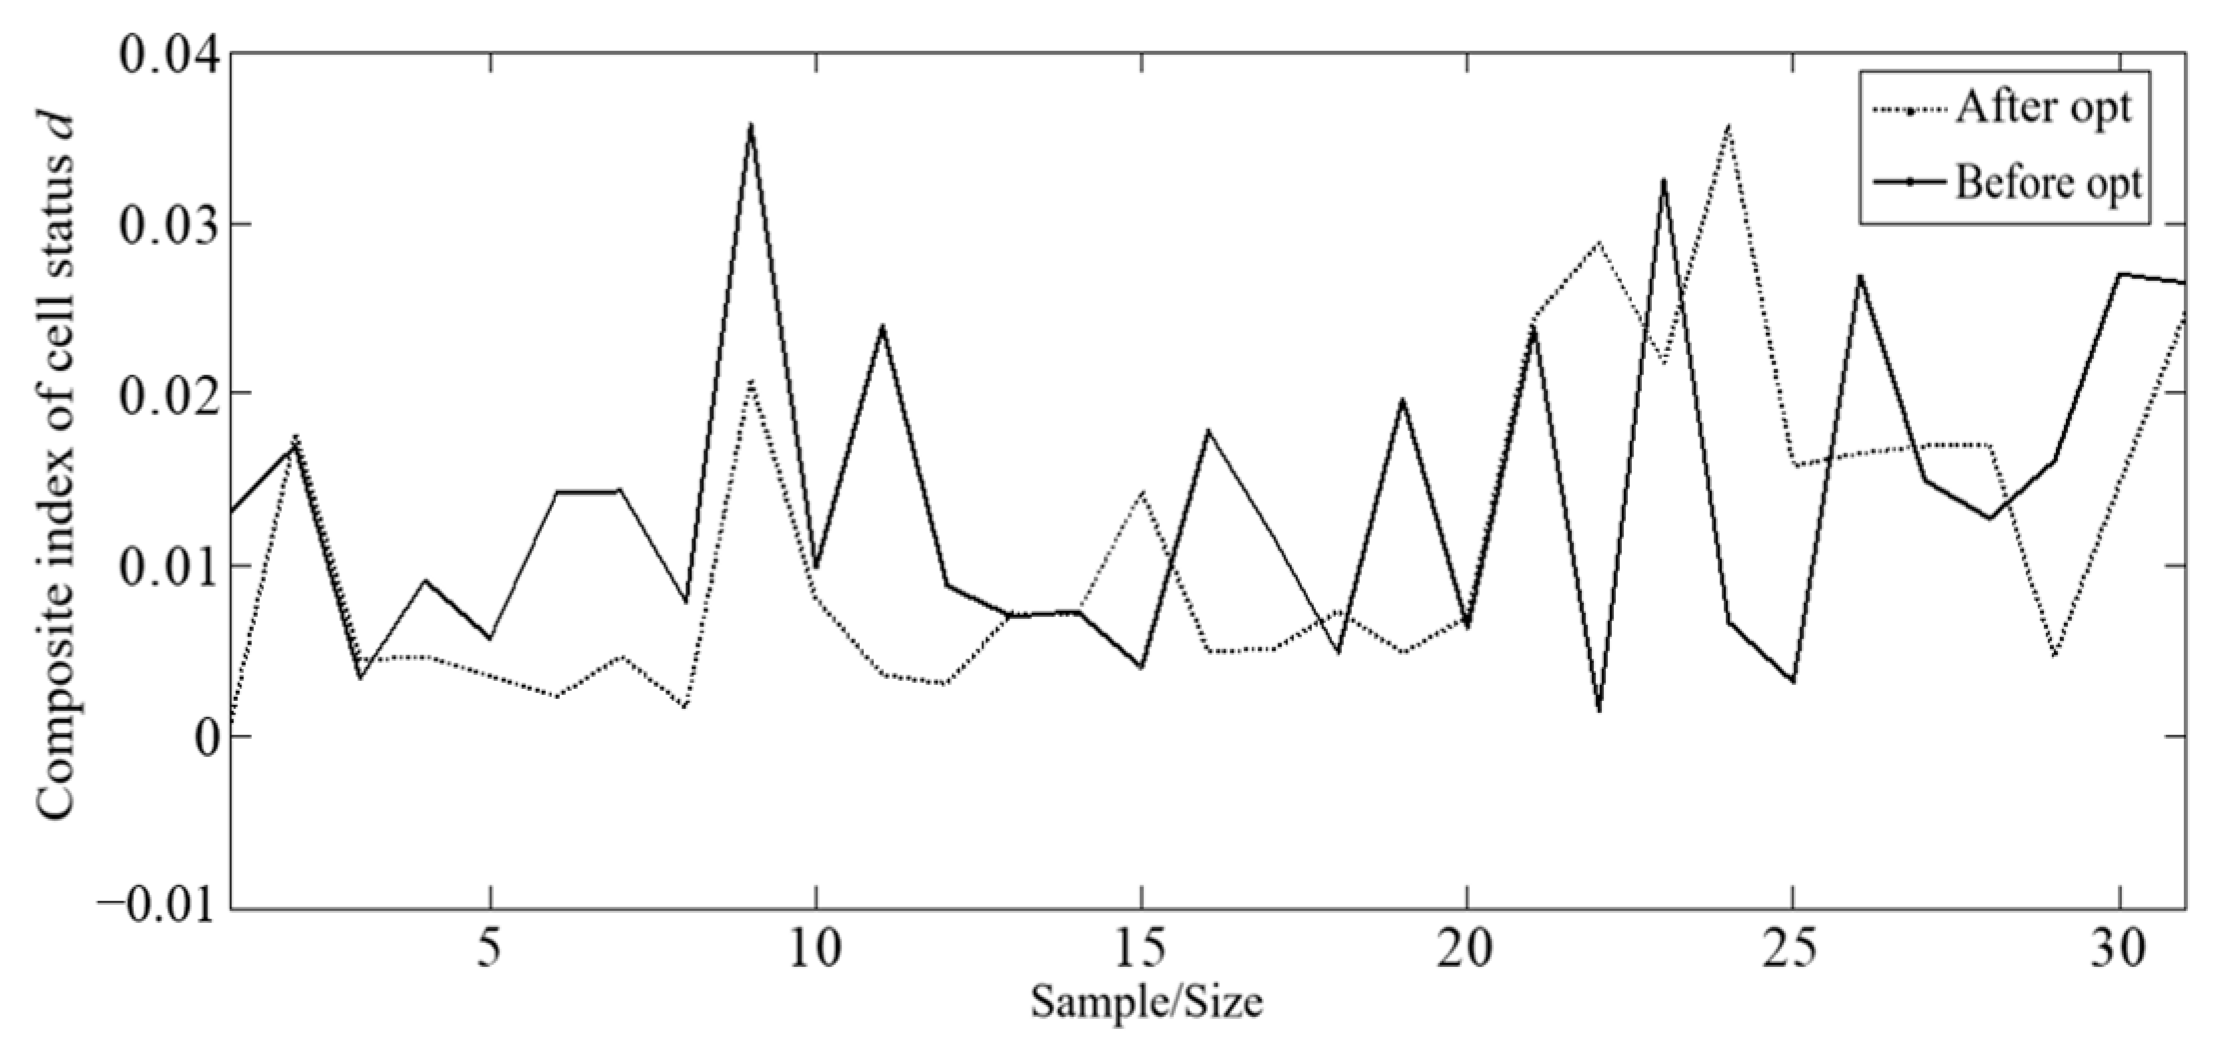
To check whether the obtained operating parameters are optimal, the obtained values of the optimized setting are substituted into the cell-state prediction model to be verified. The optimization target is judged by analyzing the value composite index d. Furthermore, the derived optimization setpoints can be used to realize optimization control of the process.
6. Conclusions
In this paper, a multi-objective optimization method for aluminum electrolysis process is proposed with the starting point of energy-saving and consumption-reducing production of aluminum electrolysis. To represent the three states of heat balance, material balance, and stability of the electrolytic cell, a comprehensive cell state index is defined, and the FCM is applied to judge the current cell state. In addition, a predictive model of the cell state was developed to predict the state after 24 h. Finally, the multi-objective optimal control of the aluminum electrolysis process is realized by establishing an optimization setting model. The method proposed in this paper focuses on the energy-saving and consumption-reducing production of aluminum electrolysis by setting operating parameters in case the cell condition develops into a bad cell. For the case of an excellent cell condition, the plant operator can realize energy-saving production of aluminum electrolysis by appropriately reducing the cell voltage without adjusting the electrolytic cell. When the cell condition develops into a vicious cell, the operating parameter optimization model can provide a set of reasonable operating parameter setting values. Then, the downstream control system can quickly stabilize the electrolytic cell and achieve energy saving and consumption reduction in the aluminum electrolysis production process through low-voltage production.
The above can provide a referable method for the aluminum electrolysis industry to achieve energy savings. However, since there may be more factors affecting the electrolytic cell with more uncertainties in an actual aluminum plant, the aluminum electrolysis production process should be analyzed from more perspectives in the future, such as such as cell condition diagnosis and superheat analysis of aluminum melting furnaces, in order to achieve a more energy-saving and higher energy-consumption reduction concept.


