Article

McmIQA: Multi-Module Collaborative Model for No-Reference Image Quality Assessment

School of Artificial Intelligence and Computer Science, Jiangnan University, Wuxi 214122, China
*
Author to whom correspondence should be addressed.
Mathematics 2024, 12(8), 1185; https://doi.org/10.3390/math12081185
Submission received: 20 March 2024 / Revised: 3 April 2024 / Accepted: 9 April 2024 / Published: 15 April 2024
(This article belongs to the Section Mathematics and Computer Science)

Abstract

:
No reference image quality assessment is a technique that uses computers to simulate the human visual system and automatically evaluate the perceived quality of images. In recent years, with the widespread success of deep learning in the field of computer vision, many end-to-end image quality assessment algorithms based on deep learning have emerged. However, unlike other computer vision tasks that focus on image content, an excellent image quality assessment model should simultaneously consider distortions in the image and comprehensively evaluate their relationships. Motivated by this, we propose a Multi-module Collaborative Model for Image Quality Assessment (McmIQA). The image quality assessment is divided into three subtasks: distortion perception, content recognition, and correlation mapping. And specific modules are constructed for each subtask: the distortion perception module, the content recognition module, and the correlation mapping module. Specifically, we apply two contrastive learning frameworks on two constructed datasets to train the distortion perception module and the content recognition module to extract two types of features from the image. Subsequently, using these extracted features as input, we employ a ranking loss to train the correlation mapping module to predict image quality on image quality assessment datasets. Extensive experiments conducted on seven relevant datasets demonstrated that the proposed method achieves state-of-the-art performance in both synthetic distortion and natural distortion image quality assessment tasks.

1. Introduction

As a fundamental research direction in the field of computer vision, image quality assessment is widespread applicated in both scientific research and daily life. With the advent of the mobile internet era, various online platforms such as TikTok, Instagram, and YouTube witness the daily upload of billions of user-generated images and videos. For these platforms, assessing the image quality in a manner closely related to human visual perception and using it as a reference for content recommendation is crucial for enhancing user experience. Simultaneously, as a core technology for these platforms, image quality assessment is extensively employed in information recommendation, data filtering, compression, and storage, etc. In the realm of scientific research, image quality assessment algorithms can also assist in evaluating other tasks’ approaches within the field of computer vision, contributing to the optimization and improvement of various image processing techniques. Consequently, accurately predicting the perceptual quality of diverse images using automated methods remains a pressing challenge—one that significantly impacts various aspects of both daily life and scientific inquiry.
Image quality assessment can be divided into three categories: full-reference image quality assessment (FR-IQA), reduced-reference image quality assessment (RR-IQA), and no-reference image quality assessment (NR-IQA). Full-reference image quality assessment algorithms such as SSIM [1], FSIM [2], and LPIPS [3] require both the original and the distorted versions of an image for evaluation. This requirement prevents them from predicting the quality of real-world images where no reference image is available, greatly limiting their applications. On the other hand, no-reference image quality assessment algorithms such as BRISQUE [4], PaQ-2-PiQ [5], and CONTRIQUE [6] do not require the original reference image or any information related to image distortions when assessing the visual quality of an image, directly quantifying the target image’s perceived quality. This makes them the only solution for field image quality evaluation problems holding a broad prospect of application.
Over the past decade, NR-IQA has always been a popular research topic in the field of computer vision, leading to the development of numerous excellent evaluation models and image quality assessment datasets. Traditional image quality assessment datasets, such as TID-2013 [7], LIVE [8], and CSIQ [9], consist of synthetically distorted images, which are created by artificially adding common distortions (Gaussian blur, JPEG compression, white noise, etc.) to originally high-quality images. The emergence of these datasets has played a crucial role in advancing the field of image quality assessment, and scholars still use the model performance on these datasets as an important metric for evaluating model capabilities. However, in real life, images can be affected by various factors during different stages, including generation, transmission, and compression storage, which cause all kinds of distortions. Moreover, these distortions might concentrate or even overlap in certain parts of the image, which is difficult to simulate with traditional synthetic distortion images. To address this issue, some new datasets composed of real images, such as KONIQ-10K [10], CLIVE [11], and SPAQ [12], have been introduced recently. Model performance on these datasets will largely demonstrate the predictive capabilities of the models in practical applications.
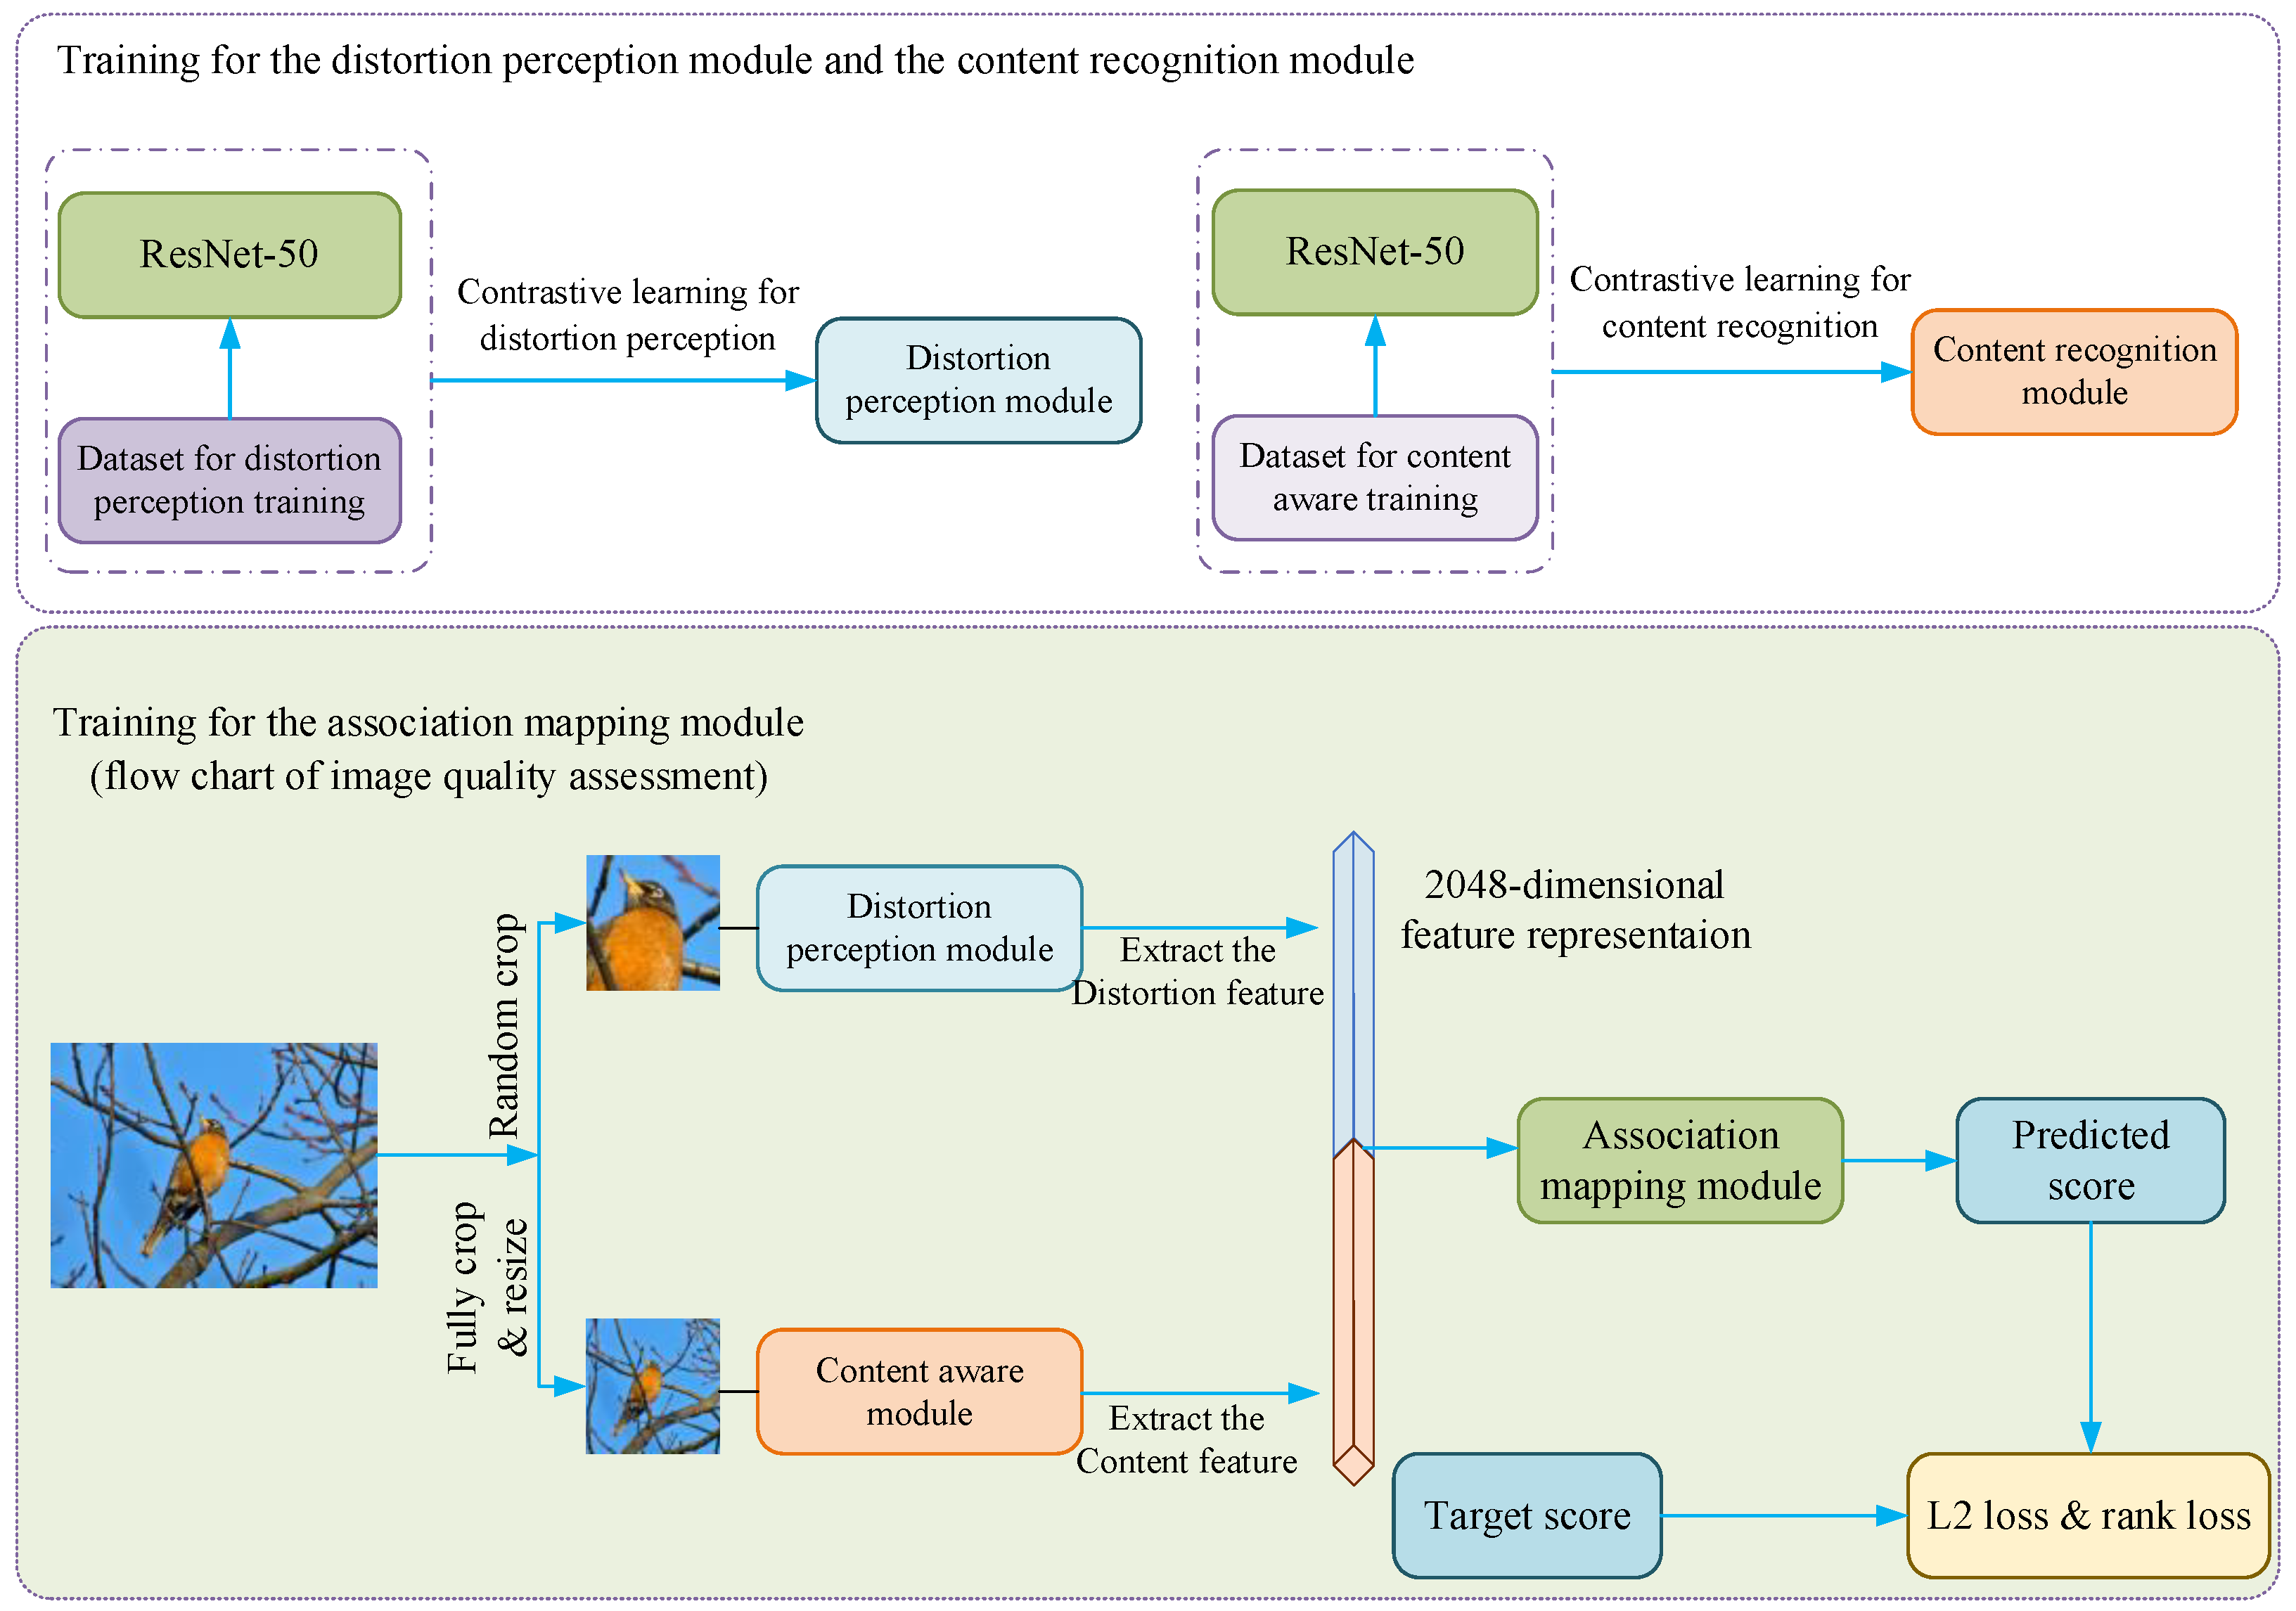
As semiconductor technology, parallel computing techniques, and deep neural network models continue to evolve, deep models with a large number of tunable parameters have achieved widespread success in the field of computer vision. This has led to the development of numerous no-reference image quality assessment algorithms based on deep models. Compared to traditional algorithms that rely on natural scene statistics, these deep model-based approaches have significantly improved performance. However, deep model algorithms still fall short of simulating human visual perception due to various factors. Currently, the application of deep models in image quality assessment faces two main limitations: (1) Training deep models requires a substantial amount of labeled data. However, annotating datasets specifically for image quality assessment is expensive and challenging to ensure availability. Existing labeled datasets are insufficient to support comprehensive deep model training. (2) Most deep models built for computer vision tasks focus solely on image content. However, in image quality assessment, perceived image quality depends on various factors, including image content, introduced distortions, and their intricate relationships. Designing an end-to-end quality assessment solution with a deep model that considers all these factors simultaneously remains challenging. To address these issues, we propose a framework that leverages contrastive learning to train Multiple Collaborative Modules for Image Quality Assessment (McmIQA), corresponding modules are trained on multiple large-scale datasets for subtasks. The proposed approach consists of three parts, as follows:
(a)
We further divided the image quality assessment task and used three modules: the content recognition, the distortion perception, and the correlation mapping modules. These modules are responsible for extracting content features, extracting distortion features, and ultimately evaluating quality.
(b)
Based on contrastive learning, we have designed two distinct self-supervised training frameworks for the content recognition module and the distortion perception module. Training these modules on large datasets for their respective customized tasks ensures accurate feature recognition in both cases.
(c)
When training the correlation mapping module on image quality assessment datasets, we froze the parameters of the content recognition module and the distortion perception module. We used a larger batch size to train the correlation mapping module independently. Additionally, during this stage, we employed a composite loss based on ranking and mean squared error (MSE). This approach not only helps the module fit real quality scores but also enables the model to recognize relative quality differences between different images.

2. Related Work

In the past decade, significant efforts have been devoted to the development of no-reference image quality assessment algorithms. Traditionally, before the rise of deep learning, constructing image quality assessment models based on Natural Scene Statistics (NSS) theory was the mainstream approach. NSS assumes that the composition of original natural images follows certain statistical distributions, and the presence of various distortions disrupts these statistical regularities [13]. Based on this assumption, researchers have built distortion feature extractors for different spatial domains within images, including the spatial domain [14,15], frequency domain [16,17], and gradient-based methods [18]. Methods like CORNIA [19] and HOSA [20], which utilize local patches to construct dictionaries for obtaining quality-aware features, also rely on NSS. In practice, NSS-based methods generally yield acceptable results when evaluating synthetic distorted images. However, their evaluation performance significantly deteriorates when faced with real-world images. These methods primarily focus on modeling various distortions in images as statistical deviations from natural distributions, but they overlook the combined effects of multiple distortions and the influence of image content on perceived quality.
In recent years, the emergence of deep learning has provided a new solution for computer vision tasks. Various computer vision algorithms built upon deep learning have achieved unprecedented breakthroughs and successes. Among these, several deep neural networks have been proposed for image quality assessments. Most no-reference image quality assessment approaches based on deep learning follow a pre-training–finetuning paradigm to mitigate the issue of small dataset sizes. In the RAPIQUE [21] authors proposed a two-step approach: pre-training on the ImageNet dataset followed by fine-tuning for image quality assessment tasks, resulting in improved performance for quality evaluation using a ResNet-50 [22] model. In the PQR [23] approach, an innovative strategy involves using statistical distributions of subjective opinion scores as auxiliary labels during model training, leading to additional gains. The BIECON [24] method introduces a pretext task that involves fitting FR-IQA prediction scores during pre-training. Additionally, there are image quality assessment algorithms based on multi-module perception. For instance, in DBCNN [25], the authors employed dual-path technology to separate the perception of distortion features and content features, which are then combined during prediction. Another approach [26] introduced an adaptive hypernetwork architecture that considers content understanding during perceptual quality prediction.
In recent years, there have been many image quality assessment algorithms based on self-supervised learning. As an essential approach to address the issue of small datasets, self-supervised learning is often used to construct upstream pretext tasks, which, in turn, provide better data representations for downstream tasks [27]. In simple terms, self-supervised learning directly trains the model on tasks that do not require manual annotations, such as reconstructing input pixels [28] or predicting predefined image categories [29,30], etc. Inspired by the success of masked language modeling in natural language processing, masked image modeling has become a hot trend in the field of computer vision [31,32]. Another form of self-supervised learning is contrastive learning, which aims to train models to create a mapping. Through this mapping, similar data points are pulled together, while dissimilar samples are pushed apart [33]. CONTRIQUE [6] proposed a contrastive learning scheme to pre-train image quality assessment models by predicting distortion types and severity. In [34], researchers introduced a method that generates synthetic distorted images by randomly overlaying various distortions. They used contrastive learning to train models to perceive approximate quality features on this dataset. Re-IQA [35] trained a hybrid perceptual model for image quality assessment with contrastive learning. This work is quite similar to our approach, with two different pre-training methods, contrastive learning and ImageNet image classification, they separately trained extraction modules for distortion and content features. Finally, they fine-tuned the regression layers and predicted image quality on image quality assessment datasets. In contrast, focusing on distortion perception and content recognition, we designed two distinct schemes for image cropping and contrastive learning to train our distortion perception module and content recognition module. Additionally, by incorporating a ranking-based approach during prediction training for the correlation mapping module, we trained the model to judge relative quality differences between different images, achieving more stable and accurate quality assessment results.

3. McmIQA: Multi-Module Collaborative Model for NR-IQA

Our approach can be specifically divided into three components: (1) Distortion perception module training based on intelligent cropping and MOCO-V2 [36,37] contrastive learning. (2) Content recognition module training based on global cropping and MOCO-V3 [38] contrastive learning. (3) Correlation mapping module training with an approach based on rank learning on image quality assessment datasets. The overall framework is shown in Figure 1.

3.1. Distortion Perception Module Training

Figure 2 illustrates the contrastive learning training framework for the distortion perception module based on MOCO-V2. We utilized the distortion image dataset construction method from reference [34], with images in the Waterloo [39] dataset, and the COCO [40] dataset generated our image set for module training. The proposed training framework primarily consists of patch generation and contrastive learning training with momentum updates. For a detailed algorithm flow, please refer to Algorithm 1.
Algorithm 1: Distortion perception module training based on contrastive learning
# f_q, f_k: encoder networks for query and key
# queue: dictionary as a queue of 64*64 keys
# m: momentum
# t: temperature
f_k.params = f_q.params # initialize
 for epoch = 1,2,3…150 do:
  for batch = 1,2,3… do:
   x_q, x_k = smart_aug(x) # Smart cropping
   q = f_q.forward(x_q)
   k+, k = f_k.forward(x_k), f_k.forward(queue)
   positive_m, negative_m = q* k+, q*k-
   similarily_m = concat(positive_m, negative_m)
   InfoNCE_LOSS = InfoNCE(similarily_m, target_m)
   InfoNCE_LOSS.backward()
   update(f_q.params) # Gradient updates
   f_k.params = m * f_k.params + (1-m) * f_q.params
   # Update the momentum dictionary
   Dequeue(queue)
   Enqueue(queue, k_batch)
The diversity of distortion types, the variability in distortion severity, and the uneven distribution of distortions within an image lead to the complexity and difficulty of distortion perception. Given this, we made the following assumptions regarding the internal characteristics of distortions during training for the distortion perception module: (1) Due to the inherent diversity of individual images, image enhancement processes applied to different images will generate patches containing different types of distortions. (2) When applying different image enhancement techniques to the same image, the resulting patches will contain different types of distortions based on the specific distortions introduced. (3) Due to the uneven distribution of distortions within an image, when applying the same type of image enhancement to the same image, the resulting patch will only contain the same type of distortion if the overlap area reaches at least 30%. Based on these assumptions, during training, sample pairs containing the same type of distortion are labeled as positive pairs, while the rest are considered as negative pairs. In the training process, we directly perform random cropping on the dataset images to obtain query batches. Subsequently, based on the previously cropped center points, we apply intelligent overlay cropping to the same image, resulting in corresponding positive pairs with overlap areas between 30% and 70%. We utilize the MOCO-V2 contrastive learning framework with two ResNet-50 models, one as the encoder and the other as the momentum encoder. The encoder module is updated based on the gradients of InfoNCE [41], which is defined as follows:
InfoNCE   loss   = log exp q × k + / τ i = 0 K exp q × k i / τ
k+ represents the positive sample corresponding to the current query q, and τ denotes the temperature coefficient. The momentum encoder will be updated based on momentum after the encoder completes one round of updates:
θ = m × θ + 1 m × φ
In the formula, θ represents the internal parameters of the momentum encoder model, while φ denotes the internal parameters of the encoder. m is the momentum parameter used for updating the momentum encoder’s parameters.

3.2. Content Recognition Module Training

During the content recognition training, we trained the content recognition module to extract the overall framework of image content and generate corresponding feature vectors. Figure 3 illustrates the contrastive learning training framework for the content recognition module based on MOCO-V3. The training of the content recognition module is performed using a dataset from ImageNet [42], which contains 1.28 million images across 1000 classes. For detailed algorithm flow, refer to Algorithm 2.
Algorithm 2: Content aware module training based on contrastive learning
# f_q, f_k: encoder networks for query and key
# m: momentum
# t: temperature
f_k.params = f_q.params # initialize
 for epoch = 1,2,3…150 do:
  for batch = 1,2,3… do:
   x1_batch, x2_batch = aug(x_batch) # Smart cropping
   q1, q2 = f_q.forward(x1_batch), f_q.forward(x2_batch)
   k1, k2 = f_k.forward(x2_batch), f_k.forward(x1_batch)
   mtx_1, mtx_2 = q1 * k1, q2 *k2
  end for
 end for
   loss = InfoNCE(mtx_1, target) + InfoNCE(mtx_2, target)
   loss.backward()
   update(f_q.params) # Gradient updates
   f_k.params = m * f_k.params + (1 − m) * f_q.params
In daily life, image content is the key factor that determines whether an image captures attention and brings pleasure. However, unlike the diverse types of distortions introduced by random overlays and random distributions in natural image distortions in real-life images are generated based on people’s subjective ideas. The content of these images is guided by human thoughts, often resulting in many similar or even identical images. Therefore, in the contrastive learning training of the content recognition module, when constructing a negative sample queue based on the MOCO-V2 framework, it is common to encounter negative sample pairs that contain similar content, leading to optimization mistakes. To address this, we train the content recognition module with a MOCO-V3 framework. Furthermore, to help the model gain a more comprehensive and complete understanding of image content, during the training of the content recognition module, for each image in batch, we select two out of the sixteen image enhancement methods (as shown in Figure 4) that do not affect the image content to process the image and generate positive sample pairs. Additionally, we apply full cropping and pixel scaling to create image patches. After two sets of images are formed, they will be served as dictionary collections to each other.

3.3. Correlation Mapping Module Training

Firstly, regarding the construction of the correlation mapping module, drawing inspiration from relevant research in [35], we will employ a three-layer regression approach to construct the correlation mapping module. This module aims to map a 2024-dimensional feature vector to a quality score. During the training process, by freezing the parameters of the distortion perception module and the content recognition module, we will utilize a larger batch size. Additionally, we will independently train the correlation mapping module using a composite loss that combines rank loss and mean squared error (MSE). Benefiting from the larger batch size, training the correlation mapping module with frozen module weights will lead to improved fitting performance. By employing the composite loss during training, the model will not only fit image perceptual quality but also discriminate relative quality among different images, better simulating the human visual system to assess the image quality. The rank loss is defined as follows:
r a n k y ,   y = i = 1 N j = 1 N 0 ,   i f   y j < y i     o r   i = = j M a x 0 , y i y j + y j y i ,   o t h e r w i s e
In the formula, y represents the label vector for the current batch, and y represents the model’s predicted score vector. Using the above formula, we will compare the relative quality of all (N × (N − 1)/2) image pairs in one batch, resulting in an accumulated loss value. During the actual implementation, to fully leverage the GPU’s parallel computing capabilities and enhance computational efficiency, we will utilize matrix operations to compute the loss values. The composite loss that combines the rank and the MSE losses is defined as follows:
L y ; y ; ø = 1 N t = 1 M y t y t 2 + ε × r a n k
In the formula, N represents the batch size, and ε will be set as a balancing weight of 0.5.

4. Experiments

4.1. Datasets and Evaluation Criteria

In this work, we primarily utilized three types of datasets: (1) The dataset constructed with the method proposed in [34]; this dataset was used for training the distortion perception module. (2) The ImageNet dataset for the content perception module training. (3) Image quality assessment datasets to train the correlation mapping module and evaluate the model’s performance.
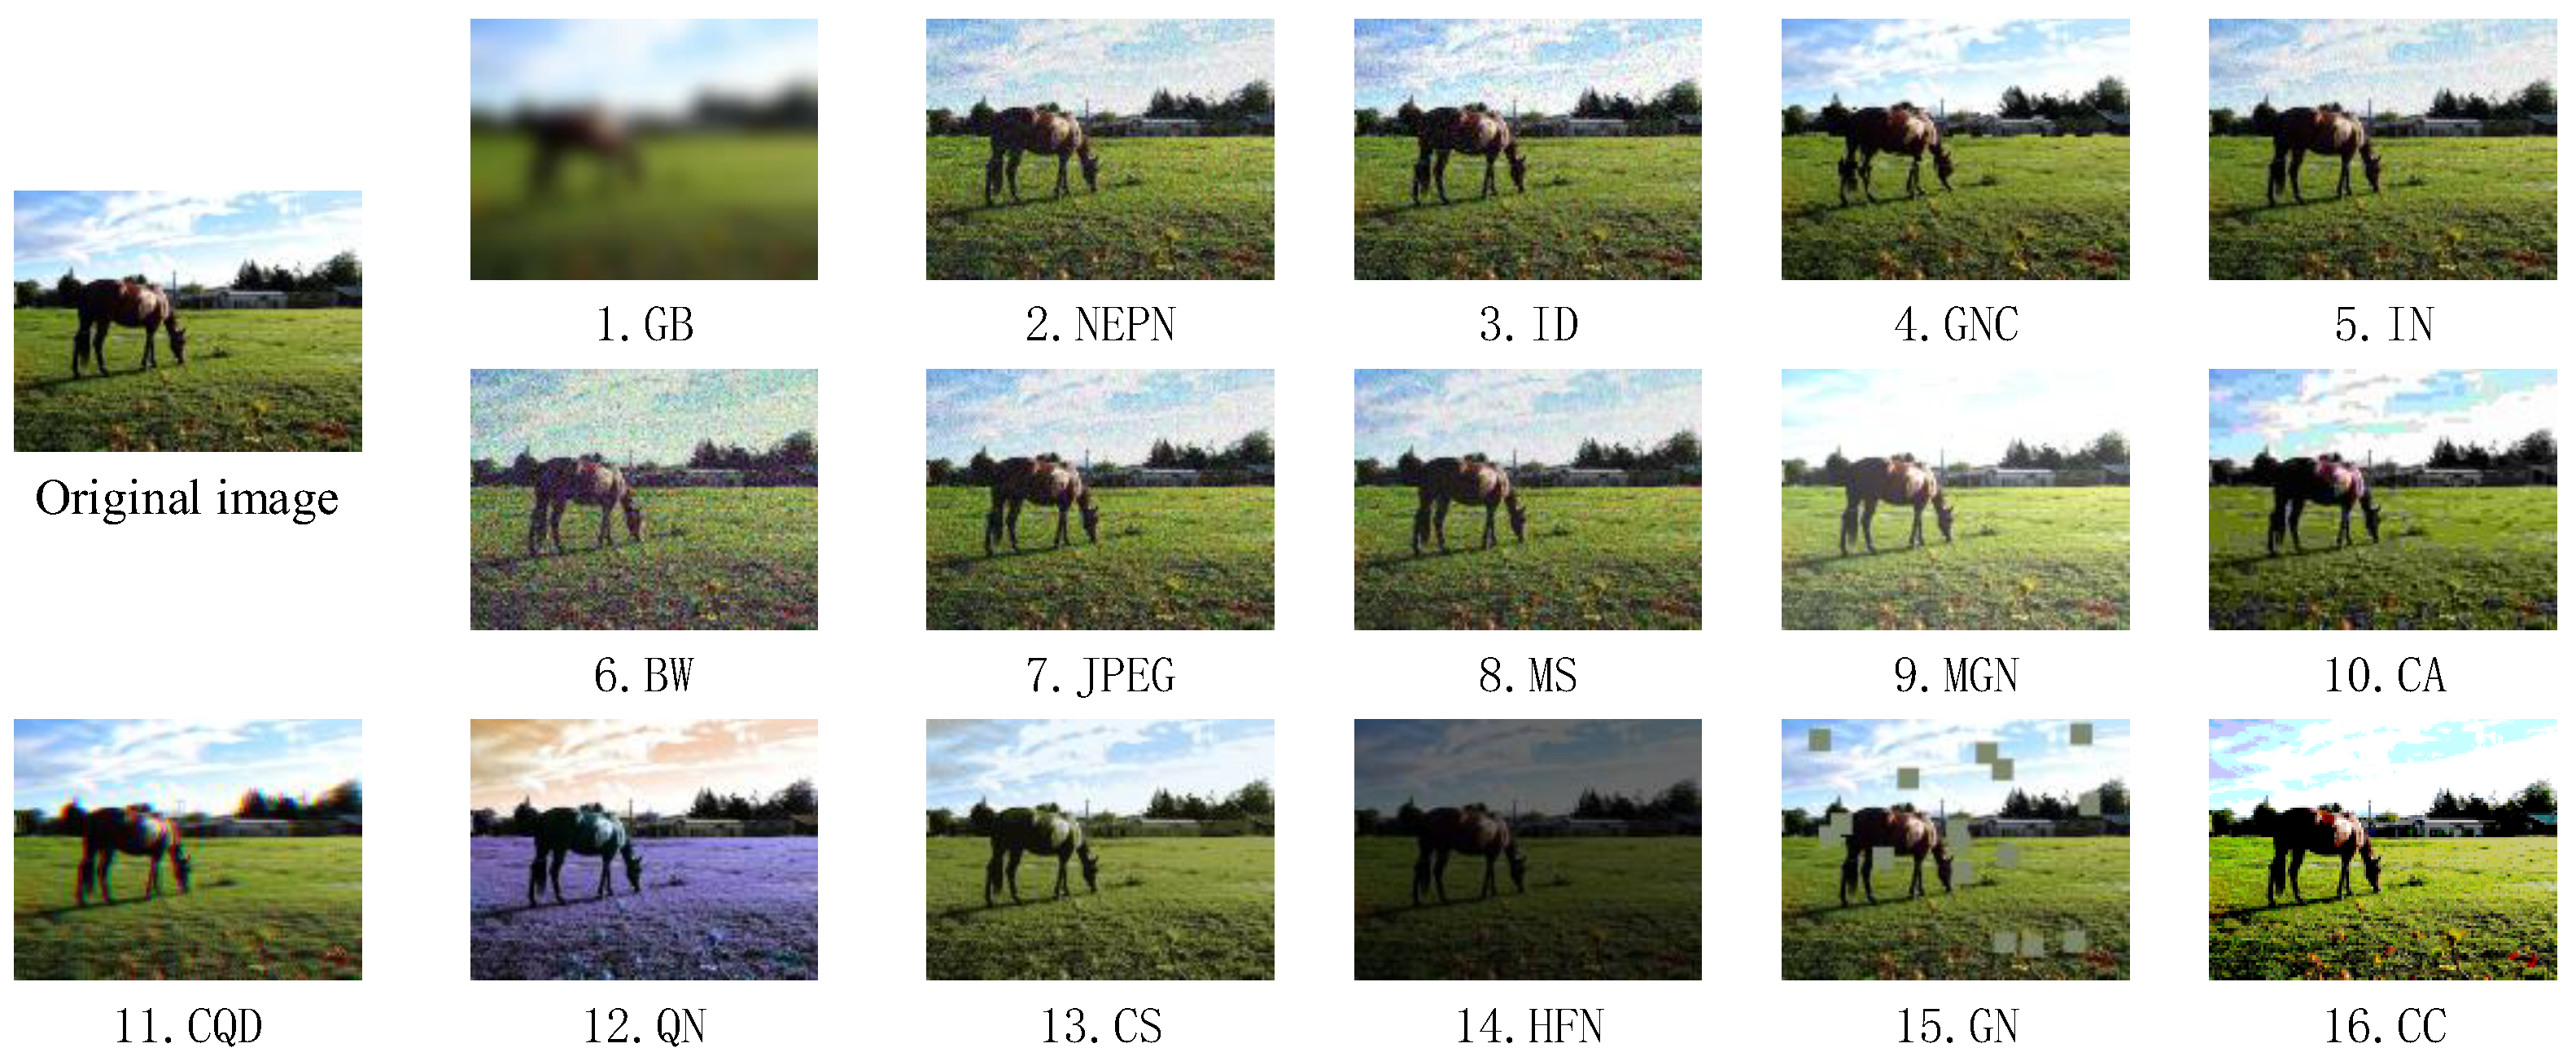
Using the distortion image generation method proposed in [34], we applied random image enhancement methods to images from the Waterloo-4744 [39] dataset and the COCO-330K [40] dataset. Eventually, we generated approximately 1 million images for training the distortion perception module. To train the associated mapping module and evaluate the model’s performance under various conditions, we selected four synthetic distortion datasets, LIVE [8], CSIQ [9], KADID-10K [43], and TID-2013 [7], and three real-world distortion datasets, KonIQ-10K [10], CLIVE [11], and SPAQ [12], in our experiments. The KonIQ-10K dataset comprises 10 k images selected from the publicly available YFCC100M database. CLIVE contains 1162 real distorted images captured using various mobile devices, while SPAQ consists of 11 k images captured using 66 different mobile devices. The summarized information about the image quality evaluation datasets used in our experiments is presented in Table 1.
Evaluation criteria: We choose the Pearson correlation coefficient (PLCC) and the Spearman rank correlation coefficient (SRCC) to monitor the model’s evaluation performance. A higher PLCC indicates that the model’s scores better fit the image’s Mean Opinion Score (MOS) annotations. Similarly, a larger SRCC signifies that the model more accurately ranks the quality of images within the dataset.

4.2. Experiment Details

Our experiments are based on the Pytorch [44] deep learning framework on a Geforce RTX 3080 LapTop GPU-16GB. The detailed configuration for each step is as follows:
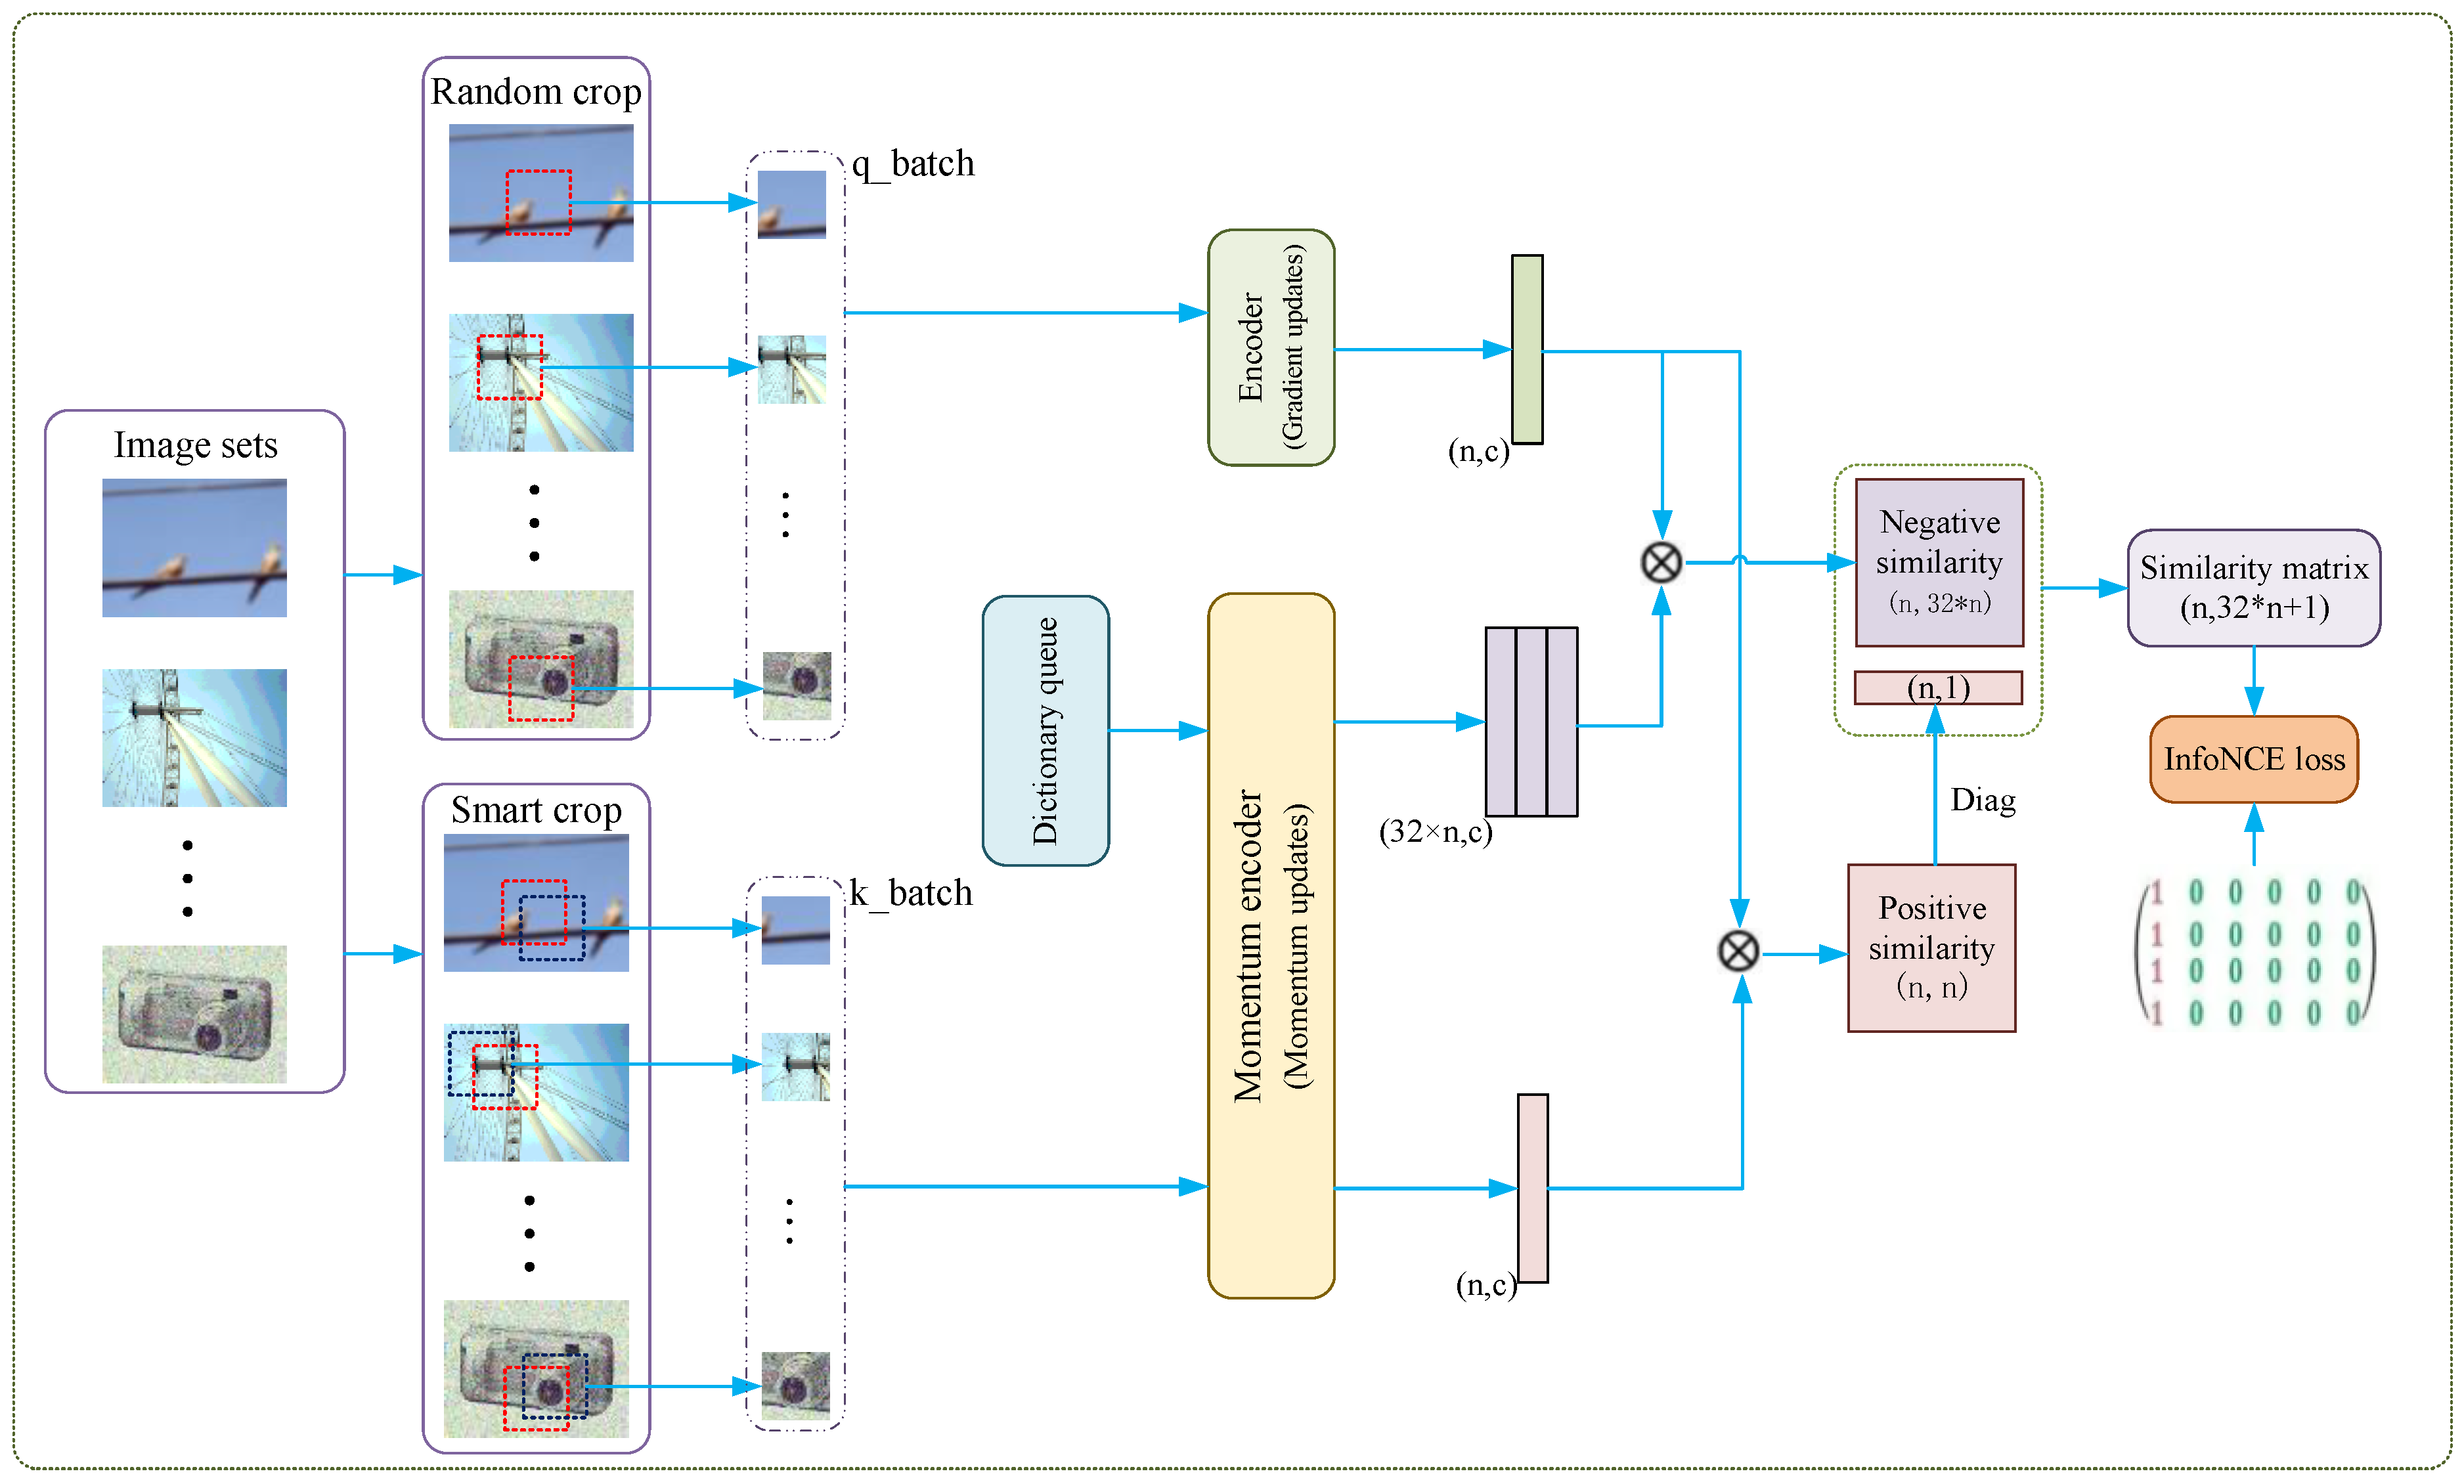
Training for the distortion perception module: This training process inherits most of the settings from MoCo-V2 while modifying the pretext task and the decay process to achieve quality perception. Specifically, we used ResNet-50 [22] as the encoder and trained it on the generated dataset. Using the Adam [45] optimizer, an initial learning rate of 3 × 10⁻² is employed. Following the approach in [46], we performed a two-epoch warm-up for the learning rate and applied cosine annealing. The momentum for updating is set to 0.99, and the batch size is 64. The hyperparameter τ in InfoNCE is empirically set to 0.2. Due to time constraints, we trained ResNet-50 for approximately 10 days, corresponding to 100 epochs, to obtain the distortion perception module.
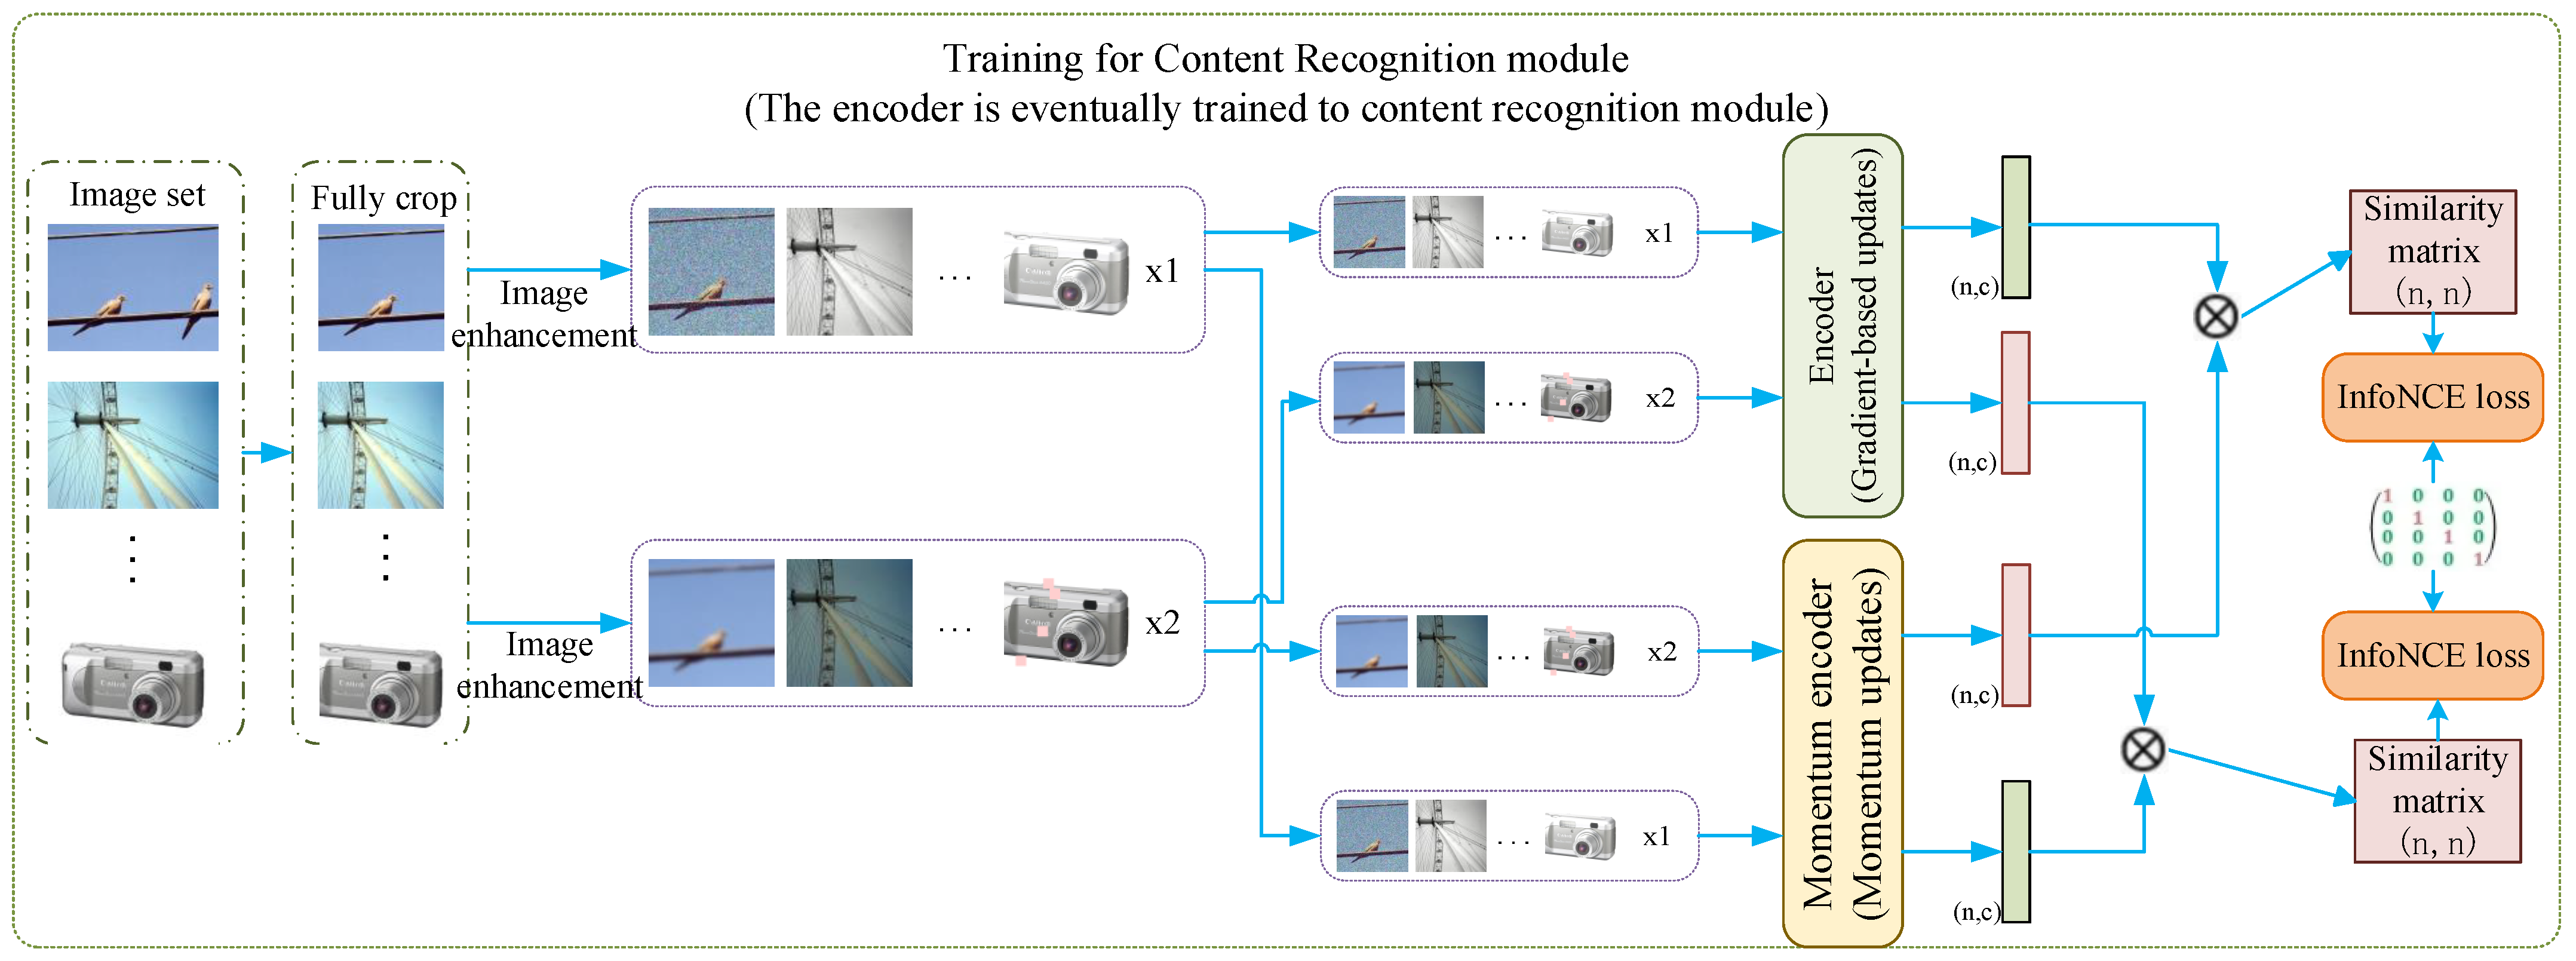
Training for the content recognition module: In the process of training ResNet-50 for content recognition using the MOCO-V3 framework on the ImageNet dataset, most of the configurations remained consistent with the distortion perception training. However, due to GPU memory limitations, the batch size was set to 32. We trained ResNet-50 for approximately 12 days, corresponding to 75 epochs, to obtain the content recognition module.
Training for the correlation mapping module: We trained the correlation mapping module, composed of three layers of linear regression (2024→512→64→1), on various image quality assessment datasets using the Adam optimizer with an initial learning rate of 5 × 10⁻³ and weight decay of 3 × 10⁻⁴. The batch size during training was set to 128. And the image quality assessment datasets were randomly split into an 80% support set and a 20% test set. We conducted the training for 100 epochs on each dataset and selected the version as the correlation mapping module that achieved the highest sum of SRCC and PLCC on the test set.

4.3. Comparative Experiments

4.3.1. Models Selected for Comparative Experiments

To evaluate the specific performance of the McmIQA model in image quality assessment tasks, we conducted experiments comparing it with 16 state-of-the-art (SOTA) models. These models can be roughly categorized into five groups: (1) Traditional Handcrafted Features: BRISQUE [4], NIQE [15]. (2) Codebook-based Features: CORNIA [19], HOSA [20]. (3) CNN-Based Models with Supervised Pre-training: PQR [24], DBCNN [23], BIECON [25], PaQ-2-PiQ [5], HyperIQA [26]. (4) Attention Mechanism-Based Models: TIQA [47], TRES [48], MUSIQ [49]. (5) Contrastive Learning Pre-trained Models: CONTRIQUE [6], Re-IQA [35], QPT-ResNet50 [34]. Additionally, to validate the effectiveness of the proposed contrastive learning approach, we also included the Resnet-50 [22] model pre-trained on ImageNet for comparison.

4.3.2. Performance Comparison Experiments

In Table 2 and Table 3, we present the validation results of various models, including the proposed McmIQA method, on both synthetic distortion datasets and natural distortion datasets. The performance of the proposed model surpasses that of four quality assessment algorithms based on traditional feature extraction followed by SVR (support vector regressor): BRISQUE [4], NIQE [15], CORNIA [19], and HOSA [20]. Compared to supervised pre-trained CNN schemes, such as PQR [24], DBCNN [23], BIECON [25], PaQ-2-PiQ [5], and HyperIQA [26], McmIQA also achieved superior predictive performance, benefiting from the feature extraction capabilities obtained during the pre-training phase on large-scale datasets. Additionally, when compared to models that perform feature extraction based on attention mechanisms, such as TIQA [47], TRES [48], and MUSIQ [49], our model similarly exhibits superior performance due to the large-scale contrastive learning pre-training and collaborative mechanism. Finally, in comparison with recently proposed contrastive learning models, such as CONTRIQUE [6], Re-IQA [35], and QPT-ResNet50 [34], the McmIQA model trained on 16GB-3080 still achieves highly competitive results. This indicates that the novel contrastive learning framework proposed in this paper and the rank training process for the correlation mapping module further enhanced the predictive performance of the resulting model. 
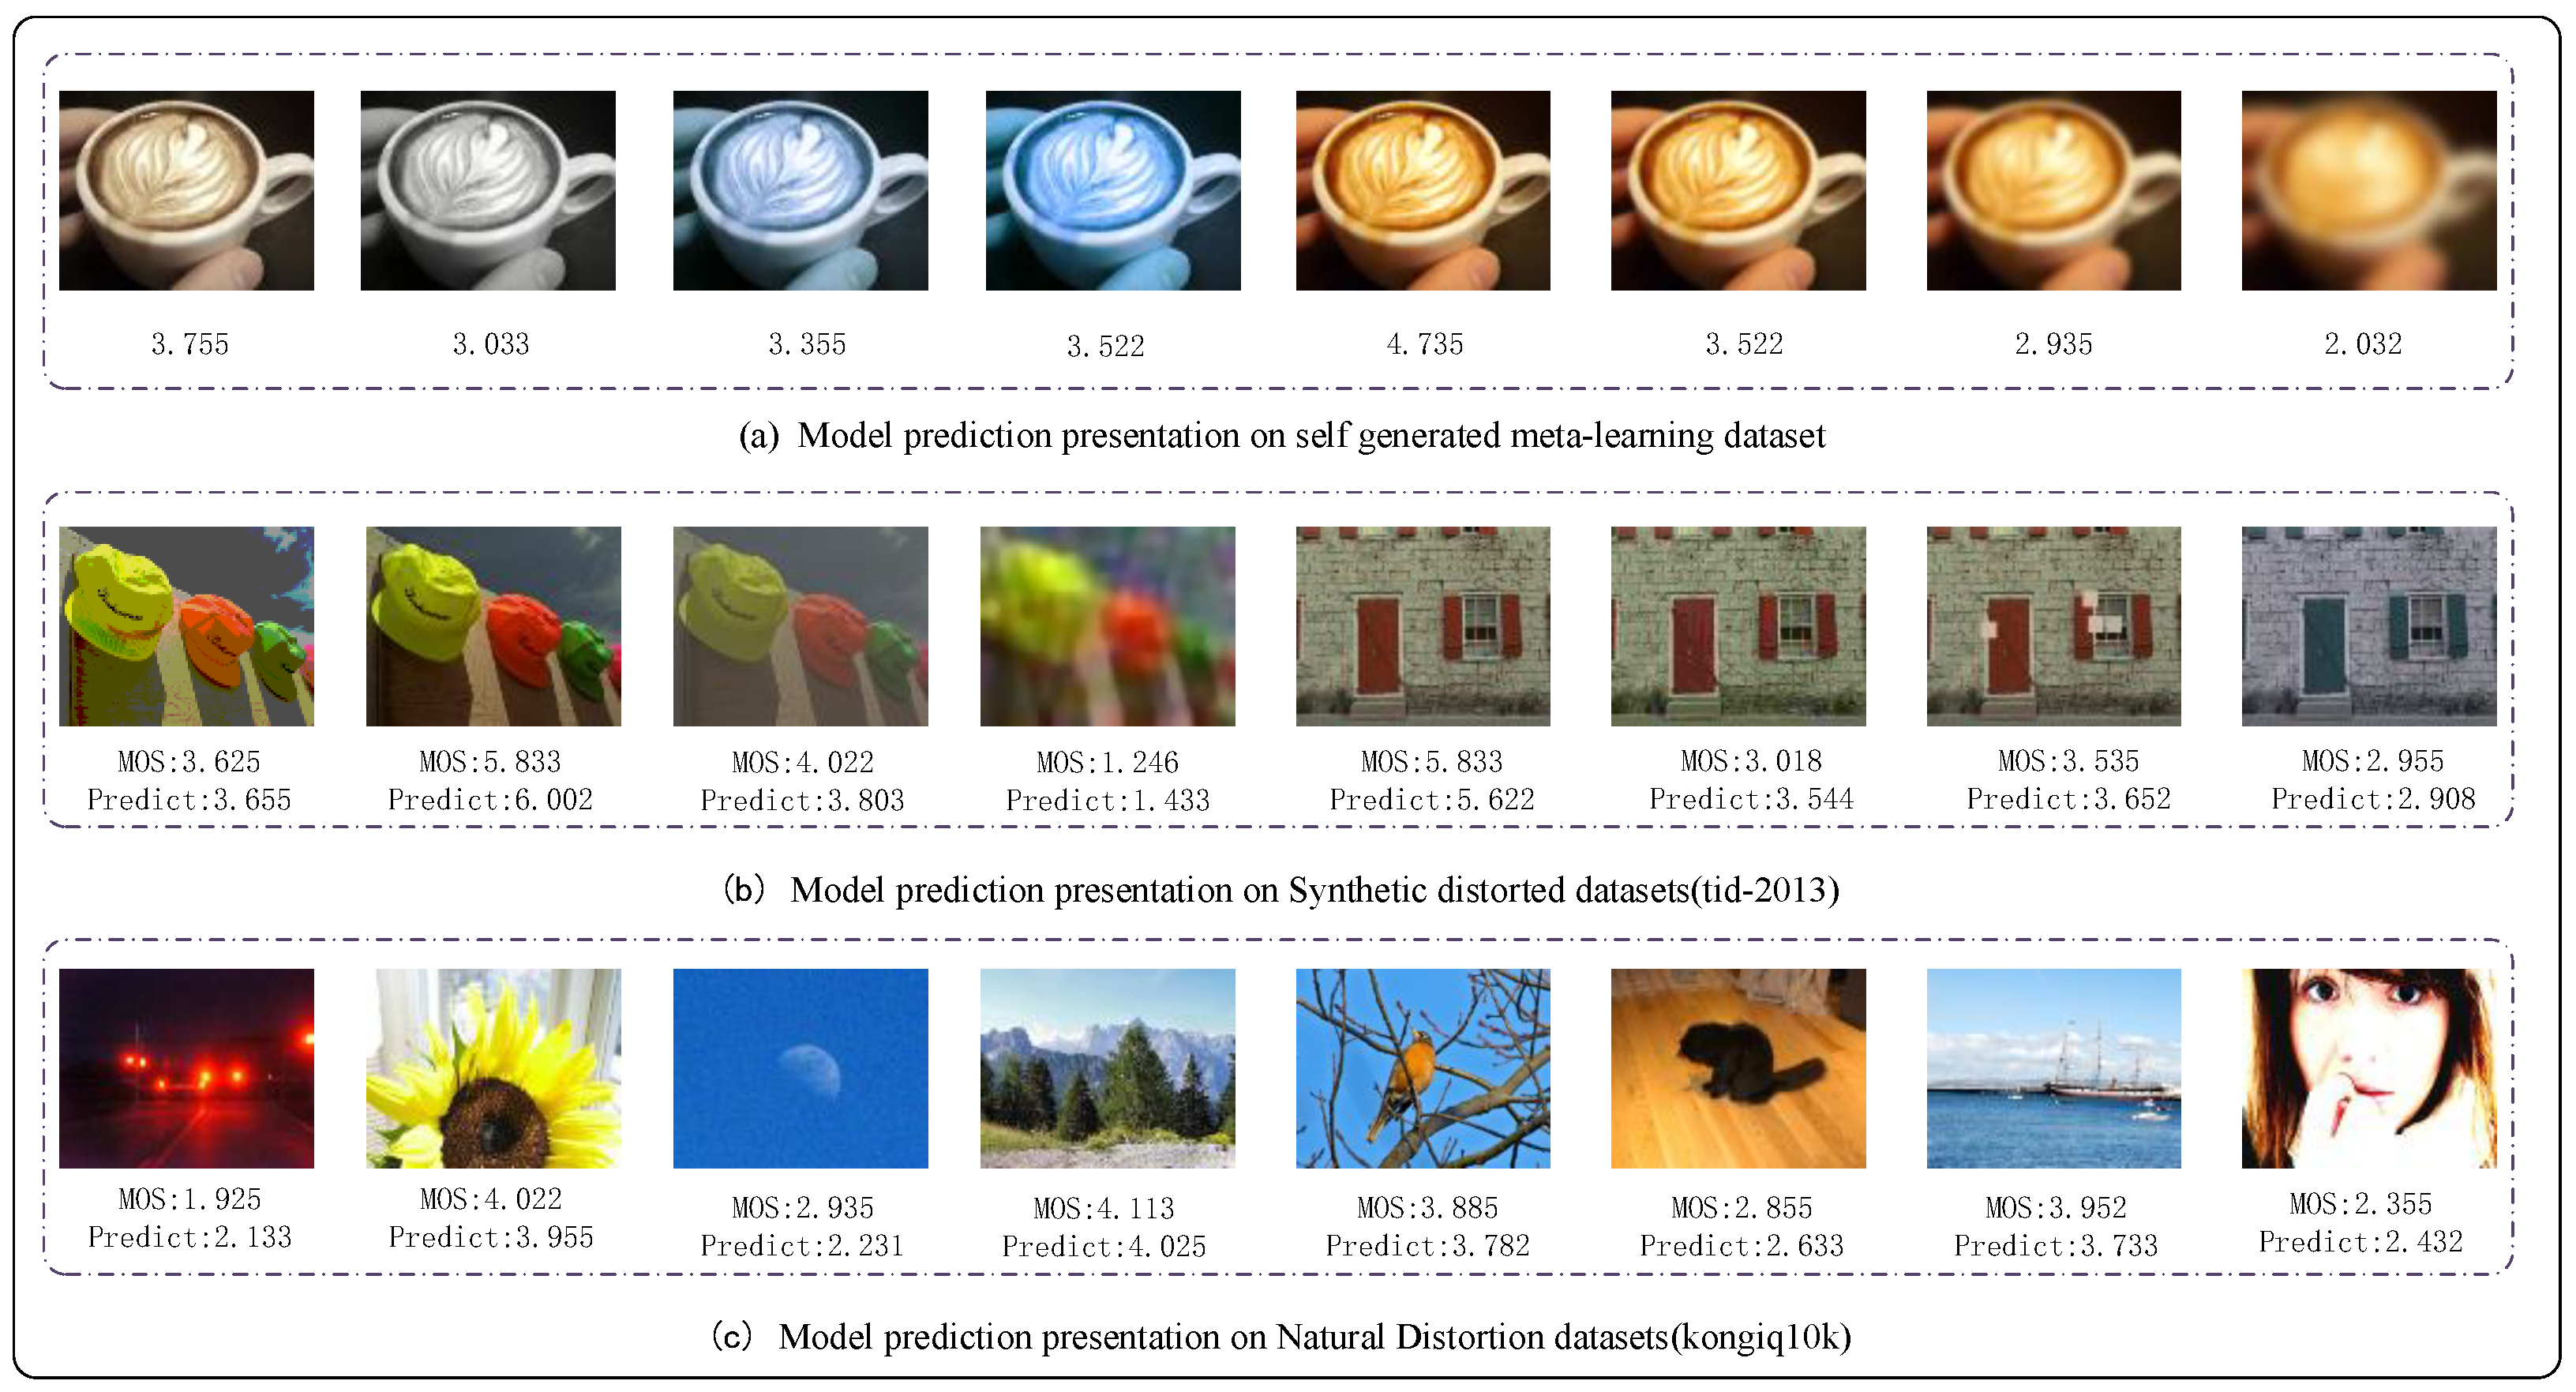
Figure 5 illustrates the model’s predictive results on various datasets.

4.3.3. SRCC Evaluations on Cross Datasets

To validate the generalization performance of the proposed image quality assessment algorithm, we conducted cross-dataset evaluation experiments on two synthetic distortion datasets and two real distortion datasets, including the proposed model and three other quality assessment models. As shown in Table 4, McmIQA exhibits a superior performance on the real distortion datasets and achieves highly competitive results on the synthetic distortion datasets. During the experiments, we kept the parameters of the distortion perception module and content recognition module frozen while optimizing the correlation mapping module independently.

4.3.4. Efficiency Comparison

In this section, to validate the practical application efficiency of the multi-module collaborative model, we selected three existing image quality assessment models, MetaIQA, MANIQA, and TRES, and compared their inference speeds with our model. All models evaluated the quality of test images on an RTX-3080 Laptop GPU. In Table 5, we recorded the processing time for 10,000 images (including cropping, scaling, and inference). As shown in Table 5, the MetaIQA model, which utilizes ResNet-50 as its backbone network, has fewer parameters and completes the relevant image processing first. Our model’s processing speed is comparable to that of the TRES model, and its image processing efficiency is significantly higher than that of MANIQA.

4.4. Ablation Study

In this section, we present relevant ablation experiment results by comparing the performance of various model versions on three datasets: TID-2013, Koniq-10k, and SPAQ. This comparison aims to validate the effectiveness of the individual modules included in the proposed model.

4.4.1. Ablation Experiments on the Distortion Perception Module Training

Table 6 presents the ablation experiment results on the distortion perception training contrastive learning frameworks. Compared with three scenarios: (1) Removing the distortion perception module. (2) Supervised training of the ResNet-50 on ImageNet to obtain the distortion perception module. (3) Training ResNet-50 as a distortion perception model with full-reference method scores. Remarkably, training the distortion perception module using the proposed approach leads to the best SRCC performance across all datasets.

4.4.2. Ablation Experiments for the Content Recognition Module Training

Table 7 presents the results of ablation experiments on the training framework for the content recognition module. We compared our framework with three other versions: (1) Removing the content recognition module. (2) Supervised training of the content recognition module. (3) Training the content recognition module using a colorization strategy proposed in [50].

4.4.3. Ablation Experiments for the Correlation Mapping Module Training

Table 8 presents the results of ablation experiments on the training framework for the correlation mapping module. In our experiments, we started with the original method, which neither employed ranking loss nor froze the parameters of other modules. Instead, we directly fine-tuned the entire model. Subsequently, we incrementally introduced various mechanisms for comparison.
As shown in Table 8, the introduction of both the ranking and the weight freezing mechanism during the training of the correlation mapping module positively impacted the model’s final performance to varying degrees. The ranking mechanism allows the model to assess the relative quality between different images, enhancing its overall perception of image quality. And the weight freezing enables us to significantly increase the batch size, reducing the impact of certain noise during model training.

5. Conclusions

In this paper, we further divide the image quality assessment task into three components, distortion perception, content recognition, and associated mapping, to address the challenge of real image quality assessment. By enhancing and utilizing the MOCO-V2 and MOCO-V3 contrastive learning frameworks, improving the image patch generation process for different modules, and introducing training mechanisms such as ranking and parameter freezing, our McmIQA method achieves state-of-the-art predictive performance across seven image quality evaluation datasets, including both synthetic and real distortions. This indicates that in this study, the distortion perception module and content recognition module trained with two contrastive learning schemes effectively extracted image distortion features and image content features related to image quality. With the extracted two image quality-related features, the correlation mapping module accurately predicted the perceptual quality of the corresponding image. Moreover, our approach is not restricted to a specific model; in scenarios where memory constraints are not an issue, it can easily switch to other networks for feature extraction, including those based on transformations, potentially yielding even more advanced performance.

Author Contributions

Conceptualization, Q.S. and H.M.; methodology, H.M.; software, H.M.; validation, H.M.; formal analysis, Q.S.; resources, Q.S.; data curation, H.M.; writing—original draft preparation, H.M.; writing—review and editing, Q.S.; supervision, Q.S. All authors have read and agreed to the published version of the manuscript.

Funding

This research received no external funding.

Data Availability Statement

All figures used in this paper are original. Data are contained within the article.

Conflicts of Interest

The authors declare no conflicts of interest.

References

  1. Wang, Z.; Bovik, A.C.; Sheikh, H.R.; Simoncelli, E.P. Image quality assessment: From error visibility to structural similarity. IEEE Trans. Image Process. 2004, 13, 600–612. [Google Scholar] [CrossRef] [PubMed]
  2. Zhang, L.; Zhang, L.; Mou, X.; Zhang, D. FSIM: A feature similarity index for image quality assessment. IEEE Trans. Image Process. 2011, 20, 2378–2386. [Google Scholar] [CrossRef] [PubMed]
  3. Zhang, R.; Isola, P.; Efros, A.; Shechtman, E.; Wang, O. The unreasonable effectiveness of deep features as a perceptual metric. In Proceedings of the IEEE Conference on Computer Vision and Pattern Recognition, Salt Lake City, UT, USA, 18–23 June 2018; pp. 586–595. [Google Scholar]
  4. Mittal, A.; Moorthy, A.K.; Bovik, A.C. No-reference image quality assessment in the spatial domain. IEEE Trans. Image Process. 2012, 21, 4695–4708. [Google Scholar] [CrossRef] [PubMed]
  5. Ying, Z.; Niu, H.; Gupta, P.; Mahajan, D.; Ghadiyaram, D.; Bovik, A. From patches to pictures (PaQ-2-PiQ): Mapping the perceptual space of picture quality. In Proceedings of the IEEE/CVF Conference on Computer Vision and Pattern Recognition, Seattle, WA, USA, 13–19 June 2020; pp. 3575–3585. [Google Scholar]
  6. Madhusudana, P.C.; Birkbeck, N.; Wang, Y.; Adsumilli, B.; Bovik, A.C. Image quality assessment using contrastive learning. IEEE Trans. Image Process. 2022, 31, 4149–4161. [Google Scholar] [CrossRef] [PubMed]
  7. Ponomarenko, N.; Jin, L.; Ieremeiev, O.; Lukin, V.; Egiazarian, K.; Astola, J.; Vozel, B.; Chehdi, K.; Carli, M.; Battisti, F.; et al. Image database TID2013: Peculiarities, results and perspectives. Signal Process. Image Commun. 2015, 30, 57–77. [Google Scholar] [CrossRef]
  8. Sheikh, H.R.; Sabir, M.F.; Bovik, A.C. A statistical evaluation of recent full reference image quality assessment algorithms. IEEE Trans. Image Process. 2006, 15, 3440–3451. [Google Scholar] [CrossRef] [PubMed]
  9. Larson, E.C.; Chandler, D.M. Most apparent distortion: Full-reference image quality assessment and the role of strategy. J. Electron. Imaging 2010, 19, 011006. [Google Scholar]
  10. Hosu, V.; Lin, H.; Sziranyi, T.; Saupe, D. KonIQ-10k: An ecologically valid database for deep learning of blind image quality assessment. IEEE Trans. Image Process. 2020, 29, 4041–4056. [Google Scholar] [CrossRef] [PubMed]
  11. Ghadiyaram, D.; Bovik, A.C. Massive online crowdsourced study of subjective and objective picture quality. IEEE Trans. Image Process. 2015, 25, 372–387. [Google Scholar] [CrossRef] [PubMed]
  12. Fang, Y.; Zhu, H.; Zeng, Y.; Ma, K.; Wang, Z. Perceptual quality assessment of smartphone photography. In Proceedings of the IEEE/CVF Conference on Computer Vision and Pattern Recognition, Seattle, WA, USA, 13–19 June 2020; pp. 3677–3686. [Google Scholar]
  13. Simoncelli, E.P.; Olshausen, B.A. Natural image statistics and neural representation. Annu. Rev. Neurosci. 2001, 24, 1193–1216. [Google Scholar] [CrossRef] [PubMed]
  14. Ye, P.; Doermann, D. No-reference image quality assessment using visual codebooks. IEEE Trans. Image Process. 2012, 21, 3129–3138. [Google Scholar] [PubMed]
  15. Mittal, A.; Soundararajan, R.; Bovik, A.C. Making a “completely blind” image quality analyzer. IEEE Signal Process. Lett. 2012, 20, 209–212. [Google Scholar] [CrossRef]
  16. Moorthy, A.K.; Bovik, A.C. Blind image quality assessment: From natural scene statistics to perceptual quality. IEEE Trans. Image Process. 2011, 20, 3350–3364. [Google Scholar] [CrossRef] [PubMed]
  17. Saad, M.A.; Bovik, A.C.; Charrier, C. Blind image quality assessment: A natural scene statistics approach in the DCT domain. IEEE Trans. Image Process. 2012, 21, 3339–3352. [Google Scholar] [CrossRef] [PubMed]
  18. Zhang, L.; Zhang, L.; Bovik, A.C. A feature-enriched completely blind image quality evaluator. IEEE Trans. Image Process. 2015, 24, 2579–2591. [Google Scholar] [CrossRef] [PubMed]
  19. Ye, P.; Kumar, J.; Kang, L.; Doermann, D. Unsupervised feature learning framework for no-reference image quality assessment. In Proceedings of the 2012 IEEE Conference on Computer Vision and Pattern Recognition, Providence, RI, USA, 16–21 June 2012; pp. 1098–1105. [Google Scholar]
  20. Xu, J.; Ye, P.; Li, Q.; Du, H.; Liu, Y.; Doermann, D. Blind image quality assessment based on high order statistics aggregation. IEEE Trans. Image Process. 2016, 25, 4444–4457. [Google Scholar] [CrossRef] [PubMed]
  21. Tu, Z.; Yu, X.; Wang, Y.; Birkbeck, N.; Adsumilli, B.; Bovik, A.C. RAPIQUE: Rapid and accurate video quality prediction of user generated content. IEEE Open J. Signal Process. 2021, 2, 425–440. [Google Scholar] [CrossRef]
  22. He, K.; Zhang, X.; Ren, S.; Sun, J. Deep residual learning for image recognition. In Proceedings of the IEEE Conference on Computer Vision and Pattern Recognition, Las Vegas, NV, USA, 27–30 June 2016; pp. 770–778. [Google Scholar]
  23. Zeng, H.; Zhang, L.; Bovik, A.C. A probabilistic quality representation approach to deep blind image quality prediction. arXiv 2017, arXiv:1708.08190. [Google Scholar]
  24. Kim, J.; Lee, S. Fully deep blind image quality predictor. IEEE J. Sel. Top. Signal Process. 2016, 11, 206–220. [Google Scholar] [CrossRef]
  25. Zhang, W.; Ma, K.; Yan, J.; Deng, D.; Wang, Z. Blind image quality assessment using a deep bilinear convolutional neural network. IEEE Trans. Circuits Syst. Video Technol. 2018, 30, 36–47. [Google Scholar] [CrossRef]
  26. Su, S.; Yan, Q.; Zhu, Y.; Zhang, C.; Ge, X.; Sun, J.; Zhang, Y. Blindly assess image quality in the wild guided by a self-adaptive hyper network. In Proceedings of the IEEE/CVF Conference on Computer Vision and Pattern Recognition, Seattle, WA, USA, 13–19 June 2020; pp. 3667–3676. [Google Scholar]
  27. Albelwi, S. Survey on self-supervised learning: Auxiliary pretext tasks and contrastive learning methods in imaging. Entropy 2022, 24, 551. [Google Scholar] [CrossRef] [PubMed]
  28. Vincent, P.; Larochelle, H.; Lajoie, I.; Bengio, Y.; Manzagol, P.A.; Bottou, L. Stacked denoising autoencoders: Learning useful representations in a deep network with a local denoising criterion. J. Mach. Learn. Res. 2010, 11, 3371–3408. [Google Scholar]
  29. Zhang, R.; Isola, P.; Efros, A.A. Colorful image colorization. In Proceedings of the Computer Vision–ECCV 2016, 14th European Conference, Amsterdam, The Netherlands, 11–14 October 2016; Proceedings, Part III 14. Springer International Publishing: Zurich, Switwerland, 2016; pp. 649–666. [Google Scholar]
  30. Doersch, C.; Gupta, A.; Efros, A.A. Unsupervised visual representation learning by context prediction. In Proceedings of the IEEE International Conference on Computer Vision, Santiago, Chile, 7–13 December 2015; pp. 1422–1430. [Google Scholar]
  31. He, K.; Chen, X.; Xie, S.; Li, Y.; Dollár, P.; Girshick, R. Masked autoencoders are scalable vision learners. In Proceedings of the IEEE/CVF Conference on Computer Vision and Pattern Recognition, New Orleans, LA, USA, 18–24 June 2022; pp. 16000–16009. [Google Scholar]
  32. Xie, Z.; Zhang, Z.; Cao, Y.; Lin, Y.; Bao, J.; Yao, Z.; Dai, Q.; Hu, H. Simmim: A simple framework for masked image modeling. In Proceedings of the IEEE/CVF Conference on Computer Vision and Pattern Recognition, New Orleans, LA, USA, 18–24 June 2022; pp. 9653–9663. [Google Scholar]
  33. Jaiswal, A.; Babu, A.R.; Zadeh, M.Z.; Banerjee, D.; Makedon, F. A survey on contrastive self-supervised learning. Technologies 2020, 9, 2. [Google Scholar] [CrossRef]
  34. Zhao, K.; Yuan, K.; Sun, M.; Li, M.; Wen, X. Quality-aware pre-trained models for blind image quality assessment. In Proceedings of the IEEE/CVF Conference on Computer Vision and Pattern Recognition, Vancouver, BC, Canada, 17–24 June 2023; pp. 22302–22313. [Google Scholar]
  35. Saha, A.; Mishra, S.; Bovik, A.C. Re-iqa: Unsupervised learning for image quality assessment in the wild. In Proceedings of the IEEE/CVF Conference on Computer Vision and Pattern Recognition, Vancouver, BC, Canada, 17–24 June 2023; pp. 5846–5855. [Google Scholar]
  36. He, K.; Fan, H.; Wu, Y.; Xie, S.; Girshick, R. Momentum contrast for unsupervised visual representation learning. In Proceedings of the IEEE/CVF Conference on Computer Vision and Pattern Recognition, Seattle, WA, USA, 13–19 June 2020; pp. 9729–9738. [Google Scholar]
  37. Chen, X.; Fan, H.; Girshick, R.; He, K. Improved baselines with momentum contrastive learning. arXiv 2020, arXiv:2003.04297. [Google Scholar]
  38. Xinlei, C.; Saining, X.; Kaiming, H. An empirical study of training self-supervised visual transformers. arXiv 2021, arXiv:2104.02057. [Google Scholar]
  39. Ma, K.; Duanmu, Z.; Wu, Q.; Wang, Z.; Yong, H.; Li, H.; Zhang, L. Waterloo exploration database: New challenges for image quality assessment models. IEEE Trans. Image Process. 2016, 26, 1004–1016. [Google Scholar] [CrossRef] [PubMed]
  40. Lin, T.Y.; Maire, M.; Belongie, S.; Hays, J.; Perona, P.; Ramanan, D.; Dollár, P.; Zitnick, C.L. Microsoft coco: Common objects in context. In Proceedings of the Computer Vision–ECCV 2014: 13th European Conference, Zurich, Switzerland, 6–12 September 2014; Proceedings, Part V 13. Springer International Publishing: Zurich, Switwerland, 2014; pp. 740–755. [Google Scholar]
  41. Oord, A.; Li, Y.; Vinyals, O. Representation learning with contrastive predictive coding. arXiv 2018, arXiv:1807.03748. [Google Scholar]
  42. Deng, J.; Dong, W.; Socher, R.; Li, L.J.; Li, K.; Fei-Fei, L. Imagenet: A large-scale hierarchical image database. In Proceedings of the 2009 IEEE Conference on Computer Vision and Pattern Recognition, Miami, FL, USA, 20–25 June 2009; pp. 248–255. [Google Scholar]
  43. Lin, H.; Hosu, V.; Saupe, D. DeepFL-IQA: Weak supervision for deep IQA feature learning. arXiv 2020, arXiv:2001.08113. [Google Scholar]
  44. Paszke, A.; Gross, S.; Massa, F.; Lerer, A.; Bradbury, J.; Chanan, G.; Killeen, T.; Lin, Z.; Gimelshein, N.; Antiga, L.; et al. Pytorch: An imperative style, high-performance deep learning library. Adv. Neural Inf. Process. Syst. 2019, 32, 12. [Google Scholar]
  45. Kingma, D.P.; Ba, J. Adam: A method for stochastic optimization. arXiv 2014, arXiv:1412.6980. [Google Scholar]
  46. Loshchilov, I.; Hutter, F. Sgdr: Stochastic gradient descent with warm restarts. arXiv 2016, arXiv:1608.03983. [Google Scholar]
  47. You, J.; Korhonen, J. Transformer for image quality assessment. In Proceedings of the 2021 IEEE International Conference on Image Processing (ICIP), Anchorage, AK, USA, 19–22 September 2021; pp. 1389–1393. [Google Scholar]
  48. Golestaneh, S.A.; Dadsetan, S.; Kitani, K.M. No-reference image quality assessment via transformers, relative ranking, and self-consistency. In Proceedings of the IEEE/CVF Winter Conference on Applications of Computer Vision, Waikoloa, HI, USA, 3–8 January 2022; pp. 1220–1230. [Google Scholar]
  49. Ke, J.; Wang, Q.; Wang, Y.; Milanfar, P.; Yang, F. Musiq: Multi-scale image quality transformer. In Proceedings of the IEEE/CVF International Conference on Computer Vision, Montreal, BC, Canada, 11–17 October 2021; pp. 5148–5157. [Google Scholar]
  50. Larsson, G.; Maire, M.; Shakhnarovich, G. Learning representations for automatic colorization. In Proceedings of the Computer Vision–ECCV 2016: 14th European Conference, Amsterdam, The Netherlands, 11–14 October 2016; Proceedings, Part IV 14. Springer International Publishing: Zurich, Switwerland, 2016; pp. 577–593. [Google Scholar]
Figure 1. Overall framework of McmIQA.
Mathematics 12 01185 g001
Figure 2. Distortion perception module training framework based on contrastive learning. n indicates the batch size. The training framework mainly consists of two parts: data processing and contrastive learning training based on MOCO-V2. Using random cropping and intelligent overlay cropping, query samples and their corresponding positive samples are generated separately. Subsequently, they are organized into q_batches and corresponding k_batches as inputs for the contrastive learning framework. The encoder handles the q_batch, while the momentum encoder processes the corresponding k_batch and the dictionary queue. Subsequently, the obtained feature matrix is used to compute a similarity matrix through dot product, which is then combined with the target similarity matrix to calculate the InfoNCE [41] loss.
Mathematics 12 01185 g002
Figure 3. Content recognition module training framework based on contrastive learning. n indicates the batch size. The training framework mainly consists of two parts: data processing and contrastive learning training based on MOCO-V3. For a raw image from the dataset, we will use full cropping to obtain a square image, and then apply two different image enhancement methods to create a pair of positive samples containing the same content. Subsequently, the two images containing the same content, generated from the raw image, will be organized into separate batches. The encoder and momentum encoder will perform relevant feature extraction to obtain feature matrices. Later, the similarity matrix will be computed between these feature matrices using dot product and combined with the target similarity matrix to calculate the InfoNCE [41] loss.
Mathematics 12 01185 g003
Figure 4. The summary of image enhancement methods. (1—Gaussian blur, 2—Non-eccentricity pattern noise, 3—Image denoising, 4—Gaussian noise in color components, 5—Impulse noise, 6—Local block-wise distortions of different intensity, 7—JPEG compression, 8—Mean shift, 9—Multiplicative Gaussian noise, 10—Color aberrations, 11—Color quantization dither, 12—Quantization noise, 13—Color saturation, 14—High frequency noise, 15—Gaussian noise, 16—Contrast change).
Mathematics 12 01185 g004
Figure 5. Predictive impressions on each dataset.
Mathematics 12 01185 g005
Table 1. The summary of IQA datasets used in our experiments.
DatasetsDistortion TypesSizeScore Range
LIVE [8]4808[0, 100]
CSIQ [9]6866[0, 1]
TID2013 [7]243000[0, 9]
KADID10K [43]2510,125[1, 5]
LIVEC [11]---1162[0, 100]
SPAQ [12]---11,125[0, 100]
Koniq10K [10]---10,073[0, 100]
Table 2. Performance comparison with different nr models on IQA databases containing synthetic distortions; some data are sourced from [6]. In each column, the first and the second-best models are boldfaced.
MethodsLIVE [8]CSIQ [9]TID-2013 [7]KADID-10K [43]
SRCCPLCCSRCCPLCCSRCCPLCCSRCCPLCC
BRISQUE [4]0.9390.9350.7460.8290.6040.6940.5280.567
NIQE [15]0.9070.9010.6270.7120.3150.3930.3470.428
CORNIA [19]0.9470.9500.6780.7760.6780.7680.5160.558
HOSA [20]0.9460.9500.7410.8230.7350.8150.6180.653
DBCNN [23]0.9680.9710.9460.9590.8160.8650.8510.856
PQR [24]0.9650.9710.8720.9010.7400.798--
BIECON [25]0.9610.9620.8150.8230.7170.762--
PaQ-2-PiQ [5]0.9590.9580.8990.9020.8620.8560.8400.849
HyperIQA [26]0.9620.9660.9230.9420.8400.8580.8520.845
TIQA [47]0.9490.9650.8250.8380.8460.8580.8500.855
TRES [48]0.9690.9680.9220.9420.8630.8830.9150.858
CONTRIQUE [6]0.9600.9610.9420.9550.8430.8570.9340.937
Re-IQA [35]0.9700.9710.9470.9600.8040.8610.8720.885
Resnet-50(ImageNet pre-trained)0.9250.9310.8400.8480.6790.7290.7010.677
McmIQA (Resnet-50)0.9740.9680.9550.9590.8830.8820.8660.871
Table 3. Performance comparison with different nr models on IQA databases containing authentic distortions; some data are sourced from [6]. In each column, the first and the second-best models are boldfaced.
MethodKonIQ-10K [10]CLIVE [11]SPAQ [12]
SRCCPLCCSRCCPLCCSRCCPLCC
BRISQUE [4]0.6650.6810.6080.6290.8090.817
NIQE [15]0.5310.5380.4550.4830.7000.709
CORNIA [19]0..7800.7950.6290.6710.7090.725
HOSA [20]0.8050.8130.6400.6780.8460.852
DBCNN [23]0.8750.8840.8510.8690.9110.915
PQR [24]0.8800.8840.8570.882--
PaQ-2-PiQ [5]0.8700.8800.8400.850--
HyperIQA [26]0.9060.9170.8590.8820.9160.919
MUSIQ [49]0.9160.928--0.9170.921
TRES [48]0.9150.9280.8460.877
CONTRIQUE [6]0.8940.9060.8450.8570.9140.919
Re-IQA [35]0.9140.9230.8400.8540.9180.925
QPT-Resnet50 [34]0.9270.9410.8930.9140.9250.928
Resnet-50(ImageNet pre-trained)0.8880.9040.7810.8090.9040.909
McmIQA (Resnet-50)0.9290.9270.8790.8800.9220.920
Table 4. Cross databases SRCC comparison. In each row, the top performing model is highlighted. The best models are boldfaced.
TrainingTestingDBCNNTRESCONTRIQUEMcmIQA
Koniq10kCLIVE0.7550.8120.7310.833
CLIVEKoniq10k0.7540.7660.6760.785
LIVECSIQ0.7580.8200.8230.822
CSIQLIVE0.8770.9260.9250.919
Table 5. Time consumption comparison for processing 10,000 images.
ModelMetaIQAMANIQATRESMcmIQA
Time used56.35113.6081.2283.25
Table 6. Ablation experiment results on the distortion perception module training. The best models are boldfaced.
Training MethodTID2013Koniq-10kSPAQ
With no model0.7720.8830.890
ImageNet-supervised0.7920.9090.903
MDSI signed0.8470.8900.892
Ours0.8830.9290.922
Table 7. Ablation experiment results for the content recognition module training. The best models are boldfaced.
Training MethodTID2013Koniq-10kSPAQ
With no model0.8840.8610.900
ImageNet-supervised0.8520.9050.903
Colorization training0.8760.9270.923
Ours0.8830.9290.922
Table 8. Ablation experiment results for the correlation mapping module training. The best models are boldfaced.
Training MethodTID2013Koniq-10kSPAQ
Origin0.8410.9070.906
Rank0.8630.9130.911
Freeze content aware model0.8870.9150.910
Freeze distortion model0.8600.9180.918
Freeze both0.8700.9240.923
Rank + freeze both0.8830.9290.922
Disclaimer/Publisher’s Note: The statements, opinions and data contained in all publications are solely those of the individual author(s) and contributor(s) and not of MDPI and/or the editor(s). MDPI and/or the editor(s) disclaim responsibility for any injury to people or property resulting from any ideas, methods, instructions or products referred to in the content.

