Abstract
Cancer, with its complexity and numerous origins, continues to provide a huge challenge in medical research. Anticancer peptides are a potential treatment option, but identifying and synthesizing them on a large scale requires accurate prediction algorithms. This study presents an intuitive classification strategy, named ACP-LSE, based on representation learning, specifically, a deep latent-space encoding scheme. ACP-LSE can demonstrate notable advancements in classification outcomes, particularly in scenarios with limited sample sizes and abundant features. ACP-LSE differs from typical black-box approaches by focusing on representation learning. Utilizing an auto-encoder-inspired network, it embeds high-dimensional features, such as the composition of g-spaced amino acid pairs, into a compressed latent space. In contrast to conventional auto-encoders, ACP-LSE ensures that the learned feature set is both small and effective for classification, giving a transparent alternative. The suggested approach is tested on benchmark datasets and demonstrates higher performance compared to the current methods. The results indicate improved Matthew’s correlation coefficient and balanced accuracy, offering insights into crucial aspects for developing new ACPs. The implementation of the proposed ACP-LSE approach is accessible online, providing a valuable and reproducible resource for researchers in the field.
Keywords:
anticancer peptide; composition of the g-spaced amino acid pairs; latent-space encoding; representation learning; auto-encoder MSC:
92-08; 68T07; 68T10
1. Introduction
Cancer continues to be a major health problem worldwide, taking millions of lives [1,2,3,4,5,6,7,8]. Cancer, rather than being a single ailment, is a broad spectrum of complicated disorders characterized by uncontrolled cell growth and the propensity to rapidly infect other parts of the body. The inherent complexity and heterogeneity pose serious challenges in developing effective anticancer therapies [9].
Conventional methods like radiotherapy and chemotherapy are usually beneficial but have high costs and considerable adverse effects on normal cells. Furthermore, the development of resistance by cancer cells to the existing chemotherapeutic drugs presents a challenging obstacle [10,11]. As a result, there is an ongoing need for the discovery of novel anticancer drugs. Traditional therapies destroy both cancer and normal cells, leading to exorbitant medical costs [12,13,14,15]. Peptide-based treatment is a promising option because of its high specificity, enhanced tumor penetration, and minimal toxicity under normal physiological conditions [16]. The discovery of anticancer peptides has transformed this landscape by enabling the selective targeting of cancer cells while protecting normal cells [17,18,19].
Anticancer peptides (ACPs) have therapeutic potential for numerous malignancies, as they selectively target cancer cells without affecting normal physiological processes [20,21]. ACPs, ranging in length from 5 to 50 amino acids, have cationic amphipathic structures that interact with the anionic lipid membrane of cancer cells, enabling selective targeting [22,23]. They exhibit broad-spectrum cytotoxicity against many cancer cells while sparing normal cells due to their electrostatic interaction with the plasma membrane of cancer cells [24]. Over the last decade, several peptide-based therapies have been evaluated in pre-clinical and clinical trials, highlighting the need to discover novel ACPs for cancer treatment [25]. ACPs, primarily derived from antimicrobial peptides (AMPs), represent a new direction in anticancer drug development [24,26]. The safety and efficacy of ACPs make them viable alternatives to traditional broad-spectrum drugs. The extensive research into ACP therapies in pre-clinical and clinical trials against numerous tumor types indicates a paradigm shift, though identifying clinically viable ACPs remains a challenge due to the time-consuming and expensive nature of the experimental methods. Computational methods are, therefore, essential for efficient ACP identification.
Bioinformatics encompass a myriad of computational methodologies [27,28,29,30,31,32], with a particular emphasis on machine-learning-based approaches for identifying anticancer peptides (ACPs). The pioneering tool, Anti-CP, used a support vector machine (SVM) with sequence-based features and binary profiles [33]. Chou’s pseudo-amino acid composition (PseAAC) and local alignment kernel were used in [34] for ACP prediction, while g-gap dipeptide components were optimized in [35]. The amino acid composition, average chemical shifts, and reduced amino acid composition were selected in [36]. Several other methodologies have been proposed, including feature representation learning models [37], 400-dimensional features with g-gap dipeptide features [38], and a generalized chaos game representation (CGR) method [39]. Notably, the investigation into deep learning architectures indicated the advantages of recurrent neural networks [40]. ACP prediction research has grown in popularity over the last decade, with more experimentally validated ACPs generated from protein sequences [41]. The surge in the accessible proteins from high-throughput sequencing efforts indicates a rapid growth in potential ACPs. Given the challenges inherent in experimental procedures, computational approaches, particularly machine learning, have gained popularity. However, the short length of ACPs makes it difficult to capture the specificity information.
In recent years, there has been a proliferation of machine-learning-based methods, notably, efficient feature representation algorithms. While there are several sequence-based feature descriptors available, combining several types of features to train classifiers raises concerns about the curse of dimensionality and information redundancy. Efficient approaches are required to optimize the information contained in feature descriptors. Furthermore, the integration of physicochemical information has been proposed, as ACPs considerably vary from non-ACPs in terms of these characteristics [22].
Inspired by the success of deep representation learning [42,43,44] in natural language processing, several sequence-based deep representation learning algorithms for proteins and peptides have emerged [45,46,47,48,49,50,51,52]. Unsupervised or semi-supervised learning methods, such as ProFET [53], UniRep [46], ProGen [54], and UDSMProt [55], use large datasets and show promise for protein-related predictions. For instance, in [56], authors reviewed different deep learning architectures including various embedding techniques used for the feature extraction and model designing for protein sequences prediction tasks. In [57], authors have shown that a deep transfer learning using ProteinBERT representations produces promising results where the labeled data are limited. Transfer learning enables these models to be employed as pre-training models for novel tasks such as ACP prediction. While prior techniques have shown promising results, taking into account the dimensional advantages of the model is critical. Methods like ACP-DA [58] use data augmentation to improve ACP prediction performance, addressing the curse of dimensionality by concatenating binary profile features and physicochemical properties. Similarly, iACP-DRLF [59] employs deep representation learning and LGBM feature selection, outperforming previous methods like ACPred-Fuse [60] and AntiCP 2.0 [61].
In a nutshell, advancements in ACP prediction methods have been substantial, but there is still a need to enhance prediction accuracy and consider the dimensionality advantages of the models. Computational methods, particularly those leveraging machine learning and deep representation learning, hold promise for rapid ACP identification.
While current machine learning approaches provide some advantages in predicting ACPs, there is still room for improvement. Deep learning models are highly effective, but their black-box nature can obscure the rationale behind classification decisions. In contrast, a very simple model may lack the precision required for accurate classification. To this end, [62] proposed ACP-KSRC, which uses a sparse-representation classification (SRC) technique [63,64], incorporating polynomial kernel-based principal component analysis (PCA) embedding to reduce feature space dimensions. Furthermore, it employs the synthetic minority oversampling technique (SMOTE) with K-Means [65] to balance sample space dimensions, facilitating the construction of the kernel SRC model.
The ACP-KSRC [62], leveraging a carefully curated feature set and robust signal processing tools, improves decision-making transparency, resulting in better explainability in classification. In line with the growing emphasis on explainable machine learning, a novel deep-latent-space encoding scheme, termed DeepLSE, is introduced. This approach demonstrates significant advancements in classification outcomes, particularly in scenarios with a small sample size and an abundance of features [66,67,68,69].
The DeepLSE method uses representation learning [42,43] and an auto-encoder (AE) to project high-dimensional data into a compressed latent space. In contrast to classic AEs, where compressed representations may not guarantee discriminating features, the proposed DeepLSE learns a meaningful feature set that is both compact and effective for classification.
Section 2 provides comprehensive details of the proposed approach, encompassing datasets, feature encoding techniques, and classification methods. Subsequently, Section 3 presents the results of the experimental analysis and offers a detailed discussion. The paper concludes in Section 4, summarizing the key findings and outlining potential directions for future research.
2. Proposed DeepLSE-Based ACP Classification Approach (ACP-LSE)
This section introduces ACP-LSE, a deep-representation-learning-based classification technique for anticancer peptide sequences. The proposed technique is evaluated with several protocols and popular datasets. Figure 1 depicts the entire classification process using a flow chart. The following subsections provide extensive explanations of each step.
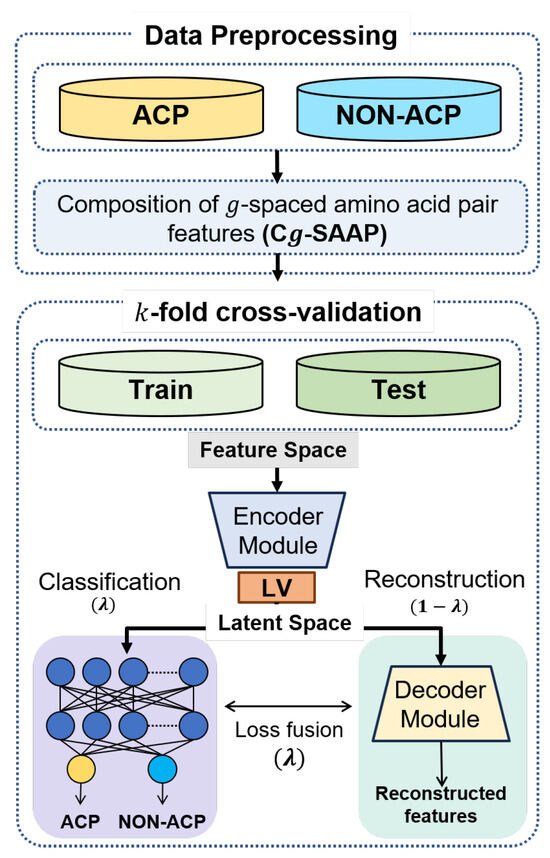
Figure 1.
Overview of the proposed ACPs classification strategy.
2.1. Dataset
Several datasets, including those in [34,35,37], are publicly available for research purposes. This study employs two benchmark datasets to develop and evaluate the proposed ACP classification strategy. The first dataset, identified as ACP344, was taken from [34] and contained 344 peptide sequences. Of these sequences, 138 are classified as ACPs, with the remaining 206 being non-ACP samples. The second dataset, denoted ACP740, is drawn from the research by Chen et al. [35] and Wei et al. [37]. This collection contains 740 peptide sequences, including 376 ACP and 364 non-ACP samples. Additionally, [70] provides a refined version of the ACP740 dataset. Each dataset is subjected to the design and evaluation of distinct classifiers by the known protocols in the literature. Specifically, ACP344 is subjected to both 5-fold and 10-fold cross-validation protocols, whereas ACP740 is only evaluated using a 5-fold cross-validation protocol.
2.2. Feature Space: Composition of g-Spaced Amino-Acid Pairs
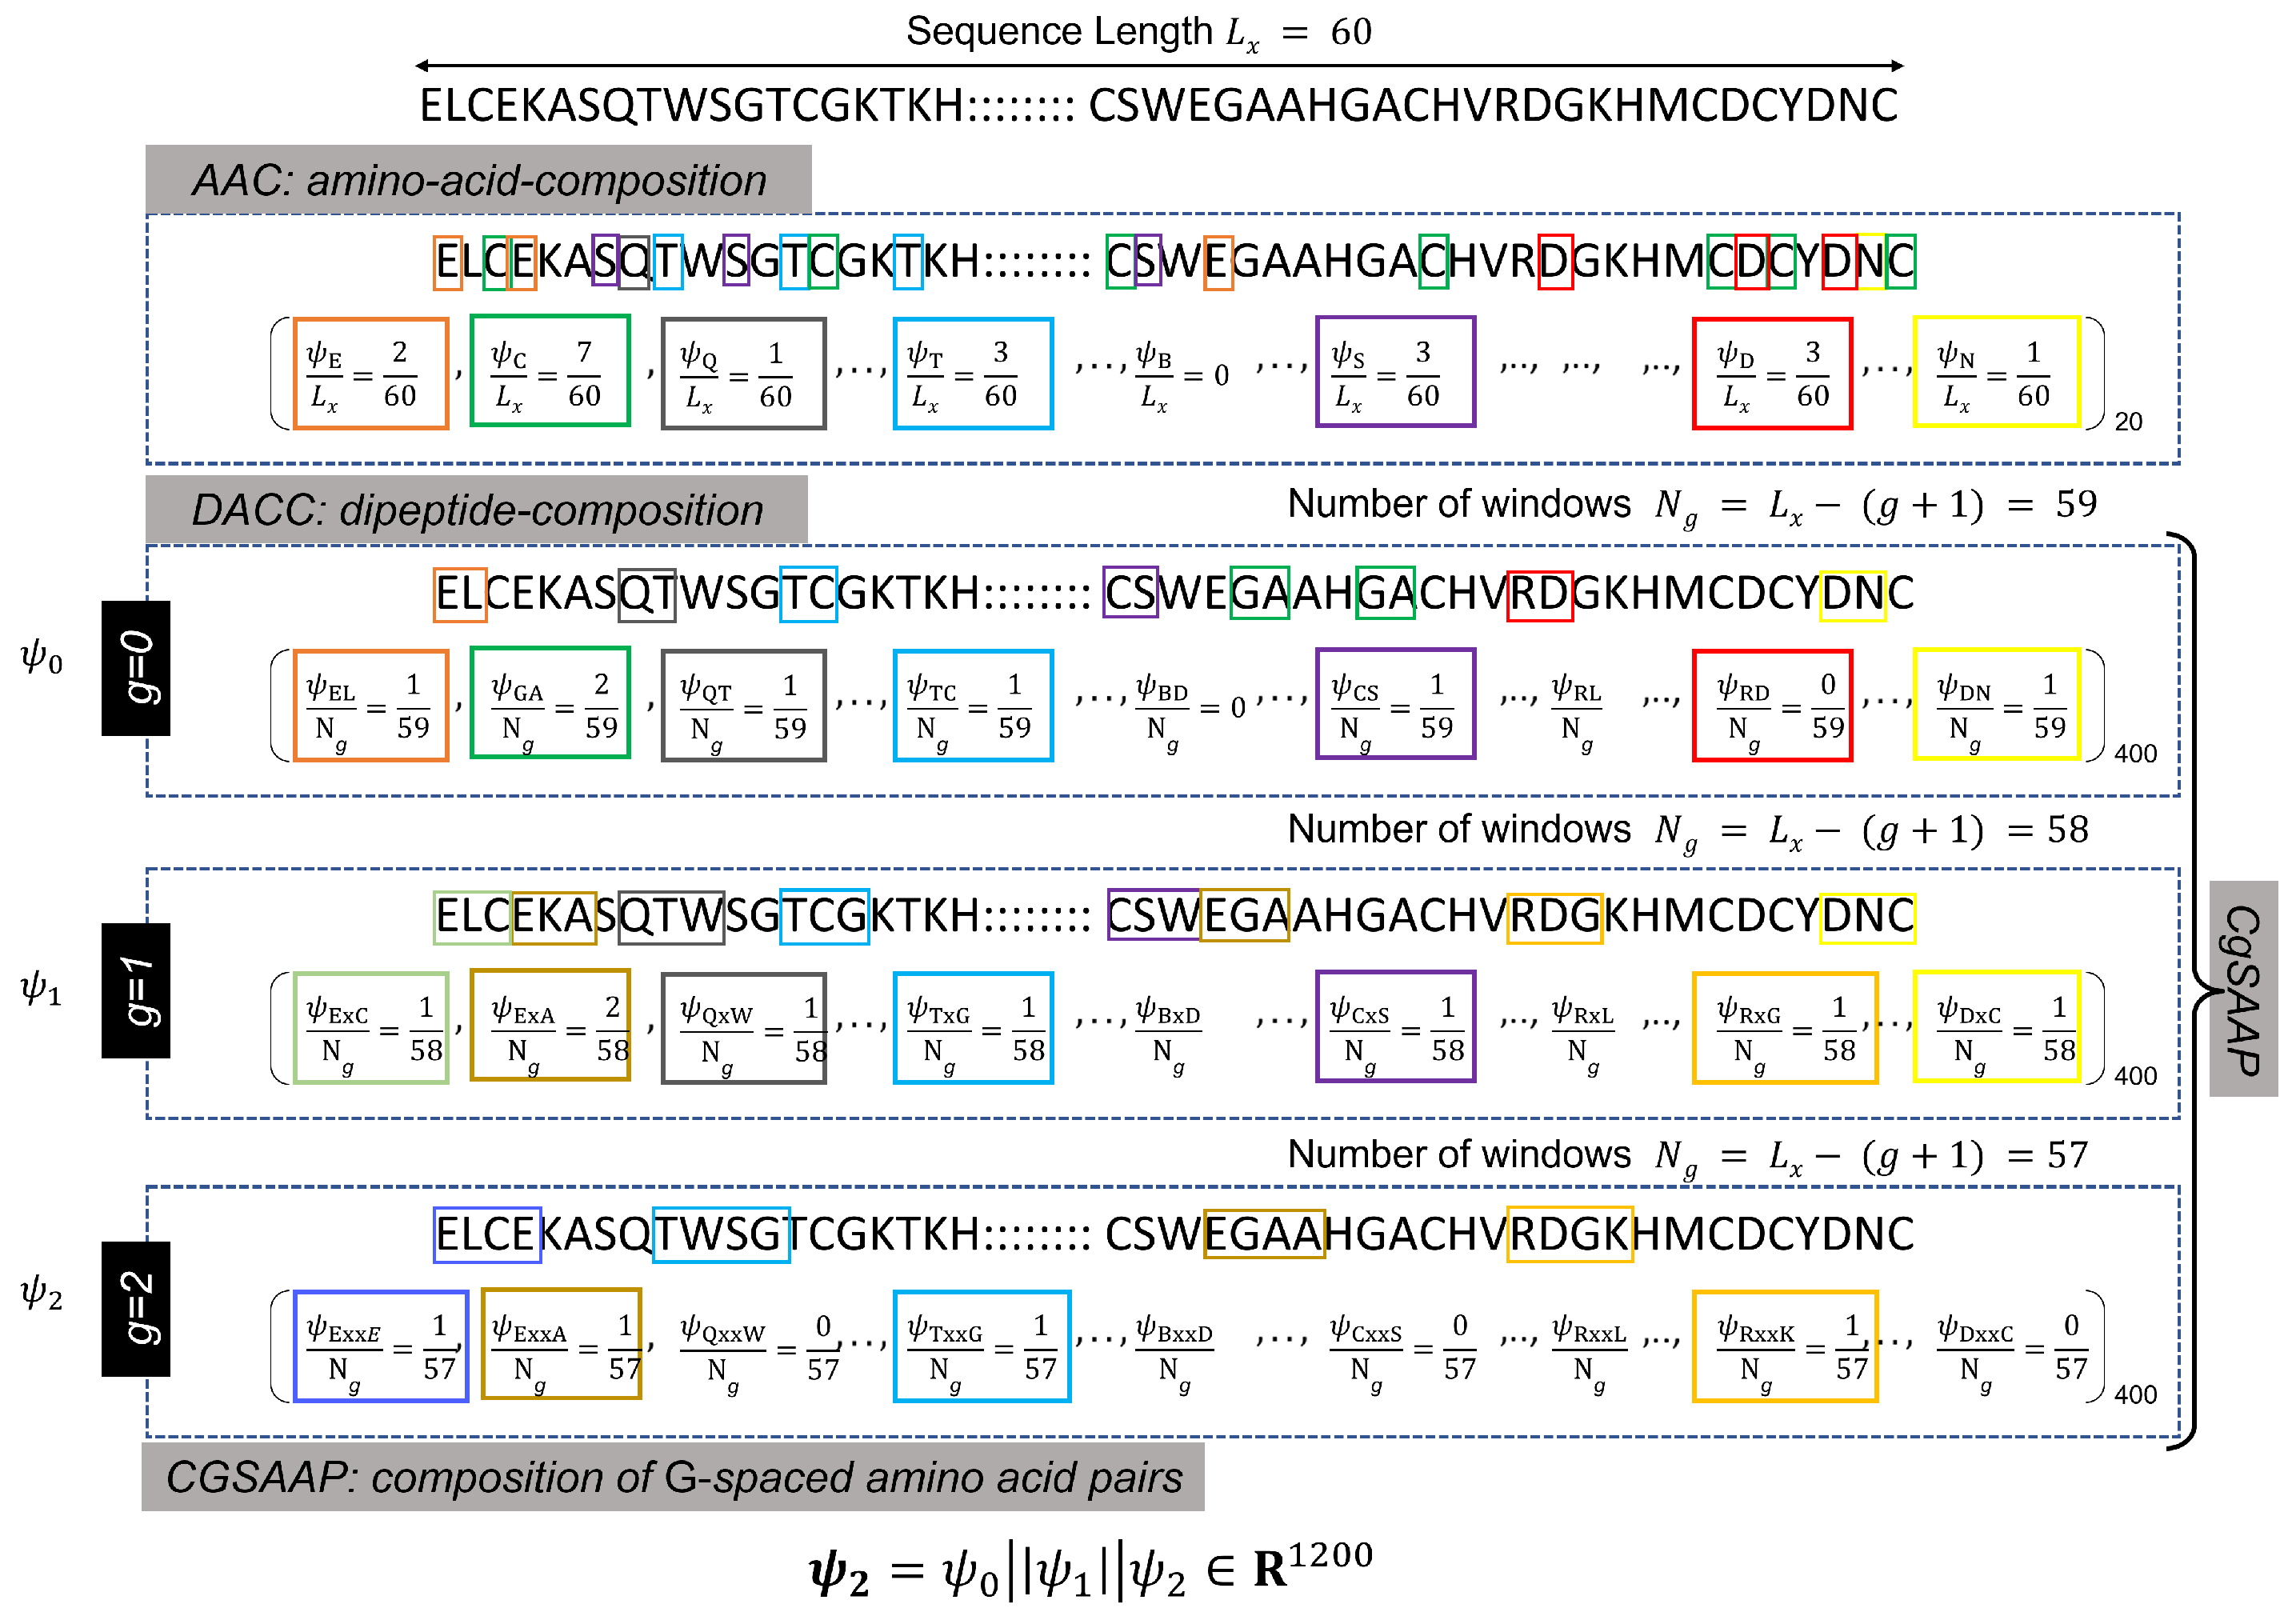
Protein or peptide sequences are typically recorded and stored in the FastA format, where alphabetic symbols represent individual amino acids (see Figure 2 for an illustration). These sequences, varying in length, are processed by varied sequence encoding techniques, such as AAC, di-peptide AAC (DAAC), etc., to extract meaningful numerical features. AAC is the core feature encoding approach, producing a feature vector including the frequency count of essential amino acids. As a result, the entire length of the AAC feature vector is equal to the total number of amino acids, which is denoted as 20. Similarly, DAAC indicates the frequency of peptide pairings, and the total length of the feature vector equals the number of potential combinations of 20 amino acid pairs (i.e., ). As shown in the Figure 2, the DAAC feature vector includes the frequencies of 0-spaced amino acid pairs (i.e., the DAAC of amino acid pairs separated by residues).
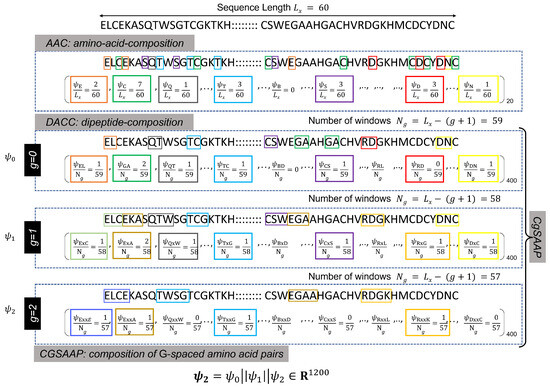
Figure 2.
Illustration of the calculations of different feature extraction techniques. Here different colored blocks represent different k-spaced dipeptides.
Both AAC and DAAC are popular sequence encoding approaches that have successfully designed classifiers for diverse protein and peptide sequences [71]. However, these techniques are limited in their representation since they do not account for the varied patterns of amino acid pairings. To improve pattern capture in DAAC, a modified version is presented in [71], where the DAAC feature vectors of most G-spaced amino acid pairs are concatenated. For instance, with , must be computed for , and the final Cg-SAAP feature vector, , is a concatenated version of , , and . Here, g denotes a gap value used for the calculation of the gth DAAC feature vector (), and G represents the largest possible gap for which the CGSAAP feature vector is calculated. Figure 2 provides an example of the calculation.
2.3. Network Architecture, Loss Function, and Training Configurations (Hyper-Parameters)
The proposed DeepLSE model consists of three modules: (1) encoder , (2) decoder , and (3) classifier . The encoder block projects feature space information to latent space. Here, latent-space encoding refers to the representation learning of compressed data using the number of latent variables.
Let be a feature vector of size F. The decoder and encoded are used to re-project features to the original feature space . In an ideal scenario, the decoded feature should be the same as the original feature vector x, i.e., . However, due to the compression constraint on latent space, some of the less significant information is suppressed. In the proposed DeepLSE, latent-space representation is further constrained by classifier loss, which forces the network to learn compact feature representation that maintains both the most informative and the discriminating information for inter-class separability. In other words, the class-similar samples tend to cluster together, whereas the class-invariant samples are projected apart. Therefore, the redundant information within the representation of data in the latent space is removed, and only the representative features related to the class and reconstruction of the data are kept. This creates a fair balance between the classification and reconstruction tasks, in turn, learning the class-specific as well as sample-specific information inside the latent-space encoding of the raw data. The DeepLSE model is built using a combination of fully connected (FC) layers, batch-normalization and dropout layers to avoid over-fitting. Table 1 summarizes the architecture of the model.

Table 1.
Proposed DeepLSE model architecture.
The DeepLSE network uses binary cross-entropy (BCE) and mean-squared-error (MSE) as loss functions for the classifier and the auto-encoder networks, respectively. Both the loss functions have been fused using a loss mixing parameter as
with
and
where y is the binary indicator (0 or 1) for the actual class label, and p is the predicted probability of observation. x, and are the input and reconstructed feature vectors of size F, respectively.
The DeepLSE network is trained with various configurations of , Gap value G, and latent variable . The experimental results related to the selection of these hyper-parameters are presented in the Section 3.
2.4. Evaluation Protocol
The proposed algorithm has been evaluated on various performance assessment metrics, including the true positive rate (TPR) or sensitivity (), true negative rate (TNR) or specificity (), prediction accuracy (), Matthew’s correlation coefficient (), balanced accuracy (), Youden’s index (), and Score. Here,
where trueP, falseP, trueN, and falseN represent the true positive, false positive, true negative, and false negative, respectively. The measure of precision (Pr) and are given by and .
3. Experimental Results
This section provides a detailed study of the DeepLSE approach, utilizing several numerical experiments. The proposed DeepLSE-based anticancer peptide classification method, ACP-LSE, is validated in terms of methodology, and supporting experiments offer a rationale for hyperparameter selection. The experiments are organized in the following order. Section 3.1 focuses on demonstrating how the proposed DeepLSE more effectively compresses feature dimensions compared to a conventional auto-encoder and the original feature space. In the same section, the impact of different values of G in Cg-SAAP embeddings on model performance is also analyzed. In Section 3.2, the influence of the feature and latent-space dimension is investigated for different values of . In Section 3.3, the effect of on the latent space is also analyzed. Section 3.4 evaluates the robustness of ACP-LSE against random mutations. Section 3.5 examines the performance consistency of ACP-LSE for various training and testing sample split ratios. Finally, Section 3.6 discusses the findings from comparing the performance of ACP-LSE to existing state-of-the-art approaches.
3.1. Latent Space: Latent-Space Encoding of Cg-SAAP
Modern machine learning methods need vast amounts of training data to achieve better generalization and performance. However, a phenomenon known as the curse of dimensionality occurs when the quantity of measurements or samples is limited but the attributes proliferate (). Here, F and S represent the number of features/attributes and samples, , where and are the numbers of negative and positive samples in the dataset, respectively. In the context of this study, the dataset consists of a small number of samples (e.g., 344, 740, etc.), although the attributes may number in the thousands. For example, the description of the Cg-SAAP with has 4000 attributes. The curse of dimensionality not only makes our classification task theoretically ill-posed but it also poses a significant challenge in developing an effective latent-space representation for compressed representation, particularly when . To address this, the proposed ACP-LSE removes the least representative dimensions, reducing the original feature space of to a deep latent-space representation of size , where .
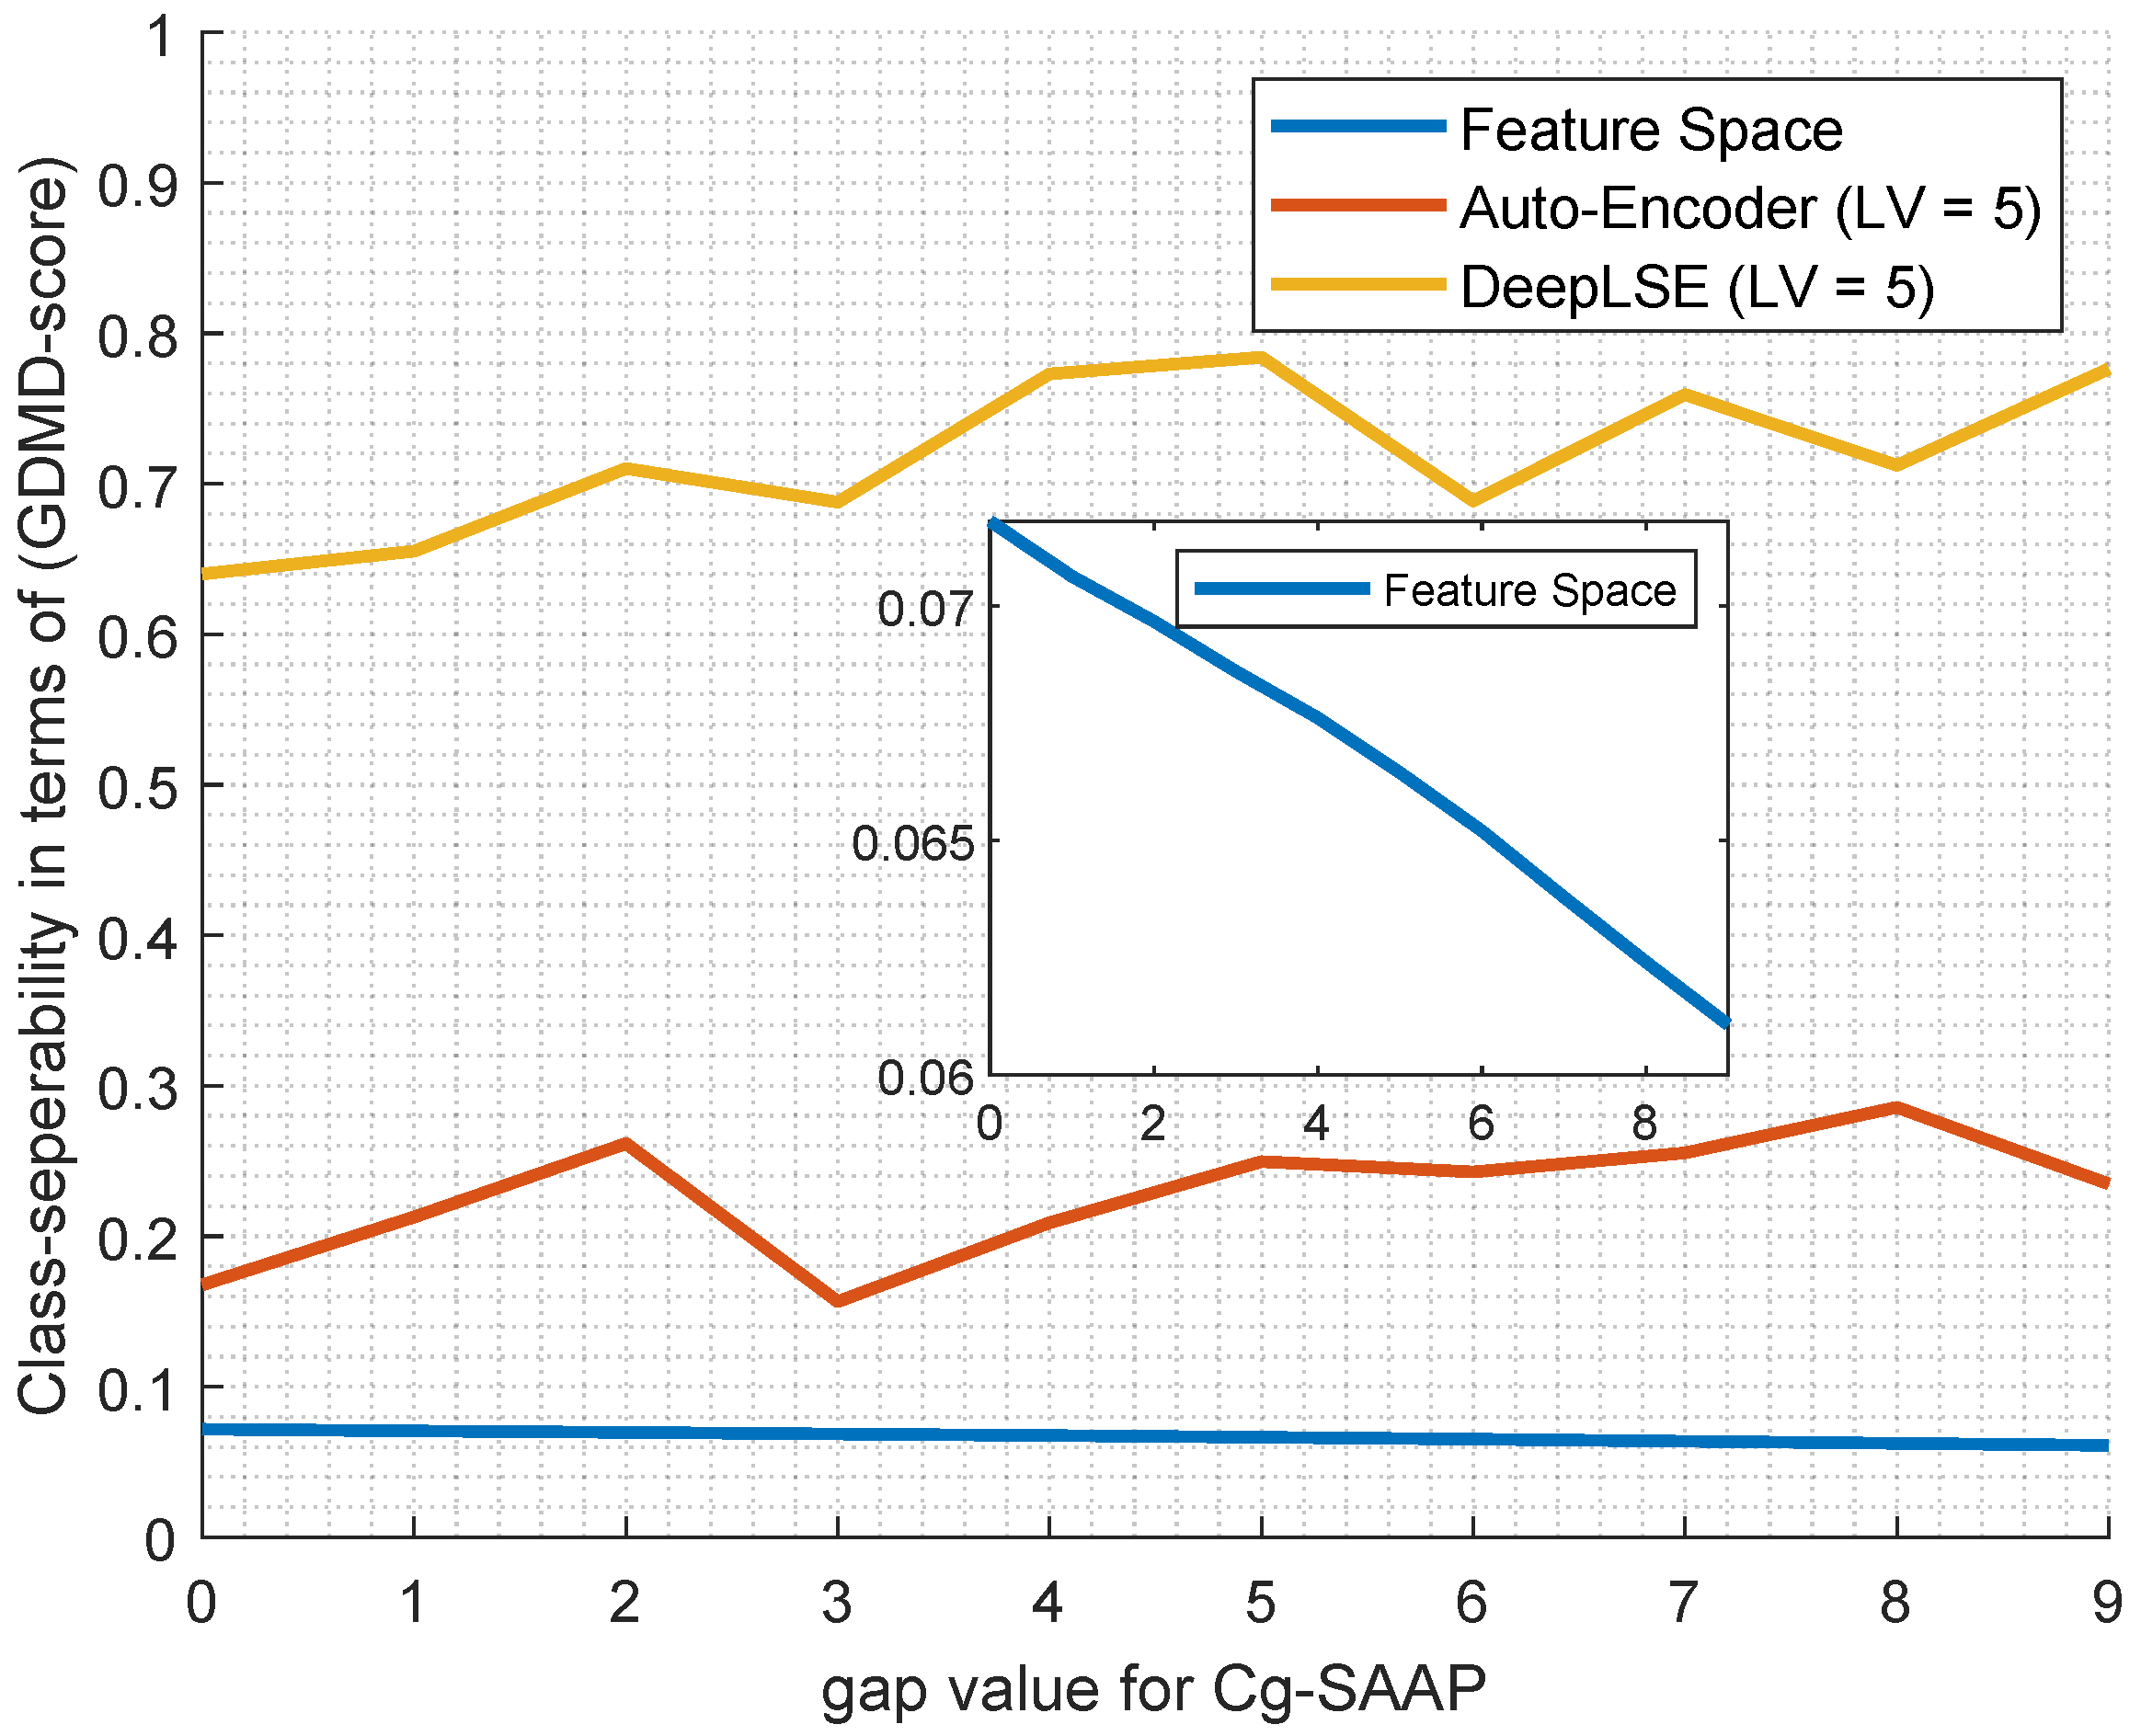
To assess the performance of the proposed ACP-LSE method, a comparison of the generalized multi-dimension distribution overlap (GMDM) [72,73] scores is presented in Figure 3. To that end, two models with identical encoder and decoder settings undergo training for 10-fold cross-validation on the ACP344 dataset. For both models, the number of latent-space variables (LV) was fixed to 5. The latent-space encoded features from these models are fed into the GMDM function to measure the degree of overlap between the feature spaces of two classes. Specifically, one model with is a conventional auto-encoder without a classification constraint, while the other is the DeepLSE with , incorporating a constraint on the latent-space representation. As a baseline, the original feature space is also evaluated for GMDM scores, and the process is repeated for 10 different values of gaps (G) in Cg-SAAP.

Figure 3.
Comparison of GMDM [73] scores of AE and DeepLSE encoded latent-spaces.
It is evident from Figure 3 that the original feature space is highly cluttered, resulting in very low class separability. In contrast, both the auto-encoder and the proposed DeepLSE effectively compress the feature dimensions, leading to higher relative class separability scores. It is noteworthy that the GMDM suggests using a weighted contribution of the projected variables based on their eigen-spread values. However, since the goal of this experiment is to assess overlap in the original space without noise removal, no PCA embedding is employed during the GMDM calculation. Furthermore, to prevent data leakage, no training sample is used to calculate GMDM scores, and the average results of the 10-fold cross-validation are plotted.
The above experiment is focused on demonstrating, through GMDM, how the proposed DeepLSE more effectively compresses feature dimensions compared to a conventional auto-encoder and the original feature space. From the analysis, we can conclude that the higher values of G bring some useful information that is cluttered by other redundant features/information. Unlike conventional AE, where cluttered information is encoded in an ineffective way, unable to harness useful discriminating information, the proposed DeepLSE efficiently represents them in a compact discriminating feature space.
To further showcase the impact of different values of G on the model performance, size, and number of features, the additional results are presented in Table 2, highlighting DeepLSE classification results for different values of Gap (G) in terms of the MCC score. Similar to the previous analysis, the results presented in Table 2 clearly show that higher values of G provide additional discriminating information and help improve classification performance at the cost of model complexity, which is evident in the number of input features generated by Cg-SAAP for different values of G. It is also noteworthy that the larger models often need more training data, therefore, we can see that after the gap value of the model performance is capped to the MCC value of .
Table 2.
Effect of the Gap (G) parameter on the overall performance of the proposed method. Similar to the previous experiment, here, the number of latent-space variables is kept as LV = 5.
3.2. Analyzing the Effect of Feature and Latent-Space Dimension for Different Values of
In the proposed DeepLSE-based ACP classification approach, several parameters can affect the classification performance. For instance, the GAP (G) between two amino-acid pairs in Cg-SAAP controls the length of the feature space. Similarly, the latent-space dimension () controls the size of the output of the encoder module, and loss mixing weight () controls the training priority for a specific loss. To analyze the sensitivity of DeepLSE for the aforementioned hyperparameters, for each , seventy experiments are performed, where each experiment is a 10-fold cross-validation on the ACP344 dataset.
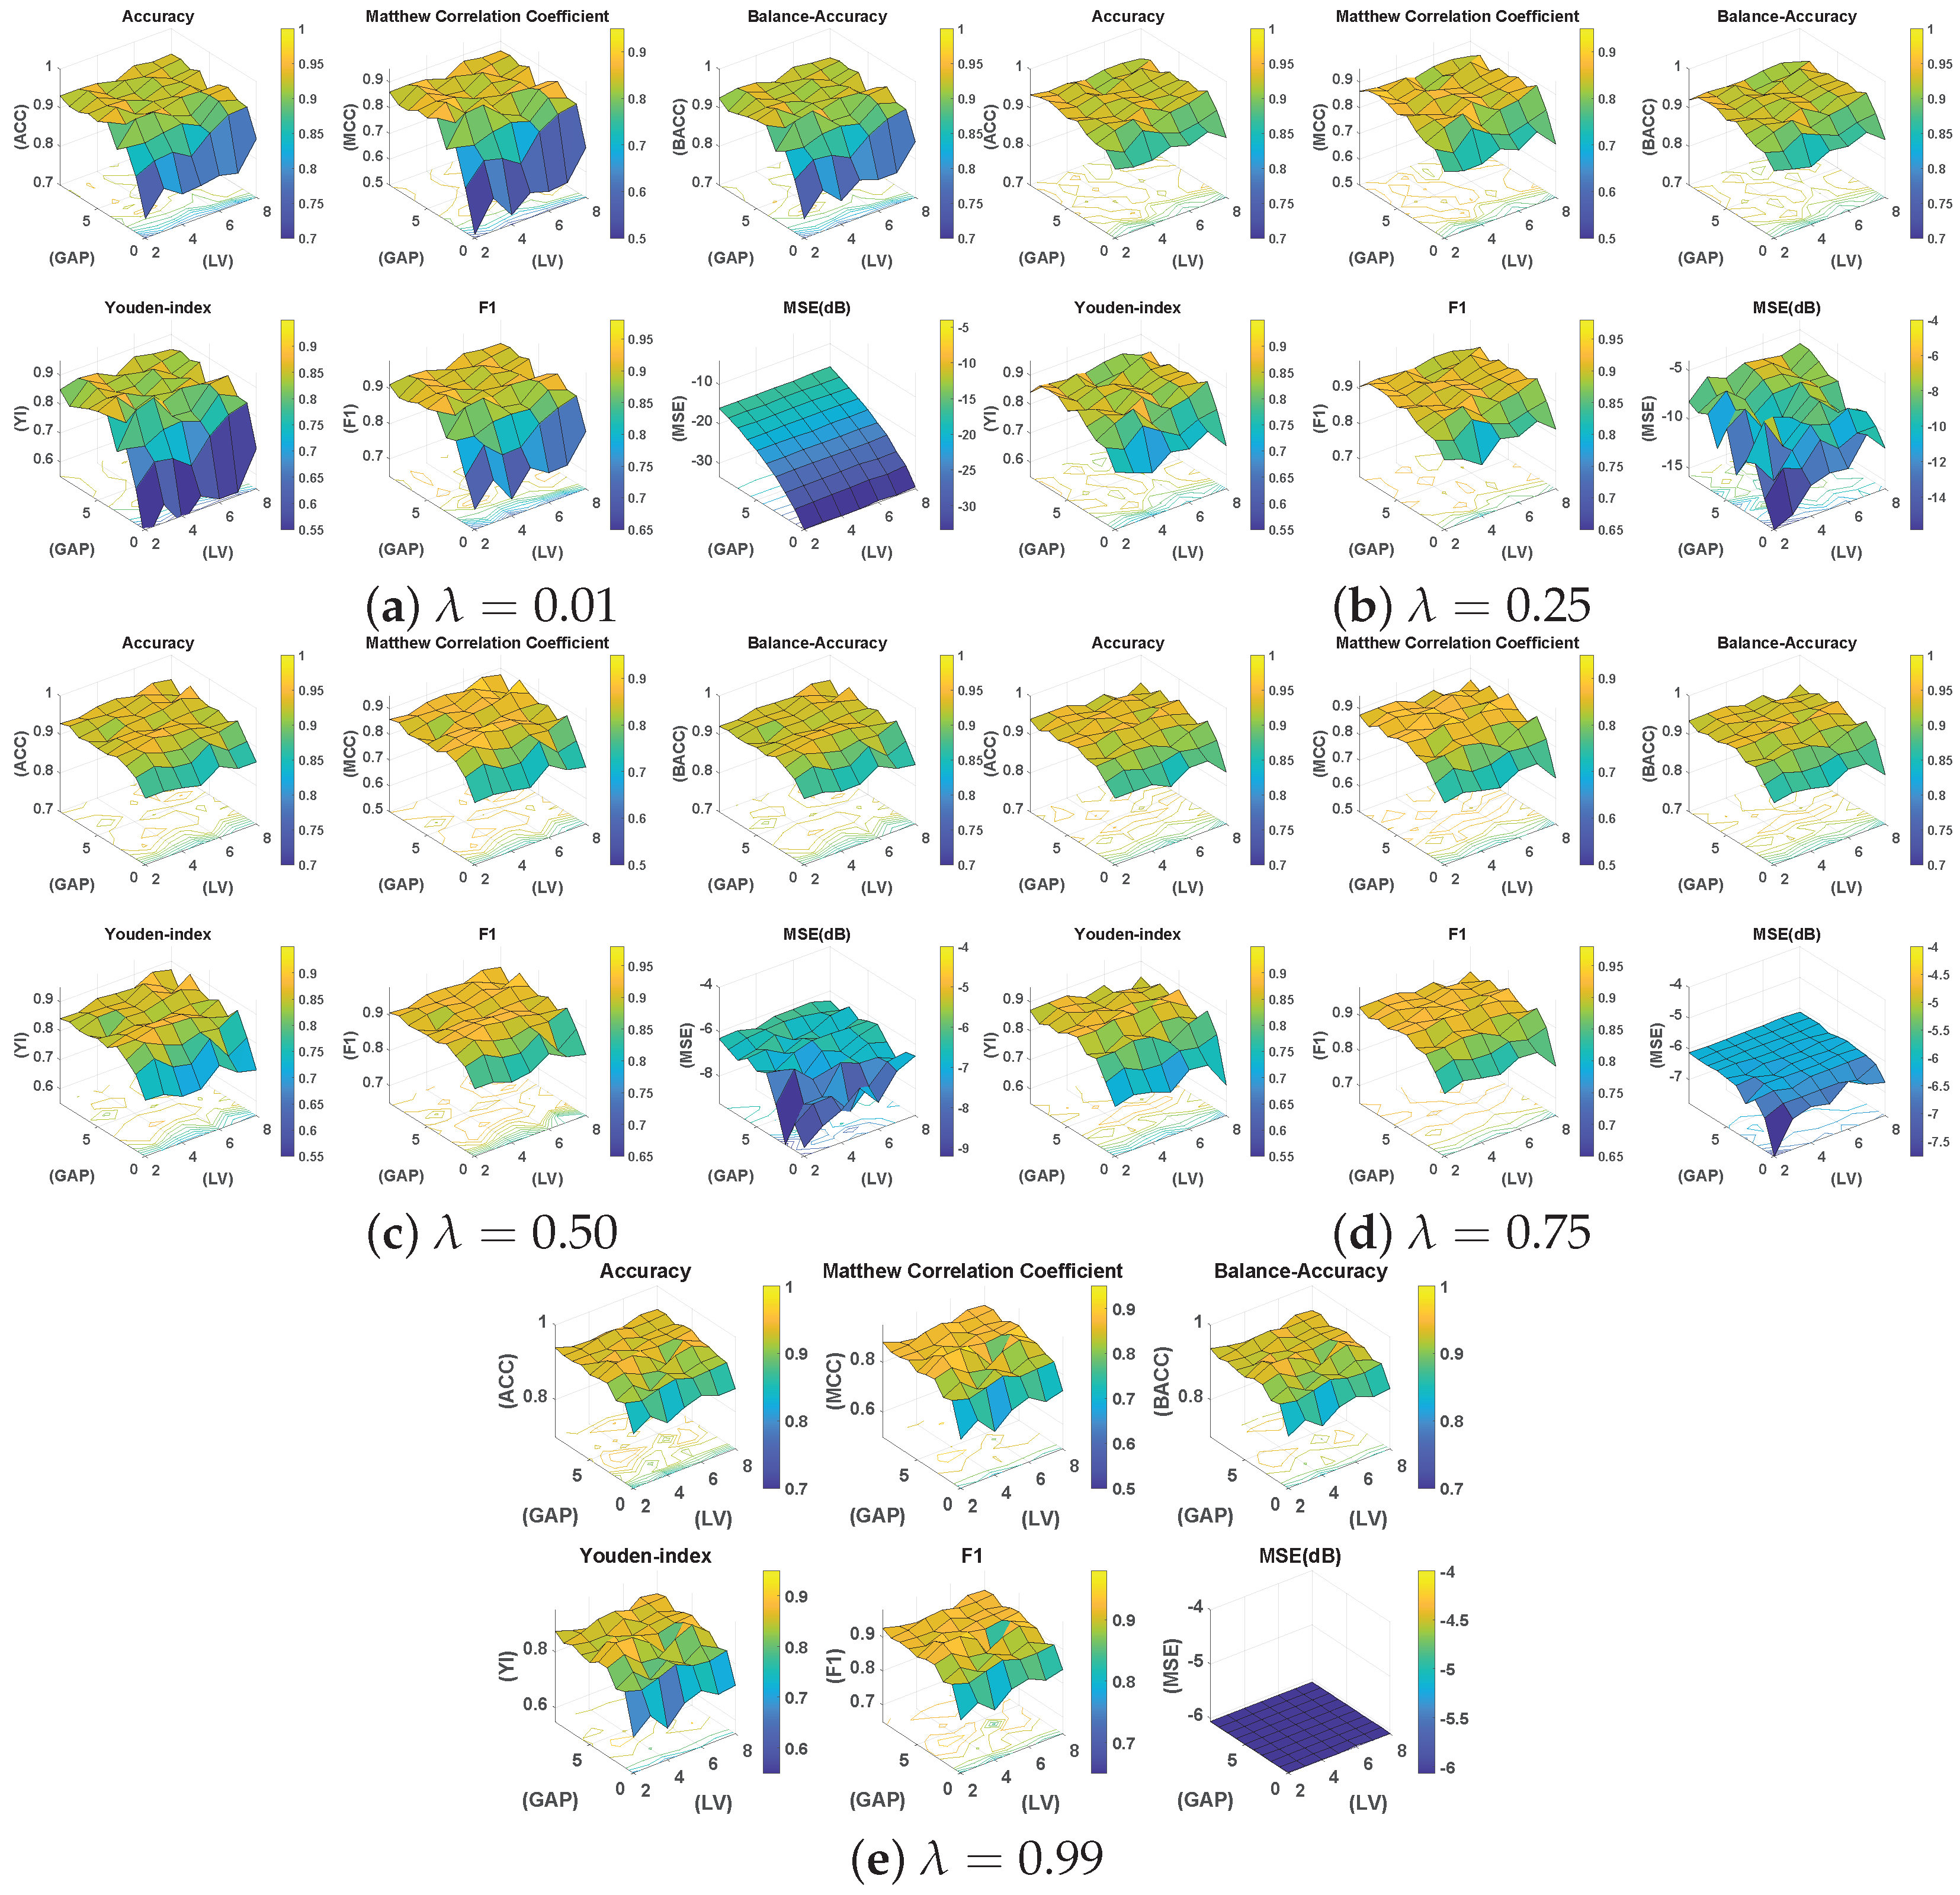
In particular, for five different values of , seven combinations of and ten GAP values are evaluated, resulting in 700 training and testing trials. The findings of this exhaustive analysis are summarized through surface plots in Figure 4. It is seen that irrespective of the choice of , GAP G, and , the overall test classification performance in terms of balanced accuracy is somewhat consistent in the range of 0.80∼0.98. Table 3 summarizes the results in the form of a comparison of the best mean statistics of 10-fold cross-validation results for different values. This demonstrates the adaptability of the proposed DeepLSE method for learning effective solutions for the given problem under variable conditions.
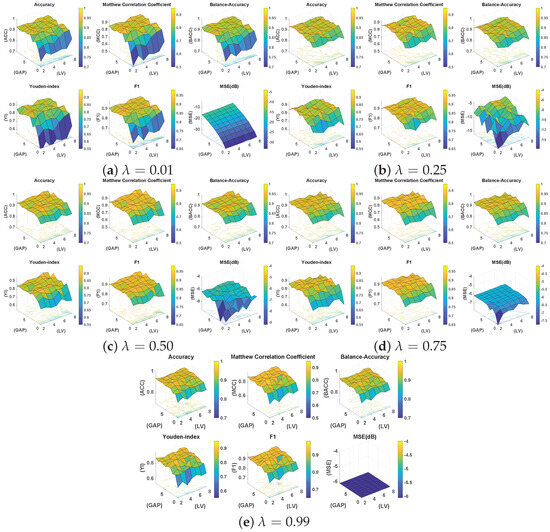
Figure 4.
Surface plots for five different values of , seven combinations of and ten GAP (G) values , resulting in 700 training and testing trials in total. In each sub-figure, the classification statistics from the test dataset are visualized. In particular, Accuracy (ACC), Mathew Correlation Coefficient (MCC), Balanced Accuracy (Bal.Acc), Youden’s-index (YI), F1-score, and Mean Squared Error (MSE) in decibel (dB) are provided.
Table 3.
Comparison of the best configurations of the 10-fold cross-validation experiment on ACP344 database for different values of .
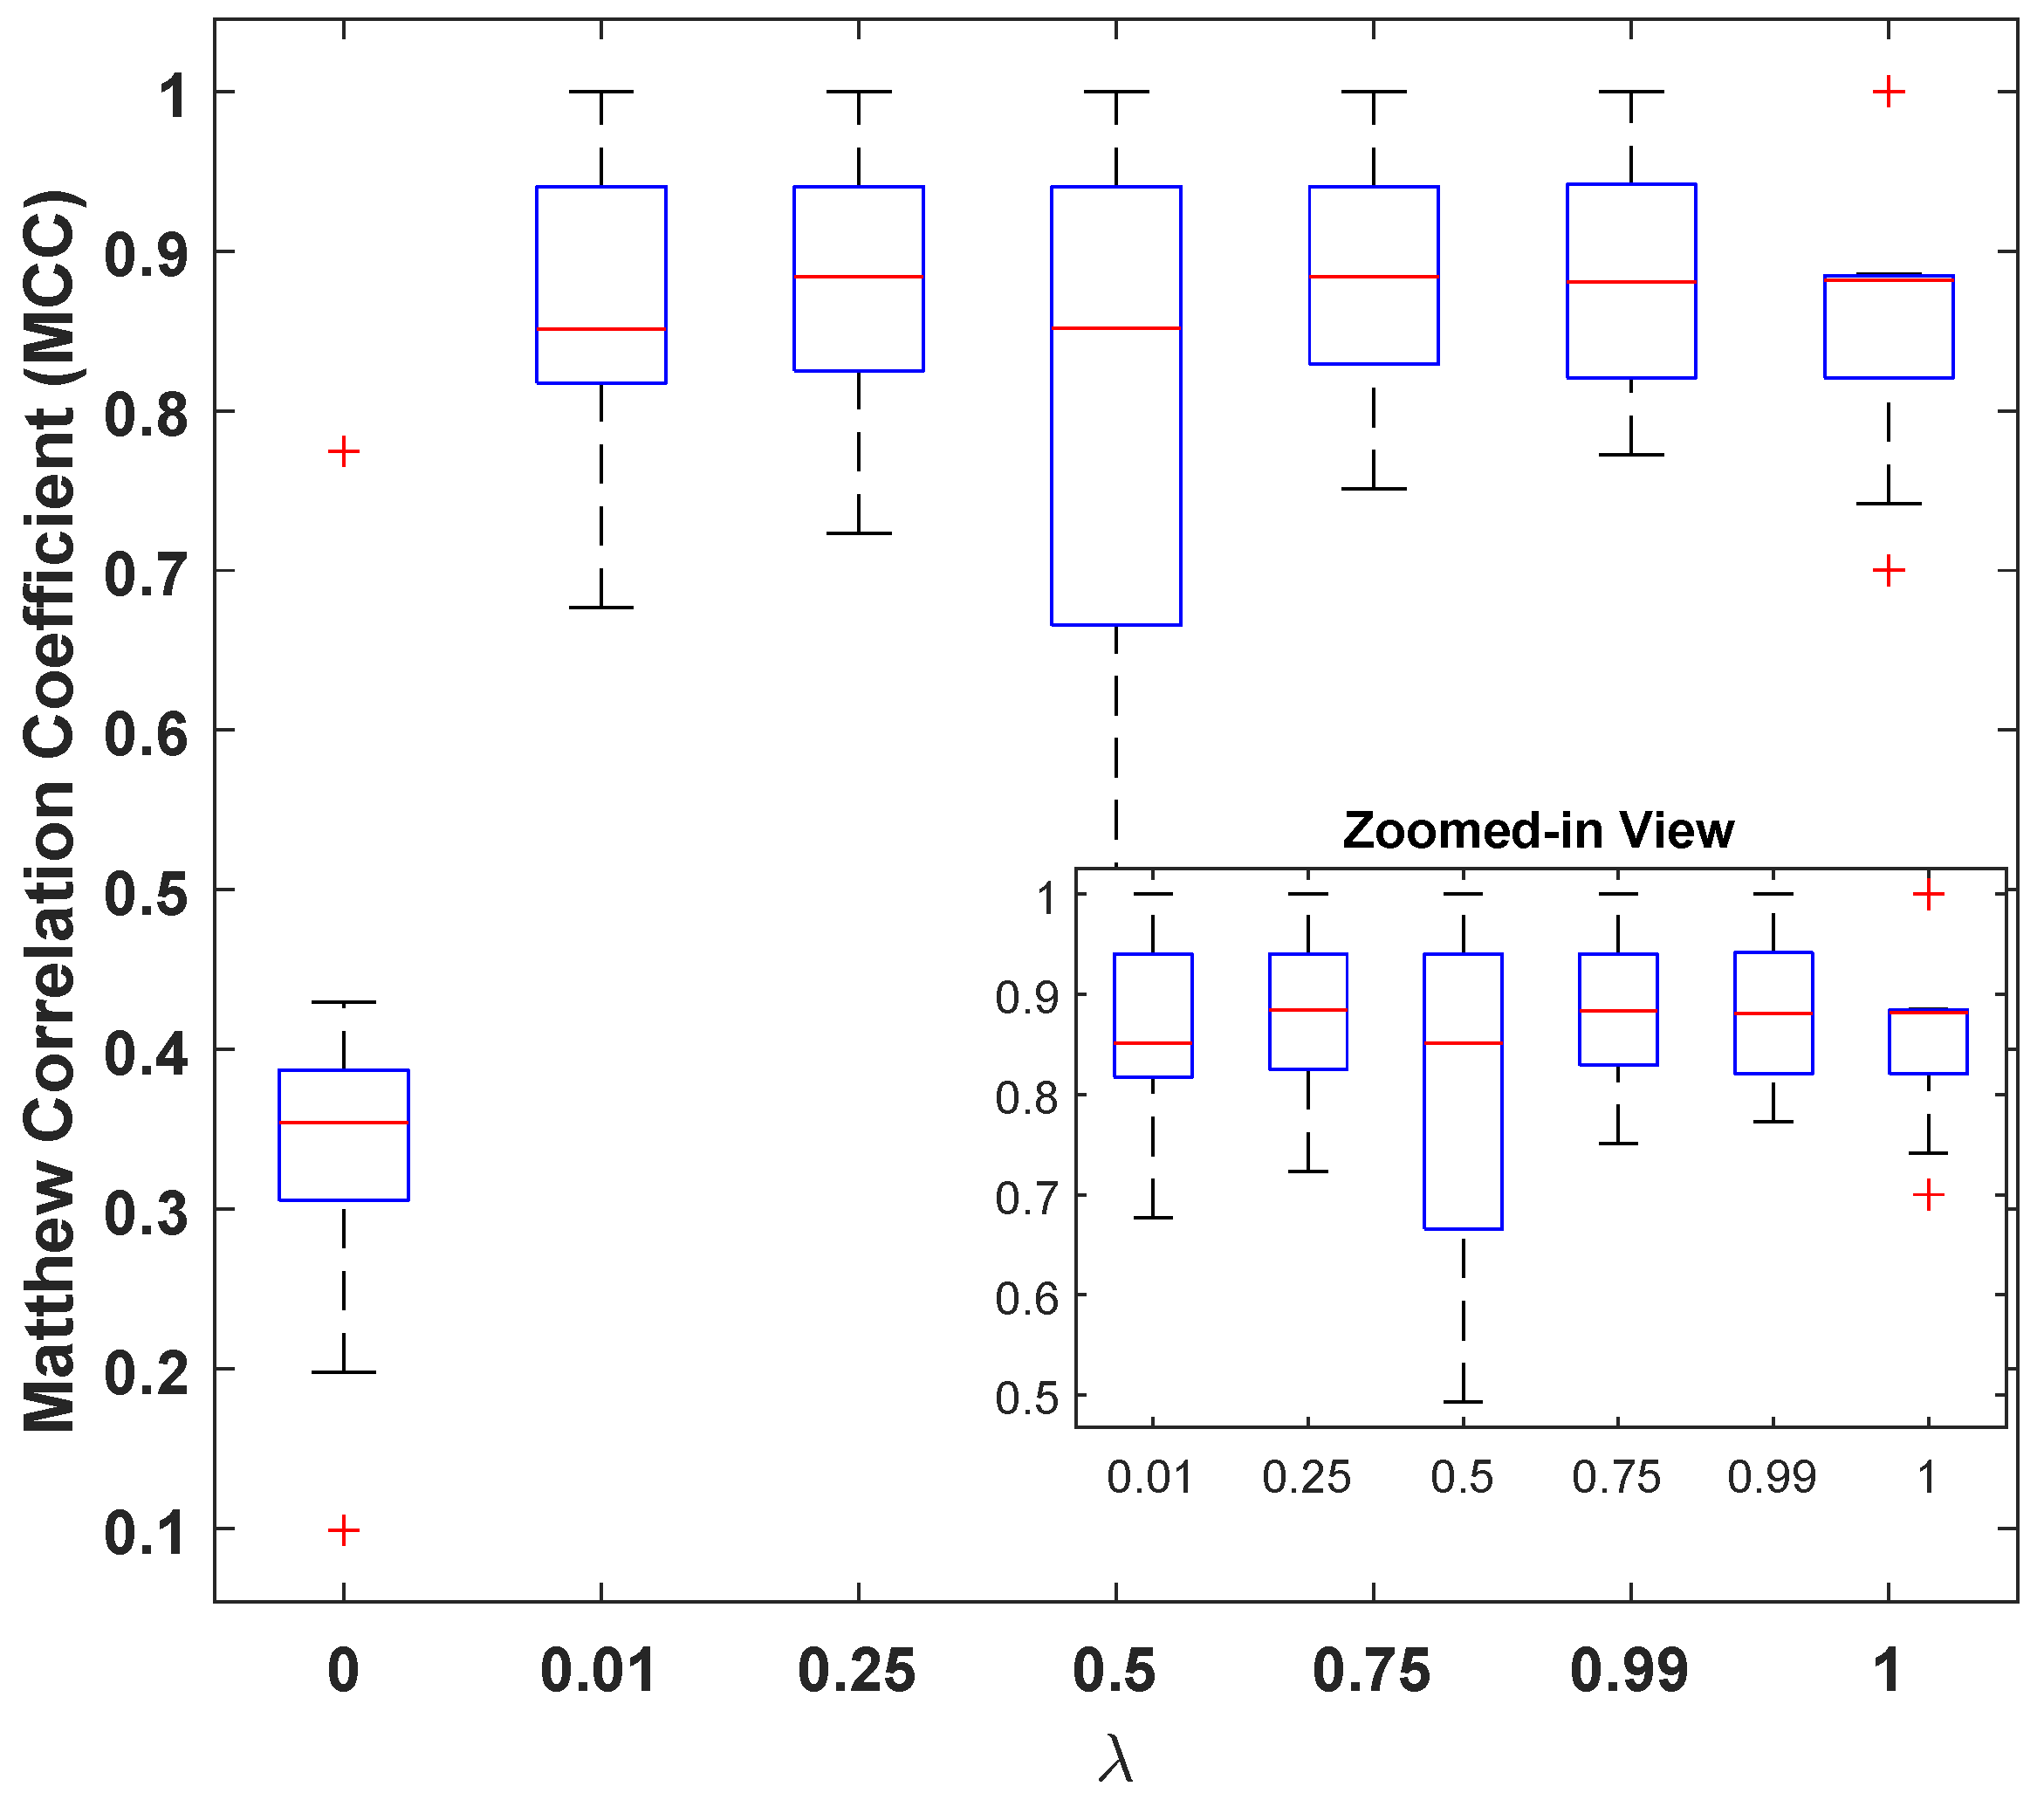
However, it can also be seen that the model is sensitive to the choice of these parameters, and the a carefully selected combination can help in designing a better classification model. In this regard, the best performance of the model was observed for with and a GAP value of . Figure 5 illustrates the MCC values for different with and a GAP value of . This is interesting because on one hand, higher values of tend to favor classification over reconstruction (see Figure 4e: high MSE(dB) with good MCC), and lower values such as prioritize reconstruction loss (see Figure 4a: lowest MSE(dB) with comparable MCC). A general assumption is that the classifier trained solely for the classification task must produce the best results, but it is observed from Figure 5 that the reconstruction constraint on latent space could help in learning additional useful information that can aid during the inference phase. A more prominent gain could be seen in larger feature spaces. For example, with GAP (), a model with achieved the best results; see Table 3. Similarly, a model with achieved the best results for GAP (). This further strengthens the proposed claim about using representational learning.
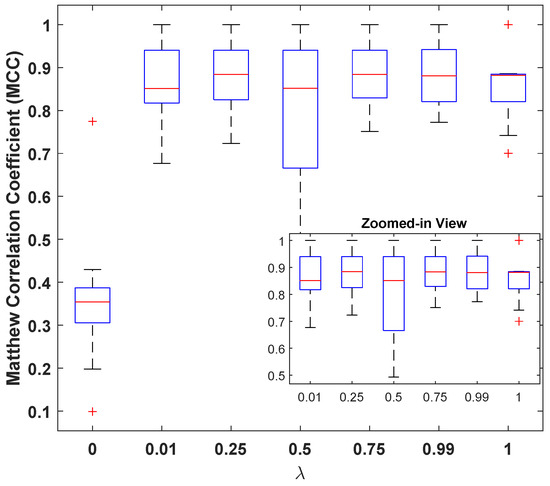
Figure 5.
Matthew’s correlation coefficient () versus loss-mixing weight .
3.3. Analyzing the Effect of on Latent-Space
By choosing a suitable value of the loss mixing hyperparameter from , one can control the contribution of reconstruction and classification losses. To analyze the effect of on the learned representation of features, deep latent-space encodings (output of the encoder block) are visualized for three values: , , and .
For this experiment, the ACP-LSE model is trained on the ACP344 dataset with the aforementioned values of , Gap , and latent space of the size . Since the output of the latent space is relatively large for easy visualization, it is first reduced to a 2D projected version using PCA and TSNE [74].
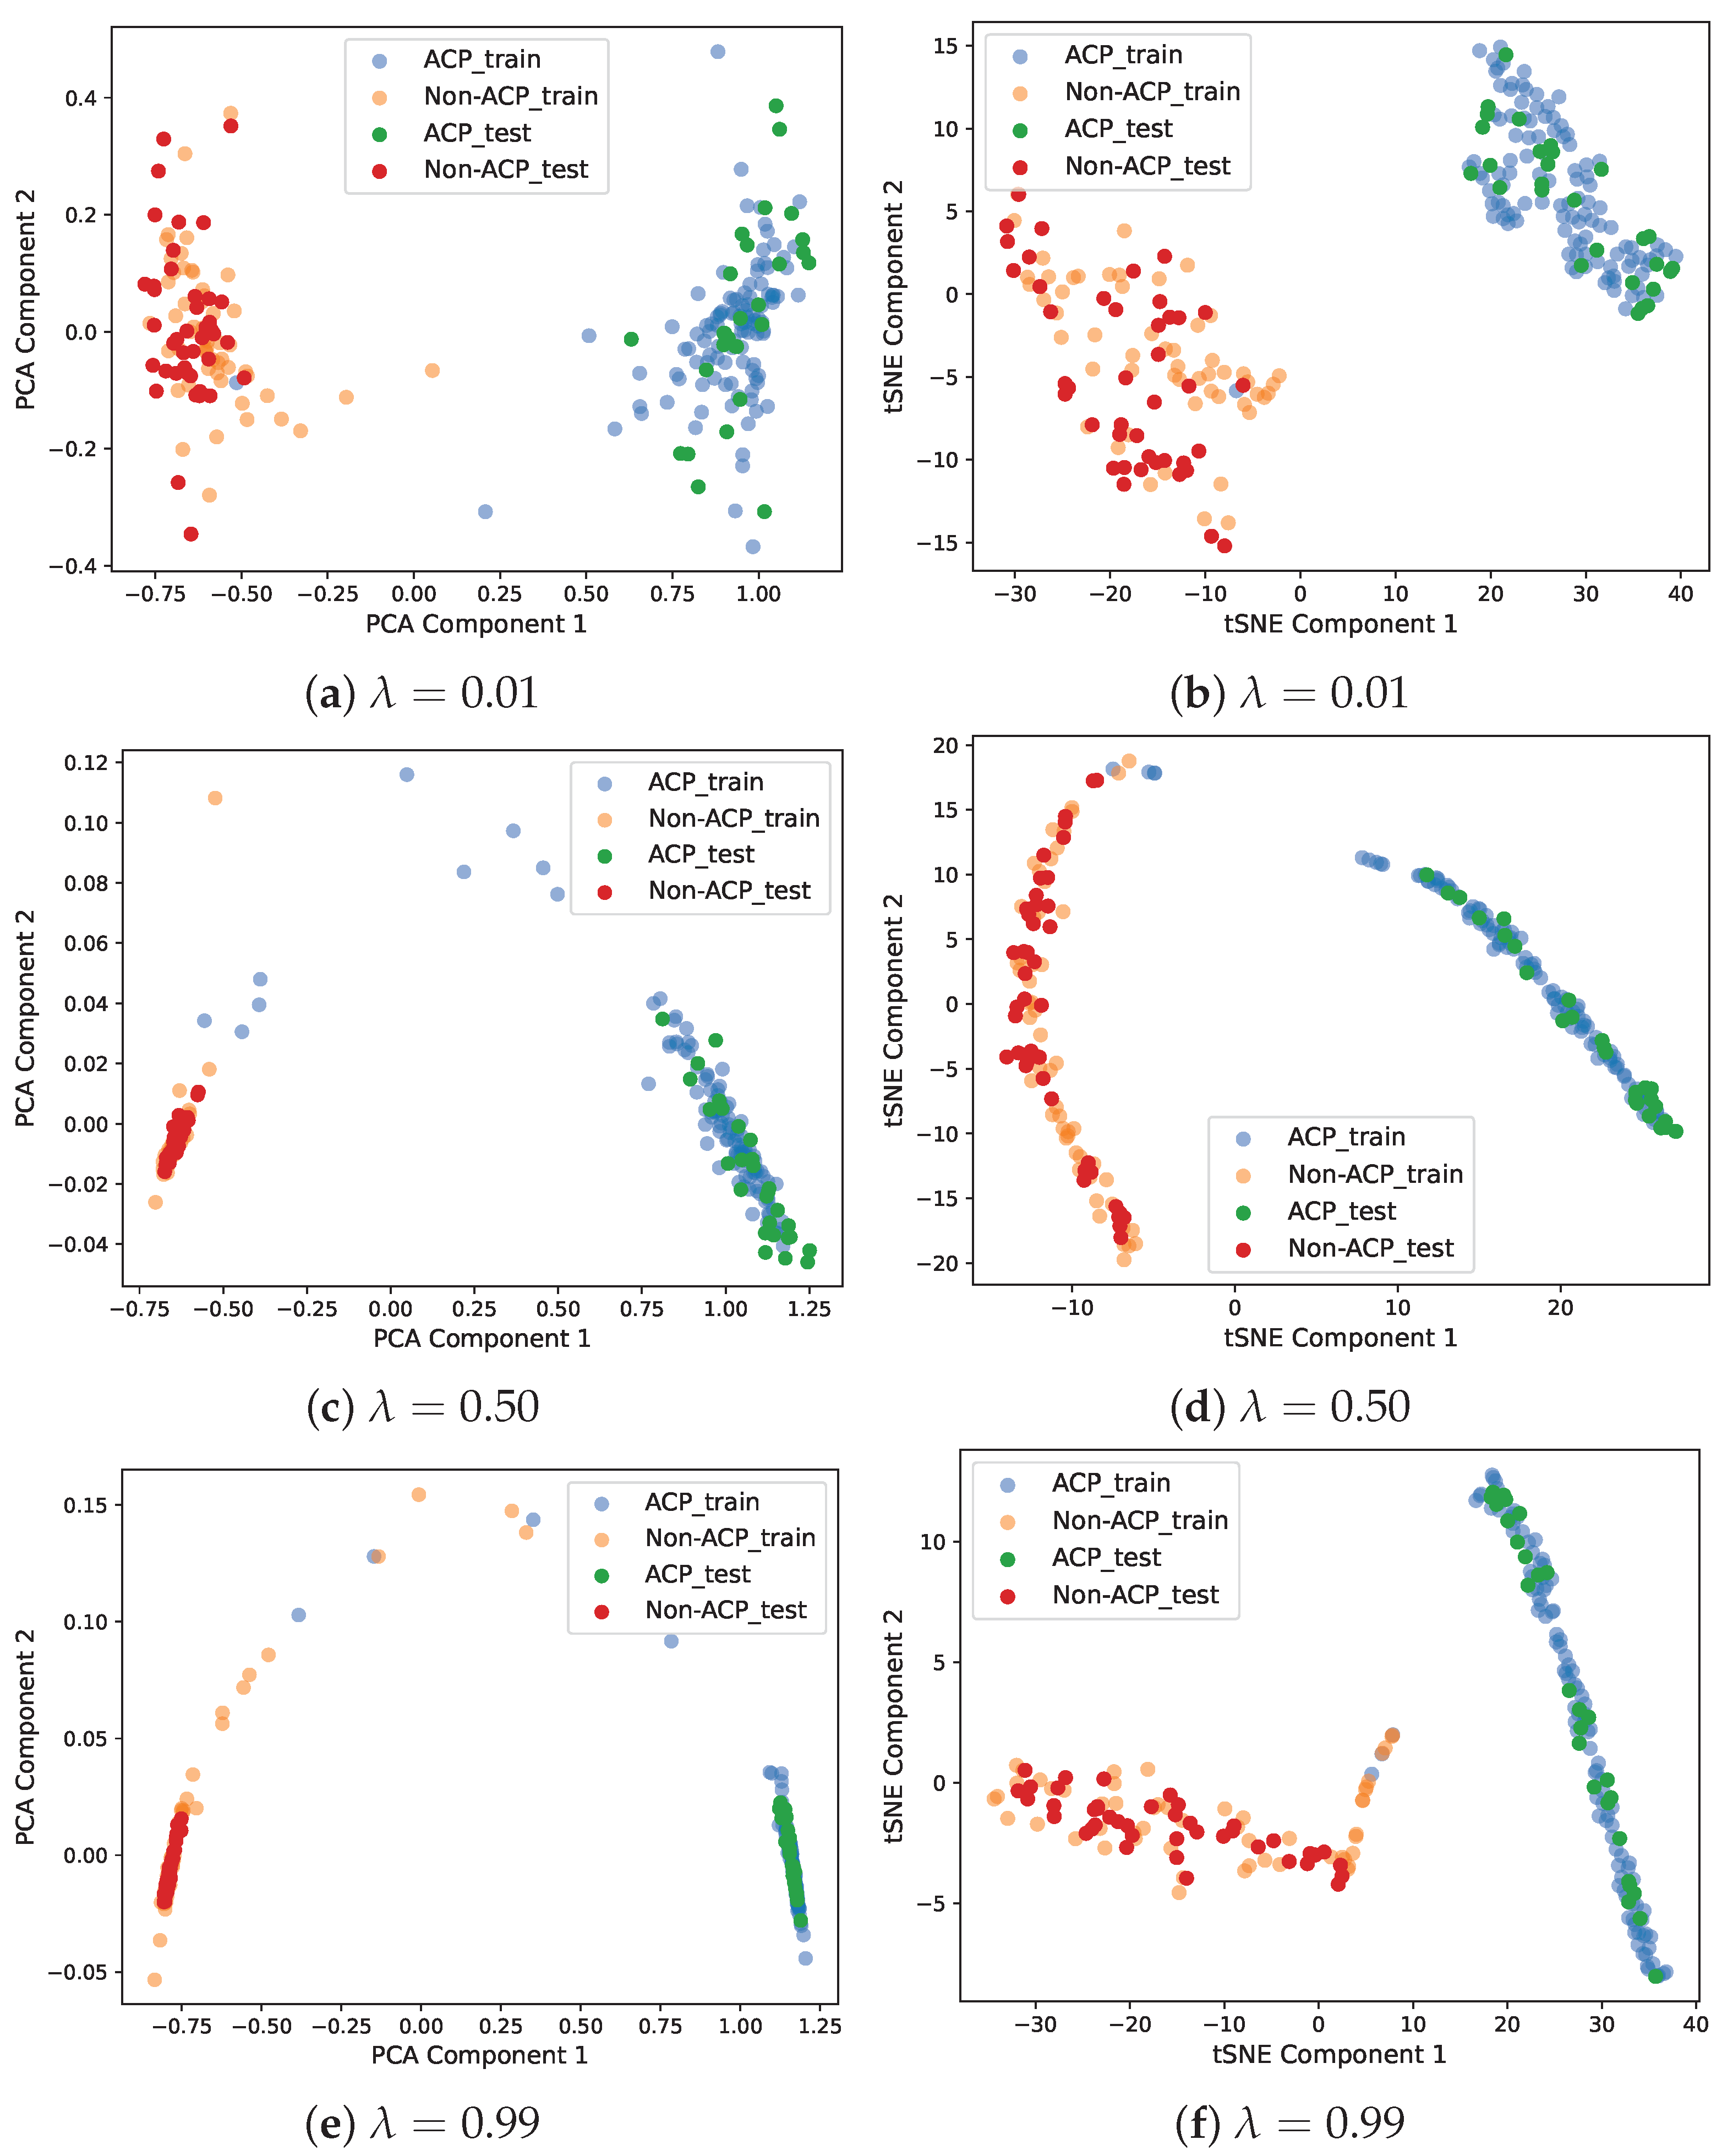
Figure 6 shows scatter plots of the PCA and TSNE-based 2D projections of the encoded outputs. The findings show that with a large value of , the DeepLSE model focuses on classification accuracy and projects samples of the same class closer together. With the lower value of , the model reduces classification accuracy and focuses on reducing reconstruction loss. Ideally, it is better to have the best classification accuracy; however, a large value of gives the classifier more freedom during the training phase and might lead the model to overfit the training data. Therefore, for better generalization, should be balanced. This enables the encoder to learn variability in input features, while the latent-space representation constrains the classifier module to learn a decision boundary that maximizes inter-class separability.
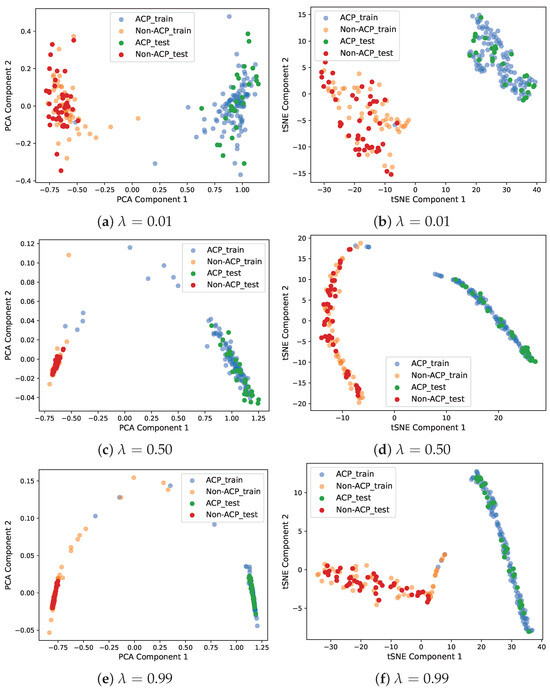
Figure 6.
Scatter plots of PCA and TSNE-based 2D projection of encoded outputs. For , the model emphasizes more on classification accuracy and projects samples of the same class closer to each other. For , the model relaxes classification accuracy but emphasizes minimizing the reconstruction error.
3.4. Analyzing the Robustness of DeepLSE against Random Mutations
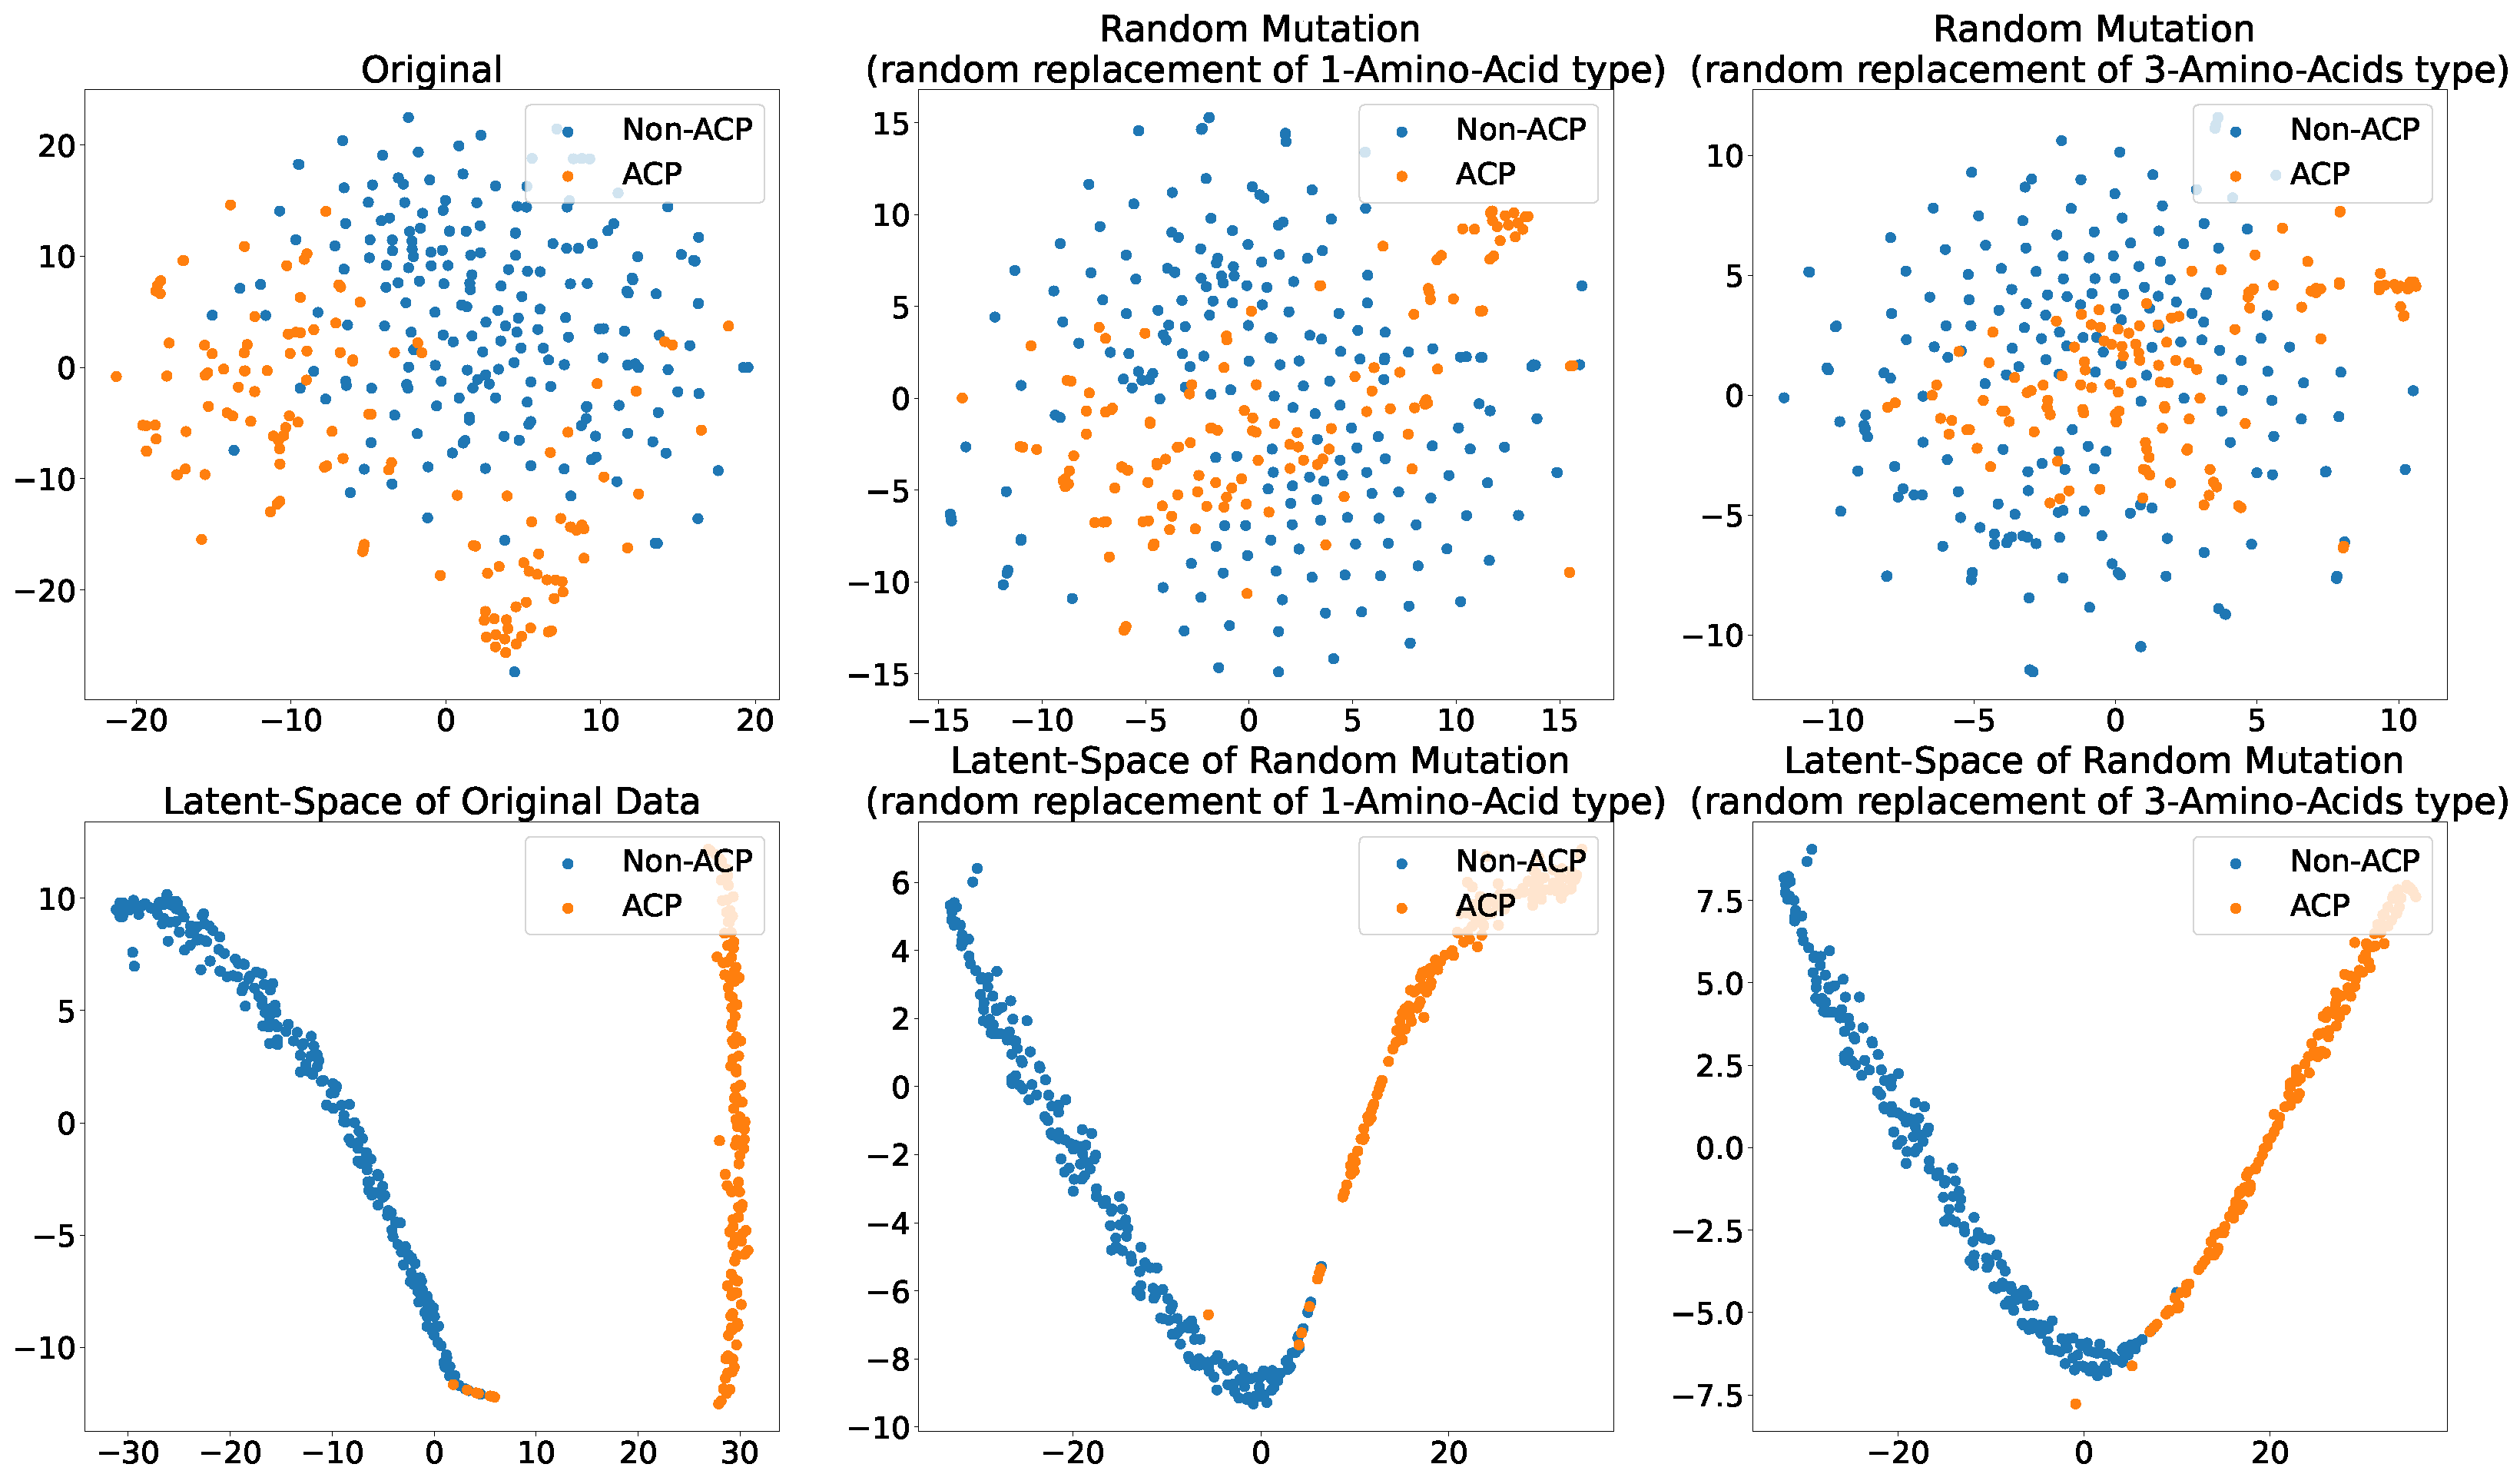
Figure 7 shows the original (unmutated) ACP344 dataset alongside two of its mutation variants. This experiment attempts to evaluate the robustness of the proposed ACP-LSE method against mutations in ACP sequences. Specifically, the TSNE [74] plots of Cg-SAAP (with ) features from the original ACP344 dataset are compared to mutants of 138 ACPs derived from the ACP344 dataset. The purpose of this experiment is to determine the susceptibility of latent-space encoding to random mutations.
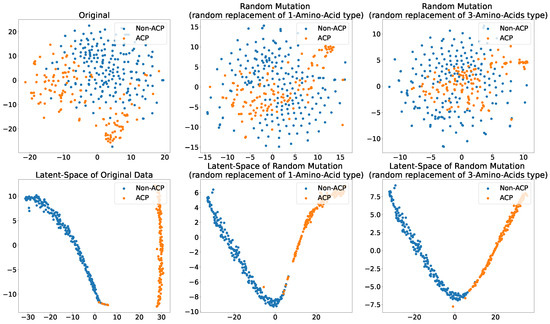
Figure 7.
Scatter plot of 2-components of the TSNE showing different levels of mutations and their effect on the (Top) Cg-SAAP composition features space and (Bottom) deep latent-space encoding. (Left) original feature space and its latent-space representation; (Middle) randomly mutated ACPs with the replacement of 1 Amino Acid type; (Right) randomly mutated ACPs with the replacement of 3 amino acid types.
The findings show that in the original feature space, the separability of ACPs and non-ACPs in empirical distributions reduces significantly with the mutation rate. When more amino acids in ACPs are mutated, the chance increases that these mutant ACP features will not have anticancer properties. However, the proposed ACP-LSE, which was trained purely on original (unmutated) data, retains class separability even when three amino acids are randomly mutated or replaced. This demonstrates the effectiveness of representation learning in extracting robust representations.
3.5. Analyzing Performance Consistency versus Ratio of Training and Testing Samples Splits
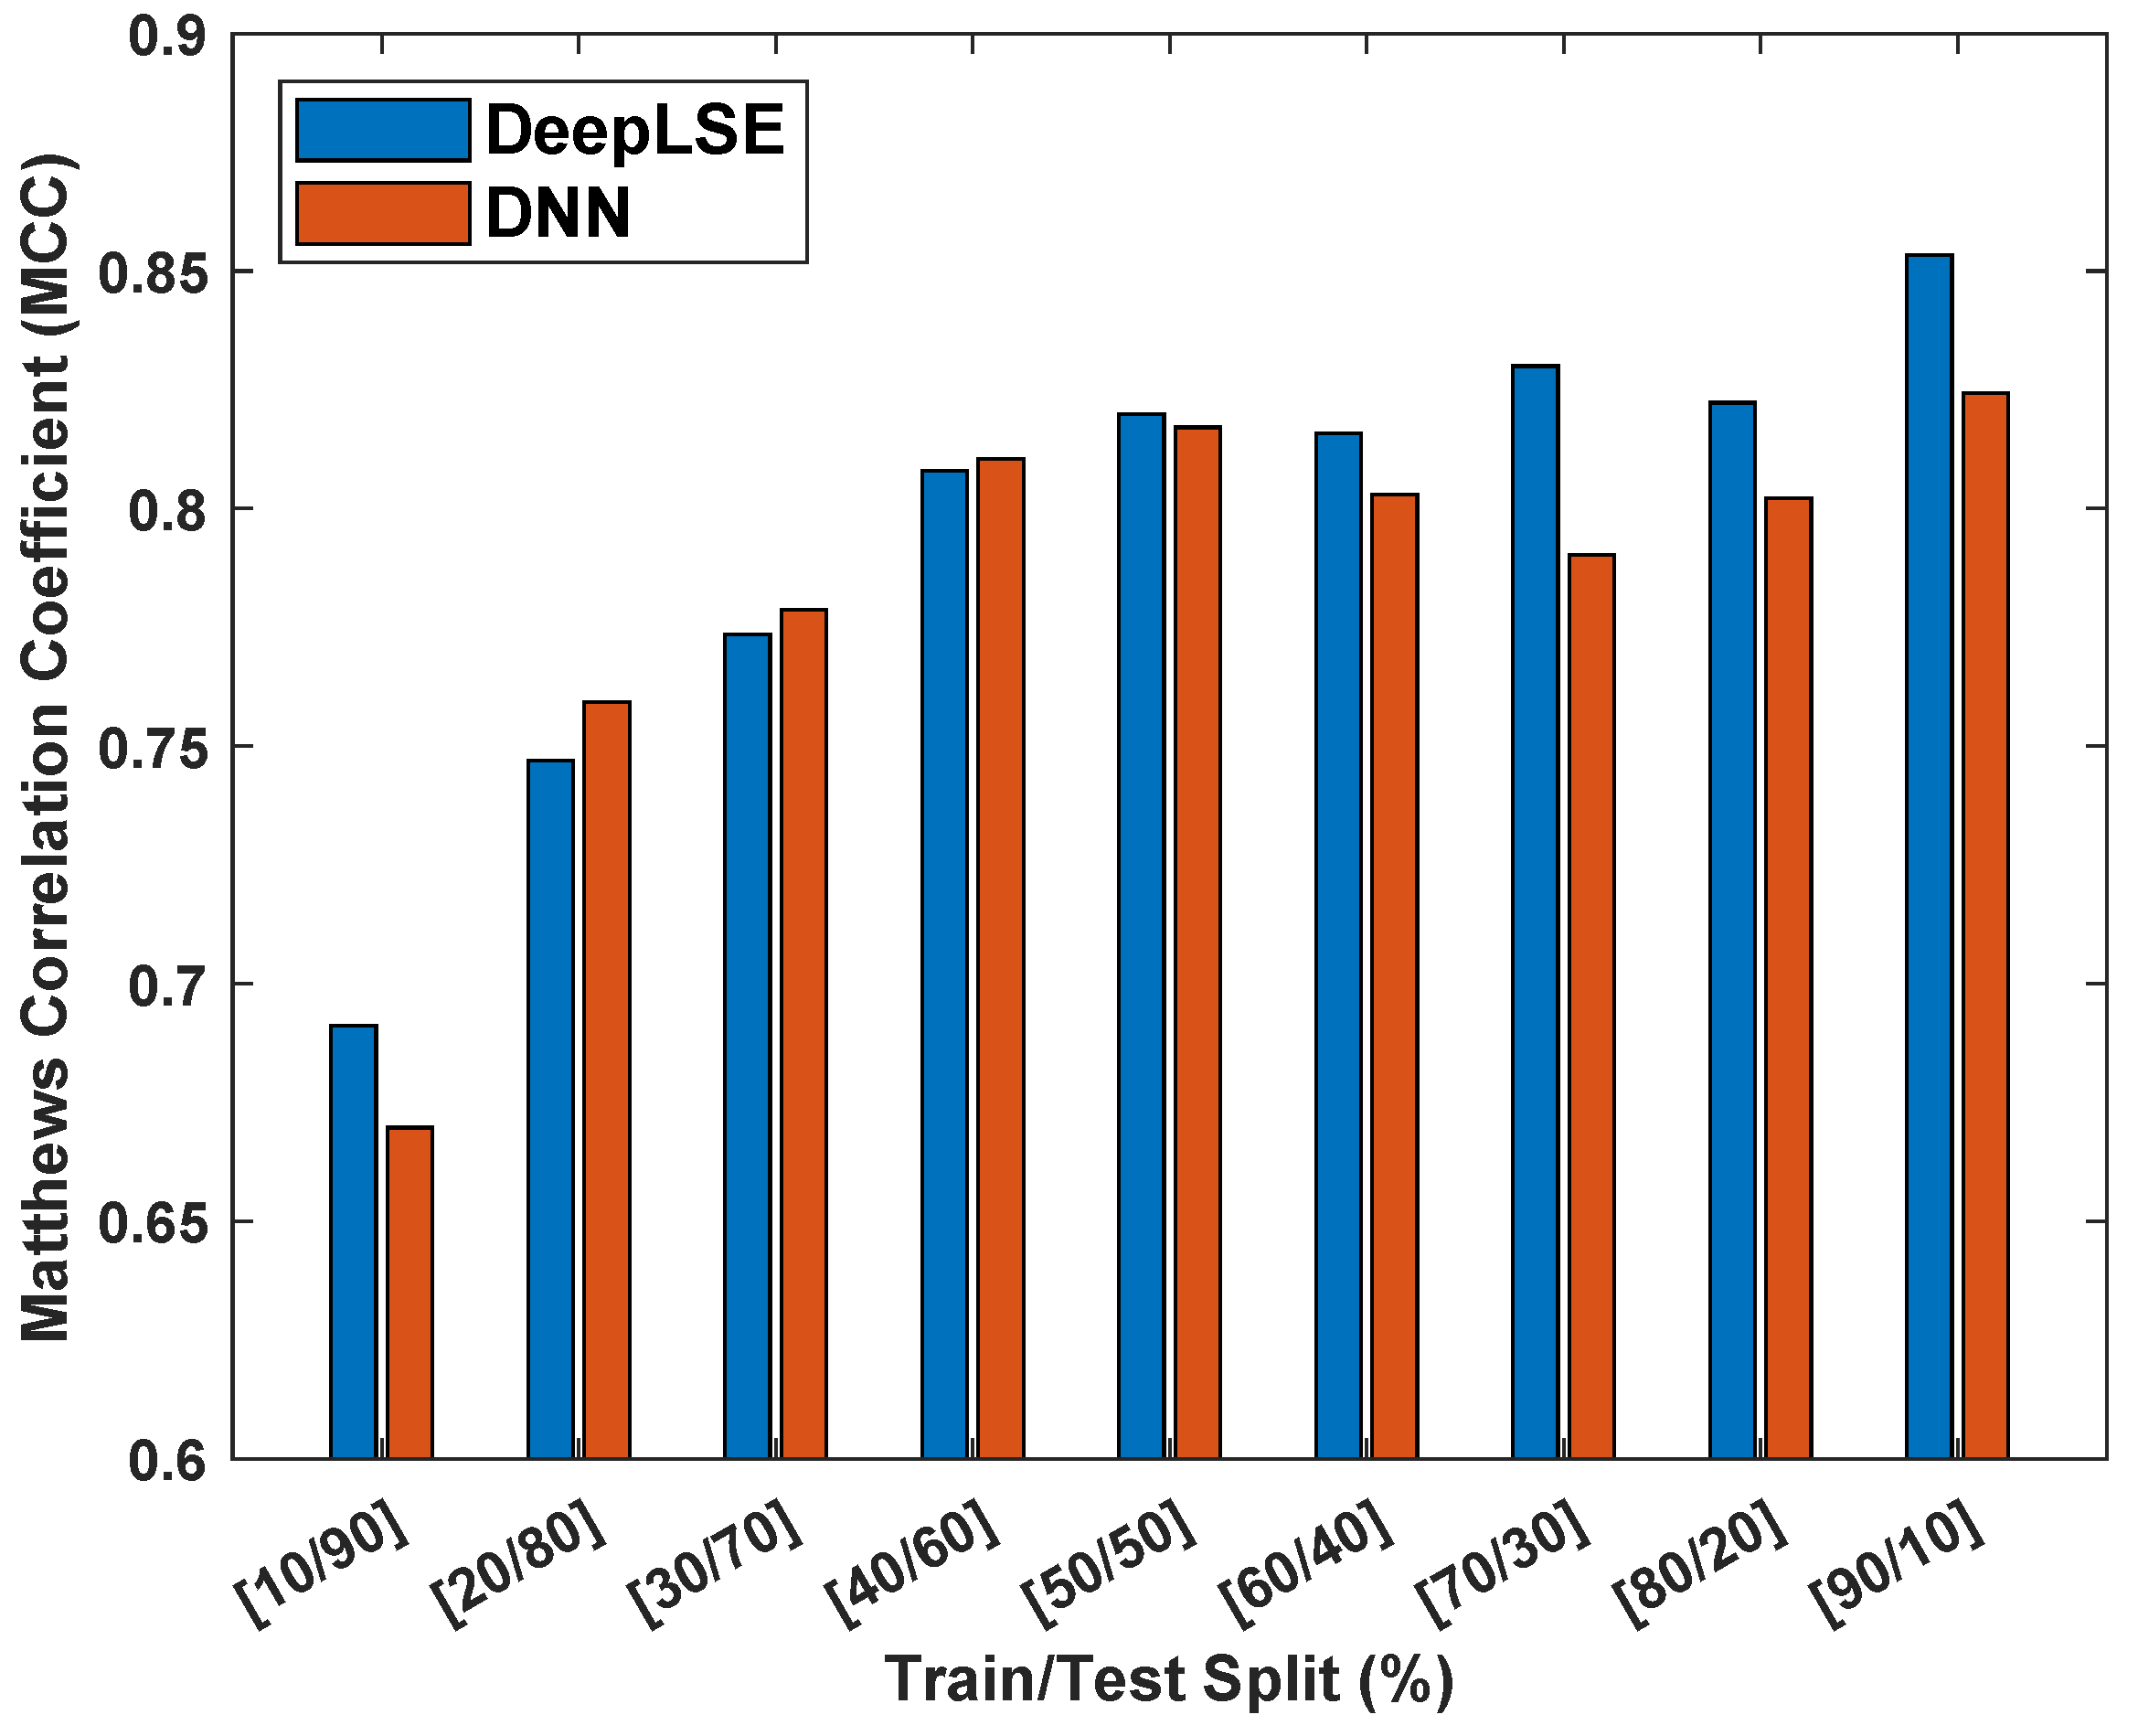
To assess the influence of dataset size on the performance and consistency of the proposed method, an experiment is designed where the performance of the proposed ACP-LSE is evaluated on various train and test dataset split ratios. For this experiment, the latent-space feature (LV) value was set to and Gap was set to , allowing us to perform comprehensive testing in comparatively less time. Figure 8 displays the Matthew’s correlation coefficient () values for models trained and tested on the ACP344 dataset for various sample sizes.
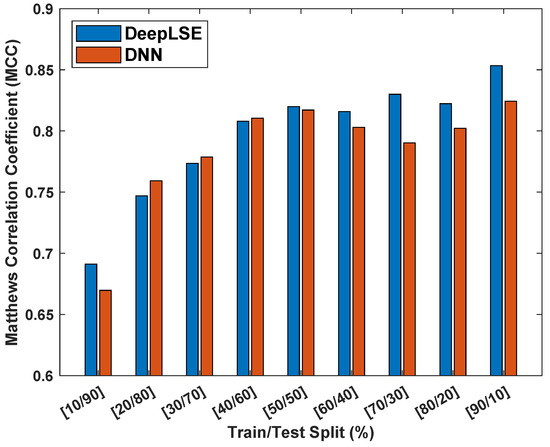
Figure 8.
Matthew’s correlation coefficient () consistency analysis of proposed DeepLSE and standard deep neural network (DNN) using the ACP344 dataset with different training and testing dataset distributions. Both the DeepLSE and DNN models consist of an identical number of neurons in their feature-extraction (encoder) and classification modules. The DeepLSE was trained with a default weight mixing ratio of , while for DNN, there is no decoder/reconstruction loss that is equivalent to .
For a fair comparison, both the DeepLSE and conventional DNN models are designed with identical numbers of neurons in their feature extraction (encoder) and classification modules. The DeepLSE was trained with a default weight mixing ratio of . For the standard DNN, the loss mixing ratio was set to (because there is no decoder/reconstruction loss).
Both models were evaluated for nine different train–test split ratios ranging from training and testing samples to training and training samples. In each experiment, the training and testing samples were randomly shuffled, and weights were reinitialized to random values. To obtain statistically meaningful results, all experiments were repeated five times, and the mean results were compared.
The findings in Figure 8 show that the proposed method is more robust in classification performance compared to standard DNN and produces superior outcomes with consistency. The proposed method outperforms the standard DNN classifiers in both extreme cases: training, testing samples and training, testing samples. Similarly, for other distributions of training and testing sample splits, the classification performance of DeepLSE is either high or comparable to that of the standard DNN. This highlights the superiority of the proposed representation-learning approach, where the latent space is constrained by reconstruction loss, allowing for the learning of useful features using large models even when the number of training samples is extremely low.
3.6. Comparison with State-of-the-Art ACP Classification Approaches
This section compares the performance of the proposed anticancer peptide classification method, ACP-LSE, which is based on DeepLSE, to the current state-of-the-art ACP classification algorithms. The assessment uses two standard datasets: ACP344 [34] and ACP740 [70]. It is critical to emphasize that for a fair comparison, the training and testing samples across all methodologies are kept comparable, as outlined in the previous works. Specifically, the ACP344 dataset is assessed using 5-fold and 10-fold cross-validation protocols, whereas the ACP740 dataset is examined using a 5-fold cross-validation approach. Table 4 summarizes the hyperparameters used in this study, while any additional specifications about each experiment are presented in the respective subsections.
Table 4.
Configuration of best-performing models. Here, n is the number of folds in cross-validation, and G is the maximum space between Cg-SAAP.
3.6.1. ACP344 Dataset
To guarantee a fair comparison, we analyze the proposed method on the ACP344 dataset using two well-known evaluation protocols reported in the literature. Table 5 and Table 6 show the performance statistics of several algorithms on the ACP344 dataset using 5-fold and 10-fold cross-validation, respectively. Given the imbalanced nature of the dataset, conventional accuracy metrics are deemed inadequate to describe the overall performance. As a result, class-specific assessment criteria such as MCC and Youden’s index are employed to assess the comprehensive classification capability of classification models.
Table 5.
Performance comparison of the ACP-LSE with contemporary methods on 5-fold cross-validation on ACP344 dataset.
Table 6.
Performance comparison of the proposed ACP-LSE with contemporary methods on 10-fold cross-validation on ACP344 dataset.
In 5-fold cross-validation, the proposed method achieves the third-best MCC score, demonstrating its effectiveness in differentiating the ACP features. The proposed ACP-LSE has an MCC value of , which is only and lower than the values reported for EnACP [75] and IACP [75,76], respectively. It is also worth mentioning that the ACP344 dataset is severely unbalanced, with just a limited number of training samples (110 ACPs and 165 non-ACPs) available for learning in 5-fold cross-validation. Given that the auto-encoder model does not require classification labels, it might be interesting to investigate DeepLSE with pre-trained models to determine its potential impact on performance improvement. To investigate the influence of a larger training dataset, a 10-fold cross-validation protocol is used.
Significantly, the proposed method outperforms 10-fold cross-validation, demonstrating its effectiveness in classifying the features of ACP. Specifically, the proposed ACP-LSE achieved the highest MCC value of , outperforming other methods. This value is higher than that of ACP-DL [70], higher than ACP-LDF [78] with the LibD3C, higher than ACP-SKRC [62], ACP-LDF [78] with RF and SVM classifiers, and higher than SAP with the SVM classifier [38]. This substantiates the argument that the proposed method has the potential to predict novel ACPs or ACP-like peptides. Other assessment metrics support this efficacy, emphasizing the substantial difference between ACPs and non-ACPs.
3.6.2. ACP740 Dataset
This section compares the proposed ACP-LSE on the ACP740 dataset to several state-of-the-art ACP classification methods, such as ACP-DL [70], ACP-DA [58], ACP-MHCNN [79], and ACP-KSRC [62]. Table 7 summarizes the comparison results. The findings show that the proposed method outperforms the ACP-DL [70], ACP-DA [58], and ACP-KSRC [62] algorithms, as indicated by the class-specific evaluation parameter MCC. The improvements are significant, with margins of , , and , respectively.
Table 7.
Performance comparison of ACP-LSE with contemporary methods on 5-fold cross-validation on ACP740 dataset.
Notably, the ACP-LSE achieves the highest MCC value of , outperforming ACP-DL, ACP-DA, and ACP-KSRC by , , and , respectively. In addition, the performance of the proposed representation-based approach slightly outperforms the powerful ACP-MHCNN [79] method. This efficacy is consistent across various evaluation metrics, demonstrating the capability of the proposed ACP-LSE to distinguish between ACPs and non-ACPs. These findings indicate that the proposed method is promising for predicting ACPs or ACP-like peptides.
4. Conclusions
The diagnosis and treatment of cancer, a complex disease with diverse causes, are challenging in the field of medical research. Anticancer peptides (ACPs) are a promising approach in targeted therapy with the potential for precise and accurate treatment. However, for large-scale identification and synthesis, credible prediction approaches are required. In this paper, an intuitive yet powerful representation-learning-based method, ACP-LSE, is proposed, which shows significant improvements in classification performance, particularly in cases with small sample sizes and a large number of features.
For investigation, the results on two benchmark datasets (and three protocols) were analyzed, suggesting that the higher number of training samples either with 10-fold cross validation in ACP-344 or 5 fold cross validation in ACP-740; show a superior classification performance. Various experimental analyses show that the proposed method achieves improved classification performance and aids in learning compact latent-space representation. The suggested approach is tested for different quantitative and qualitative metrics and demonstrates a higher performance compared to the current methods. A key limitation of the proposed ACP-LSE method is that unlike contrastive learning, where a successfully trained model could learn maximum allowable class separability (i.e., infinite), in the proposed method, maximum class separability is bounded to unity. Additionally, unlike DNN where there is no decoder, the training steps in the proposed method involve learning a high number of training parameters due to the decoder network. Finally, for effective model designing using DeepLSE, the tuning of additional hyperparameters, e.g., , , etc., require computationally complex ablation studies, which take time. In the future research, I would like to investigate techniques to deal with the aforementioned limitations.
Funding
This research work was funded by the Saudi Data and AI Authority (SDAIA) and King Fahd University of Petroleum and Minerals (KFUPM) under SDAIA-KFUPM Joint Research Center for Artificial Intelligence Grant no. JRC-AI-RFP-16.
Data Availability Statement
The implementation of the proposed ACP-LSE method is accessible on GitHub (https://github.com/Shujaat123/ACP_LSE (accessed on 10 April 2024).
Acknowledgments
The author would like to acknowledge the support received from the Saudi Data and AI Authority (SDAIA) and King Fahd University of Petroleum and Minerals (KFUPM) under SDAIA-KFUPM Joint Research Center for Artificial Intelligence Grant no. JRC-AI-RFP-16. The author would also like to thank Mohammad Sohail Ibrahim and Abdul Wahab for their valuable suggestions.
Conflicts of Interest
The author declares that the research was conducted in the absence of any commercial or financial relationships that could be construed as a potential conflict of interest.
References
- Liao, Z.; Li, D.; Wang, X.; Li, L.; Zou, Q. Cancer diagnosis through IsomiR expression with machine learning method. Curr. Bioinform. 2018, 13, 57–63. [Google Scholar] [CrossRef]
- Cheng, L.; Yang, H.; Zhao, H.; Pei, X.; Shi, H.; Sun, J.; Zhang, Y.; Wang, Z.; Zhou, M. MetSigDis: A manually curated resource for the metabolic signatures of diseases. Briefings Bioinform. 2019, 20, 203–209. [Google Scholar] [CrossRef]
- Zeng, W.; Wang, F.; Ma, Y.; Liang, X.; Chen, P. Dysfunctional mechanism of liver cancer mediated by transcription factor and non-coding RNA. Curr. Bioinform. 2019, 14, 100–107. [Google Scholar] [CrossRef]
- Zhang, Y.; Kou, C.; Wang, S.; Zhang, Y. Genome-wide differential-based analysis of the relationship between DNA methylation and gene expression in cancer. Curr. Bioinform. 2019, 14, 783–792. [Google Scholar] [CrossRef]
- Zhou, L.Y.; Qin, Z.; Zhu, Y.H.; He, Z.Y.; Xu, T. Current RNA-based therapeutics in clinical trials. Curr. Gene Ther. 2019, 19, 172–196. [Google Scholar] [CrossRef]
- Yang, Q.; Wang, Y.; Zhang, Y.; Li, F.; Xia, W.; Zhou, Y.; Qiu, Y.; Li, H.; Zhu, F. NOREVA: Enhanced normalization and evaluation of time-course and multi-class metabolomic data. Nucleic Acids Res. 2020, 48, W436–W448. [Google Scholar] [CrossRef]
- Ferlay, J.; Shin, H.R.; Bray, F.; Forman, D.; Mathers, C.; Parkin, D.M. Estimates of worldwide burden of cancer in 2008: GLOBOCAN 2008. Int. J. Cancer 2010, 127, 2893–2917. [Google Scholar] [CrossRef] [PubMed]
- Jemal, A.; Siegel, R.; Xu, J.; Ward, E. Cancer statistics, 2010. CA A Cancer J. Clin. 2010, 60, 277–300. [Google Scholar] [CrossRef]
- Basith, S.; Cui, M.; Macalino, S.J.; Choi, S. Expediting the design, discovery and development of anticancer drugs using computational approaches. Curr. Med. Chem. 2017, 24, 4753–4778. [Google Scholar] [CrossRef] [PubMed]
- Jemal, A.; Bray, F.; Center, M.M.; Ferlay, J.; Ward, E.; Forman, D. Global cancer statistics. CA A Cancer J. Clin. 2011, 61, 69–90. [Google Scholar] [CrossRef] [PubMed]
- Torre, L.A.; Bray, F.; Siegel, R.L.; Ferlay, J.; Lortet-Tieulent, J.; Jemal, A. Global cancer statistics, 2012. CA A Cancer J. Clin. 2015, 65, 87–108. [Google Scholar] [CrossRef] [PubMed]
- Feng, Y.M. Gene therapy on the road. Curr. Gene Ther. 2019, 19, 6. [Google Scholar] [CrossRef] [PubMed]
- Lin, M.; Li, X.; Guo, H.; Ji, F.; Ye, L.; Ma, X.; Cheng, W. Identification of bone metastasis-associated genes of gastric cancer by genome-wide transcriptional profiling. Curr. Bioinform. 2019, 14, 62–69. [Google Scholar] [CrossRef]
- Li, Y.H.; Li, X.X.; Hong, J.J.; Wang, Y.X.; Fu, J.B.; Yang, H.; Yu, C.Y.; Li, F.C.; Hu, J.; Xue, W.W.; et al. Clinical trials, progression-speed differentiating features and swiftness rule of the innovative targets of first-in-class drugs. Briefings Bioinform. 2020, 21, 649–662. [Google Scholar] [CrossRef] [PubMed]
- Zhang, Z.M.; Tan, J.X.; Wang, F.; Dao, F.Y.; Zhang, Z.Y.; Lin, H. Early diagnosis of hepatocellular carcinoma using machine learning method. Front. Bioeng. Biotechnol. 2020, 8, 254. [Google Scholar] [CrossRef] [PubMed]
- Harris, F.; Dennison, S.R.; Singh, J.; Phoenix, D.A. On the selectivity and efficacy of defense peptides with respect to cancer cells. Med. Res. Rev. 2013, 33, 190–234. [Google Scholar] [CrossRef] [PubMed]
- Özkan, A.; İşgör, S.B.; Şengül, G.; İşgör, Y.G. Benchmarking classification models for cell viability on novel cancer image datasets. Curr. Bioinform. 2019, 14, 108–114. [Google Scholar] [CrossRef]
- Wang, Y.; Zhang, S.; Li, F.; Zhou, Y.; Zhang, Y.; Wang, Z.; Zhang, R.; Zhu, J.; Ren, Y.; Tan, Y.; et al. Therapeutic target database 2020: Enriched resource for facilitating research and early development of targeted therapeutics. Nucleic Acids Res. 2020, 48, D1031–D1041. [Google Scholar] [CrossRef] [PubMed]
- Yin, J.; Sun, W.; Li, F.; Hong, J.; Li, X.; Zhou, Y.; Lu, Y.; Liu, M.; Zhang, X.; Chen, N.; et al. VARIDT 1.0: Variability of drug transporter database. Nucleic Acids Res. 2020, 48, D1042–D1050. [Google Scholar] [CrossRef]
- Vlieghe, P.; Lisowski, V.; Martinez, J.; Khrestchatisky, M. Synthetic therapeutic peptides: Science and market. Drug Discov. Today 2010, 15, 40–56. [Google Scholar] [CrossRef]
- Thundimadathil, J. Cancer treatment using peptides: Current therapies and future prospects. J. Amino Acids 2012, 2012, 967347. [Google Scholar] [CrossRef]
- Gaspar, D.; Veiga, A.S.; Castanho, M.A. From antimicrobial to anticancer peptides. A review. Front. Microbiol. 2013, 4, 294. [Google Scholar] [CrossRef]
- Yan, M.; Liu, Q. Differentiation therapy: A promising strategy for cancer treatment. Chin. J. Cancer 2016, 35, 1–3. [Google Scholar] [CrossRef]
- Mader, J.S.; Hoskin, D.W. Cationic antimicrobial peptides as novel cytotoxic agents for cancer treatment. Expert Opin. Investig. Drugs 2006, 15, 933–946. [Google Scholar] [CrossRef]
- J Boohaker, R.; W Lee, M.; Vishnubhotla, P.; LM Perez, J.; R Khaled, A. The use of therapeutic peptides to target and to kill cancer cells. Curr. Med. Chem. 2012, 19, 3794–3804. [Google Scholar] [CrossRef]
- Hoskin, D.W.; Ramamoorthy, A. Studies on anticancer activities of antimicrobial peptides. Biochim. Biophys. Acta (BBA) Biomembr. 2008, 1778, 357–375. [Google Scholar] [CrossRef]
- Zou, Q.; Qu, K.; Luo, Y.; Yin, D.; Ju, Y.; Tang, H. Predicting diabetes mellitus with machine learning techniques. Front. Genet. 2018, 9, 515. [Google Scholar] [CrossRef]
- Khan, S. Machine Learning Approaches for the Prediction of Protein Sequences. Master’s Thesis, Karachi Institute of Economics and Technology, Karachi, Pakistan, 2015. [Google Scholar]
- Khan, S.; Naseem, I.; Togneri, R.; Bennamoun, M. RAFP-Pred: Robust Prediction of Antifreeze Proteins using Localized Analysis of n-Peptide Compositions. IEEE/ACM Trans. Comput. Biol. Bioinform. 2018, 15, 244–250. [Google Scholar] [CrossRef]
- Zou, Q. Latest machine learning techniques for biomedicine and bioinformatics. Curr. Bioinform. 2019, 14, 176–177. [Google Scholar] [CrossRef]
- Deng, Y.; Xu, X.; Qiu, Y.; Xia, J.; Zhang, W.; Liu, S. A multimodal deep learning framework for predicting drug–drug interaction events. Bioinformatics 2020, 36, 4316–4322. [Google Scholar] [CrossRef]
- Huang, F.; Yue, X.; Xiong, Z.; Yu, Z.; Liu, S.; Zhang, W. Tensor decomposition with relational constraints for predicting multiple types of microRNA-disease associations. Briefings Bioinform. 2021, 22, bbaa140. [Google Scholar] [CrossRef]
- Tyagi, A.; Kapoor, P.; Kumar, R.; Chaudhary, K.; Gautam, A.; Raghava, G. In silico models for designing and discovering novel anticancer peptides. Sci. Rep. 2013, 3, 1–8. [Google Scholar] [CrossRef]
- Hajisharifi, Z.; Piryaiee, M.; Beigi, M.M.; Behbahani, M.; Mohabatkar, H. Predicting anticancer peptides with Chou’s pseudo amino acid composition and investigating their mutagenicity via Ames test. J. Theor. Biol. 2014, 341, 34–40. [Google Scholar] [CrossRef]
- Chen, W.; Ding, H.; Feng, P.; Lin, H.; Chou, K.C. iACP: A sequence-based tool for identifying anticancer peptides. Oncotarget 2016, 7, 16895. [Google Scholar] [CrossRef]
- Li, F.M.; Wang, X.Q. Identifying anticancer peptides by using improved hybrid compositions. Sci. Rep. 2016, 6, 33910. [Google Scholar] [CrossRef]
- Wei, L.; Zhou, C.; Chen, H.; Song, J.; Su, R. ACPred-FL: A sequence-based predictor using effective feature representation to improve the prediction of anti-cancer peptides. Bioinformatics 2018, 34, 4007–4016. [Google Scholar] [CrossRef]
- Xu, L.; Liang, G.; Wang, L.; Liao, C. A novel hybrid sequence-based model for identifying anticancer peptides. Genes 2018, 9, 158. [Google Scholar] [CrossRef]
- Ge, L.; Liu, J.; Zhang, Y.; Dehmer, M. Identifying anticancer peptides by using a generalized chaos game representation. J. Math. Biol. 2019, 78, 441–463. [Google Scholar] [CrossRef]
- Yu, L.; Jing, R.; Liu, F.; Luo, J.; Li, Y. DeepACP: A novel computational approach for accurate identification of anticancer peptides by deep learning algorithm. Mol. Ther. Nucleic Acids 2020, 22, 862–870. [Google Scholar] [CrossRef]
- Tyagi, A.; Tuknait, A.; Anand, P.; Gupta, S.; Sharma, M.; Mathur, D.; Joshi, A.; Singh, S.; Gautam, A.; Raghava, G.P. CancerPPD: A database of anticancer peptides and proteins. Nucleic Acids Res. 2015, 43, D837–D843. [Google Scholar] [CrossRef]
- Bengio, Y.; Courville, A.; Vincent, P. Representation learning: A review and new perspectives. IEEE Trans. Pattern Anal. Mach. Intell. 2013, 35, 1798–1828. [Google Scholar] [CrossRef]
- Butepage, J.; Black, M.J.; Kragic, D.; Kjellstrom, H. Deep representation learning for human motion prediction and classification. In Proceedings of the IEEE Conference on Computer Vision and Pattern Recognition, Honolulu, HI, USA, 21–26 July 2017; pp. 6158–6166. [Google Scholar]
- Bengio, Y. Deep learning of representations for unsupervised and transfer learning. In Proceedings of the ICML Workshop on Unsupervised and Transfer Learning. JMLR Workshop and Conference Proceedings, Bellevue, DC, USA, 2 July 2012; pp. 17–36. [Google Scholar]
- Nambiar, A.; Heflin, M.; Liu, S.; Maslov, S.; Hopkins, M.; Ritz, A. Transforming the language of life: Transformer neural networks for protein prediction tasks. In Proceedings of the 11th ACM International Conference on Bioinformatics, Computational Biology and Health Informatics, Virtual, 21–24 September 2020; pp. 1–8. [Google Scholar]
- Alley, E.C.; Khimulya, G.; Biswas, S.; AlQuraishi, M.; Church, G.M. Unified rational protein engineering with sequence-based deep representation learning. Nat. Methods 2019, 16, 1315–1322. [Google Scholar] [CrossRef]
- Liu, B.; Gao, X.; Zhang, H. BioSeq-Analysis2.0: An updated platform for analyzing DNA, RNA and protein sequences at sequence level and residue level based on machine learning approaches. Nucleic Acids Res. 2019, 47, e127. [Google Scholar] [CrossRef]
- Hong, Z.; Zeng, X.; Wei, L.; Liu, X. Identifying enhancer–promoter interactions with neural network based on pre-trained DNA vectors and attention mechanism. Bioinformatics 2020, 36, 1037–1043. [Google Scholar] [CrossRef]
- Zou, Q.; Chen, L.; Huang, T.; Zhang, Z.; Xu, Y. Machine learning and graph analytics in computational biomedicine. Artif. Intell. Med. 2017, 83, 1. [Google Scholar] [CrossRef]
- Xu, Y.; Wang, Y.; Luo, J.; Zhao, W.; Zhou, X. Deep learning of the splicing (epi) genetic code reveals a novel candidate mechanism linking histone modifications to ESC fate decision. Nucleic Acids Res. 2017, 45, 12100–12112. [Google Scholar] [CrossRef]
- Han, J.; Han, X.; Kong, Q.; Cheng, L. psSubpathway: A software package for flexible identification of phenotype-specific subpathways in cancer progression. Bioinformatics 2020, 36, 2303–2305. [Google Scholar] [CrossRef]
- Zhao, T.; Hu, Y.; Peng, J.; Cheng, L. DeepLGP: A novel deep learning method for prioritizing lncRNA target genes. Bioinformatics 2020, 36, 4466–4472. [Google Scholar] [CrossRef]
- Ofer, D.; Linial, M. ProFET: Feature engineering captures high-level protein functions. Bioinformatics 2015, 31, 3429–3436. [Google Scholar] [CrossRef]
- Madani, A.; McCann, B.; Naik, N.; Keskar, N.S.; Anand, N.; Eguchi, R.R.; Huang, P.S.; Socher, R. Progen: Language modeling for protein generation. arXiv 2020, arXiv:2004.03497. [Google Scholar]
- Strodthoff, N.; Wagner, P.; Wenzel, M.; Samek, W. UDSMProt: Universal deep sequence models for protein classification. Bioinformatics 2020, 36, 2401–2409. [Google Scholar] [CrossRef]
- Cui, F.; Zhang, Z.; Zou, Q. Sequence representation approaches for sequence-based protein prediction tasks that use deep learning. Briefings Funct. Genom. 2021, 20, 61–73. [Google Scholar] [CrossRef]
- Barbero-Aparicio, J.A.; Olivares-Gil, A.; Rodríguez, J.J.; García-Osorio, C.; Díez-Pastor, J.F. Addressing data scarcity in protein fitness landscape analysis: A study on semi-supervised and deep transfer learning techniques. Inf. Fusion 2024, 102, 102035. [Google Scholar] [CrossRef]
- Chen, X.g.; Zhang, W.; Yang, X.; Li, C.; Chen, H. ACP-DA: Improving the prediction of anticancer peptides using data augmentation. Front. Genet. 2021, 12, 698477. [Google Scholar] [CrossRef]
- Lv, Z.; Cui, F.; Zou, Q.; Zhang, L.; Xu, L. Anticancer peptides prediction with deep representation learning features. Briefings Bioinform. 2021, 22, bbab008. [Google Scholar] [CrossRef]
- Rao, B.; Zhou, C.; Zhang, G.; Su, R.; Wei, L. ACPred-Fuse: Fusing multi-view information improves the prediction of anticancer peptides. Briefings Bioinform. 2020, 21, 1846–1855. [Google Scholar] [CrossRef]
- Agrawal, P.; Bhagat, D.; Mahalwal, M.; Sharma, N.; Raghava, G.P. AntiCP 2.0: An updated model for predicting anticancer peptides. Briefings Bioinform. 2021, 22, bbaa153. [Google Scholar] [CrossRef]
- Fazal, E.; Ibrahim, M.S.; Park, S.; Naseem, I.; Wahab, A. Anticancer Peptides Classification Using Kernel Sparse Representation Classifier. IEEE Access 2023, 11, 17626–17637. [Google Scholar] [CrossRef]
- Usman, M.; Khan, S.; Park, S.; Wahab, A. AFP-SRC: Identification of antifreeze proteins using sparse representation classifier. Neural Comput. Appl. 2022, 34, 2275–2285. [Google Scholar] [CrossRef]
- Naseem, I.; Khan, S.; Togneri, R.; Bennamoun, M. ECMSRC: A sparse learning approach for the prediction of extracellular matrix proteins. Curr. Bioinform. 2017, 12, 361–368. [Google Scholar] [CrossRef]
- Last, F.; Douzas, G.; Bacao, F. Oversampling for imbalanced learning based on k-means and smote. arXiv 2017, arXiv:1711.00837. [Google Scholar]
- Usman, M.; Khan, S.; Lee, J.A. AFP-LSE: Antifreeze Proteins Prediction Using Latent Space Encoding of Composition of k-Spaced Amino Acid Pairs. Sci. Rep. 2020, 10, 1–13. [Google Scholar] [CrossRef]
- Al-Saggaf, U.M.; Usman, M.; Naseem, I.; Moinuddin, M.; Jiman, A.A.; Alsaggaf, M.U.; Alshoubaki, H.K.; Khan, S. ECM-LSE: Prediction of Extracellular Matrix Proteins using Deep Latent Space Encoding of k-Spaced Amino Acid Pairs. Front. Bioeng. Biotechnol. 2021, 9, 752658. [Google Scholar] [CrossRef]
- Park, S.; Khan, S.; Wahab, A. E3-targetPred: Prediction of E3-Target Proteins Using Deep Latent Space Encoding. arXiv 2020, arXiv:2007.12073. [Google Scholar]
- Usman, M.; Khan, S.; Park, S.; Lee, J.A. AoP-LSE: Antioxidant Proteins Classification Using Deep Latent Space Encoding of Sequence Features. Curr. Issues Mol. Biol. 2021, 43, 1489–1501. [Google Scholar] [CrossRef]
- Yi, H.C.; You, Z.H.; Zhou, X.; Cheng, L.; Li, X.; Jiang, T.H.; Chen, Z.H. ACP-DL: A deep learning long short-term memory model to predict anticancer peptides using high-efficiency feature representation. Mol. Ther. Nucleic Acids 2019, 17, 1–9. [Google Scholar] [CrossRef]
- Chen, Z.; Zhao, P.; Li, F.; Leier, A.; Marquez-Lago, T.T.; Wang, Y.; Webb, G.I.; Smith, A.I.; Daly, R.J.; Chou, K.C.; et al. iFeature: A python package and web server for features extraction and selection from protein and peptide sequences. Bioinformatics 2018, 34, 2499–2502. [Google Scholar] [CrossRef]
- Park, S.; Khan, S.; Moinuddin, M.; Al-Saggaf, U.M. GSSMD: A new standardized effect size measure to improve robustness and interpretability in biological applications. In Proceedings of the 2020 IEEE International Conference on Bioinformatics and Biomedicine (BIBM), Seoul, Republic of Korea, 16–19 December 2020; pp. 1096–1099. [Google Scholar]
- Park, S.; Ibrahim, M.S.; Wahab, A.; Khan, S. GMDM: A generalized multi-dimensional distribution overlap metric for data and model quality evaluation. Digit. Signal Process. 2023, 134, 103930. [Google Scholar] [CrossRef]
- Gisbrecht, A.; Mokbel, B.; Hammer, B. Linear basis-function t-SNE for fast nonlinear dimensionality reduction. In Proceedings of the 2012 International Joint Conference on Neural Networks (IJCNN), Brisbane, Australia, 10–15 June 2012; pp. 1–8. [Google Scholar]
- Ge, R.; Feng, G.; Jing, X.; Zhang, R.; Wang, P.; Wu, Q. EnACP: An ensemble learning model for identification of anticancer peptides. Front. Genet. 2020, 11, 760. [Google Scholar] [CrossRef]
- Vijayakumar, S.; Ptv, L. ACPP: A web server for prediction and design of anti-cancer peptides. Int. J. Pept. Res. Ther. 2015, 21, 99–106. [Google Scholar] [CrossRef]
- Manavalan, B.; Basith, S.; Shin, T.H.; Choi, S.; Kim, M.O.; Lee, G. MLACP: Machine-learning-based prediction of anticancer peptides. Oncotarget 2017, 8, 77121. [Google Scholar] [CrossRef] [PubMed]
- Li, Q.; Zhou, W.; Wang, D.; Wang, S.; Li, Q. Prediction of anticancer peptides using a low-dimensional feature model. Front. Bioeng. Biotechnol. 2020, 8, 892. [Google Scholar] [CrossRef] [PubMed]
- Ahmed, S.; Muhammod, R.; Khan, Z.H.; Adilina, S.; Sharma, A.; Shatabda, S.; Dehzangi, A. ACP-MHCNN: An accurate multi-headed deep-convolutional neural network to predict anticancer peptides. Sci. Rep. 2021, 11, 1–15. [Google Scholar] [CrossRef] [PubMed]

Disclaimer/Publisher’s Note: The statements, opinions and data contained in all publications are solely those of the individual author(s) and contributor(s) and not of MDPI and/or the editor(s). MDPI and/or the editor(s) disclaim responsibility for any injury to people or property resulting from any ideas, methods, instructions or products referred to in the content. |
© 2024 by the author. Licensee MDPI, Basel, Switzerland. This article is an open access article distributed under the terms and conditions of the Creative Commons Attribution (CC BY) license (https://creativecommons.org/licenses/by/4.0/).