Abstract
Roadside Units Deployment (RSUD) is of great importance to smart transportation with the Internet of Things (IoT). It is believed to be not feasible for RSUD to cover and perceive the whole area due to the high installation and maintenance costs. The candidate locations set of RSUD may be huge for a future urban area with vehicle-to-everything (V2X) networks. Most of the previous studies tried to maximize the Roadside Units (RSU) coverage only and made few reports on emergency scenarios, such as accidents happening. We tried to find better candidate locations of RSUD in some grid road networks with equal length streets, and then chose some of these locations for final installation with a given budget to minimize the average reporting time of emergency messages in V2X networks. Firstly, we analyzed candidate locations of RSUD for different cases of RSUs and vehicles. Then we proposed a message dissemination model for RSUD with the V2X network, and a center-rule-based neighborhood search algorithm (CNSA for short). In this algorithm, we generated initial solutions with the center rule and then obtained better neighbor solutions. Numerical simulation results from small-scale urban streets showed that the proposed algorithm performs well on execution time. Simulation results with Veins and Simulation of Urban Mobility) (SUMO) verified the proposed model and CNSA for evaluating the RSUD scheme by distance instead of accident reporting time in urban areas with large-scale traffic flow.
1. Introduction
The shortage of traffic infrastructures with the Internet of Things (IoT) and the growing number of vehicles are important reasons for traffic congestion, which has increased travel time and costs of travelers and even caused crashes [1]. V2X (Vehicle to Everything) refers to a combination of vehicles and IoT technology, which includes Vehicle-to-Vehicle (V2V), Vehicle-to-Infrastructure (V2I), Vehicle-to-Pedestrian (V2P), and Vehicle-to-Network (V2N), namely passing information from a vehicle to any entity that may affect the vehicle, and vice versa. Specifically, V2V communication technology is based on a Vehicular Ad Hoc Network (VANET). VANET, which is a vital part of the intelligent transportation system (ITS), can improve road safety and traffic efficiency using wireless communication technology, meanwhile providing various entertainment service information to enhance drivers’ and passengers’ experience while ensure data confidentiality, reliability, and integrity by the data encryption technique [2,3]. VANET, created by applying the principles of mobile ad hoc network (MANET), enables vehicles to spontaneously create a wireless network and relay messages with optional infrastructure support. An infrastructure independent VANET can be constructed spontaneously by a group of mobile vehicles moving nearby without relying on any infrastructure [4]. This type of VANET easily loses messages due to their intermittent connectivity [5]. Another is infrastructure dependent VANET [4], characterized by robust connectivity of infrastructure, such as Roadside Units (RSUs). In the literature, the term RSU refers to a computing device located on the roadside that provides connectivity support to passing vehicles. As the auxiliary communication devices for VANET, RSUs can cope with dynamic topology changes caused by nodes’ fast movement in VANET and effectively improve nodes’ communication quality.
Furthermore, RSUs’ coverage in the city can ensure the real-time and reliable transmission of emergency traffic information in VANET. So far, RSUs have been used for different roles, such as data distributors, traffic directories, location servers, security managers, and service agents [6]. The number of private cars increases every year, becoming the most common urban transport, and consequently traffic on the road is getting heavier. The belated traffic accident information for targeted drivers may cause traffic congestion or more serious traffic accidents [7]. Based on the 2010–2013 General Estimates System (GES) and Fatality Analysis Reporting System (FARS), there were 3.4 million (62 percent of all police-reported crashes) light-vehicle to light-vehicle (LV2LV) crashes. About 7325 fatalities and 1.8 million Maximum Abbreviated Injury Scale (MAIS) 1–5 injuries were associated with these LV2LV crashes. Furthermore, these crashes damaged 4.7 million vehicles. In total, these LV2LV crashes cost society $319 billion. Lochert et al. [8] indicated the impact of optimal RSUs deployment on the dissemination of safety information. Hence, in this paper we focus on disseminating emergency traffic information. Namely, we deploy RSUs in an urban area of our interest to spread emergency traffic messages among vehicles. We assumed that vehicles were connected and were automated vehicles (CAVs) with on-board units (OBUs), cameras, radars, Global Position System (GPS), and so on.
In this paper, we aimed to find RSUs candidate locations and chose some of these locations for final installation with the given budget, minimizing the average reporting time of emergency messages. For the above purpose, we made candidate location analysis of RSUD for different cases with or without RSUs and vehicles. Previous studies did not take I2I communication code into consideration. We considered a V2X framework with three communication codes (V2V, V2I, and I2I) to disseminate emergency messages. We modeled the RSUD problem with the V2X network as the message dissemination RSUD model. By transforming the time problem into the distance problem, we proposed the center-rule-base neighborhood search algorithm for the problem.
The rest of the paper is organized as follows. Related work is discussed in Section 2. In Section 3, we mathematically analyze the impact of RSUs’ candidate locations on message dissemination. The RSUD problem is formulated in Section 4, along with a center-rule-base neighborhood search algorithm for it. The simulation results and discussions are shown in Section 5. Finally, this paper is concluded in Section 6.
2. Related Work
In this section, we show some state-of-the-art studies about objectives, categories, and approaches of RSUD.
A lot of factors are considered by scholars and researchers about RSUs Deployment (RSUD) problem. According to the study in the U.S. Department of Transportation in 2011, a simplistic RSU requires $13,000–$15,000 per unit capital cost and up to $2400 per unit per year for operation and maintenance [9]. Obviously, it could be costly to seamlessly cover the whole area of our interest. Besides high installation and maintenance costs, there are the following difficulties: (1) the RSU candidate deployment locations set may be huge. The area of our interest could be a vast metropolitan such that it is hard to select optimal RSU deployment locations. Some researchers reduced the solution search space size by segmenting the street into segments or partitioning the area into some grids. Zhu et al. [10] segmented the streets and mathematically modeled the RD problem as a c street model, transforming the area coverage problem into the street coverage problem. Wu et al. [11] also partitioned the road into equal-length segments according to the communication range of the RSU and selectively deployed RSUs in the middle of road segments. Kim et al. [4] assumed the shape of the map of a metropolitan area is a rectangle and partitioned the map into regular squares whose height and width are (r represents the communication range of RSUs). RSUs are deployed in the center of these grid squares. Some researchers initially considered those locations with special characteristics in terms of traffic or communication as candidate points to deploy RSUs. Frasi et al. [12] targeted to deploy RSUs on road parts with the highest vehicle density. They inputted these candidate road parts into the formulated nonlinear integer programming problem with given RSU budget and used the exhaustive method for this problem. Some articles chose intersections as RSU candidate locations [13,14]. However, they did not tell the reasons in detail. (2) Some other factors also affect the RSUD problem. In [15], curve-shaped roads, a number of lanes, and nonuniform traffic statistics were taken into consideration by Gao et al. They also considered some different RSUs with different radii in the RSUD problem [16]. Yang et al. [17] considered a delay-bounded and cost-limited RSUD problem. They aimed at deploying RSUs with the given budget to maximize segment coverage to relay data to RSUs before (representing the bounded delay for data transmission). Merha et al. [5] proposed a two-step technique to find optimal RSUs’ locations based on network connectivity. They first chose those road segments with low connectivity probability as RSUs candidate locations. Then, they considered both the application delay and the deployment cost for final installation. The information was relayed via V2V communication in segments with high connectivity probability. Motivated by this consideration, we proposed a well-balanced combination of three communication codes, V2V, V2I, and Infrastructure and Infrastructure (I2I).
RSUD can be classified into two categories: fixed RSUD and mobile RSUD [4]. Recently, the studies on RSUD problem have been booming, where RSUs were fixed at some particular locations. Nevertheless, the RSUD problem models in these studies are different in terms of optimization objectives, constraints, scenarios, and adopted methods. The performance indicators of a RSUD schema are different, including area coverage [10,15,16], communication coverage [6,18], the number of RSUs [17], installation and maintenance costs [11,19], accident notification time [14,20,21]. Most papers modeled the RSUD problem as the coverage optimization problem to cover the area or vehicles. They did not indicate the purpose of deploying RSUs, namely the function of RSUs. Unlike these papers, Mershad et al. [6] used RSUs to route packets between any source and destination. Furthermore, as we did, Aslam et al. [14] and Barrachina et al. [20] indicated that RSUs, as data distributors, help disseminate warning messages or traffic/road conditions. Some researchers fixed RSUs in some mobile objects, namely mobile RSUs, helping to broadcast messages [22,23,24]. Zhang et al. [22] proposed a multi-modal VANET message dissemination scheme in which buses relayed the message among taxis. They took full advantage of the area coverage characteristics of taxis and the regularity of buses, reducing end-to-end delay. Lan et al. [23] used public vehicles as data mules to monitor traffic in VANET. Kim et al. [4] proposed a joint deployment framework of fixed RSUs, mobile RSUs on public vehicles, and those on full controllable vehicles. However, in this paper, we deployed fixed RSUs to disseminate the emergency message without considering mobile RSUs due to time uncertainty of the emergency message.
Algorithms proposed by researchers are various, mainly including approximation algorithms, greedy algorithms, and genetic algorithms, which aim at maximizing coverage. Kim et al. [4] considered three types of RSUs, as we mentioned before, and proposed a polynomial running time approximation algorithm. They mainly used the greedy strategy and proved it could be done in polynomial time by using dynamic programming and a smart node weight reassignment procedure. Zhu et al. [10] first proposed a greedy-based polynomial (GBP) time approximation algorithm for c street model to achieve maximum coverage of the area. Then, they introduced a shifting strategy-based polynomial-time approximation scheme for the designed more realistic model, namely the Complex Urban Environment (Cue) model. Gao et al. [15] proposed two greedy-based algorithms (Greedy2P3 and Greedy2P3E) for a one-dimensional RSUD (D1RD) problem (the road network is just a straight line) with multiple different RSUs or several identical RSUs. They also proposed the OptGreDyn algorithm by exploiting the properties of the D1RD problem based on greedy strategy and dynamic programming. In [16], they continued their work considering nonuniform profit density and proposed the Dynamic Limiting (DynLim) technique, which reduced the solution search space size by adjusting search space limits dynamically. Fogue et al. [21] exploited the genetic algorithm to reduce the warning notification time. Mehar et al. [5] combined two algorithms (genetic algorithm and Dijkstra algorithm) to select the best RSU locations. It is worth mentioning that they created a new chromosome by using the Gaussian mutation [25]. Aslam et al. [14] proposed two methods: an analytical Binary Integer Programming (BIP) method and a novel Balloon Expansion Heuristic (BEH) method. The former adopted branch and bound approach and the latter utilized a balloon expansion analogy to deploy RSUs for traffic accident information dissemination. Barrachina et al. [20] presented a Density-based Roadside Unit deployment policy (D-RSU) to alert emergency information. They indicated that more resources must be deployed in areas characterized by low traffic density, and less RSUs in areas with a high density of vehicles.
3. Candidate Location Analysis of RSUD
In this section, we mathematically analyze the impact of RSUs candidate locations on emergency information dissemination. Then we conclude that in an urban area with high traffic density or in a region with low traffic density and less RSUs, placing RSUs along roadsides (non-intersections) to disseminate emergency information would be a waste of resources.
We assumed that RSUs have been installed at intersections due to higher traffic density, and information can be propagated in all directions. Hence, we decided to deploy RSUs along the road starting at the intersection. As shown in Figure 1, the road network consists of four two-way lanes with IDs 1, 2, 3, and 4, respectively. Let R be the communication range of RSUs. We partitioned the road into several segments with 2R length starting at the intersection, and each segment is named a Cell. Taking the road with ID 1 as an example, each Cell is numbered from 0 to K in the east direction in Figure 1, such that the first Cell (at the intersection) is numbered 0. Taking the ID information of the road into consideration, we use to represent the first Cell. We selectively fixed RSU at the center of each Cell and denote by the RSU at the first Cell following the denotation of the Cell.
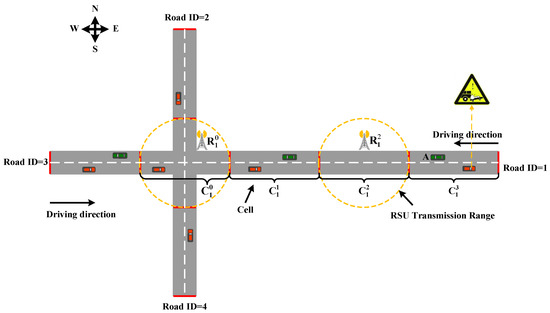
Figure 1.
The road Cell.
A crash occurred on at the time , which leads to a traffic jam heading east, is shown in Figure 1. For simplicity, we assume that all vehicles travel at a constant speed. The passing car A will relay the data packet including road ID, traffic conditions, and the duration D to other vehicles within its vicinity. When receives this message, it will disseminate the data packet in all directions, helping vehicles heading to its destination passing by road with ID 1 to reroute. The road sequence of the packet dissemination is: . We will discuss the process of message dissemination in the case of RSUs (in Section 3.1) and no RSUs (in Section 3.2) in Cells, respectively.
3.1. One RSU in
The communication link between car A and is short such that the propagation delay is not taken into consideration. When the car A runs into the communication range of , it will transmit the message to . The transmission time t is:
where L represents the size of the packet and represents the transmission rate of data. Instead of taking more details about transmission delay model into consideration, we consider that the communication is almost instantaneous in this study. The transmission time in (1) is negligible. We will discuss whether there are vehicles running in or not.
3.1.1. No vehicles in
Car B running in the same direction as car A in , whether there is a RSU or not in .
As shown in Figure 2, can’t relay the packet to car B, because car B is not in the communication range of . There are no vehicles in , but we hope that the data packet can be transmitted from A before car A runs into ; the data packet needs to be sent to car B during the time :
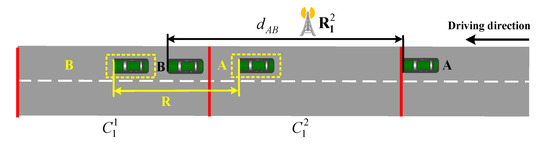
Figure 2.
Car B is running in the same direction as car A in .
From (3) to (5), we can obtain a limit on the speed of car B and the distance between A and B denoted by .
Based on (4), we can conclude that car B may be slowing down or stopping at the front of the traffic light. Formula (5) represents the distance limit of the distance between A and B, and we deduced that should be less than or equal to 3R according to the maximum speed of car B which should be greater than or equal to zero. In other words, car B can receive the packet only if it is in the first half of in the driving direction and its speed meets Equation (4). Otherwise, if the speed of car B is the same as car A, the packet will be relayed to when car A runs into .
• Car B is running in the opposite direction to car A in , whether there is a RSU or not in .
As shown in Figure 3, there is no car in the same direction as Car A in the first half of in the driving direction. If car B arrives before time , it can receive the message from . Then the packet can be relayed by car B to on the premise that continuous vehicles are heading in the same direction as B, or there is a car D that runs in the same direction as A on the road ahead. Then we can obtain the following:
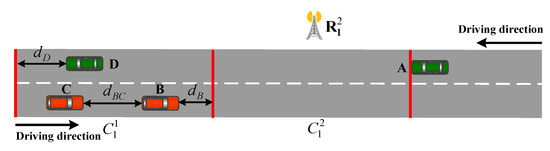
Figure 3.
Car B is running in the opposite direction to car A in .
If car B and car C have the same speed as car A, the distance between car B and should be less than 2R. We assume that time meets (6), so car B needs car C as a data repeater to transmit the packet to car D, as shown in Figure 4. Because there is no car in the same direction as Car A in the first half of in the driving direction, once car B runs into , the packet can’t be transmitted from B to D due to the limit on the communication range even if car D stops in the second half of . Thus, we need car C as a data repeater and require that the distance between B and C is less than R. We assume that B and C run at the same speed as shown in Figure 4.
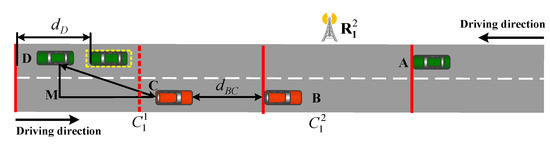
Figure 4.
Car B is running into after time .
Let be the coordinate of car C, be the coordinate of car D, be the speed of car C, be the speed of car D, so the distance between C and M denoted by can be expressed by , and the distance between M and D denoted by can be expressed by . Next, we can obtain the limits on the speed and distance of car D:
If the speed of car B is not negative, then we can obtain the following inequality,
where is negligible, and if there is a limit on the distance between B and C (), then we can obtain the speed limit of car D:
Thus, it can be seen that there must be a car D running in the same direction as A in the second half of relying on car B and car C. (11) indicates the speed limits of car D. If continuous vehicles are running on the road in the same direction as car B, the data packet can be relayed to without the help of car D. If the traffic flow in the same direction as B is interrupted, but there are vehicles in the same direction as A in some Cells, the data packet can be transmitted to these vehicles. If there are no cars on the road ahead, the dissemination of accident information needs regular broadcasts of car A. Hence RSUs fixed at the road with high traffic or low traffic didn’t work.
• No vehicles in , whether there is a RSU or not in .
In this case, the transmission of accident information from car A to at least takes . RSUs fixed at the road ahead do not play a role in ITS if the conditions of both cases above cannot be met.
3.1.2. Vehicles in
• Car B is running in the same direction as car A in .
can transmit the data packet to car B (nearest to ). The whole process spent time 2t (see Equation (1)).
• Car B is running in the opposite direction to car A in .
This case is the same as the second case in Section 3.1.1.
3.2. No RSU in
3.2.1. No vehicles in
• Car B running in the same direction as car A in , whether there is a RSU or not in .
As shown in Figure 5a, this case is the same as the first case in Section 3.1.1.
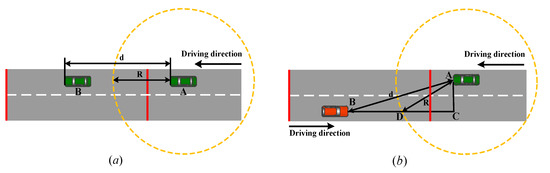
Figure 5.
Car B is running in : (a) Car B is running in the same direction as car A; (b) Car B is running in the opposite direction to A.
• Car B is running in the opposite direction to car A in , whether there is a RSU or not in .
Assumptions we made in this case are the same as the second case in Section 3.1.1, namely continuous vehicles running in the same direction as car B or there is a car running in the direction as car A on the road ahead. Let be the coordinate of car A, be the coordinate of car B as show in Figure 5b, so the distance between C and B denoted by can be expressed by , and the distance between C and D denoted by can be expressed by . Then we can obtain the time as follows:
• No vehicles in , whether there is a RSU or not in .
This case is the same as the third case in Section 3.1.1.
Taking three cases in Section 3.1.1 and these three cases above into consideration, we can conclude that the RSUs fixed at roadsides in a region with low traffic density do not work, or they can only work if some extreme conditions are met.
3.2.2. Vehicles in
• Car B is in the communication coverage of car A.
The time spent by the transmission from A to B is t.
• Car B is not in the communication coverage of car A, and it is running in the same direction as car A in .
If , car A cannot transmit the data packet to car B due to the communication range. In this case, car A will continue to move forward and receive periodic beacons from vehicles to sense these vehicles within its vicinity. A beacon may contain the position, speed, direction, and timestamp of a vehicle.
If , car A can run into the communication coverage of car B at time .
• Car B is not in the communication coverage of car A, and it is running in the opposite direction to car A in .
This case is the same as the second case in Section 3.1.1.
In both cases in Section 3.1.2 and these three cases above, RSUs are not needed as data repeaters to work when there is high vehicle traffic. V2V communication can meet the needs of the dissemination of accident information.
It can be seen that deploying RSUs along roadsides has a great relationship with traffic density.
Let R = 250 m, V be the speed of the vehicle. De represents the vehicle density as shown in Figure 6.
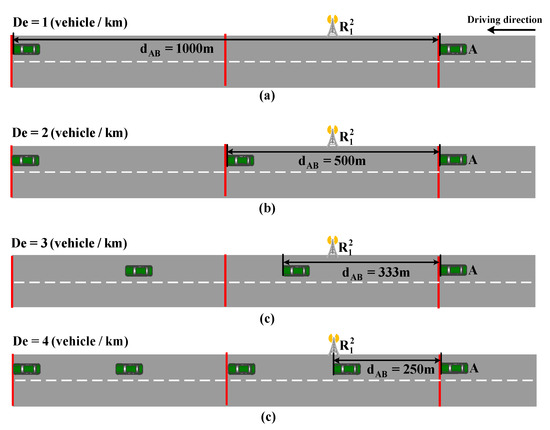
Figure 6.
Vehicle distribution considering different vehicle densities: (a) De = 1; (b) De = 2; (c) De = 3; (d) De = 4.
(a) De = 1, the space headway is 1000 m, so does not work as an information repeater in helping to transmit the packet.
(b) De = 2, and space headway is 500 m, can transmit the packet to the vehicle ahead of car A, which reduces time t = 2R/V.
(c) De = 3, the space headway is 333 m, can transmit the packet to the vehicle ahead of car A, which reduces time t = 333/V.
(d) De = 4, the space headway is 250 m, the data packet can be transmitted directly with V2V communication.
RSUs are not required to be deployed when the vehicle density De = 1 and . Because the vehicle density in urban areas is almost 20 vehicles/km regardless of peak or off-peak in Xi’an city, China, we only considered fixing RSUs at intersections due to higher traffic density, and information can be propagated in all directions.
4. Model and Algorithm
Based on the analysis in Section 2, we considered deploying RSUs at intersections to help disseminate information. We assume that all RSUs are connected via a backbone network, just as Merha et al. did in [3] and Chen et al. did in [5], which can relay up-to-date information from one RSU to some RSUs in distant regions in a very short time. RSUs work together to coordinate actions and to exchange or process various types of information.
The scenario is shown in Figure 7. Once an accident occurs, a passing car will relay this accident information (street name/conditions, accident duration) to other vehicles in the communication coverage area of the car. When other vehicles receive the information, they also relay this information. When some vehicles with received information run into the communication coverage area of one RSU, they will relay this information to the RSU. This RSU will relay the information to other RSUs in a short time. This information is then disseminated via all connected RSUs so that other cars may use it for improved route planning. We model the RSUD problem with V2X network as the message dissemination RSUD model and propose the center-rule-base neighborhood search algorithm for it.
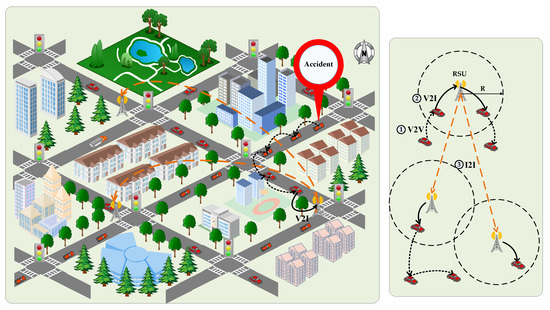
Figure 7.
The emergency information dissemination scenario.
4.1. The Proposed Information Dissemination RSUD Model
The street layout of the urban area of our interest is modeled by a perfect grid , which consists of X vertical roads intersected with X horizontal roads. The grid street pattern is very common in many cities, such as Xi’an and Beijing, China. The set represents a collection of points and represents a collection of edges. Let be the weight set of the corresponding set of vertices V. The two vertices of one edge can also be denoted by and , and this edge can be denoted by . Let () be the probability of accidents happening on (), be the weight of the vertice , it equals the sum of accident probability of four edges associated with , namely . The decision variable represents whether a RSU is fixed or not at intersection .
As shown in Figure 8, we assume that an accident occurred on the accident-prone road and the RSU is fixed at in , RSU is fixed at in . A passing car on will relay the data packet including road ID, traffic conditions, and the duration D to other vehicles within its vicinity. Let be the time when received the packet, be the time when received the packet. is less than without considering exceptional cases. When receives the packet, it will disseminate this information to other RSUs via a backbone network. Hence, if an accident occurred on one road, the accident information only needs to be transmitted to the nearest RSU. The objective of this paper is to choose some intersections to deploy RSUs with the given budget, minimizing the average reporting time of emergency messages in the road network of our interest.
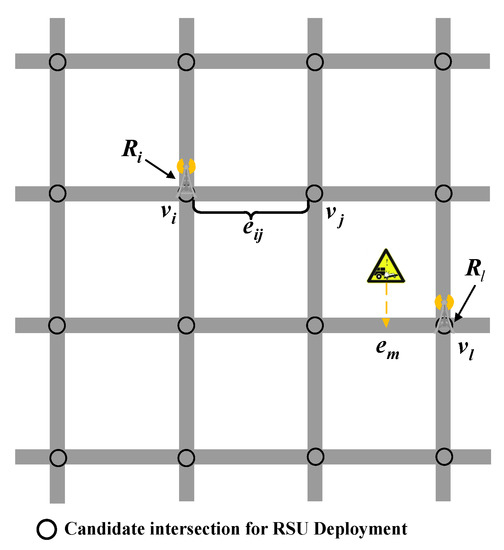
Figure 8.
Grid-like urban street.
Other notations used are summarized in Table 1.

Table 1.
Notations and descriptions for the model.
Our RSUD problem can be formulated as follows:
in (14) represents the time that the accident information on is transmitted to the nearest RSU. in (15) indicates our objective of this paper and the second constraint represents that the RSU deployment cost cannot exceed the total budget.
This RSUD problem is a combinatorial optimization problem. If we deploy T RSUs at S intersections, we can get deployment strategies. If we assume that there are 20 RSUs to be selectively fixed at 100 intersections, we need to evaluate strategies. Obviously, it is not feasible to evaluate and compare all the strategies. Obtaining the optimal subset of the RSU locations is actually a difficult optimization problem.
The vehicle density is high enough to enable V2V communication to be carried out continuously, so we can transform the time problem into the distance problem. We assume that X vertical roads are intersected with X horizontal roads with equal length and one RSU is fixed at the (M, N) intersection. Let be the distance matrix of the RSU fixed at the (M, N) intersection and its size is , then assign from row 2M, column 2N with 1, 2, 3, etc. represents the distance between each road and the RSU fixed at the (M, N) intersection like a diamond shape with (M, N) as the center. For example, there are 6 × 6 intersections as shown in Figure 9 and a RSU is deployed at the (3, 4) intersection. The distance matrix is obtained as follows:
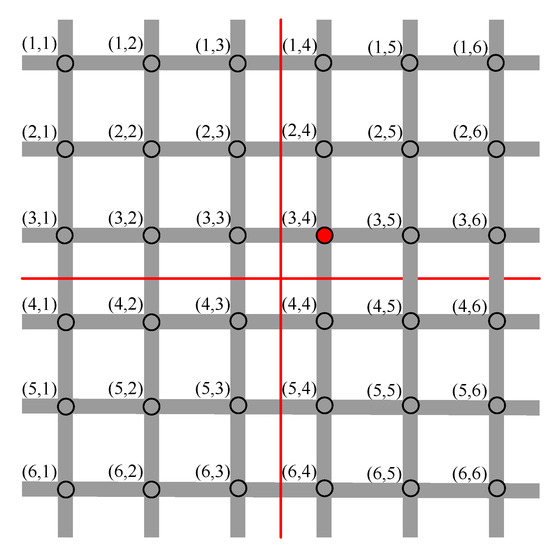
Figure 9.
Road network with six vertical roads intersected with six horizontal roads.
For calculation convenience, let () be the number of accidents happening on () to replace (). The size of the accident matrix is the same as as follows:
However, the distance matrix changes due to the RSU combination deployment. We have to calculate the degressive distance matrix with the same size as . “Degressive” means that the distance of one road will be reduced due to an additional RSU in its vicinity. For example, if K RSUs are fixed at some intersections, we first calculate the distance matrix of each RSU respectively, then we put the minimum value of each row and each column of these into the corresponding position of the degressive distance matrix . The pseudocode is as following Algorithm 1 shows:
| Algorithm 1 Pseudocode for obtaining |
| Input: the of K Output: for i in range(2 × X + 1): | for j in range(2 × X + 1): | | = | | index = 0 | | for k in range(1,K): | | | if then | | | | ; | | | | ; | | | end | | end | | | end end return |
Now, for one RSU deployment problem, our objective is to find the minimum value of . For multiple RSUs deployment problems, we need to find a RSU deployment combination to minimize the outcome of .
4.2. The Proposed Center-Rule-Based Neighborhood Search Algorithm (CNSA)
Based on the model in Section 3.1, we first consider the full RSUs coverage problem. For X × X intersections, the solution of RSUD problem is definitive when deploying greater than or equal to X × X/2 RSUs. We can deploy at most X × X/2 + (X − 2)/2 × 4 + 2 RSUs at some of these intersections. For example, the locations of 18 RSUs at 6 × 6 intersections are as shown in Figure 10a, or the figure when we rotate it 90 degrees. If one more is deployed, we can choose these locations at the figure edge such as (6, 1), (1, 6), (1, 2), (1, 4), (2, 1) and so on according to the accident probability of the road associated with these locations. If we deploy one RSU at (6, 1), two roads will be covered. Namely, we need to calculate the sum of the accident probability of two roads associated with (6, 1). In Figure 10a, we can deploy at most (6 − 2)/2 × 4 = 8 RSUs. Or as shown in Figure 10b, if we deploy greater than 32 RSUs at 8 × 8 intersections, we can directly determine these RSUs locations.
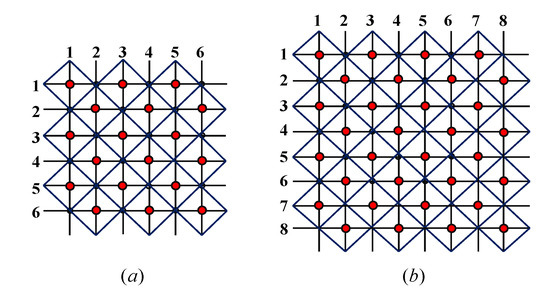
Figure 10.
The full coverage of RSUs: (a) 6 × 6 intersections; (b) 8 × 8 intersections.
Based on the above discussion, we only considered deploying 1~X × X/2 RSUs. Let K be the number of RSUs with a given budget. We generated initial solutions with the center rule, which can be defined as: when K = 1–4, the whole road network is divided using the diagonal line. When K > 4, we divide the road network into equal parts by the horizontal and vertical lines, then assign different numbers of RSUs to each part according to the sum of accident weights of each part. In each part we deploy RSUs using the rules when K = 1–4, which are detailed as follows:
(1) Center rule (K = 1): Take four positions of the grids obtained by the quartering method near the center of the road network as the initial positions, as shown in Figure 9. The four positions are (3, 3), (3, 4), (4, 3), and (4, 4) respectively.
(2) Center rule (K = 2): Divide the road network into two parts from the diagonal line and one RSU will be fixed at each part as shown in the first figure of Figure 11a. Taking the upper part as an example, we first divide the upper part into two sections from the vertical line, and then choose the center point (intersection) of the vertical line as the RSU location. Because the road network is symmetrical, we can get some combinations of positions as shown in the second figure of Figure 11a: ((2, 3), (5, 4)), ((2, 4), (5, 3)), ((3, 2), (4, 5)), ((4, 2), (3, 5)). For the vertical line with odd length, the selected point should be farther away from the diagonal line than the edge. For example, in the first figure of Figure 11b, we will choose the intersection (2, 4) as the initial location, not (3, 4). The reason for the above decision is as follows. As shown in two pictures in the middle of Figure 11b, the number of 3 in the left road network with two RSUs fixed at the intersection (2, 4) and intersection (7, 5) is greater than that in the right road network with two RSUs fixed at the intersection (3, 4) and intersection (6, 5), 34 and 32, respectively. The distance is extended like a diamond, so the more the short distances in the road network, the better. Finally, we can obtain some candidate positions to deploy RSUs as shown in Figure 11b, they are: ((2, 4), (7, 5)), ((2, 5), (7, 4)), ((4, 2), (5, 7)), ((5, 2), (4, 7)).
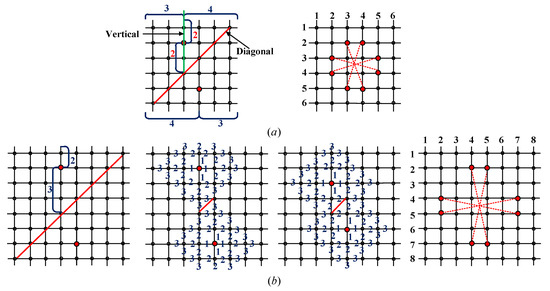
Figure 11.
Center rule (K = 2): (a) 6 × 6 intersections; (b) 8 × 8 intersections.
(3) Center rule (K = 3): The road network is divided into three parts from the diagonal line. The RSU locations selection rule of the upper part is the same as the center rule (K = 2), as shown in Figure 12. We can also obtain four solutions when K = 3.
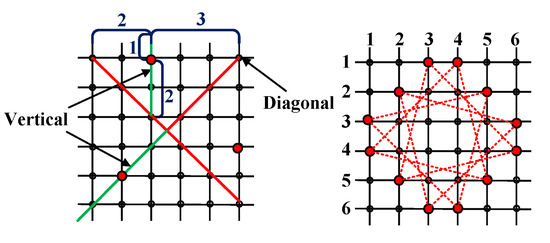
Figure 12.
Center rule (K = 3).
(4) Center rule (K = 4): Choose four positions obtained by center rule (K = 2) as shown in Figure 13.
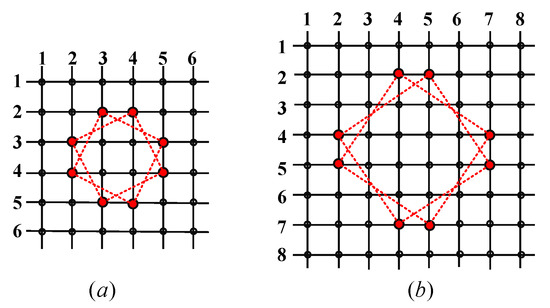
Figure 13.
Center rule (K = 4): (a) 6 × 6 intersections; (b) 8 × 8 intersections.
For the deployment of RSUs, the road network is partitioned into four grids using the quartering method as mentioned in center rule (K = 1). Each grid will be deployed at least one RSU according to the central rule. In Section 3.1, we defined a weight for each intersection , likewise, let be the weight matrix of intersections with the same size as . For example, the weight of the intersection (1, 1) in Figure 9 is . The is shown as follows:
Calculate weights and we can get 2 × 2 as follows:
When deploying five RSUs, we will deploy two RSUs in the grid with the largest . For K = 6, we deploy two RSUs in the two diagonal grids with the largest sum of (), which makes the layout of RSUs symmetrical. When K = 7, we will deploy two RSUs with largest () in another two on the conditions of K = 6, as shown in Figure 14a.
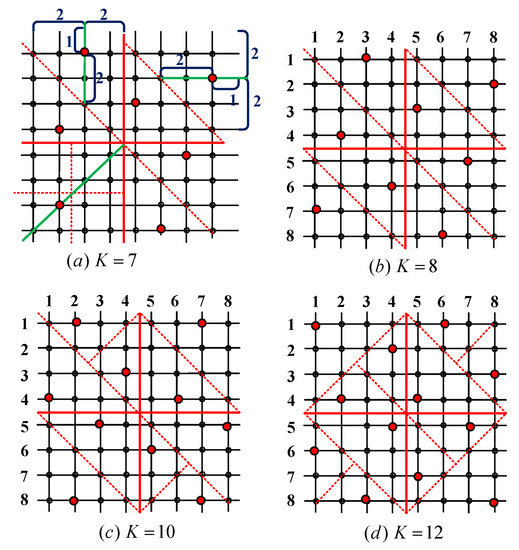
Figure 14.
Center rule (K > 4): (a) K = 7; (b) K = 8; (c) K = 10; (d) K = 12.
Let be the set of the neighbors of the initial solutions. The top, bottom, left, and right locations of one position respectively combing the rest of positions in the initial solution that are the neighbors of the initial solution. For S initial solution and K RSUs, there are 4 × S × K neighbors (if the locations exist and are not occupied by other RSUs) of the initial solutions. If the minimum objective function value of the solution in is better than that of the current solutions, then compare the objective function value of this solution and its . Otherwise, the algorithm is terminated. The pseudocode for center-rule-based neighborhood search algorithm is as following Algorithm 2 shows:
| Algorithm 2 Neighborhood Search Algorithm: pseudocode for obtaining the RSUD solution. |
| Input: the initial solutions obtained by using center rule Output: the solution obtained by using our method Search: obtain the of the initial solutions = index = 0 for i in range(1,len()): | if then | | ; | | ; | end end Return Select: obtain the of = index = 0 for i in range(1,len()): | if then | | ; | | ; | end end if then | ; | Repeat ’ Select’ process; end else then | Termination Return |
5. Numerical and Simulated Studies
We tested some cases using python with different and number of intersections, and the results are shown in Table 2. The specifications of the system used for simulation are: Processor—Intel® Core™ i7-4800MQ CPU @ 2.70 GHz, RAM—16 GB, and OS—Windows 7 Enterprise 64-bit. The fourth column of Table 2 represents the ratio of the number of our solutions, which are the same as the best solutions obtained by the exhaustive method to the total number of tests. The fifth column of Table 2 represents the average difference. It is calculated in the following:
Table 2.
The comparison between our solutions and the best solutions.
The average running time of calculating the objective function of one location combination of RSUD is 0.0028 s; however, the time consumed by deploying three RSUs at 10 × 10 intersections using the exhaustive method is h. It will take 13 h to test 100 cases with different accident matrices. The time consumed by deploying 16 RSUs at 12 × 12 intersections using the exhaustive method is h, namely years. In this case, we cannot use the exhaustive method. Hence, we only list some cases that can be calculated in a finite time. As can be seen from Table 1, when only one RSU is deployed and 10,000 cases are tested, the solutions of our method is 100% equal to the best solutions when X = 2, 4, 6, 8. When two RSUs are deployed at 16 × 16 intersections and 100 cases are tested, 80% of the solutions are still equal to the best solution, and the average difference is less than 0.02%. As the scale of the problem increases, the numerical time for deploying three RSUs was large, so only 20 cases were tested for 8 × 8 and 10 × 10 intersections, but 70% were still equal to the optimal solution with an average difference of less than 0.1%.
For 8 × 8 and 12 × 12 intersections, 1–16 RSUs are deployed. The accident matrix used by our CNSA is shown in Figure 15a,b, respectively. We assumed that the distance of each road was 1. It can be seen that the average distance (only one accident happened, namely total distance/the sum of accidents) decreases as the number of RSUs increases in Figure 16. Execution time of our CNSA did not exceed 6 s in the road network with 8 × 8 intersections, and it did not exceed 35 s in the road network with 12 × 12 intersections. Figure 17 showed some RSUD schemes obtained by our CNSA.
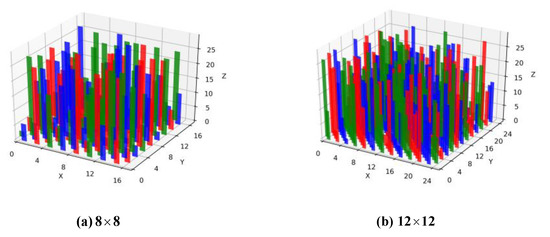
Figure 15.
The accident distribution of the number of accidents on each road: (a) 8 × 8 intersections; (b) 12 × 12 intersections.
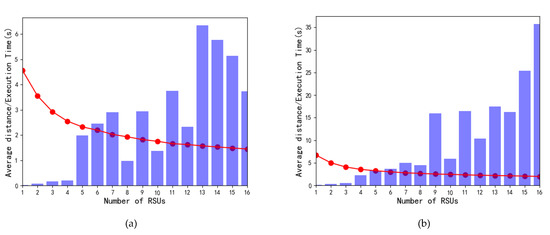
Figure 16.
Distance/execution time (bar) changes over the number of Roadside Units (RSUs): (a) 8 × 8 intersections; (b) 12 × 12 intersections.
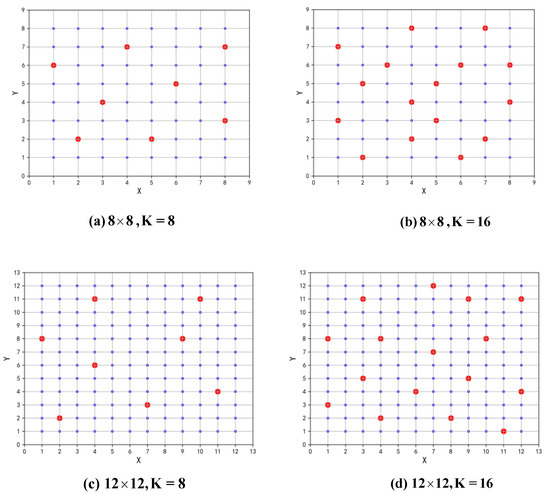
Figure 17.
Roadside Units Deployment (RSUD) schemes obtained by Center-Rule-Based Neighborhood Search Algorithm (CNSA): (a) 8 × 8 intersections, 8 RSUs; (b) 8 × 8 intersections, 16 RSUs; (c) 12 × 12 intersections, 8 RSUs; (d) 12 × 12 intersections, 16 RSUs.
In our simulation, the following factors are considered in the simulation of Internet of Vehicle (IoV):
- (1)
- Traffic simulator: road network, road traffic, trips, and routes.
- (2)
- Network simulator: communication protocol stack.
- (3)
- Bidirectionally coupled network and road traffic simulation.
In this work, we utilize Veins (Vehicles in Network Simulation) simulation framework based on OMNeT++ (Objective Modular Network Testbed in C++) network simulator and SUMO (Simulation of Urban Mobility) traffic simulator to evaluate the rationality of our model and CNSA. Veins is an open-source framework for running vehicular network simulations and supports the simulation of wireless communication protocols in VANETs.
As shown in Figure 18, OMNET++ extracts traffic information (such as road network, traffic lights, and routes) from SUMO by TraCI (Traffic Control Interface). Each vehicle generated by SUMO is modeled as a connected car including three modules (mobility layer, application layer, and network interface card layer) in Veins. Veins also modeled RSU with the same structure as a connected car. Unlike cars, the mobility layer of RSU defines a static mobility pattern (meaning only a position, no movement). Their behaviors defined by application layer are also different. In our simulation, we changed C++ code in the application layer of car and RSU, respectively. We assume that an accident has occurred when a vehicle on a lane stopped for 300 s. The accident vehicle will send a message with lane information to other vehicles or RSUs in the communication range. Once one vehicle receives the message, it will check its route and rearrange another route when its route includes the accident lane and spreads this message only once in the communication range after 5 s plus a random time in (0.01, 0.2). RSU will spread this message after 2 s plus a random time in (0.01, 0.2). We simulated the network with 64 intersections and eight RSUs shown in Figure 17a, and the markers of intersections are shown in Figure 19.
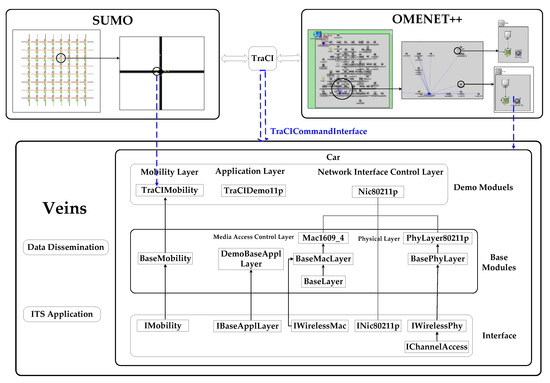
Figure 18.
Framework of Vehicles in Network Simulation (Veins).
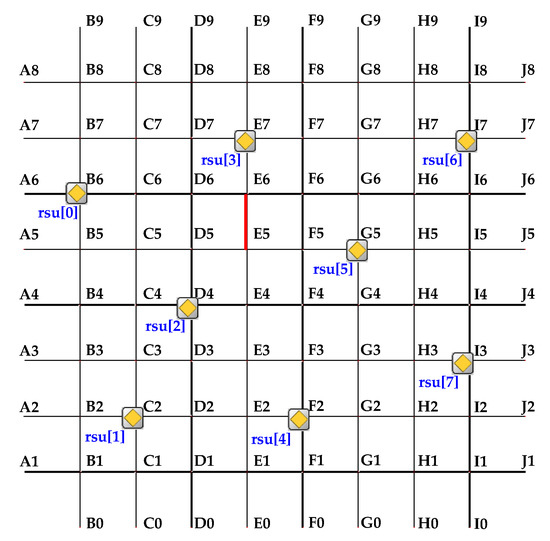
Figure 19.
Road network in Simulation of Urban Mobility (SUMO).
We used two types of vehicles (passenger car and taxi), the difference is that the former has the biggest speed limit of 12 m/s, while the latter has a maximum speed limit of 13.89 m/s. “randomTrips.py” was used to generate a set of random trips for our network. In this procedure, we generated route files with valid vehicle routes by using the option “- - route – file.” This work calls the compiler “DUAROUTER” automatically to turn the random trips into routes. We added three detectors in the network to obtain output data: induction loops detectors (E1), lanearea detectors (E2), and multi-entry-exit detectors (E3). E1 and E2 were placed on each lane, while E3 was placed at each intersection. These detectors have the same frequency of 60 s, namely each detection collects traffic information every 60 s. E1 can collect the total number of vehicles that pass through the detector entirely within the interval, the average speed of these vehicles, the average length of vehicles, etc. E2 can detect the average stop time of vehicles, the average number of vehicles stopped, the length of vehicles in congestion, and so on. The vehicle’s speed threshold is 1.38 m/s when the vehicle is recognized as halting. If the distance between the vehicle and its next standing vehicle is 10 m, this vehicle is described as a participant in a jam. E3 can collect the sum of the vehicles entered.
Other parameters are set as shown in Table 3. The parameter “period” in the table means that SUMO will generate a passenger car with equidistant departure times and period = 0.2. We did so to enable that vehicle density on each road can be 20 vehicles/km at 480 s.
Table 3.
Simulation parameters.
We assumed that a vehicle stopped on lane E6E5 at 200 s and an accident was recognized as happening at 500 s. The duration of the accident was 600 s, and the accident relief at 800 s. Three scenarios were simulated:
- Connected RSUs. The accident vehicle sends the message and all RSUs are connected via a backbone network. This setting indicates that once one RSU receives the message, other RSUs will receive this message in a short time (negligible) even if they are not within the RSU’s communication range.
- Disconnected RSUs. The accident vehicle sends the message and all RSUs are disconnected, namely other RSUs resort to vehicles within its communication range to receive this message.
- No message. The accident vehicle does not send a message. Messages are blocked on the accident lane.
In our simulation, rsu [3] received the message at 514.10 s and sent this message at 516.12 s. Of all the RSUs, the lane E6E5 is closest to rus [3], which indicates that it is reasonable to evaluate RSUD scheme using our CNSA by distance instead of accident reporting time. Other RSUs sent the message after 2 s plus a random time in (0.01, 0.2) and specific time in different scenarios is shown in Table 4. It can be seen in Figure 20 that all RSUs have already sent the message once when the simulation time is 519 s (The vehicle icon turns green when it receives the message).
Table 4.
RSU starts sending the message.
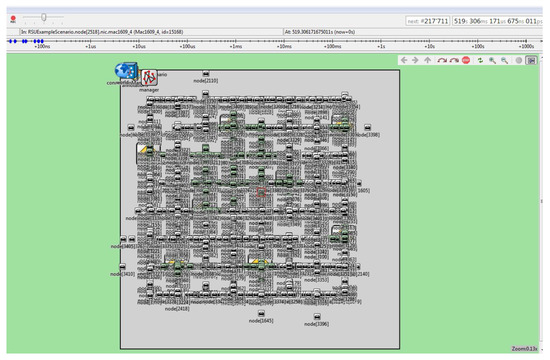
Figure 20.
All RSUs have already sent the message once.
As shown in Figure 21b,c, almost all vehicles have received the message in the connected RSUs scenario when the simulation time is 543 s, while many vehicles have not received the message in the disconnected RSUs scenario when the simulation time is 622 s.
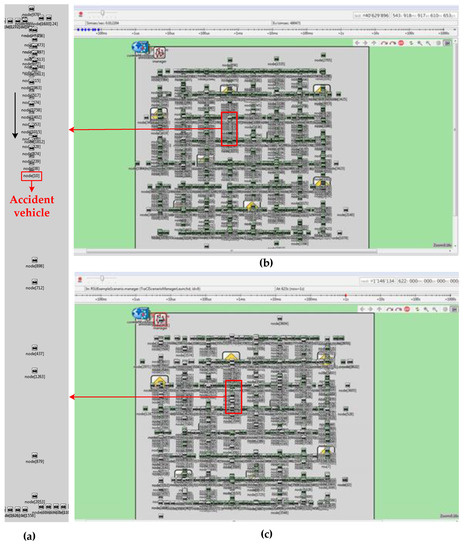
Figure 21.
Running interface of the simulation: (a) the accident vehicle on lane E6E5; (b) almost all vehicles have received the message in the connected RSUs scenario; (c) most vehicles have received the message in the disconnected RSUs scenario.
In Figure 22, “speed” means the arithmetic mean of the velocities of all completely collected vehicles (−1 indicate that no vehicles were collected by the detector). “nVehEntered” means the sum of vehicles have touched the detector within the interval. “speed” and “nVehEntered” collected by E1 in three scenarios are same. It can be seen in Figure 21a and Figure 22 that there is no space to allow vehicles to enter the lane E6E5 within the interval (300–360 s). It is obvious that no vehicle entered into the lane E6E5 until accident relief (at 800 s). Therefore, the speed and number of vehicles obtained by E1 on lane E6E5 between the simulation time 300 s and 800 s do not reveal the lane change decision of the vehicle that received the message.
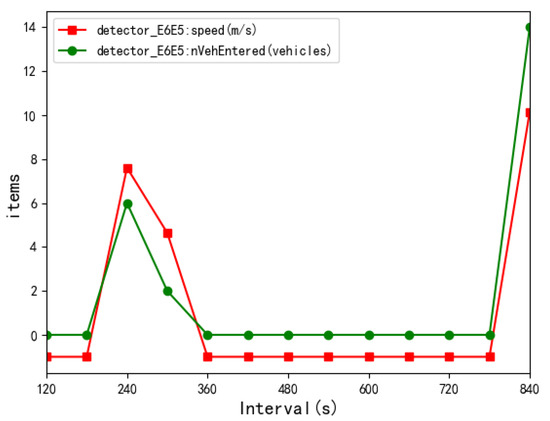
Figure 22.
Output data (speed and nVehEntered) collected by E1 on lane E6E5.
In Figure 23, “vehicleSumWithin” means the number of vehicles that have entered but not yet left the area (8 lanes covered by E3 on the intersection E6). “meanDurationWithin” means the mean duration of these vehicles within the area. The sum of vehicles has entered intersection E6 after 800 s differed in three scenarios, which indicates that vehicles have received the message and made the lane change decision. The number of vehicles entered intersection E6 in our connected RSU scenario was the least of three scenarios. We verified that the connected RSU scenario achieved the extensive coverage of the message. The parameter “meanDurationWithin” could also indicate that most vehicles have rearranged their routes in the connected RSU scenario.
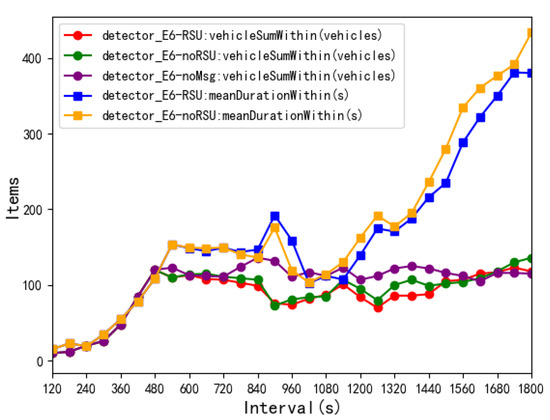
Figure 23.
Comparison between connected RSUS and disconnected RSUs scenarios in terms of vehicleSumWithin and meanDurationWithin collected by E3 on intersection E6.
6. Conclusions
In this study, we analyzed candidate locations of RSUD for different cases of RSUs and vehicles. We discussed the process of message dissemination in the case of RSUs (in Section 3.1) and no RSUs (in Section 3.2) in Cells, respectively. In Section 3.1 and Section 3.2, we discussed two cases about whether there are vehicles running in cell or not and then analyzed the impact of the vehicle’s position (direction/speed) on the message dissemination. According to the above analysis, we assumed that the urban area of our interest had high traffic flow and considered intersections as candidate locations to place RSUs without considering roadside. We also assumed that all RSUs were connected via a backbone network and focused on finding better RSUs locations with the given budget to minimize the average reporting time of emergency messages. To do that, we proposed a new model and algorithm to deploy RSUs in V2X urban areas with large-scale traffic flow. We tested some cases with different and number of intersections to evaluate our algorithm. The solutions of our method were 100% equal to the best solutions when X = 2, 4, 6, 8 in 10,000 cases when we only deployed one RSU. For three RSUs on 8 × 8 and 10 × 10 intersections, 70% of solutions were still equal to the optimal solution with an average difference of less than 0.1%. For 8 × 8 and 12 × 12 intersections, we deployed 1~16 RSUs, respectively. We also verified that the connected RSU scenario achieved the extensive coverage of the message. Our approach could provide guidance for some government decisions makers to deploy RSU in smart cities. Some manufacturing enterprises or AGV workshop plants can also obtain a benefit from our approach to deploy smart devices. However, in our algorithm, we considered the grid street pattern with equal length and assigned these roads with weights 1, 2, 3 etc. for simplicity. For some streets with different lengths, we have to integrate with some complicated methods considering vehicle routes to assign weights. In future research, we will try to deal with this new problem and propose some strategies to abstract a map of the city area with different road geometry into a grid graph. Technological enablers like 5G, big data, digital transportation infrastructure, cloud computing, and mobile edge computing are expected to pave the way for a revolution in mobility of cities and inter-cities. We will study some vehicle-road coordination scenarios such as intersection coordination and ramp merging.
Author Contributions
Y.S. and L.L. formulated the problems and proposed the research framework; L.Y. and Z.Z. conceived the methodologies and designed the experiments; H.Y. and L.Y. performed the experiments; Y.S. and L.L. contributed to the editing of the paper. All authors have read and agreed to the published version of the manuscript.
Funding
This research was funded by China National Key Research and Development Program (NO.2018YFE0197700).
Conflicts of Interest
The authors declare no conflict of interest.
References
- Wu, Q.; Wu, J.; Shen, J.; Yong, B.; Zhou, Q. An Edge Based Multi-Agent Auto Communication Method for Traffic Light Control. Sensors 2020, 20, 4291. [Google Scholar] [CrossRef] [PubMed]
- Saračević, M.; Adamovic, S.; Miskovic, V.; Elhoseny, M.; Macek, N.; Selim, M.; Shankar, K. Data Encryption for IoT Applications Based on Catalan Objects and Two Combinatorial Structures. IEEE Trans. Reliab. 2020. [Google Scholar] [CrossRef]
- Saračević, M.; Adamović, S.; Macek, N.; Elhoseny, M.; Sarhan, S. Cryptographic Keys Exchange Model for Smart City Applications. IET Intell. Transp. Syst. 2020. [Google Scholar] [CrossRef]
- Kim, D.; Velasco, Y.; Wang, W.; Hussain, R. A New Comprehensive RSU Installation Strategy for Cost-Efficient VANET Deployment. IEEE Trans. Veh. Technol. 2017, 66, 4200–4211. [Google Scholar] [CrossRef]
- Merha, S.; Senouci, S.M.; Kies, A.; Zoulikha, A. An Optimized Roadside Units (RSU) Placement for Delay-Sensitive Applications in Vehicular Networks. In Proceedings of the 12th Annual IEEE Consumer Communications and Networking Conference (CCNC), Las Vegas, NV, USA, 9–12 January 2015. [Google Scholar]
- Mershad, K.; Artail, H.; Gerla, M. ROAMER: Roadside Units as message routers in VANETs. Ad Hoc Netw. 2012, 10, 479–496. [Google Scholar] [CrossRef]
- Chen, W.; Lu, X.; Jian, S. Neighborhood trustworthiness-based vehicle-to-vehicle authentication scheme for vehicular ad hoc networks. In Proceedings of the 13th International Conference on Information Security Practice and Experience (ISPEC), Melbourne, Australia, 13–15 December 2017. [Google Scholar]
- Lochert, C.; Scheuermann, B.; Wewetzer, C.; Luebke, A.; Mauve, M. Data Aggregation and Roadside Unit Placement for a VANET Traffic Information System. In Proceedings of the 5th ACM International Workshop on Vehicular Inter-Networking, San Francisco, CA, USA, 15 September 2008. [Google Scholar]
- Xue, L.; Yang, Y.; Dong, D. Roadside Infrastructure Planning Scheme for the Urban Vehicular Networks. Transp. Res. Procedia 2017, 25, 1380–1396. [Google Scholar] [CrossRef]
- Zhu, J.; Huang, C.; Fan, X.; Qin, K.; Fu, B. RSU deployment planning based on approximation algorithm in urban VANET. J. Commun. 2018, 39, 78–89. [Google Scholar]
- Wu, T.J.; Liao, W.; Chang, C.J. A Cost-Effective Strategy for Road-Side Unit Placement in Vehicular Networks. IEEE Trans. Commun. 2012, 60, 2295–2303. [Google Scholar] [CrossRef]
- Frasi, A.; Szczechowiak, P. Optimal Deployment of Road Side Units in Urban Environments. In Proceedings of the International Conference on Connected Vehicles and Expo (ICCVE), Vienna, Austria, 3–7 November 2014. [Google Scholar]
- Whang, G.; Park, S.; Chi, J. Influence Maximized MCL based RSU Deployment. Int. J. Future Gener. Commun. Netw. 2016, 9, 229–238. [Google Scholar] [CrossRef]
- Aslam, F.; Amjad, F.; Zou, C.C. Optimal roadside units placement in urban areas for vehicular networks. In Proceedings of the IEEE Symposium on Computers & Communications, Washington, DC, USA, 1–4 July 2012. [Google Scholar]
- Gao, Z.; Chen, D.; Cai, S.; Wu, H.C. Optimal and Greedy Algorithms for the one-dimensional RSU Deployment Problem With New Model. IEEE Trans. Veh. Technol. 2018, 6, 7643–7657. [Google Scholar] [CrossRef]
- Gao, Z.; Chen, D.; Cai, S.; Wu, H.C. OptDynLim: An Optimal Algorithm for the One-Dimensional RSU Deployment Problem With Nonuniform Profit Density. IEEE Trans. Ind. Inform. 2019, 15, 1052–1061. [Google Scholar] [CrossRef]
- Yang, H.; Jia, Z.; Xie, G. Delay-Bounded and Cost-Limited RSU Deployment in Urban Vehicular Ad Hoc Networks. Sensors 2018, 18, 2764. [Google Scholar] [CrossRef] [PubMed]
- Hwang, S.F.; Chen, W.C.; Dow, C.R.; Nguyen, N.L. Efficient RSU Placement Schemes in Urban Vehicular Ad Hoc Networks*. J. Inf. Sci. Inf. 2019, 35, 1045–1060. [Google Scholar]
- Lu, N.; Zhang, N.; Cheng, N.; Shen, X.; Mark, J.W.; Bai, F. Vehicles Meet Infrastructure: Toward Capacity–Cost Tradeoffs for Vehicular Access Networks. IEEE Trans. Intell. Transp. Syst. 2013, 14, 1266–1277. [Google Scholar] [CrossRef]
- Barrachina, J.; Garrido, P.; Fogue, M.; Martinez, F.J.; Cano, J.C.; Calafate, C.t.; Manzoni, P. Road Side Unit Deployment: A Density-Based Approach. IEEE Intell. Transp. Syst. Mag. 2013, 5, 30–39. [Google Scholar] [CrossRef]
- Fogue, M.; Sanguesa, J.A.; Francisco, J.M.; Marquez-Barja, J.M. Improving Roadside Unit Deployment in Vehicular Networks by Exploiting Genetic Algorithms. Appl. Sci. 2018, 8, 86. [Google Scholar] [CrossRef]
- Zhang, L.; Zhuang, Y.; Pan, J.; Kaur, L.; Zhu, H. Multi-modal message dissemination in vehicular ad-hoc networks. In Proceedings of the IEEE International Conference on Communications, Ottawa, ON, Canada, 10–15 June 2012. [Google Scholar]
- Lan, K.C.; Wu, Z.M. On the feasibility of using public transport as data mules for traffic monitoring. In Proceedings of the IEEE Intelligent Vehicles Symposium, Eindhoven, The Netherlands, 4–6 June 2008. [Google Scholar]
- Cumbal, R.; Palacios, H.; Hincapie, R. Optimum deployment of RSU for efficient communications multi-hop from vehicle to infrastructure on VANET. In Proceedings of the IEEE Colombian Conference on Communications and Computing (COLCOM), Cartagena, Colombia, 27–29 April 2016. [Google Scholar]
- Tinos, R.; Yang, S. Evolution Strategies with q-Gaussian Mutation for Dynamic Optimization Problems. In Proceedings of the 2010 Eleventh Brazilian Symposium on Neural Networks (SBRN 2010), Sao Paulo, Brazil, 23–28 October 2010. [Google Scholar]


© 2020 by the authors. Licensee MDPI, Basel, Switzerland. This article is an open access article distributed under the terms and conditions of the Creative Commons Attribution (CC BY) license (http://creativecommons.org/licenses/by/4.0/).