Abstract
In Vietnam, as more and more organizations are moving toward globalization, green supplier selection (GSS) has emerged as a strategic approach in supply chain management that requires supplier practices in lessening the environmental risks to society. Based on both conventional and environmental criteria, this paper aims to evaluate a set of suppliers by establishing a multi-criteria decision-making (MCDM)-based framework using an integrated fuzzy analytical hierarchy process (FAHP) with the VIseKriterijumska Optimizacija I Kompromisno Resenje (VIKOR) method. Initially, five GSS criteria of the environmental aspect (wastewater treatment, solid waste generation, energy consumption, air pollution, corporate social responsibility) and conventional criteria (quality, cost, delivery, and technology) are identified from the literature and consulting field experts to employ the MCDM approach. The trustworthiness of the proposed integrated framework is presented by discussing a case study in the coffee bean supply chain in Vietnam. The FAHP is used to generate criteria weights in which fuzzy set theory is applied to translate the linguistic evaluation statements of experts, and VIKOR is used to rank the alternatives against the selected criteria. From FAHP findings, the most important criteria are quantity discount, solid waste generation, order fulfillment rate, logistics cost, and purchasing cost. A consistency test is performed to ensure the uniformity of the expert’s input. The best suppliers are determined through the final ranking of the VIKOR model for the case study. The work presented provides insight to decision-makers of supplier selection that helps determine significant GSS criteria and aids in the minimization of environmental risks to society arising from the supply chain on corporate sustainability standards.
Keywords:
supply chain; green suppliers; conflicting criteria; coffee bean; decision making; fuzzy set; FAHP; VIKOR 1. Introduction
In recent years, there has been a broad-based effort to make supply chains more resilient. The concept of the sustainability-focused supply chain is coming into sharp focus, attracting both academic and corporate interest in public and private organizations. In effect, leading organizations concentrate especially on their global supply chains and aim to enhance the agility and efficiency of their supply systems. Rigorous environmental rules and policies have caused organizations to accept affirmative changes such as green supply chain management practices []. Fundamentally, such organizations often experiment with unprecedented sorts of collaboration with vendors, consumers, and competitions across sectors and countries, increasing the sustainability of their supply chains (including the sustainable nature of their supply chain partners) []. These additional efforts have been concluded to be a high-paid investment because greener supply chains are beneficial to both businesses and the environment. It is undeniable that global climate change is an alarming issue; as a result, achieving a win-win situation for the environment and the economy is critical. The green supply chain prioritizes lowering the environmental effect during product delivery while also providing excellent customer service. Additionally, the COVID-19 crisis has put sustainability in supply chain context into the spotlight []. It has exposed vulnerabilities throughout the government and industry to sharper focus than ever on the value of sustainability.
In implementing sustainable supply chain initiatives and achieving social, environmental, and economic gains, enhanced sustainability of inputs and suppliers is recognized as a strategic duty. In the last few years, a growing number of multinational companies have committed to only engage with ethical and environmental providers. As the first step towards this trend, green supplier selection (GSS) is today among the best portfolio approaches to sustainable-focused performance across the entire value chain. The GSS is a significantly important task for any organization that involves handling all activities associated with the input-transformation-output process with regard to dimensions and criteria of sustainability []. For this, the companies must choose their suppliers based on how well their practices are in each of the conventional criteria (i.e., economic aspects) and environmental and social criteria. Working toward GSS is becoming a major part that fosters sustainable supply chain management and builds competitive edges for companies in areas where predominantly outsourced production, for example, food and apparel, is involved.
While the environmental performance of supplies is a crucial dimension of worldwide sustainable supply chain management, which is taken into account as the climate change mitigation, this aspect is usually overlooked in the business decision of selecting suppliers in the context of developing countries as compared to developed countries. It is noteworthy that environmental issues have become a priority for governments and businesses in emerging economies [], where green concerns are new and still developing. Developing countries face daunting challenges in ensuring a balance between development and environmental sustainability. Nonetheless, firms in emerging economies, taking Vietnam as a good example, are urged to examine the environmental performance of their suppliers []. Given the importance of sustainable supply chain management with the ecological dimension in the GSS, there remains a lack of discussion on the evaluation of these green issues for supplier selection decision-making in the developing countries context. Particularly, limited literature has been dedicated to the GSS for a wide array of supply chains in Vietnam. Therefore, this paper suggests a multi-criteria decision-making (MCDM) approach for the GSS problem, aiming to solve a real-world case study of the coffee bean supply chain in Vietnam with targeting to incorporate environmental factors into the conventional supplier selection model. In this sense, the following objectives are identified for the presented case study:
- To understand and identify evaluation criteria for GSS from a supply chain context in Vietnam.
- To calculate the relative importance weights of the GSS evaluation criteria for the supply chain.
- To select the most potential green supplier from a set of alternatives in supply chain.
- To put forward managerial and practical implications of the proposed work.
Towards these purposes, this study is focused on evaluating a set of suppliers based on both conventional and environmental criteria. Initially, from the literature review and expert’s opinions in the supply chain context, five GSS criteria of the environmental aspect (wastewater treatment, solid waste generation, energy consumption, air pollution, corporate social responsibility) and conventional criteria (quality, cost, delivery, and technology) have been identified. A hybrid MCDM approach consisting of fuzzy Analytical Hierarchy Process (FAHP) and VIseKriterijumska Optimizacija I Kompromisno Resenje (VIKOR) methodology is proposed. The strength of FAHP is the ability to handle uncertainty and perform pairwise comparisons to ensure consistent rankings from the decision-makers, while VIKOR is able to handle a large number of alternatives and generates alternative rankings based on proximity to the ideal solution. We adopt this hybrid approach to use the merits offered by both methods, designating FAHP for weighting the considered criteria, and VIKOR for ranking the suppliers (alternatives). To the best of the authors’ knowledge and reviewed literature (elaborated in Section 2), this is the first study that employs the combination of FAHP and VIKOR techniques to identify and prioritize GSS evaluation criteria and evaluate the potential green suppliers in a case study of the supply chain in Vietnam for sustainability.
The rest of this paper proceeds as follows. In Section 2, we present the related literature on GSS criteria, approaches, and research gaps. Section 3 contains the theoretical background of the proposed methodology. The case study with the implementation of the proposed methods and results analysis are presented in Section 4 to exhibit real-life applicability. In Section 5, implications and managerial insights are discussed, while concluding remarks and future research directions are also well-depicted.
2. Literature Review
2.1. Literature Review on GSS Approaches and Criteria Selection
Traditional approaches to the supplier selection problem were limited to economic aspects. However, due to increased customer knowledge and ecological pressures from markets and various stakeholders, recent studies have adopted methods that take into account the green level and development trends in companies in the upper and lower streams. Luthra et al. [] pointed out that businesses have emphasized the significance of greening and sustainability in their supply chain through supplier selection, leading to the necessity of green and sustainability-focused evaluation systems for supplier selection. The authors developed an AHP-VIKOR framework to evaluate sustainable supplier selection considering social and environmental criteria along with economic criteria from a supply chain context. The method was utilized to solve a real-world problem and the results indicated environmental costs, quality of product, price of product, occupational health and safety systems, and environmental competencies as the top five criteria. On the same note, Memari et al. [] utilized the fuzzy TOPSIS method to select the right sustainable supplier for a manufacturer considering environmental efficiency, green image, pollution reduction, green competencies, safety and health, and employment practices, in addition to conventional criteria such as costs, quality, and service performance. Using an integrated fuzzy MCDM framework, Gupta et al. [] investigated a GSS problem with six green supplier selection environmental criteria (environmental management system, green image, staff environment training, eco-design, pollution control, and resource consumption) and three conventional criteria (price, quality, and service level). The authors found that environment management system, pollution control, quality, and green image ranked as the topmost four GSS criteria. Awasthi et al. [] proposed an integrated MCDM approach-based framework for sustainable global supplier selection with five sustainability criteria (economic, quality, environment, social, and global risk). The research aimed to enable managers to decide supplier development approaches for high-risk or poorly performing suppliers on corporate sustainability standards.
In Table 1, the criteria included in some recent studies on GSS and relevant sectors are listed. The table shows that some studies only considered a few key criteria, while some research has shifted to covering a more comprehensive set of criteria which led to robust results. These factors were identified by exhaustively reviewing the literature and were further narrowed with the assistance of a panel of experts and case decision-makers in the coffee bean supply chain in Vietnam. The committee confirmed that the set was comprehensive, covered different aspects of the assessment process, and recommended using it as the final set.

Table 1.
The list of relative criteria applied in previous studies.
2.2. Literature Review on Proposed Methodologies
For the selection of a potential supplier, which is a complex decision-making procedure, to reduce the preliminary set of suppliers to the final choices, various MCDM techniques have been developed in the last few years to address these challenges. A high degree of uncertainty is associated with these decision-making processes. MCDM methods assist research in handling both qualitative and quantitative measurements while distinguishing the importance levels of a cluster of alternatives and conflicting criteria based on their limitations, preferences, and priorities of the decision-makers []. A range of MCDM methodologies/techniques have been suggested by various researchers in the area of supplier selection towards green and sustainable practices. Table 2 provides a summary of several academics and practitioners’ approaches for selecting green and sustainable suppliers.
Table 2.
Summary of methodologies and approaches in supplier’s selection toward sustainability.
Among different decision-making methods, AHP is widely used in determining relative importance while VIKOR is a powerful alternative evaluation method []. The AHP method [] is one of the most used MCDM methods in the literature. This method considers that criteria for evaluation may be expressed in a hierarchical framework. The classical AHP takes account of decision makers’ explicit judgements []. Although the conventional AHP reflects the experts’ views on numerous criteria and alternatives, it is not able to deal with people’s frequently ambiguous estimates []. To address this uncertainty in estimates, the power of the fuzzy set theory has been used to combine AHP with fuzzy logic, making the assessment process flexible and able to explain expert preferences. In the context of conflicting criteria in complex systems, VIKOR is a compromise ranking method proposed by Opricovic [] that can be used to rank and determine one option from a group of alternatives. VIKOR creates a multi-criteria rating index based on a specific assessment of closeness to the ideal solution.
3. Methodology
3.1. Fuzzy Analytical Hierarchy Process (FAHP)
Fuzzy set theory was first introduced by Zadeh []. The triangular fuzzy number (TFN) is the primary model, as can be described in Figure 1 and Equation (1). The TFN function is described by which are the lower bound, middle bound and upper bound of the fuzzy set, respectively.
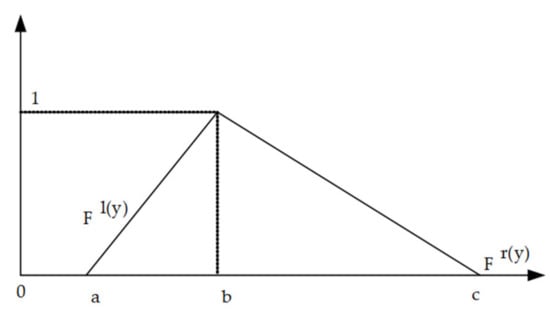
Figure 1.
TFN membership function.
Following that, the membership function of the linguistic scale is shown in Equation (2):
where are two sides of the membership function.
The fuzzy analytical hierarchy process (FAHP), an extension of AHP, overcomes AHP’s shortcomings and solves various MCDM problems in fuzzy settings. Table 3 presents the membership function of a linguistic scale in a fuzzy analytical hierarchy process (FAHP) model. The following procedures of the FAHP model are shown as follows []:
Table 3.
Membership function of linguistic scale in FAHP model.
Step 1: Conduct the pairwise comparison matrices for all criteria. This matrix is an real matrix, where is the number of criteria. Each element of matrix denotes the importance of the th criterion over the th criterion. The relative importance between two criteria is measured according to the numerical scale of – by assigned linguistic variables (i.e., triangular fuzzy number (TFN)). A tilde symbol () is placed above the parameter symbols to indicate imprecise data including the pessimistic, most likely and optimistic values.
Suppose that a decision group consists of experts. The aggregated fuzzy pairwise comparison matrix is created using the geometrical mean, as in Equation (3):
where .
Step 2: Following that, the fuzzy geometric mean of each criterion is defined, as can be seen in Equation (4):
where denotes the fuzzy geometric mean, and is the fuzzy comparison value of the dimension th to the criterion th.
Step 3: Then, the relative fuzzy preference weights of each criterion are defined by Equation (5):
where is the fuzzy weights of the th criterion, which can be presented as , such that are the lower-, middle-, and upper-bound of , respectively.
Step 4: Defuzzify the relative fuzzy preference weights by using the average weight criteria , as can be seen in Equation (6).
Step 5: Finally, the normalized relative preference weight of each criterion is calculated in Equation (7).
After building the pairwise comparison matrices and calculating the relative weights of criteria, the consistency of the paired comparison matrices should be verified, as follows.
Step 6: Develop normalized matrices. Divide each number in a column of the comparison matrix by its column sum.
Step 7: Develop the priority vector. The priority vector (f) is determined by averaging the row entries in the normalized matrix.
Step 8: Calculate the consistency ratio (CR), as can be seen in Equations (8)–(10). In this step, the relevant priorities are provided by the priority vector (f) matching to the largest eigenvector ().
The consistency index (CI) is calculated based on the largest value of the eigenvector () and the number of criteria (n).
The consistency ratio (CR) is built according to the ratio of the consistency index (CI) and the random index (RI), i.e., as can be seen in Table 4.
Table 4.
The values of random index (RI).
If , the results are satisfactory. Otherwise, the pairwise comparision matrix must be re-evaluated.
3.2. Visekriterijumska Optimizacija I Kompromisno Resenje (VIKOR)
VIsekriterijumska optimizacija i KOmpromisno Resenje (VIKOR) is a multiple criteria optimization method with conflicting criteria based on the proximity between each evaluation value of the alternative and the ideal solution. The objective of the VIKOR method is to obtain compromised ranking with maximum “the group utility” and minimum “the individual regret”. The procedures of VIKOR are shown as follows [].
Step 1: Determine the predefined preference weight of each criterion. In this paper, the relative preference weight of each criterion is computed from the FAHP model.
Step 2: Determine the set of best value (positive ideal solutions) and the set of worst value (negative ideal solutions) for all the criteria, as shown in Equations (11) and (12).
Step 3: Determine the normalized difference between the performance rating and the set of best value , or the set of worst value , as Equations (13) and (14).
Step 4: Determine the maximum “the group utility” of alternative from the set of best value , as well as determine the minimum “the individual regret” of alternative from the set of worst value , as shown in Equations (15) and (16):
where denotes the weights of each criterion.
Step 5: Determine “the worse group score” values (i.e., the parameter used for ranking the alternatives), as can be seen in Equations (17)–(19) as follows:
where denotes the strategy of the maximum “the group utility”, which can be varied from 0 to 1, while denotes the strategy of the minimum “the individual regret”. In this paper, the value of is considered to be 0.5 () for beginning analysis.
Step 6: The alternatives are ranked by sorting the values in ascending order. In this study, the alternative with the smallest value of ranking is dominated as the optimal solution.
3.3. Research Framwork
As shown in Figure 2, the flow of the research includes two phases. In the first phase (define criteria list and apply fuzzy AHP), fuzzy AHP (i.e., the weighting method) is used to determine the preference weight of the list of criteria, which is defined based on the expert’s consultant and previous literature review. Table 5 presents the list of criteria and definitions for green supplier selection. As mentioned, this paper considers five aspects and 15 criteria, which are quality (C1), cost (C2), delivery (C3), technology (C4), and environment (C5). In the second phase (apply VIKOR and result analysis), VIKOR (i.e., the compromise ranking method) is applied to rank the suppliers according to the decision-makers preferences. It is important to note that the preference weights of each criterion and the rating of each alternative are conveyed in linguistic terms using triangular fuzzy numbers. A case study of the coffee bean supply chain in Vietnam is used to demonstrate the model’s effectiveness.
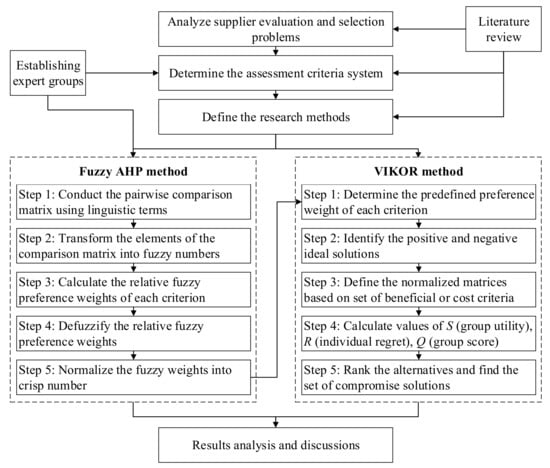
Figure 2.
The research framework for green supplier selection.
Table 5.
The list of criteria and definition for green supplier selection.
We invited five experts, who work in procurement, logistics, and planner departments, to evaluate the pairwise importance of the five main aspects (quality, cost, delivery, technology, and environment) and 15 criteria through face-to-face interviews and email. This team of five experts have many years of working experience in the coffee bean supply chain in Vietnam. After being shortlisted for the list of criteria, those experts then determined the relative importance of each criterion using the concept of linguistics variables and fuzzy AHP (as presented in Section 3.1). A summary of survey results from experts in the FAHP model is presented in Table A1 and Table A2 (Appendix A).
4. Case Study and Results Analysis
4.1. Case Study
Coffee significantly contributes to the GDP of Vietnam, generates jobs, and promotes socio-economic growth. In Vietnam, there are many coffee farms, which are located in Lam Dong, Dak Nong, Quang Tri, Dien Bien, and Son La provinces. However, the Vietnamese coffee industry is plagued by productivity, quality, and price issues, all of which are threatening the industry’s long-term sustainability. The most important aspect appears to be the supplier selection procedure, as it aids in the production of high-quality products and customer satisfaction, as well as reduction of the supply chain cost [].
This paper involves an application of fuzzy multi-criteria decision making (FMCDM) by combining FAHP and VIKOR methods for choosing the optimal green suppliers. A case study of the coffee bean supply chain in Vietnam is used to show the effectiveness of the proposed model. After preliminary evaluation, this paper considers 10 green suppliers which are located in Ho Chi Minh city, Vietnam (GS-01 to GS-10), as can be seen in Table 6. A team of five experts who all have many years of working experience in the coffee bean supply chain in Vietnam, helped to do survey questionnaires in the performance rating process.
Table 6.
The list of green supplier companies.
In the proposed model, FAHP is applied to identify the significant level of criteria. Following that, VIKOR is applied to rank all suppliers in order to obtain the compromised ranking with maximum “the group utility” and minimum “the individual regret”. The hierarchy tree for green supplier selection is presented in Figure 3. The criteria system consists of five aspects with a total of 15 criteria, which are quality (supply availability, defect rate, customer complaint), cost (purchasing cost, logistics cost, quantity discount), delivery (order fulfillment rate, just in time delivery), technology (tracking and tracing system, R&D capability), and environment (wastewater treatment, solid waste generation, energy consumption, air pollution, corporate social responsibility).
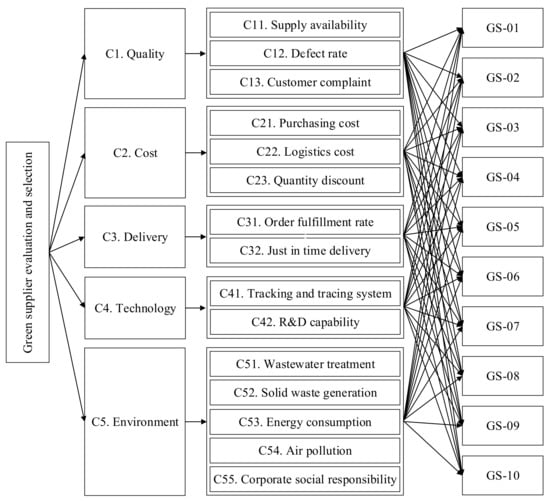
Figure 3.
The hierarchy tree for green supplier selection.
4.2. Results of FAHP
In the FAHP method, the consistency ratio (CR) has a significant impact on the outcome. This part presents an example of the calculation of FAHP procedures. The expert team conducts preliminary performance rating for the five main aspects including quality (C1), cost (C2), delivery (C3), technology (C4), and environment (C5). Table A2 and Table A3 (Appendix A) present the rating performance matrix and the integrated fuzzy comparison matrix of the FAHP model, respectively.
To check the consistency ratio (CR) of the performance evaluation rating, the linguistics words (triangular fuzzy number) are converted to crisp values using the pessimistic (lower bound) and optimistic (upper bound) values of the fuzzy comparison matrix [,]. Table A4 (Appendix A) presents the defuzzied comparison matrix of the five main aspects in the FAHP model.
The normalization procedures of the five primary aspects of the FAHP model are obtained by dividing each value in a column of the matrix by its column total to create the normalized pairwise comparison matrix. Then, the priority vector is then calculated by averaging the row entries in the normalized matrix, as can be seen in Table A5 (Appendix A).
In this step, the largest eigenvector () is computed in order to define the consistency index (CI), the random index (RI), and the consistency ratio (CR), as follows.
This paper considered five main aspects. Therefore, we obtain . Following that, the largest eigenvector and the consistency index CI are calculated as follows:
such that we obtain the random index , and the consistency ratio (CR) is calculated as follows:
Based on the result, . Hence, the pairwise comparison matrix is completely consistent, and the obtained result of the FAHP model is totally satisfactory. Following that, other criteria are calculated using the same procedure. The integrated fuzzy comparison matrix of all criteria is presented in Table A6 (Appendix A).
Consequently, the relative preference weights of each criterion in the FAHP model are presented in Table 7.
Table 7.
The relative preference weights of each criterion in FAHP model.
In this study, the performance rating from experts is described by linguistic variables, which are expressed in triangular fuzzy numbers with pessimistic, most likely, and optimistic values. The results presented that the fuzzy geometric mean is used to calculate the preference weights of each criterion. For example, the fuzzy preference weight of criteria supply availability (C11) has the pessimistic value of 0.0287, the most likely value of 0.0666, and the optimistic value of 0.1565. As the same calculation, the fuzzy preference weight of criteria defect rate (C12) has the pessimistic value of 0.0243, the most likely value of 0.0539, and the optimistic value of 0.1257. Other criteria have similar descriptions. Following that, the average weight criteria will be used to defuzzify these fuzzy preference weights into crisp values. Then, the normalized weights are for ranking suppliers by the VIKOR model in the next step.
The significant level of criteria in the FAHP model is presented in Figure 4. From the results, quantity discount (C23), solid waste generation (C52), order fulfillment rate (C31), logistics cost (C22), and purchasing cost (C21) achieve the most significant impact, at 0.1125, 0.1007, 0.1005, 0.0990, and 0.0914, respectively. The results suggest that, in the assessment of experts in the coffee bean industry, cost (i.e., quantity discount, logistics cost, purchasing cost) is more important than other aspects such as quality, delivery, technology, and environment.
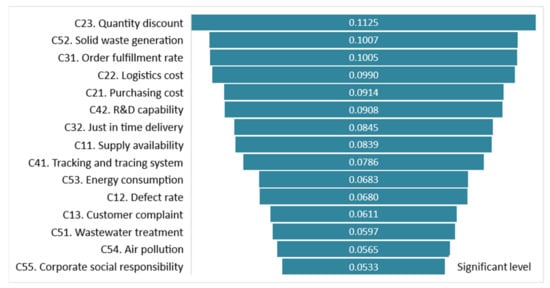
Figure 4.
The significant level of criteria in FAHP model.
4.3. Results of VIKOR
VIKOR is particularly useful when there are multiple alternatives and conflicting criteria, and hence, it is well suited to evaluating and selecting suppliers. It provides a multi-criteria ranking index based on the proximity to the ideal solution measurement. In the VIKOR model, the fundamental principle is to rank many alternatives using a compromise solution strategy that maximizes “the group utility” while minimizing “the individual regret”. According to the procedure of the VIKOR model, the set of the best value and the worst value are presented in Table 8, as follows.
Table 8.
The set of best value and worst value in VIKOR model.
This paper considers the top 10 green suppliers (GS-01 to GS-10) of the coffee bean supply chain in Vietnam. The final ranking of the suppliers is built by sorting the values of “the compromise group score” in ascending order (i.e., the smaller value of , the better alternative is). Following that, the relative parameter used for ranking the suppliers and the final ranking of the green suppliers in the VIKOR model is presented in Table 9. Based on the results, the top three potential green suppliers in the coffee bean are GS-06, GS-10, and GS-08, which are ranked at the first, second, and third position with the compromise group score of each supplier of 0.1093, 0.1143, and 0.1502, respectively.
Table 9.
The relative parameter used for ranking the suppliers in VIKOR model.
The 90S Coffee (GS-06) is the possible optimal supplier from the proposed model based on the considered criteria and invited expert’s judgments. According to [], the 90S Coffee supplier specializes in providing roasted and ground coffee beans with the best delivery service and quality in Ho Chi Minh city and throughout Vietnam. The products always bring a rich flavor, as well as an ecstatic aroma from the roasting process and preservation formula. Therefore, this paper can offer decision-makers, policymakers, and relevant industries a valuable decision-making guideline in selecting suitable suppliers of the coffee bean chain.
5. Discussions and Conclusions
In the presented research work, an effective hybrid MCDM model for GSS with emphasis on coffee bean supply chain issues is established. A case study in Vietnam is presented to test the trustworthiness of the proposed integrated framework. The results of the case study are visualized in Figure 5. The significant advantage of this paper is the selection of the GSS evaluation criteria which are developed through field experts and the existing literature. Thereby, five GSS criteria of the environmental aspect (wastewater treatment, solid waste generation, energy consumption, air pollution, corporate social responsibility) and conventional criteria (quality, cost, delivery, and technology) have been identified. All the listed criteria will help managers of allied businesses to handle numerous challenges and aid in the minimization of environmental risks to society arising from poorly performing suppliers, leading to eco-friendly products.
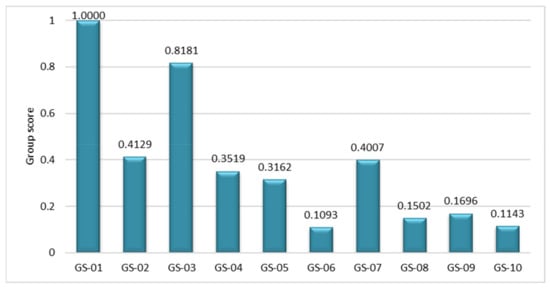
Figure 5.
Green suppliers’ final ranking in the VIKOR model.
The FAHP method is utilized for the determination of the criteria weights, which later have been employed as inputs for VIKOR methodology in order to select the best supplier. In general, experts and decision-makers use linguistic phrases rather than plain numbers for expressing their assessments. Thus, the application of fuzzy set theory helps reserve the degree of subjectivity and mitigate the subjectivity in the problems of decision making. Evaluation criteria that have obtained maximum weight priority in the analysis are quantity discount, solid waste generation, order fulfillment rate, logistics cost, and purchasing cost. While several aspects such as service quality, economic factors, and technology have been focused on in supplier performance management, bearing in mind social and environmental subjects still remains a challenge, especially in context of the food and beverage supply chain issues in Vietnam. In the process of selecting green suppliers, the fusion of environmental criteria is becoming increasingly important. Decision-makers and management teams can help by providing and developing new model supplier selection and analysis instruments across several issues facing supply chain management specialists in the procurement process [].
In the process of selecting green suppliers, the merging of environmental criteria becomes increasingly significant. Decision-makers and managers can benefit from the availability and development of GSS models and analysis tools that assist them in tackling many issues faced by supply chain management experts in procurement procedures. Managers of allied companies can evaluate their suppliers using the presented methodology. Consequently, the results obtained can be used as a significant material for the organization’s supply chain so that no insignificant vendor can be entered into the supply chain. This will help in noteworthy resource and cost-saving and lessening of the environmental impacts.
For future studies, the proposed method in this paper can be associated with more novel factors that are impactful in the supply chain context. Methodologically, different MCDM techniques such as TOPSIS, PROMETHEE, WASPAS, DEA, to name a few, or combinations of them could be utilized [,]. Further research could also apply the proposed method or relevant approaches to specific supply chain cases of many more industries to test the general validity of the results. Sensitivity analysis and comparison analysis can be implemented for the decision-makers to test the observation stability of the model.
Author Contributions
Conceptualization, N.B.T.N. and T.-T.D.; data curation, N.B.T.N.; formal analysis, N.B.T.N.; investigation, G.-H.L.; methodology, N.B.T.N. and T.-T.D.; project administration, G.-H.L.; software, N.B.T.N.; validation, G.-H.L.; writing—original draft, N.B.T.N. and T.-T.D.; writing—review and editing, G.-H.L. and N.B.T.N. All authors have read and agreed to the published version of the manuscript.
Funding
This research received no external funding.
Institutional Review Board Statement
Not applicable.
Informed Consent Statement
Not applicable.
Data Availability Statement
Not applicable.
Acknowledgments
The authors appreciate the support from the National Kaohsiung University of Science and Technology, Taiwan, and Da Lat University, Vietnam.
Conflicts of Interest
The authors declare no conflict of interest.
Appendix A
Table A1.
A summary of survey results from experts in the FAHP model.
Table A1.
A summary of survey results from experts in the FAHP model.
| Criteria | Linguistics Variables | Criteria | ||||||||||||||||
|---|---|---|---|---|---|---|---|---|---|---|---|---|---|---|---|---|---|---|
| (8, 9, 10) | (7, 8, 9) | (6, 7, 8) | (5, 6, 7) | (4, 5, 6) | (3, 4, 5) | (2, 3, 4) | (1, 2, 3) | (1, 1, 1) | (1, 2, 3) | (2, 3, 4) | (3, 4, 5) | (4, 5, 6) | (5, 6, 7) | (6, 7, 8) | (7, 8, 9) | (8, 9, 10) | ||
| C11 | 3 | 1 | 1 | C12 | ||||||||||||||
| C11 | 2 | 3 | C13 | |||||||||||||||
| C11 | 4 | 1 | C21 | |||||||||||||||
| C11 | 1 | 2 | 2 | C22 | ||||||||||||||
| C11 | 1 | 3 | 1 | C23 | ||||||||||||||
| C11 | 1 | 3 | 1 | C31 | ||||||||||||||
| C11 | 3 | 2 | C32 | |||||||||||||||
| C11 | 3 | 2 | C41 | |||||||||||||||
| C11 | 2 | 1 | 2 | C42 | ||||||||||||||
| C11 | 1 | 2 | 2 | C51 | ||||||||||||||
| C11 | 1 | 2 | 2 | C52 | ||||||||||||||
| C11 | 1 | 2 | 2 | C53 | ||||||||||||||
| C11 | 1 | 2 | 2 | C54 | ||||||||||||||
| C11 | 1 | 1 | 1 | 2 | C55 | |||||||||||||
| C12 | 2 | 2 | 1 | C13 | ||||||||||||||
| C12 | 2 | 2 | 1 | C21 | ||||||||||||||
| C12 | 2 | 2 | 1 | C22 | ||||||||||||||
| C12 | 1 | 2 | 1 | 1 | C23 | |||||||||||||
| C12 | 1 | 2 | 1 | 1 | C31 | |||||||||||||
| C12 | 2 | 2 | 1 | C32 | ||||||||||||||
| C12 | 1 | 2 | 1 | 1 | C41 | |||||||||||||
| C12 | 3 | 2 | C42 | |||||||||||||||
| C12 | 4 | 1 | C51 | |||||||||||||||
| C12 | 3 | 2 | C52 | |||||||||||||||
| C12 | 3 | 2 | C53 | |||||||||||||||
| C12 | 2 | 1 | 2 | C54 | ||||||||||||||
| C12 | 2 | 1 | 2 | C55 | ||||||||||||||
| C13 | 2 | 2 | 1 | C21 | ||||||||||||||
| C13 | 2 | 2 | 1 | C22 | ||||||||||||||
| C13 | 1 | 2 | 2 | C23 | ||||||||||||||
| C13 | 1 | 2 | 2 | C31 | ||||||||||||||
| C13 | 2 | 2 | 1 | C32 | ||||||||||||||
| C13 | 2 | 3 | C41 | |||||||||||||||
| C13 | 1 | 1 | 3 | C42 | ||||||||||||||
| C13 | 2 | 3 | C51 | |||||||||||||||
| C13 | 1 | 2 | 2 | C52 | ||||||||||||||
| C13 | 1 | 2 | 2 | C53 | ||||||||||||||
| C13 | 1 | 2 | 2 | C54 | ||||||||||||||
| C13 | 3 | 1 | 1 | C55 | ||||||||||||||
| C21 | 2 | 3 | C22 | |||||||||||||||
| C21 | 1 | 3 | 1 | C23 | ||||||||||||||
| C21 | 1 | 3 | 1 | C31 | ||||||||||||||
| C21 | 3 | 2 | C32 | |||||||||||||||
| C21 | 3 | 2 | C41 | |||||||||||||||
| C21 | 3 | 2 | C42 | |||||||||||||||
| C21 | 3 | 2 | C51 | |||||||||||||||
| C21 | 3 | 2 | C52 | |||||||||||||||
| C21 | 2 | 1 | 2 | C53 | ||||||||||||||
| C21 | 2 | 1 | 2 | C54 | ||||||||||||||
| C21 | 2 | 3 | C55 | |||||||||||||||
| C22 | 2 | 1 | 1 | 1 | C23 | |||||||||||||
| C22 | 1 | 1 | 1 | 1 | 1 | C31 | ||||||||||||
| C22 | 1 | 1 | 1 | 2 | C32 | |||||||||||||
| C22 | 1 | 1 | 1 | 2 | C41 | |||||||||||||
| C22 | 1 | 1 | 1 | 1 | 1 | C42 | ||||||||||||
| C22 | 1 | 2 | 1 | 1 | C51 | |||||||||||||
| C22 | 3 | 2 | C52 | |||||||||||||||
| C22 | 1 | 1 | 2 | 1 | C53 | |||||||||||||
| C22 | 1 | 1 | 2 | 1 | C54 | |||||||||||||
| C22 | 1 | 1 | 2 | 1 | C55 | |||||||||||||
| C23 | 2 | 1 | 2 | C31 | ||||||||||||||
| C23 | 1 | 2 | 1 | 1 | C32 | |||||||||||||
| C23 | 1 | 2 | 1 | 1 | C41 | |||||||||||||
| C23 | 2 | 1 | 2 | C42 | ||||||||||||||
| C23 | 2 | 1 | 2 | C51 | ||||||||||||||
| C23 | 1 | 1 | 3 | C52 | ||||||||||||||
| C23 | 1 | 2 | 2 | C53 | ||||||||||||||
| C23 | 2 | 2 | 1 | C54 | ||||||||||||||
| C23 | 1 | 2 | 2 | C55 | ||||||||||||||
| C31 | 1 | 2 | 2 | C32 | ||||||||||||||
| C31 | 2 | 2 | 1 | C41 | ||||||||||||||
| C31 | 1 | 3 | 1 | C42 | ||||||||||||||
| C31 | 3 | 2 | C51 | |||||||||||||||
| C31 | 3 | 2 | C52 | |||||||||||||||
| C31 | 3 | 2 | C53 | |||||||||||||||
| C31 | 1 | 3 | 1 | C54 | ||||||||||||||
| C31 | 1 | 3 | 1 | C55 | ||||||||||||||
| C32 | 3 | 2 | C41 | |||||||||||||||
| C32 | 2 | 1 | 2 | C42 | ||||||||||||||
| C32 | 3 | 2 | C51 | |||||||||||||||
| C32 | 2 | 1 | 2 | C52 | ||||||||||||||
| C32 | 1 | 3 | 1 | C53 | ||||||||||||||
| C32 | 3 | 1 | 1 | C54 | ||||||||||||||
| C32 | 1 | 1 | 2 | 1 | C55 | |||||||||||||
| C41 | 3 | 1 | 1 | C42 | ||||||||||||||
| C41 | 1 | 1 | 2 | 1 | C51 | |||||||||||||
| C41 | 3 | 1 | 1 | C52 | ||||||||||||||
| C41 | 3 | 1 | 1 | C53 | ||||||||||||||
| C41 | 3 | 1 | 1 | C54 | ||||||||||||||
| C41 | 1 | 1 | 2 | 1 | C55 | |||||||||||||
| C42 | 3 | 1 | 1 | C51 | ||||||||||||||
| C42 | 1 | 1 | 2 | 1 | C52 | |||||||||||||
| C42 | 1 | 3 | 1 | C53 | ||||||||||||||
| C42 | 1 | 3 | 1 | C54 | ||||||||||||||
| C42 | 2 | 2 | 1 | C55 | ||||||||||||||
| C51 | 3 | 2 | C52 | |||||||||||||||
| C51 | 1 | 3 | 1 | C53 | ||||||||||||||
| C51 | 1 | 2 | 2 | C54 | ||||||||||||||
| C51 | 1 | 2 | 2 | C55 | ||||||||||||||
| C52 | 1 | 2 | 2 | C53 | ||||||||||||||
| C52 | 2 | 2 | 1 | C54 | ||||||||||||||
| C52 | 1 | 3 | 1 | C55 | ||||||||||||||
| C53 | 3 | 2 | C54 | |||||||||||||||
| C53 | 2 | 1 | 2 | C55 | ||||||||||||||
| C54 | 3 | 1 | 1 | C55 | ||||||||||||||
Table A2.
The rating performance matrix in the FAHP model.
Table A2.
The rating performance matrix in the FAHP model.
| Aspects | Linguistics Variables | Aspects | ||||||||||||||||
|---|---|---|---|---|---|---|---|---|---|---|---|---|---|---|---|---|---|---|
| (8, 9, 10) | (7, 8, 9) | (6, 7, 8) | (5, 6, 7) | (4, 5, 6) | (3, 4, 5) | (2, 3, 4) | (1, 2, 3) | (1, 1, 1) | (1, 2, 3) | (2, 3, 4) | (3, 4, 5) | (4, 5, 6) | (5, 6, 7) | (6, 7, 8) | (7, 8, 9) | (8, 9, 10) | ||
| C1 | x | C2 | ||||||||||||||||
| C1 | x | C3 | ||||||||||||||||
| C1 | x | C4 | ||||||||||||||||
| C1 | x | C5 | ||||||||||||||||
| C2 | x | C3 | ||||||||||||||||
| C2 | x | C4 | ||||||||||||||||
| C2 | x | C5 | ||||||||||||||||
| C3 | x | C4 | ||||||||||||||||
| C3 | x | C5 | ||||||||||||||||
| C4 | x | C5 | ||||||||||||||||
Table A3.
The integrated fuzzy comparison matrix in the FAHP model.
Table A3.
The integrated fuzzy comparison matrix in the FAHP model.
| Aspects | Quality (C1) | Cost (C2) | Delivery (C3) | Technology (C4) | Environment (C5) |
|---|---|---|---|---|---|
| Quality (C1) | (1, 1, 1) | (1, 2, 3) | (1, 2, 3) | (2, 3, 4) | (1, 2, 3) |
| Cost (C2) | (1/3, 1/2, 1) | (1, 1, 1) | (3, 4, 5) | (2, 3, 4) | (1/3, 1/2, 1) |
| Delivery (C3) | (1/3, 1/2, 1) | (1/5, 1/4, 1/3) | (1, 1, 1) | (1/4, 1/3, 1/2) | (1/5, 1/4, 1/3) |
| Technology (C4) | (1/4, 1/3, 1/2) | (1/4, 1/3, 1/2) | (2, 3, 4) | (1, 1, 1) | (1/3, 1/2, 1) |
| Environment (C5) | (1/3, 1/2, 1) | (1, 2, 3) | (3, 4, 5) | (1, 2, 3) | (1, 1, 1) |
Table A4.
The defuzzied comparison matrix in the FAHP model.
Table A4.
The defuzzied comparison matrix in the FAHP model.
| Aspects | Quality (C1) | Cost (C2) | Delivery (C3) | Technology (C4) | Environment (C5) |
|---|---|---|---|---|---|
| Quality (C1) | 1 | 1.7321 | 1.7321 | 2.8284 | 1.7321 |
| Cost (C2) | 0.5774 | 1 | 3.8730 | 2.8284 | 0.5774 |
| Delivery (C3) | 0.5774 | 0.2582 | 1 | 0.3536 | 0.2582 |
| Technology (C4) | 0.3536 | 0.3536 | 2.8284 | 1 | 0.5774 |
| Environment (C5) | 0.5774 | 1.7321 | 3.8730 | 1.7321 | 1 |
| Total | 3.0856 | 5.0759 | 13.3064 | 8.7425 | 4.1450 |
Table A5.
The normalized matrix in the FAHP model.
Table A5.
The normalized matrix in the FAHP model.
| Aspects | Quality (C1) | Cost (C2) | Delivery (C3) | Technology (C4) | Environment (C5) | Priority Vector |
|---|---|---|---|---|---|---|
| Quality (C1) | 0.3241 | 0.3412 | 0.1302 | 0.3235 | 0.4179 | 0.3074 |
| Cost (C2) | 0.1871 | 0.1970 | 0.2911 | 0.3235 | 0.1393 | 0.2276 |
| Delivery (C3) | 0.1871 | 0.0509 | 0.0752 | 0.0404 | 0.0623 | 0.0832 |
| Technology (C4) | 0.1146 | 0.0697 | 0.2126 | 0.1144 | 0.1393 | 0.1301 |
| Environment (C5) | 0.1871 | 0.3412 | 0.2911 | 0.1981 | 0.2413 | 0.2518 |
| Total | 1 | 1 | 1 | 1 | 1 | 1 |
Table A6.
The integrated fuzzy comparison matrix in the FAHP model.
Table A6.
The integrated fuzzy comparison matrix in the FAHP model.
| Criteria | C11 | C12 | C13 | C21 | ||||||||
|---|---|---|---|---|---|---|---|---|---|---|---|---|
| C11. Supply availability | 1.00 | 1.00 | 1.00 | 1.22 | 1.93 | 2.86 | 0.52 | 0.87 | 1.55 | 0.31 | 0.46 | 0.87 |
| C12. Defect rate | 0.35 | 0.52 | 0.82 | 1.00 | 1.00 | 1.00 | 0.49 | 0.80 | 1.35 | 0.49 | 0.80 | 1.35 |
| C13. Customer complaint | 0.64 | 1.15 | 1.93 | 0.74 | 1.25 | 2.05 | 1.00 | 1.00 | 1.00 | 1.06 | 1.78 | 2.70 |
| C21. Purchasing cost | 1.15 | 2.17 | 3.18 | 0.74 | 1.25 | 2.05 | 0.37 | 0.56 | 0.94 | 1.00 | 1.00 | 1.00 |
| C22. Logistics cost | 0.49 | 0.80 | 1.35 | 0.74 | 1.25 | 2.05 | 0.74 | 1.25 | 2.05 | 0.30 | 0.43 | 0.76 |
| C23. Quantity discount | 0.39 | 0.61 | 1.08 | 0.56 | 0.87 | 1.43 | 0.49 | 0.80 | 1.35 | 0.39 | 0.61 | 1.08 |
| C31. Order fulfillment rate | 0.39 | 0.61 | 1.08 | 0.56 | 0.87 | 1.43 | 0.49 | 0.80 | 1.35 | 0.39 | 0.61 | 1.08 |
| C32. Just in time delivery | 0.52 | 0.87 | 1.55 | 0.74 | 1.25 | 2.05 | 1.64 | 2.70 | 3.73 | 2.35 | 3.37 | 4.37 |
| C41. Tracking and tracing system | 1.32 | 2.35 | 3.37 | 1.08 | 1.74 | 2.46 | 0.87 | 1.25 | 1.74 | 0.52 | 0.87 | 1.55 |
| C42. R&D capability | 0.46 | 0.74 | 1.18 | 1.32 | 2.35 | 3.37 | 1.22 | 1.93 | 2.86 | 0.52 | 0.87 | 1.55 |
| C51. Wastewater treatment | 1.06 | 1.78 | 2.70 | 0.26 | 0.36 | 0.57 | 0.87 | 1.25 | 1.74 | 0.52 | 0.87 | 1.55 |
| C52. Solid waste generation | 0.49 | 0.80 | 1.35 | 1.32 | 2.35 | 3.37 | 2.05 | 3.10 | 4.13 | 1.32 | 2.35 | 3.37 |
| C53. Energy consumption | 0.49 | 0.80 | 1.35 | 1.32 | 2.35 | 3.37 | 2.05 | 3.10 | 4.13 | 0.46 | 0.74 | 1.18 |
| C54. Air pollution | 0.49 | 0.80 | 1.35 | 0.46 | 0.74 | 1.18 | 2.05 | 3.10 | 4.13 | 0.46 | 0.74 | 1.18 |
| C55. Corporate social responsibility | 0.80 | 1.25 | 1.89 | 0.46 | 0.74 | 1.18 | 0.50 | 0.74 | 1.08 | 0.30 | 0.43 | 0.76 |
| Criteria | C22 | C23 | C31 | C32 | ||||||||
| C11. Supply availability | 0.74 | 1.25 | 2.05 | 0.92 | 1.64 | 2.55 | 0.92 | 1.64 | 2.55 | 0.64 | 1.15 | 1.93 |
| C12. Defect rate | 0.49 | 0.80 | 1.35 | 0.70 | 1.15 | 1.78 | 0.70 | 1.15 | 1.78 | 0.49 | 0.80 | 1.35 |
| C13. Customer complaint | 0.49 | 0.80 | 1.35 | 0.74 | 1.25 | 2.05 | 0.74 | 1.25 | 2.05 | 0.27 | 0.37 | 0.61 |
| C21. Purchasing cost | 1.32 | 2.35 | 3.37 | 0.92 | 1.64 | 2.55 | 0.92 | 1.64 | 2.55 | 0.23 | 0.30 | 0.43 |
| C22. Logistics cost | 1.00 | 1.00 | 1.00 | 0.80 | 1.25 | 1.89 | 0.87 | 1.32 | 1.97 | 2.99 | 4.04 | 5.07 |
| C23. Quantity discount | 0.53 | 0.80 | 1.25 | 1.00 | 1.00 | 1.00 | 1.78 | 2.86 | 3.90 | 0.92 | 1.43 | 2.05 |
| C31. Order fulfillment rate | 0.51 | 0.76 | 1.15 | 0.26 | 0.35 | 0.56 | 1.00 | 1.00 | 1.00 | 2.83 | 3.87 | 4.89 |
| C32. Just in time delivery | 0.20 | 0.25 | 0.33 | 0.49 | 0.70 | 1.08 | 0.20 | 0.26 | 0.35 | 1.00 | 1.00 | 1.00 |
| C41. Tracking and tracing system | 0.20 | 0.25 | 0.33 | 0.49 | 0.70 | 1.08 | 0.54 | 0.80 | 1.05 | 0.28 | 0.39 | 0.66 |
| C42. R&D capability | 0.51 | 0.76 | 1.15 | 0.35 | 0.40 | 0.46 | 0.34 | 0.51 | 0.87 | 0.85 | 1.35 | 2.17 |
| C51. Wastewater treatment | 0.56 | 0.87 | 1.43 | 0.35 | 0.40 | 0.46 | 0.28 | 0.39 | 0.66 | 0.28 | 0.39 | 0.66 |
| C52. Solid waste generation | 1.32 | 2.35 | 3.37 | 0.51 | 0.55 | 0.61 | 0.28 | 0.39 | 0.66 | 0.85 | 1.35 | 2.17 |
| C53. Energy consumption | 0.35 | 0.53 | 0.87 | 0.21 | 0.27 | 0.37 | 0.28 | 0.39 | 0.66 | 0.25 | 0.34 | 0.53 |
| C54. Air pollution | 0.35 | 0.53 | 0.87 | 0.26 | 0.30 | 0.37 | 0.34 | 0.51 | 0.87 | 0.40 | 0.56 | 0.87 |
| C55. Corporate social responsibility | 0.70 | 1.15 | 1.78 | 0.37 | 0.42 | 0.49 | 0.34 | 0.51 | 0.87 | 1.32 | 2.05 | 2.99 |
| Criteria | C41 | C42 | C51 | C52 | ||||||||
| C11. Supply availability | 0.30 | 0.43 | 0.76 | 0.85 | 1.35 | 2.17 | 0.37 | 0.56 | 0.94 | 0.74 | 1.25 | 2.05 |
| C12. Defect rate | 0.41 | 0.57 | 0.92 | 0.30 | 0.43 | 0.76 | 1.74 | 2.77 | 3.78 | 0.30 | 0.43 | 0.76 |
| C13. Customer complaint | 0.57 | 0.80 | 1.15 | 0.35 | 0.52 | 0.82 | 0.57 | 0.80 | 1.15 | 0.24 | 0.32 | 0.49 |
| C21. Purchasing cost | 0.64 | 1.15 | 1.93 | 0.64 | 1.15 | 1.93 | 0.64 | 1.15 | 1.93 | 0.30 | 0.43 | 0.76 |
| C22. Logistics cost | 2.99 | 4.04 | 5.07 | 0.87 | 1.32 | 1.97 | 0.70 | 1.15 | 1.78 | 0.30 | 0.43 | 0.76 |
| C23. Quantity discount | 0.92 | 1.43 | 2.05 | 2.17 | 2.51 | 2.83 | 2.17 | 2.51 | 2.83 | 1.64 | 1.82 | 1.97 |
| C31. Order fulfillment rate | 0.96 | 1.25 | 1.84 | 1.15 | 1.95 | 2.93 | 1.52 | 2.55 | 3.57 | 1.52 | 2.55 | 3.57 |
| C32. Just in time delivery | 1.52 | 2.55 | 3.57 | 0.46 | 0.74 | 1.18 | 1.52 | 2.55 | 3.57 | 0.46 | 0.74 | 1.18 |
| C41. Tracking and tracing system | 1.00 | 1.00 | 1.00 | 1.15 | 1.78 | 2.49 | 0.33 | 0.49 | 0.76 | 1.15 | 1.78 | 2.49 |
| C42. R&D capability | 0.40 | 0.56 | 0.87 | 1.00 | 1.00 | 1.00 | 1.93 | 2.64 | 3.27 | 1.00 | 1.32 | 1.72 |
| C51. Wastewater treatment | 1.32 | 2.05 | 2.99 | 0.31 | 0.38 | 0.52 | 1.00 | 1.00 | 1.00 | 0.30 | 0.43 | 0.76 |
| C52. Solid waste generation | 0.40 | 0.56 | 0.87 | 0.58 | 0.76 | 1.00 | 1.32 | 2.35 | 3.37 | 1.00 | 1.00 | 1.00 |
| C53. Energy consumption | 0.35 | 0.52 | 0.82 | 0.27 | 0.32 | 0.39 | 0.92 | 1.64 | 2.55 | 0.49 | 0.80 | 1.35 |
| C54. Air pollution | 0.35 | 0.52 | 0.82 | 0.27 | 0.32 | 0.39 | 0.49 | 0.80 | 1.35 | 0.37 | 0.56 | 0.94 |
| C55. Corporate social responsibility | 0.70 | 1.15 | 1.78 | 0.64 | 0.87 | 1.25 | 0.49 | 0.80 | 1.35 | 0.25 | 0.34 | 0.53 |
| Criteria | C53 | C54 | C55 | |||||||||
| C11. Supply availability | 0.74 | 1.25 | 2.05 | 0.74 | 1.25 | 2.05 | 0.53 | 0.80 | 1.25 | |||
| C12. Defect rate | 0.30 | 0.43 | 0.76 | 0.85 | 1.35 | 2.17 | 0.85 | 1.35 | 2.17 | |||
| C13. Customer complaint | 0.24 | 0.32 | 0.49 | 0.24 | 0.32 | 0.49 | 0.92 | 1.35 | 2.00 | |||
| C21. Purchasing cost | 0.85 | 1.35 | 2.17 | 0.85 | 1.35 | 2.17 | 1.32 | 2.35 | 3.37 | |||
| C22. Logistics cost | 1.15 | 1.89 | 2.83 | 1.15 | 1.89 | 2.83 | 0.56 | 0.87 | 1.43 | |||
| C23. Quantity discount | 2.70 | 3.73 | 4.74 | 2.70 | 3.31 | 3.90 | 2.05 | 2.40 | 2.72 | |||
| C31. Order fulfillment rate | 1.52 | 2.55 | 3.57 | 1.15 | 1.95 | 2.93 | 1.15 | 1.95 | 2.93 | |||
| C32. Just in time delivery | 1.89 | 2.93 | 3.95 | 1.15 | 1.78 | 2.49 | 0.33 | 0.49 | 0.76 | |||
| C41. Tracking and tracing system | 1.22 | 1.93 | 2.86 | 1.22 | 1.93 | 2.86 | 0.56 | 0.87 | 1.43 | |||
| C42. R&D capability | 2.55 | 3.17 | 3.76 | 2.55 | 3.17 | 3.76 | 0.80 | 1.15 | 1.55 | |||
| C51. Wastewater treatment | 0.39 | 0.61 | 1.08 | 0.74 | 1.25 | 2.05 | 0.74 | 1.25 | 2.05 | |||
| C52. Solid waste generation | 0.74 | 1.25 | 2.05 | 1.06 | 1.78 | 2.70 | 1.89 | 2.93 | 3.95 | |||
| C53. Energy consumption | 1.00 | 1.00 | 1.00 | 1.51 | 1.89 | 2.44 | 3.13 | 4.19 | 5.23 | |||
| C54. Air pollution | 0.41 | 0.53 | 0.66 | 1.00 | 1.00 | 1.00 | 2.48 | 3.10 | 3.86 | |||
| C55. Corporate social responsibility | 0.19 | 0.24 | 0.32 | 0.26 | 0.32 | 0.40 | 1.00 | 1.00 | 1.00 | |||
References
- Zhang, L.J.; Liu, R.; Liu, H.C.; Shi, H. Green supplier evaluation and selections: A state-of-the-art literature review of models, methods, and applications. Math. Probl. Eng. 2020, 2020, 1783421. [Google Scholar] [CrossRef]
- Your Supply Chain Needs a Sustainability Strategy. Available online: https://www.bcg.com/publications/2020/supply-chain-needs-sustainability-strategy (accessed on 12 July 2021).
- COVID-19 Impacts on Supply Chains, Sustainability and Climate Change. Available online: https://www2.deloitte.com/global/en/blog/responsible-business-blog/2020/covid-19-impacts-on-supply-chains-sustainability-and-climate-change.html (accessed on 12 July 2021).
- Gupta, S.; Soni, U.; Kumar, G. Green supplier selection using multi-criterion decision making under fuzzy environment: A case study in automotive industry. Comput. Ind. Eng. 2019, 136, 663–680. [Google Scholar] [CrossRef]
- Sánchez-Flores, R.B.; Cruz-Sotelo, S.E.; Ojeda-Benitez, S.; Ramírez-Barreto, M. Sustainable Supply Chain Management—A Literature Review on Emerging Economies. Sustainability 2020, 12, 6972. [Google Scholar] [CrossRef]
- Main Criteria in Supplier Evaluation. Available online: https://dnbvietnam.com/tu-van/tieu-chi-danh-gia-nha-cung-cap.html (accessed on 12 July 2021).
- Luthra, S.; Govindan, K.; Kannan, D.; Mangla, S.K.; Garg, C.P. An integrated framework for sustainable supplier selection and evaluation in supply chains. J. Clean. Prod. 2017, 140, 1686–1698. [Google Scholar] [CrossRef]
- Memari, A.; Dargi, A.; Jokar, M.R.A.; Ahmad, R.; Rahim, A.R.A. Sustainable supplier selection: A multi-criteria intuitionistic fuzzy TOPSIS method. J. Manuf. Syst. 2019, 50, 9–24. [Google Scholar] [CrossRef]
- Awasthi, A.; Govindan, K.; Gold, S. Multi-tier sustainable global supplier selection using a fuzzy AHP-VIKOR based approach. Int. J. Prod. Econ. 2018, 195, 106–117. [Google Scholar] [CrossRef] [Green Version]
- Chan, F.T.; Kumar, N.; Tiwari, M.K.; Lau, H.C.; Choy, K. Global supplier selection: A fuzzy-AHP approach. Int. J. Prod. Res. 2008, 46, 3825–3857. [Google Scholar] [CrossRef]
- Agarwal, G.; Vijayvargy, L. An application of supplier selection in supply chain for modeling of intangibles: A case study of multinational Food Coffee industry. Afr. J. Bus. Manag. 2011, 5, 11505–11520. [Google Scholar] [CrossRef]
- Mani, V.; Agrawal, R.; Sharma, V. Supplier selection using social sustainability: AHP based approach in India. Int. Strateg. Manag. Rev. 2014, 2, 98–112. [Google Scholar] [CrossRef] [Green Version]
- Dweiri, F.; Kumar, S.; Khan, S.A.; Jain, V. Designing an integrated AHP based decision support system for supplier selection in automotive industry. Expert Syst. Appl. 2016, 62, 273–283. [Google Scholar] [CrossRef]
- Fallahpour, A.; Olugu, E.U.; Musa, S.N.; Khezrimotlagh, D.; Wong, K.Y. An integrated model for green supplier selection under fuzzy environment: Application of data envelopment analysis and genetic programming approach. Neural Comput. Appl. 2016, 27, 707–725. [Google Scholar] [CrossRef]
- Govindan, K.; Kadziński, M.; Sivakumar, R. Application of a novel PROMETHEE-based method for construction of a group compromise ranking to prioritization of green suppliers in food supply chain. Omega 2017, 71, 129–145. [Google Scholar] [CrossRef]
- Azimifard, A.; Moosavirad, S.H.; Ariafar, S. Selecting sustainable supplier countries for Iran’s steel industry at three levels by using AHP and TOPSIS methods. Resour. Policy 2018, 57, 30–44. [Google Scholar] [CrossRef]
- Laosirihongthong, T.; Samaranayake, P.; Nagalingam, S. A holistic approach to supplier evaluation and order allocation towards sustainable procurement. Benchmark. Int. J. 2019, 26, 2543–2573. [Google Scholar] [CrossRef]
- Pishchulov, G.; Trautrims, A.; Chesney, T.; Gold, S.; Schwab, L. The Voting Analytic Hierarchy Process revisited: A revised method with application to sustainable supplier selection. Int. J. Prod. Econ. 2019, 211, 166–179. [Google Scholar] [CrossRef]
- Xu, Z.; Qin, J.; Liu, J.; Martinez, L. Sustainable supplier selection based on AHPSort II in interval type-2 fuzzy environment. Inf. Sci. 2019, 483, 273–293. [Google Scholar] [CrossRef]
- Dospinescu, N.; Dospinescu, O.; Tatarusanu, M. Analysis of the Influence Factors on the Reputation of Food-Delivery Companies: Evidence from Romania. Sustainability 2020, 12, 4142. [Google Scholar] [CrossRef]
- Manuele dos Santos, I.; Reis Peixoto Roselli, L.; Luiz Gomes da Silva, A.; Hazin Alencar, L. A Supplier Selection Model for a Wholesaler and Retailer Company Based on FITradeoff Multicriteria Method. Math. Probl. Eng. 2020. [Google Scholar] [CrossRef]
- Wang, C.-N.; Dang, T.-T.; Nguyen, N.-A.-T. Outsourcing Reverse Logistics for E-Commerce Retailers: A Two-Stage Fuzzy Optimization Approach. Axioms 2021, 10, 34. [Google Scholar] [CrossRef]
- Cheng, C.C.; Chang, Y.Y.; Chen, C.T. Construction of a service quality scale for the online food delivery industry. Int. J. Hosp. Manag. 2021, 95, 102938. [Google Scholar] [CrossRef]
- Wang, C.-N.; Nguyen, N.-A.-T.; Dang, T.-T.; Lu, C.-M. A Compromised Decision-Making Approach to Third-Party Logistics Selection in Sustainable Supply Chain Using Fuzzy AHP and Fuzzy VIKOR Methods. Mathematics 2021, 9, 886. [Google Scholar] [CrossRef]
- Wang, C.N.; Nguyen, N.A.T.; Dang, T.T.; Bayer, J. A Two-Stage Multiple Criteria Decision Making for Site Selection of Solar Photovoltaic (PV) Power Plant: A Case Study in Taiwan. IEEE Access 2021, 9, 75509–75525. [Google Scholar]
- Zhu, G.N.; Hu, J.; Qi, J.; Gu, C.C.; Peng, Y.H. An integrated AHP and VIKOR for design concept evaluation based on rough number. Adv. Eng. Inform. 2015, 29, 408–418. [Google Scholar] [CrossRef]
- Saaty, T.L. How to make a decision: The analytic hierarchy process. Eur. J. Oper. Res. 1990, 48, 9–26. [Google Scholar] [CrossRef]
- Wang, T.C.; Chen, Y.H. Applying consistent fuzzy preference relations to partnership selection. Omega 2007, 35, 384–388. [Google Scholar] [CrossRef]
- Seçme, N.Y.; Bayrakdaroğlu, A.; Kahraman, C. Fuzzy performance evaluation in Turkish banking sector using analytic hierarchy process and TOPSIS. Expert Syst. Appl. 2009, 36, 11699–11709. [Google Scholar] [CrossRef]
- Opricovic, S.; Tzeng, G.H. Extended VIKOR method in comparison with outranking methods. Eur. J. Oper. Res. 2007, 178, 514–529. [Google Scholar] [CrossRef]
- Lee, A.H.; Kang, H.Y.; Hsu, C.F.; Hung, H.C. A green supplier selection model for high-tech industry. Expert Syst. Appl. 2009, 36, 7917–7927. [Google Scholar] [CrossRef]
- Büyüközkan, G.; Çifçi, G. A novel fuzzy multi-criteria decision framework for sustainable supplier selection with incomplete information. Comput. Ind. 2011, 62, 164–174. [Google Scholar] [CrossRef]
- Shaw, K.; Shankar, R.; Yadav, S.S.; Thakur, L.S. Supplier selection using fuzzy AHP and fuzzy multi-objective linear programming for developing low carbon supply chain. Expert Syst. Appl. 2012, 39, 8182–8192. [Google Scholar] [CrossRef]
- Govindan, K.; Khodaverdi, R.; Jafarian, A. A fuzzy multi criteria approach for measuring sustainability performance of a supplier based on triple bottom line approach. J. Clean. Prod. 2013, 47, 345–354. [Google Scholar] [CrossRef]
- Shen, L.; Olfat, L.; Govindan, K.; Khodaverdi, R.; Diabat, A. A fuzzy multi criteria approach for evaluating green supplier’s performance in green supply chain with linguistic preferences. Resour. Conserv. Recycl. 2013, 74, 170–179. [Google Scholar] [CrossRef]
- Kannan, D.; Khodaverdi, R.; Olfat, L.; Jafarian, A.; Diabat, A. Integrated fuzzy multi criteria decision making method and multi-objective programming approach for supplier selection and order allocation in a green supply chain. J. Clean. Prod. 2013, 47, 355–367. [Google Scholar] [CrossRef]
- Dou, Y.; Zhu, Q.; Sarkis, J. Evaluating green supplier development programs with a grey-analytical network process-based methodology. Eur. Oper. Res. 2014, 233, 420–431. [Google Scholar] [CrossRef]
- Kannan, D.; de Sousa Jabbour, A.B.L.; Jabbour, C.J.C. Selecting green suppliers based on GSCM practices: Using fuzzy TOPSIS applied to a Brazilian electronics company. Eur. Oper. Res. 2014, 233, 432–447. [Google Scholar] [CrossRef]
- Wong, J.T. Dynamic procurement risk management with supplier portfolio selection and order allocation under green market segmentation. J. Clean. Prod. 2020, 253, 119835. [Google Scholar] [CrossRef]
- Çalık, A. A novel Pythagorean fuzzy AHP and fuzzy TOPSIS methodology for green supplier selection in the Industry 4.0 era. Soft Comput. 2021, 25, 2253–2265. [Google Scholar] [CrossRef]
- Zadeh, L.A. Fuzzy Sets. Inf. Control 1965, 8, 338–358. [Google Scholar] [CrossRef] [Green Version]
- Sun, C.C. A performance evaluation model by integrating fuzzy AHP and fuzzy TOPSIS methods. Expert Syst. Appl. 2010, 37, 7745–7754. [Google Scholar] [CrossRef]
- Rudnik, K.; Bocewicz, G.; Kucińska-Landwójtowicz, A.; Czabak-Górska, I.D. Ordered fuzzy WASPAS method for selection of improvement projects. Expert Syst. Appl. 2021, 169, 114471. [Google Scholar] [CrossRef]
- Amarasinghe, U.A.; Hoanh, C.T.; D’haeze, D.; Hung, T.Q. Toward sustainable coffee production in Vietnam: More coffee with less water. Agric. Syst. 2015, 136, 96–105. [Google Scholar] [CrossRef]
- Chou, Y.C.; Yen, H.Y.; Dang, V.T.; Sun, C.C. Assessing the Human Resource in Science and Technology for Asian Countries: Application of Fuzzy AHP and Fuzzy TOPSIS. Symmetry 2019, 11, 251. [Google Scholar] [CrossRef] [Green Version]
- Buckley, J.J. Ranking Alternatives Using Fuzzy Numbers. Fuzzy Sets Syst. 1985, 15, 21–31. [Google Scholar] [CrossRef]
- Top 10 Coffee Bean Suppliers in Vietnam. Available online: https://90scoffee.vn/tin-tuc/top-10-nha-cung-cap-ca-phe-uy-tin-tai-tphcm/ (accessed on 7 August 2021).
- Ghalehkhondabi, I.; Maihami, R.; Ahmadi, E. Optimal pricing and environmental improvement for a hazardous waste disposal supply chain with emission penalties. Util. Policy 2020, 62, 101001. [Google Scholar] [CrossRef]
- Wang, C.-N.; Dang, T.-T.; Nguyen, N.-A.-T.; Le, T.-T.-H. Supporting Better Decision-Making: A Combined Grey Model and Data Envelopment Analysis for Efficiency Evaluation in E-Commerce Marketplaces. Sustainability 2020, 12, 385. [Google Scholar] [CrossRef]
- Dobos, I.; Vörösmarty, G. Inventory-related costs in green supplier selection problems with Data Envelopment Analysis (DEA). Int. J. Prod. Econ. 2019, 209, 374–380. [Google Scholar] [CrossRef] [Green Version]
Publisher’s Note: MDPI stays neutral with regard to jurisdictional claims in published maps and institutional affiliations. |
© 2021 by the authors. Licensee MDPI, Basel, Switzerland. This article is an open access article distributed under the terms and conditions of the Creative Commons Attribution (CC BY) license (https://creativecommons.org/licenses/by/4.0/).