Abstract
We present a continuum scale particle transport model for red blood cells following collision arguments, in a diffusive flux formulation. The model is implemented in FOAM, in a framework suitable for haemodynamics simulations and adapted to multi-scaling. Specifically, the framework we present is able to ingest transport coefficient models to be derived, prospectively, from complimentary but independent meso-scale simulations. For present purposes, we consider modern semi-mechanistic rheology models, which we implement and test as proxies for such data. The model is verified against a known analytical solution and shows excellent agreement for high quality meshes and good agreement for typical meshes as used in vascular flow simulations. Simulation results for different size and time scales show that migration of red blood cells does occur on physiologically relevany timescales on small vessels below 1 mm and that the haematocrit concentration modulates the non-Newtonian viscosity. This model forms part of a multi-scale approach to haemorheology and model parameters will be derived from meso-scale simulations using multi-component Lattice Boltzmann methods. The code, haemoFoam, is made available for interested researchers.
1. Introduction
Blood is a non-Newtonian fluid with very complex behaviour deriving from a mesoscopic composition which—minimally described—is a dense, mono-disperse suspension of deformable vesicles suspended in incompressible plasma. Accordingly, blood rheology is dominated by the interaction of cells, with a multitude of models having been proposed to account for such meso-scale effects as deformation, aggregation, and rouleaux formation which underline emergent macroscopic flow properties like concentration dependant viscosity and shear thinning. The authors are currently developing a multi-scale approach, explicitly modelling meso-scale effects using Lattice Boltzmann Models (LBM), in which erythrocyte mechanics are fully resolved, while describing the macro-scale rheology using particle transport modelling and quasi-mechanistic non-Newtonian rheology models described using traditional Eulerian numerics.We give the rationale of this pairing of methodologies shortly, in the next sub-section.In essence, though, it is intended that the latter model will eventually be parameterised using LBM data. Here, we present the continuum mechanical part of this multi-scale modelling approach, which is designed to facilitate the simulation of realistic vessel geometries and spatially complex flow patterns.
Multi-scale models are necessary in many applications. In meteorology, the Eulerian grids of the macroscopic simulation are characterised by a 1 km spatial resolution. Clearly it is necessary to account for more local variation of field variables and macroscopic atmospheric simulations are parameterised based on data gathered from, e.g., semi-analytic meso-scale models of convection [1]. (Note, we use the term meso-scale (macroscale) to identify the shortest (largest) length scale considered. We use the term continuum-scale to describe a scale where particle dynamics are neglected and integral bulk material parameters are used—within the scope of this paper macroscale is treated as continuum-scale).
Similarly, in the simulation of turbulent flow fields, temporal or spatial averages are used to derive macroscopic turbulence properties, like an isotropic turbulent viscosity, which describes the statistical effect of the inherently chaotic, and anisotropic nature of meso-scale and micro-scale turbulence. While the micro-scale can be simulated (Direct Numerical Simulation), this approach is limited by size, Reynolds number and computational resource and thus it is mostly used in fundamental research and in the development and parametrisation the macro-scale model.
In a high particle load suspension like blood, many types of mechanical interactions between particles and carrier fluid occur [2]. A variety of models are used from 1 to d reduced order models, through meso-scale models to continuum-scale models [3]. Meso-scale modelling, e.g., Particle Dynamics Methods [4], or the multi-component Lattice Boltzmann Method [5] has a widely acknowledged facility for Lagrangian particulate flows [6,7,8,9,10] and has been employed to describe these interactions and the dynamics of the collisions in detail. Very recently, we have developed a single framework, three-dimensional methodology for capturing detailed, particle-scale interactions between neutrally buoyant suspended vesicles (i.e., erythrocytes), using our novel chromodynamics multi-component Lattice Boltzmann method variant [11]. We have previously shown that this same essential model is able to capture detailed hydrodynamic interactions, lubrication effects and ballistic collisions between transported particles, in two dimensional simulations containing O(1000) liquid drops at high volume faction [12]. Current work aims to scale these models up, to allow extraction, through statistical averaging and measuring mechanical dissipation, of relevant transport coefficients, e.g.,
Above, and D denote kinematic viscosity and diffusion co-efficient and and denote particle density and local shear rate.
As with direct numerical simulation in turbulence modelling, finite computational resource means that these detailed explicit particulate models are limited to small volumes containing relatively few particles in their simulation domain (an the order of magnitude of hundreds to thousands at the time of writing). To address the much greater scales of medical significance, it is, therefore, necessary to develop macro or continuum scale models, which encapsulate an integrated effect of these interactions, without explicitly resolving them. Crucially, these continuum models must be amenable to parametrisation, in the present context using meso-scale information such as that encapsulated in the data of Burgin [12].
Based on the work of Leighton and Acrivos [13], and Phillips et al. [14], we present here a macro-scale, or continuum-scale model for haematocrit transport, which, together with modern formulations of “quasi-Newtonian” (i.e., not considering viscoelastic and viscoplastic effects) non-Newtonian model, allows for the simulation of macroscopic flows, accounting for the integral effect of meso-scopic phenomena.
Currently, the models which have been proposed for continuum-scale haematocrit transport models can, roughly, be divided [15] into suspension balance models [13,16] and diffusive flux models [14].
Suspension balance models use an Euler–Euler mixture modelling approach, where the carrier fluid and the particle load are represented as separate species, with a transport Equation (typically convection-diffusion) and physical transport properties for each species; in diffusive flux models, the suspension is modelled as a single species, with the particle volume fraction being modelled as a scalar property, which influences the bulk transport coefficients.
Our macroscopic model is a particle transport model after Phillips [14]. It follows the collision arguments by Leighton and Acrivios [13] by describing the particle migration based on the gradients of shear strain, concentration and viscosity. The local concentration of haematocrit is then used to establish the local effective viscosity.
The haematocrit distribution emerges, locally, from a balance of the competing effects of diffusion-driven flux down the local concentration gradient (which, for steady, developed flow, lies in the radial direction) and shear-induced migration (which, for steady, developed, flows, would be in the negative radial direction). Clearly, the problem of flow-concentration coupling is made still more complex since the diffusion co-efficient varies with local shear rate and particle concentration.
Previous attempts to implement this class of particle transport model in a finite volume code were either limited to a single viscosity model (due to the necessity of linearising the source terms [17]) or they had to introduce damping terms (to suppress instability [18], mostly due to the fact that they attempted to implement the non-linear transport equation for haematocrit into commercial software packages (Fluent), which does not allow a fully implicit additional transport equation in user subroutines).
The framework we present in this work expands on those commonly used in the simulation of clinically relevant vascular flows in the following important aspects:
- It includes a transport equation for the most important group of suspended particles based on continuum-scale, semi-mechanistic modelling.
- It includes more sophisticated non-Newtonian viscosity models that couple to local haematocrit concentration in addition to shear rate in the viscosity function.
- The implementation does not require linearisation of the viscosity source term in the haematocrit transport equation, which, crucially, allows for other viscosity models to be implemented eventually.
It is implemented using the Field Operation And Manipulation (FOAM) framework. FOAM, or OpenFOAM, is an open source library which allows easy implementation of Finite Volume Method (FVM) solvers and achieves stability without artificial damping by implementing the non-linear terms in a hybrid explicit-implicit fashion which allows stable simulations even in realistic physiological geometries at high rates.
2. Materials and Methods
2.1. Particle Migration Model
In a particle transport model, the transport of haematocrit is dominated by advection—following the bulk flow—variations in concentration are evened by diffusive processes, and the migration within the bulk is driven by a migration pressure. This migration pressure is the result of two phenomena: (1) spatial variation of collision (interaction) frequency and (2) spatial variation of viscosity [14]
A detailed treatise on the rationale behind the compression arguments can be found in Leighton and Acrvios, and Phillips [13,14], we only give a brief outline at this point.
2.1.1. Spatial Variation of Collision Frequency
Particles that are moving relative to each other in neighbouring shear surfaces will experience collisions. The frequency of these collisions is proportional to the shear rate , the particle concentration , and the particle collision radius a. In a field of constant concentration and constant shear, , the collisions are in equilibrium either side of the shear surface, and no net migration will occur. In the presence of gradients of shear rate or concentration, the imbalance of collisions will lead to a “migration pressure” down the gradient. This collision driven migration pressure can be described as a function of . Using a proportionality factor of and assuming a displacement proportional to the particle radius a, the migratory flux due to variations in collision frequency can be expressed as (using the chain rule):
2.1.2. Spatial Variation of Viscosity
The displacement of particles after a collision is moderated by viscous effects. In a constant viscosity field the displacement is isotropic and thus balanced with no net migration effects. In a viscosity gradient the displacement will be less damped in direction of the lower viscosity, leading to a net migration effect down the viscosity gradient.
The displacement velocity is proportional to the relative change in viscosity over a distance that is of order a: . With the displacement frequency scaling with , and a proportionality factor of , the migratory flux due to viscosity gradient can be described as (flux is proportional to ):
The scalar transport equation for haematocrit, , is then (neglecting molecular diffusion, Brownian motion), where is the total differential:
with a, particle radius, , shear strain rate magnitude, , dynamic viscosity, and , collision parameters.
Typically, the viscosity is , which makes the last source term non-linear, which can, in turn, make the solution of this transport equation difficult.
Previous attempts to solve this problem analytically or implement this type of migration model in a numerical model used linearisation of this source term, which involves the derivative of in both and , and thus limits the model to a specific viscosity model, for which it has been implemented [17,19]. Our current implementation deals with the non-linear viscosity source term in a way that leaves the viscosity gradient term intact and is thus agnostic to the rheology model used.
2.2. Rheology Models
It is obvious from the third RHS term in Equation (5), that the particle transport strongly depends on the rheology model it is coupled with. This model implementation aims to be independent of the rheology model. The draw-back of this approach is that errors present in the rheology model, which influence the particle transport, cannot be calibrated out with the parameters of the migration model alone, but the combined set of model parameters will need to be found for any new rheology model that is to be implemented.
Typically, only the shear thinning effects are taken into account, when modelling the non-Newtonian properties of blood in CFD. Common models are of the Carreau and Casson types. In these models, the haematocrit concentration is only used as a bulk parameter in the parametrisation, if at all. Our framework, incorporating the transport of haematocrit, allows the rheological model to take the local particle concentration into account when calculating the local, effective viscosity.
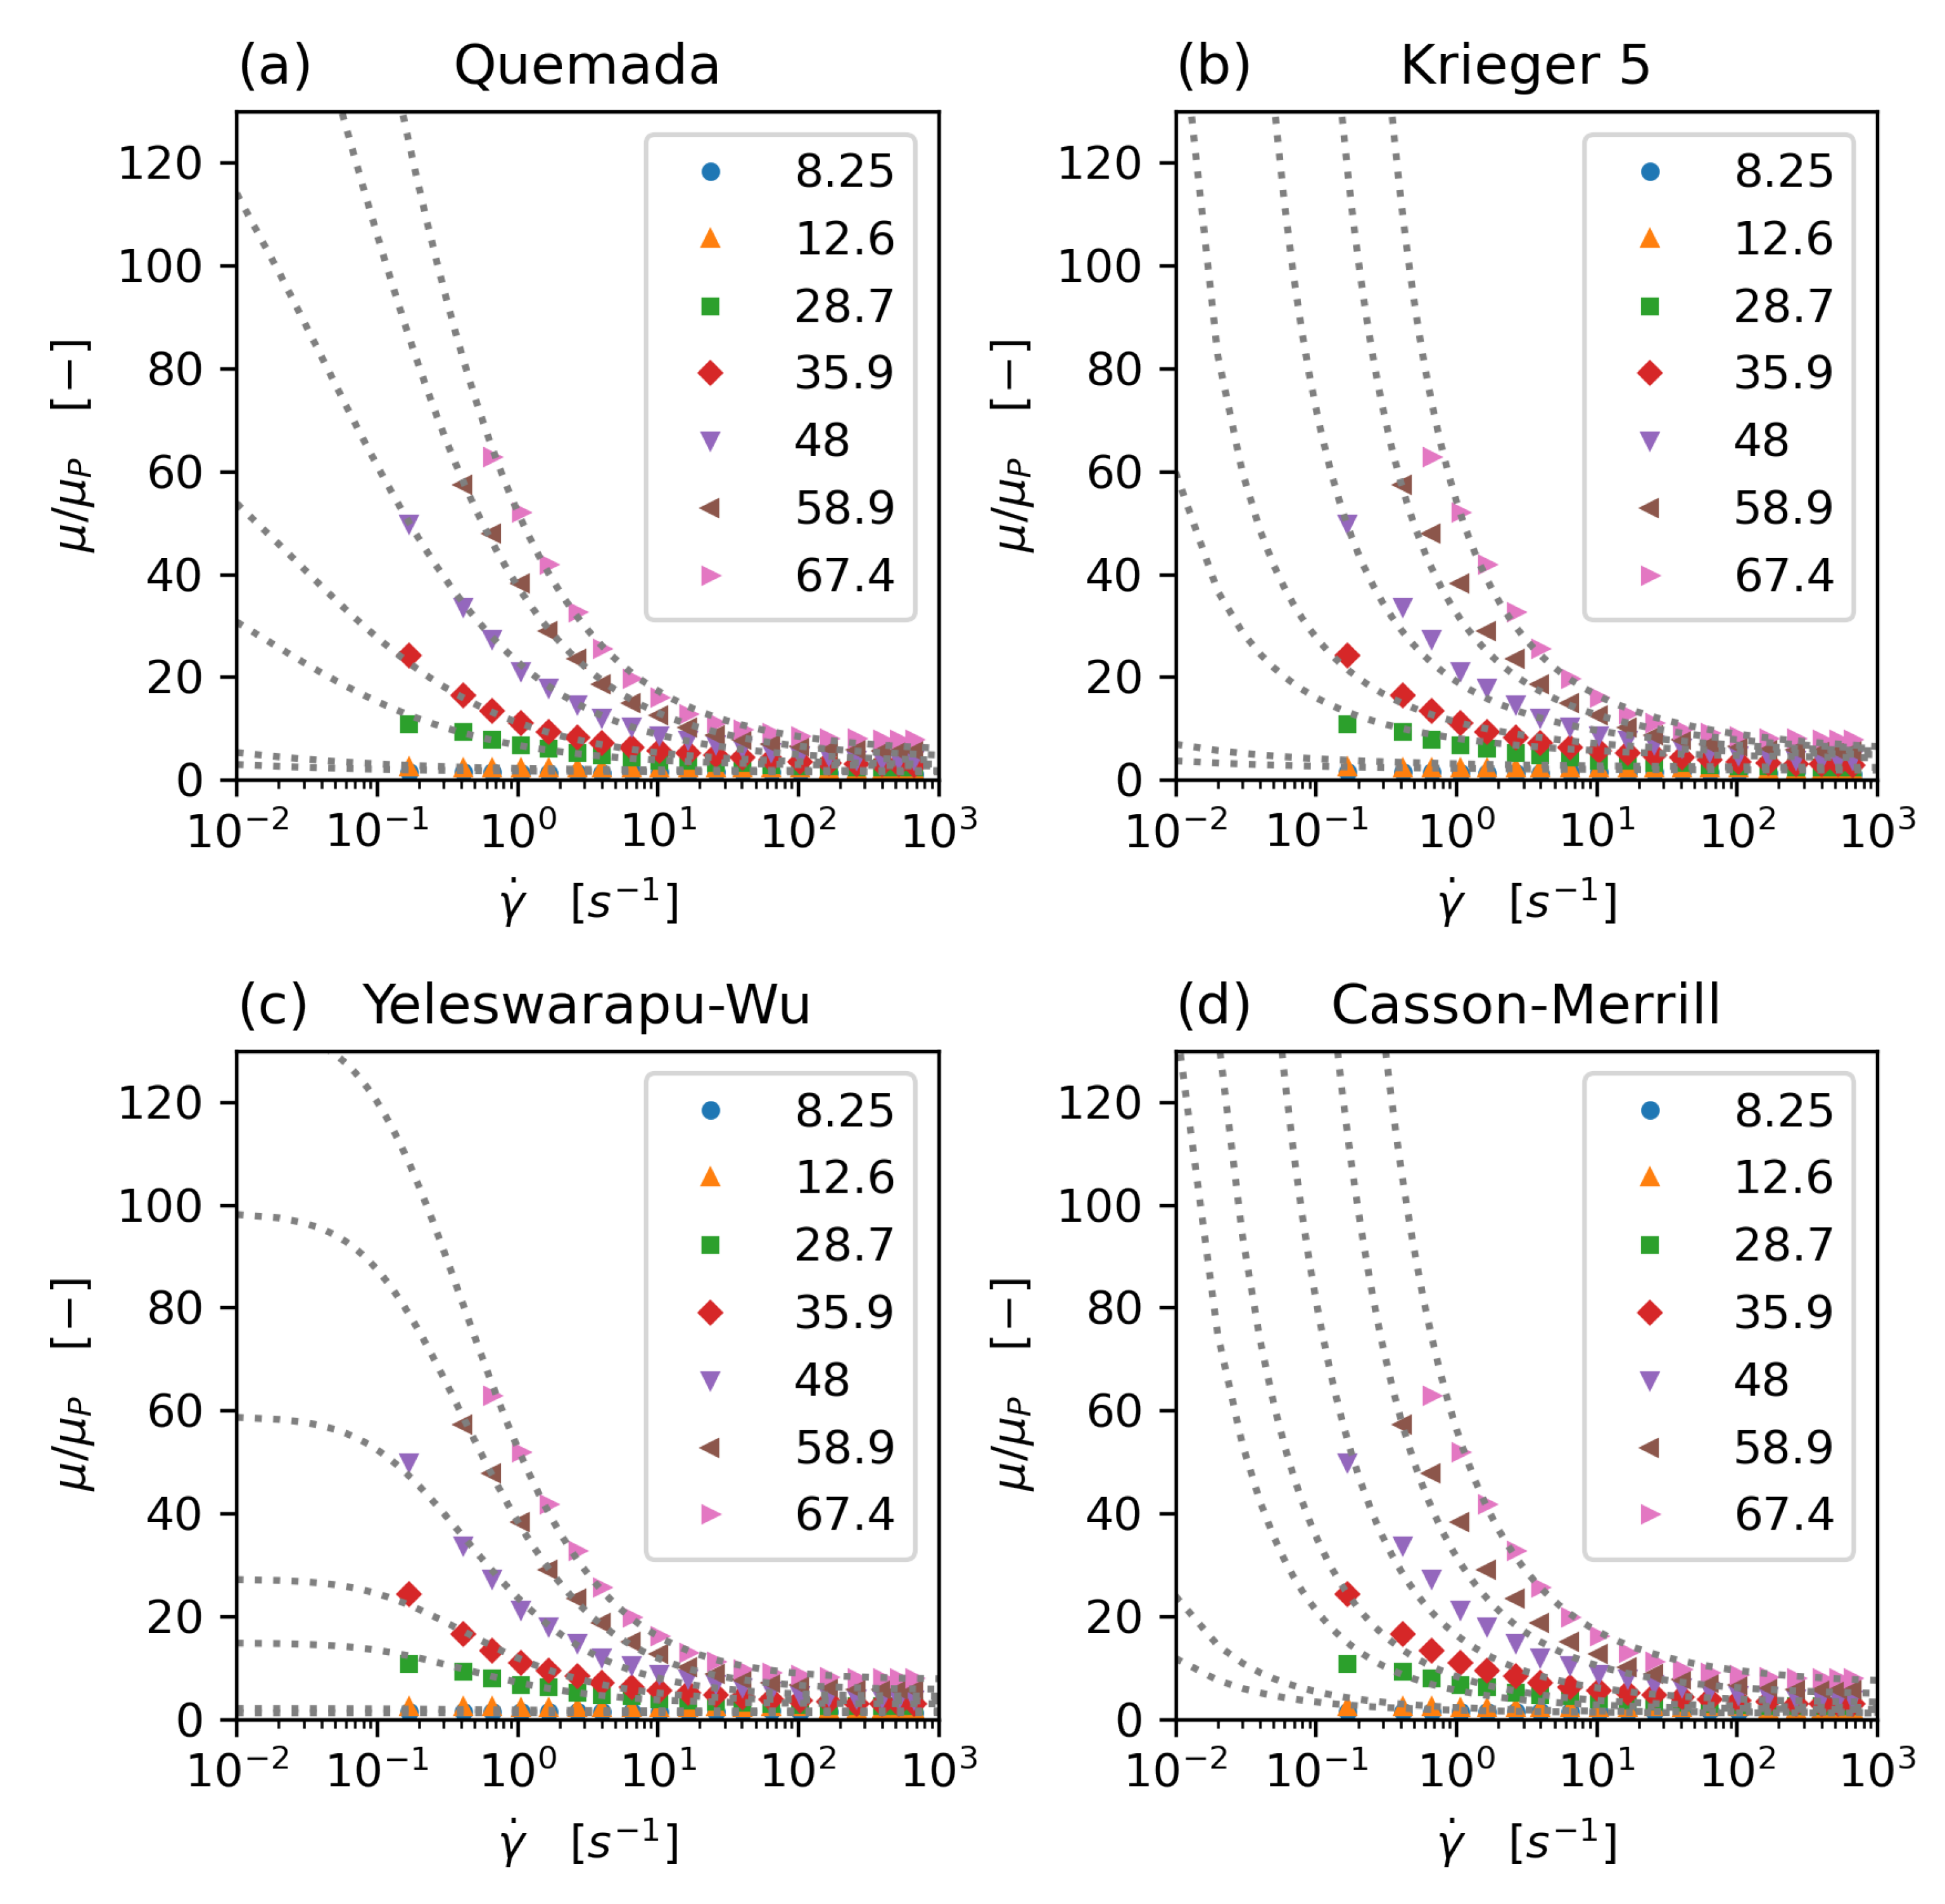
The rheology models that have been implemented and tested in this study are the concentration dependent Krieger–Dougherty model [20], the Quemada model [21,22,23] with modification by Das [24] (and a new parameter set, which avoids the singularity problem commonly associated with this model), an extended Krieger model, accommodating shear thinning and aggregation effects [25], a Casson model with haematocrit dependence following Merril et al. [24,26], and a modified Carreau type model, proposed by Yeleswarapu [27]. All model parameters have been fitted to the experimental data of Brooks [28] (Figure 1).
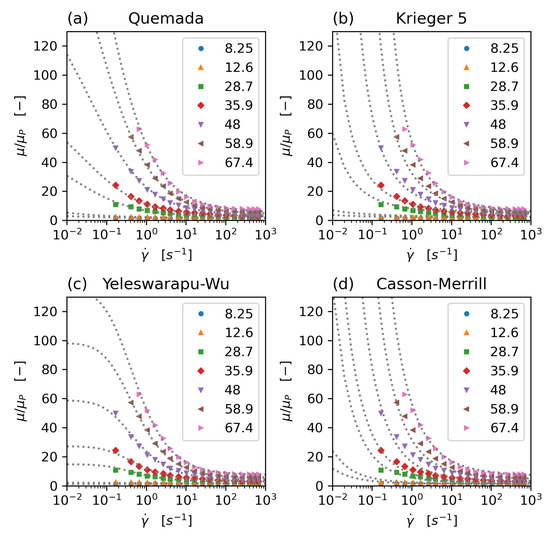
Figure 1.
Comparison of non-Newtonian rheology models: Quemada (a), modified 5-parameter Krieger (b), Yeleswarapu-Wu (c), and Casson-Merril (d) model. All model parameters have been fitted to Brooks’ data. Dots: experimental data (Brooks), dotted lines: model equations, data series: haematocrit concentration.
2.2.1. Krieger–Dougherty Model
The traditional Krieger–Dougherty model [20] was developed to describe the rheology of high volume ratio suspensions of rigid spherical particles. Rigid, spherical particles do not exhibit shear-thinning behaviour, so the Krieger–Dougherty model is only dependent on the haematocrit concentration . It shows a singularity for , where is the haematocrit concentration for which the suspension does stop to behave like a fluid. For rigid spheres [20], while for blood it can go up to , which is usually attributed to the deformability of the erythrocytes [25].
The parameter is often set to , but more commonly to the high shear limit of for [22,29], which is also the value used in this work to allow comparison with the results from Phillips and others [14,17,19]. is the Newtonian viscosity of the liquid phase (plasma).
In this study, the Krieger–Dougherty model is not used as for modelling blood viscosity but as a reference model for verification and validation.
2.2.2. Quemada Model
The Quemada model is based on “optimisation of viscous dissipation” [21]. In its original form it is formulated as a Newtonian, concentration dependent viscosity:
with k being related to the packing concentration and (for the high shear limit) given as: . In this form it is closely related to the Krieger–Dougherty model (Equation (6)).
In its non-Newtonian form k is expressed as [22,23]:
where and are the intrinsic viscosities at zero and infinite shear, respectively, and is a critical shear rate.
The shear rate magnitude is defined as
with D, the symmetric part of the velocity gradient tensor.
Different parameter fits have been proposed for . Cokelet [26,30] proposed:
Das [24] noted that Cokelet us parameter set causes the viscosity to be non-monotonous over haematocrit concentration for low shear, and exhibits singularities for zero shear. Das changed the parameter fit for to
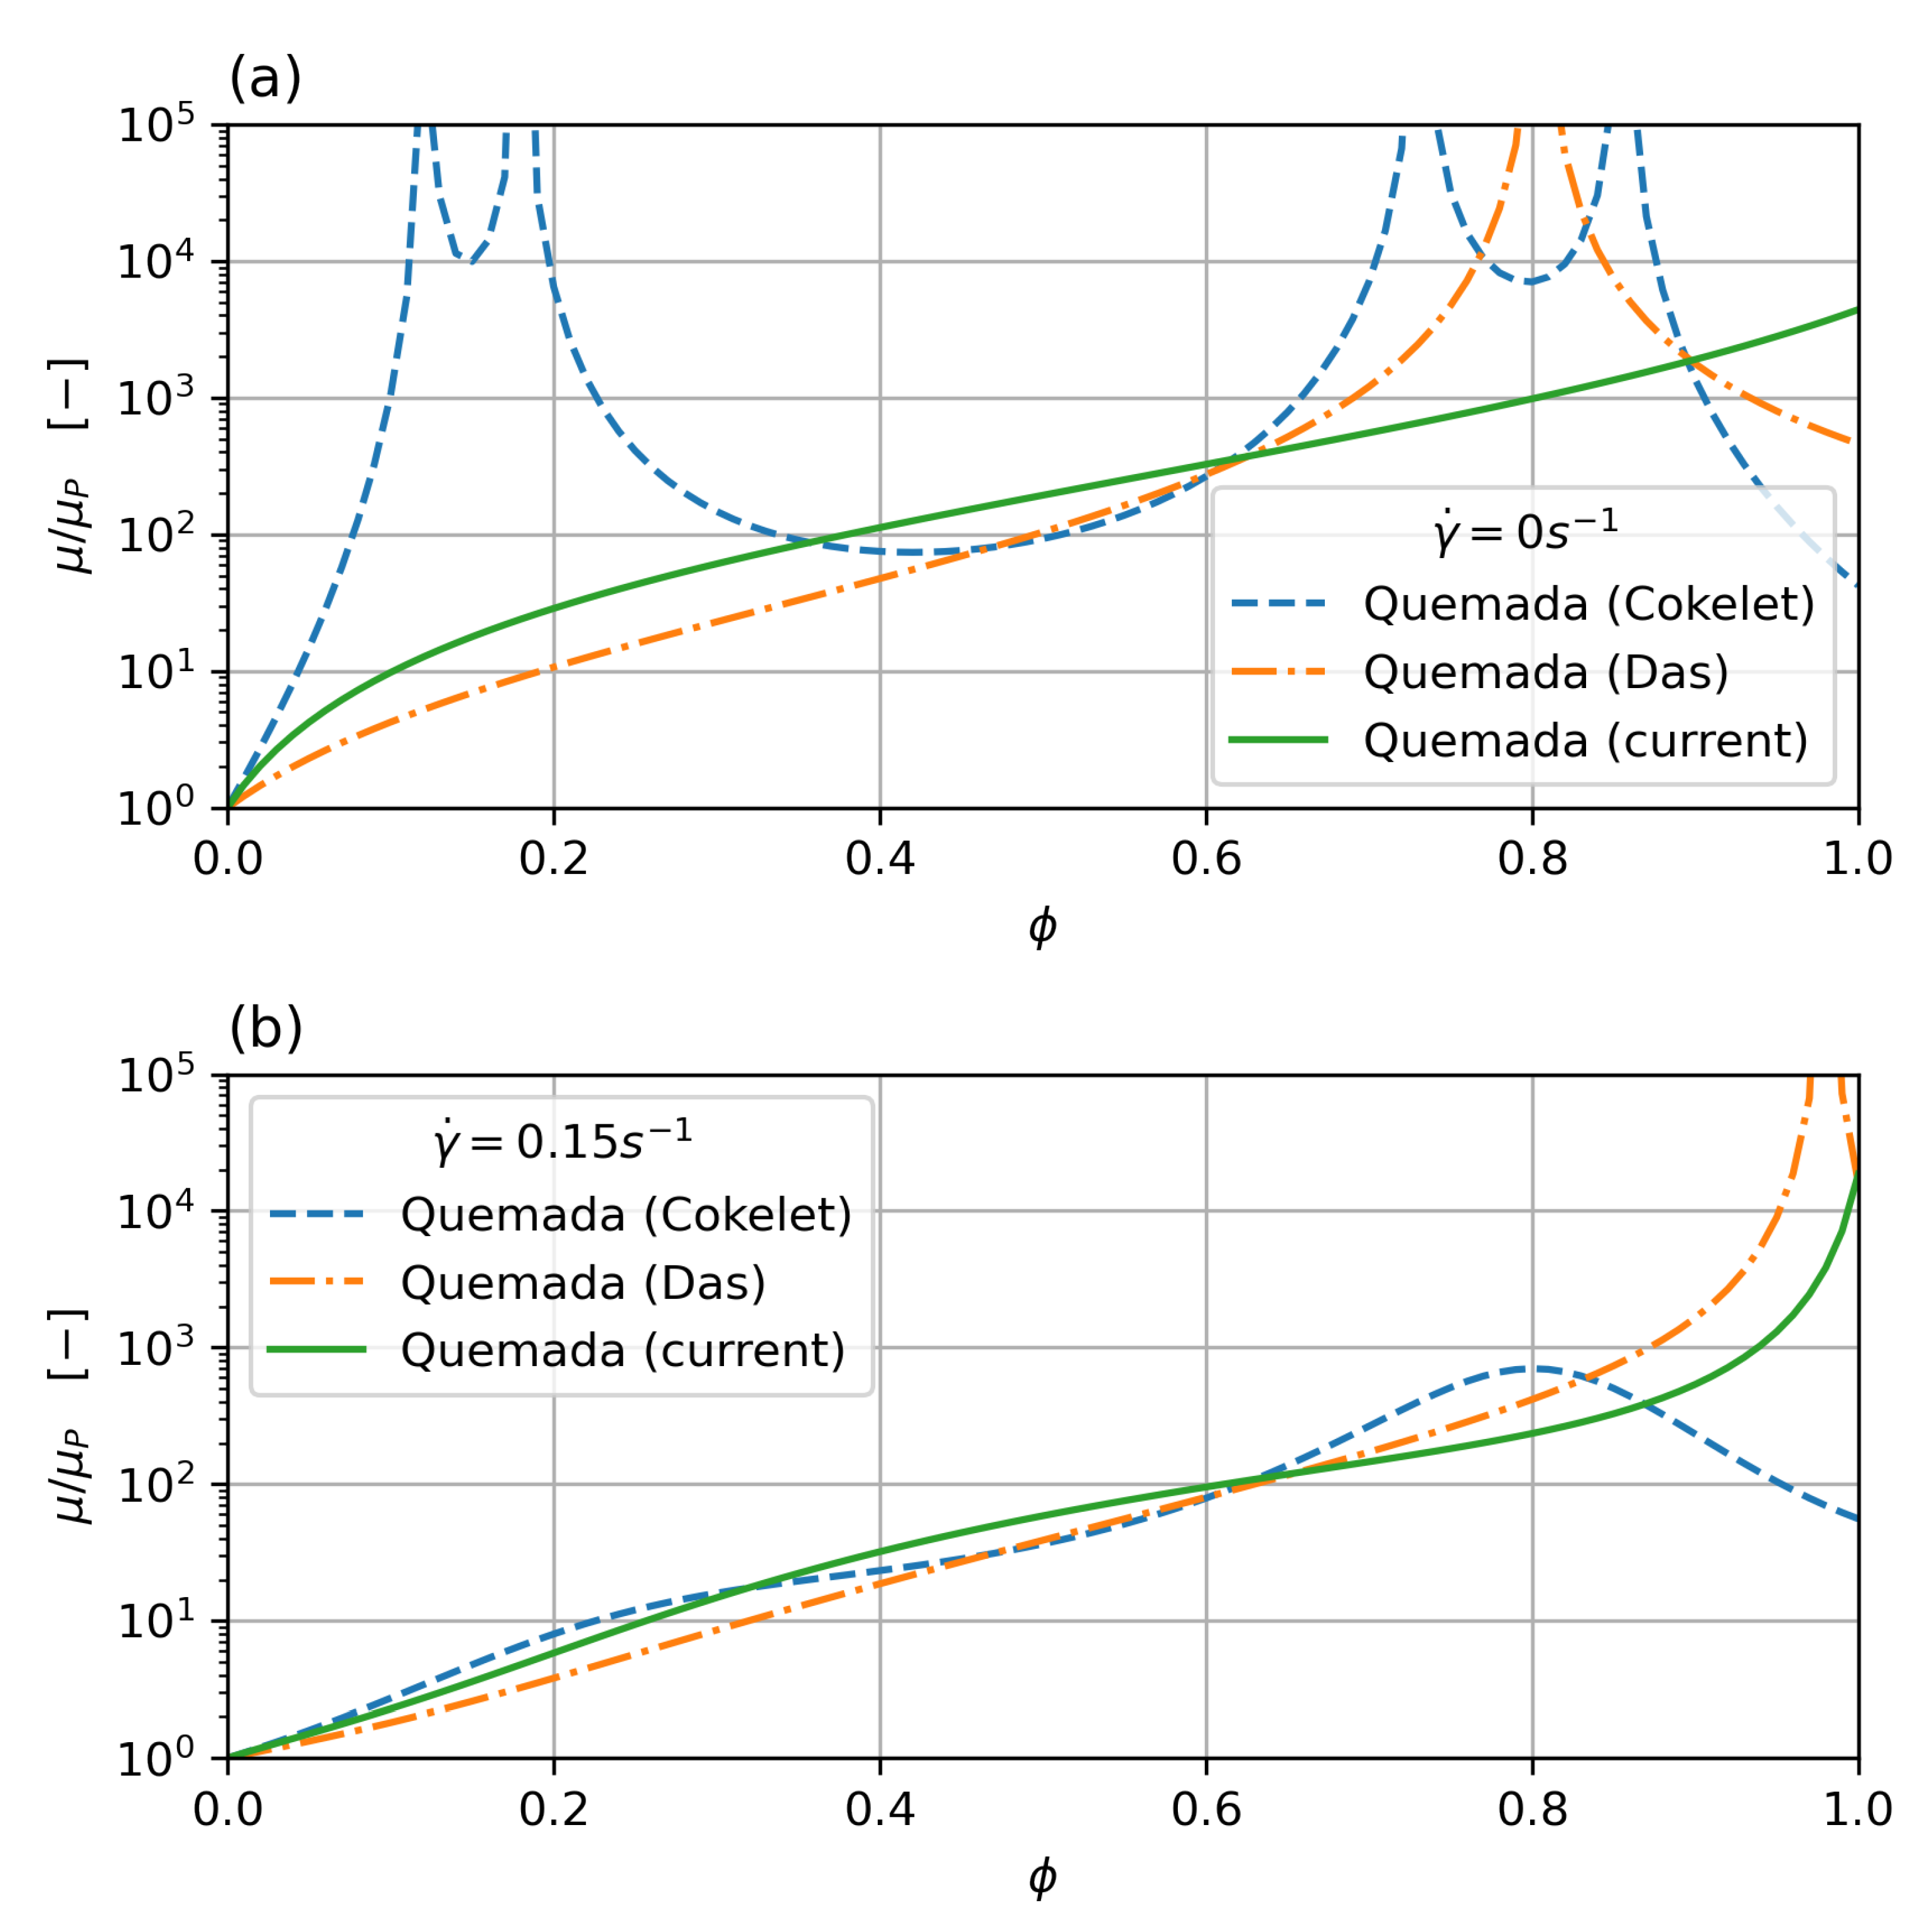
which results in a monotonous behaviour for low shear (the lowest shear measured in the Brooks dataset is around ), but still shows a singularity for . While this is outside the haematocrit values typically encountered in clinical practice, it can still pose a problem if cell migration is taken into account, which will concentrate cells in the core region. In order to overcome this problem, a new parameter set, based on Das’s formulation, is derived in this work, which does not show a singularity. Figure 2 shows viscosity over shear rate for low shear rate () and zero shear rate. While all the curves show a good fit with the data, the new parameter set does show monotonous behaviour throughout and no singularity below the critical haematocrit.
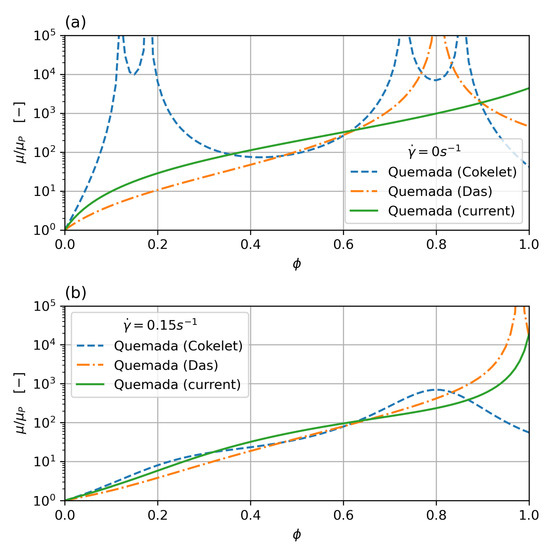
Figure 2.
Comparison of Quemada parameterisation for zero (a) and low (0.15 ) (b) shear rate. The classic Cokelet parameter set shows singularities at , the modified parameterisation by Das improves on this, but still shows a singularity for haematocrit. The current parameter set removes the singularity and shows monotonous behaviour.
2.2.3. Modified 5 Parameter Krieger Model
Hund et al. [25] proposed and developed a quasi-mechanistic extension to the Krieger–Dougherty model.
Starting from the traditional formulation of the Krieger–Dougherty model:
describing the haematocrit dependence, the shear-thinning behaviour is introduced by a variable exponent n:
where is the threshold haematocrit concentration below which no shear-thinning is observed. Based on Brooks [28], this threshold is around , and is modelled using a exponential dependency on :
Hund’s [25] shear-thinning exponent comprises contributions of red blood cell aggregation and deformability:
where each component is described by a power law:
with the empirical coefficient and , and the non-dimensional shear rate , as defined by Carreau and Yasuda [31], with a time constant , and . This formulation ensures finite at zero shear.
In the 5-component form the aggregation and deformation influences on the shear-thinning exponent are combined into a single power law, due to the limited data on these effects:
The model proposed by Hund et al. allows for inclusion of the influence of large molecule concentration (proteins polysacharides, lipids), as well as fibrinogen, and temperature on the constitutive model. Due to a lack of data these are not included in the 5-parameter model.
2.2.4. Yeleswarapu-Wu Model
This model is based on a visco-elastic Oldroyd-B model developed by Yeleswarapu et al. [27,32]. In this study, the visco-elastic effects are neglected, only the shear-thinning behaviour and haematocrit dependency are implemented. The shear-thinning behaviour follows a modified Carraeu-type model based on a mixture model by Jung et al. [33].
The model is based on a mixture model and thus the viscosity is decribed as a function of plasma viscosity and red blood cell viscosity [32]:
where the red blood cell viscosity is described as:
where, in this implementation, k is a constant model parameter, and and are modelled as third order polynomials of :
2.2.5. Casson-Merrill Model
The Casson model [34] is a classical non-Newtonian model in which the viscosity is modelled as:
where is the Casson viscosity (asymptote at high shear rate) and is the yield stress. The yield effect means that this model has a singularity at zero shear, leading to infinite viscosity. While there is an argument that blood does exhibit yield at slow time scales and low shear, this effect will typically make this type of model unsuited for numerical simulation within a generalised Newtonian approach with a local effective viscosity due to numerical instability.
For blood, Merill et al. gave the expressions for and as [24,26]
with the fitting parameters and .
2.2.6. Characteristics of Rheology Models
All viscosity model parameters were fitted to experimental data for varying levels of haematocrit in ADC plasma reported by Brooks [28]. While these data are for steady state shear only, it is still considered on of the best datasets for blood rheology data and is used in the majority of work on blood rheology. The parameters were fitted using a Levenberg–Marquardt least squares fit, implemented in Scientific Python (SciPy), using the MINPACK library. Table 1 shows the parameter sets for the different models, Figure 1 shows the comparison of model results and experimental data. All models show a good fit to the experimental data in the range were experimental data is available (), while the behaviour for low shear stress varies between the models. The Casson model shows a singularity for zero shear (yield stress behaviour), while the other models all have finite viscosity for zero shear. However, the values at low shear vary widely. For , the range of relative viscosity is between . This variation will heavily influence the behaviour at low shear rate, e.g., on the axis of the flow.

Table 1.
Viscosity model parameters. Levenberg–Marquardt least squares fit (SciPy, MINPACK), to Brooks’s data (all viscosities calculated in ), .
Figure 2 shows the parameter fit for the Quemada model, where the classical Cokelet fit [30] exhibits singularities at , , , and for zero shear. The Das variation [24] improves on this, but the original parameter set by Das still shows a singularity for haematocrit. The new parameter fit performed in this study removes the singularities completely and shows monotonous behaviour for the whole range of haematocrit concentrations and shear rates.
2.3. Implementation
The fundamental equations for mass and momentum conservation were implemented using the SIMPLE (Semi-Implicit Method for Pressure-Linked Equations) [35] method for steady state, and the PISO (Pressure-Implicit with Splitting of Operators) [36] and PIMPLE (combining PISO and SIMPLE) methods for transient simulations.
Discretision is typically second order in space and time. The code supports all discretisation methods that are supported in the FOAM library.
The haematocrit transport Equation (5) is implemented as a scalar transport Equation (Listing 1), solved outside of the SIMPLE loop. The Laplacians in are implemented implicitely (fvm) as diffusion terms, while the source terms in and are calculated explicitely (fvc).
Listing 1.
Haematocrit transport equation as implemented in Openfoam.
For steady state (SIMPLE) and transient cases with the PIMPLE algorithm, underrelaxation is required. Typically the underrelaxation factor that is required can be estimated from the order of magnitude of the ratio between collision radius and vessel radius. Stable simulation has been achieved for relaxation factors of , e.g., a radius and collision radius of will require an underrelaxation factor of ≈0.1 with no underrelaxation for the final iteration. The PISO algorithm does not use underrelaxation and requires a time estimated as the smaller of (a) timestep estimated from the Courant number (), and (b) time step calculated based on a Courant number scaled with the migration velocity (instead of the convective velocity).
The discretisation schemes used in the calculations presented in this paper are: second order Euler backward in time and second order (Gauss linear, and Gauss linear upwind for advective terms) in space, gradients are approximated using the least squares theme.
Rheology models are implemented as quasi-Newtonian, with calculation of local cell viscosity based on the shear rate and haematocrit value in the cell from the previous iteration/time step. The new rheology models that are implemented at the time of writing are the standard Krieger–Dougherty, the modified 5-parameter Krieger, the Yeleswarapu–Wu, and the Quemada model.
3. Results
All results shown in this paper are for fully developed pipe flow, with periodic boundary conditions between outlet and inlet, with prescribed average velocity. The radius of the pipe varies between 50 μm and 5 mm, to represent typical vessel diameters. The pipe length is two diameters.
3.1. Verification and Influence of Mesh Type
The verification case for the implementation is a pipe of radius , average velocity . The rheology model used in the verification case is the Krieger–Dougherty model to allow comparison to the analytical solution [14] (no analytical solution available for the non-linear terms in the shear-stress and concentration dependent models). Model parameters for the Krieger–Dougherty model are , , , and .
The simulation was performed for different meshes, Figure 3, (a) an axisymmetric (2D) wedge with 50 cells resolution in radial direction, (b) a hexahedral, block structured mesh—50 cells radial, and (c) a polyhedral mesh with boundary layer inflation with ~60 cells across the diameter—this type of mesh is common in the simulation of vascular flow in patient specific geometries. The given resolutions were chosen based on a mesh convergence study and realistic mesh resolutions as typically used in vascular simulations. The migration model requires a mesh that is of similar resolution as meshes that aim at resolving wall shear stress (WSS) and WSS derived metrics.
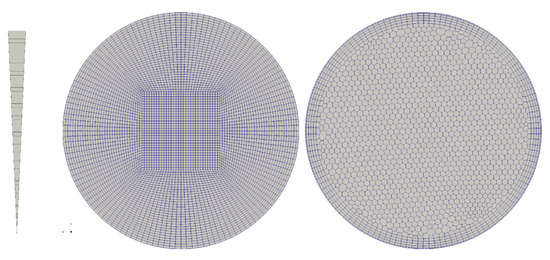
Figure 3.
Mesh topology for the verification of the model: axisymmetric wedge, 50 cells radial; hexahedral, block-structured, 50 cells radial; polyhedral with boundary layer extrusion, 60 cells diameter.
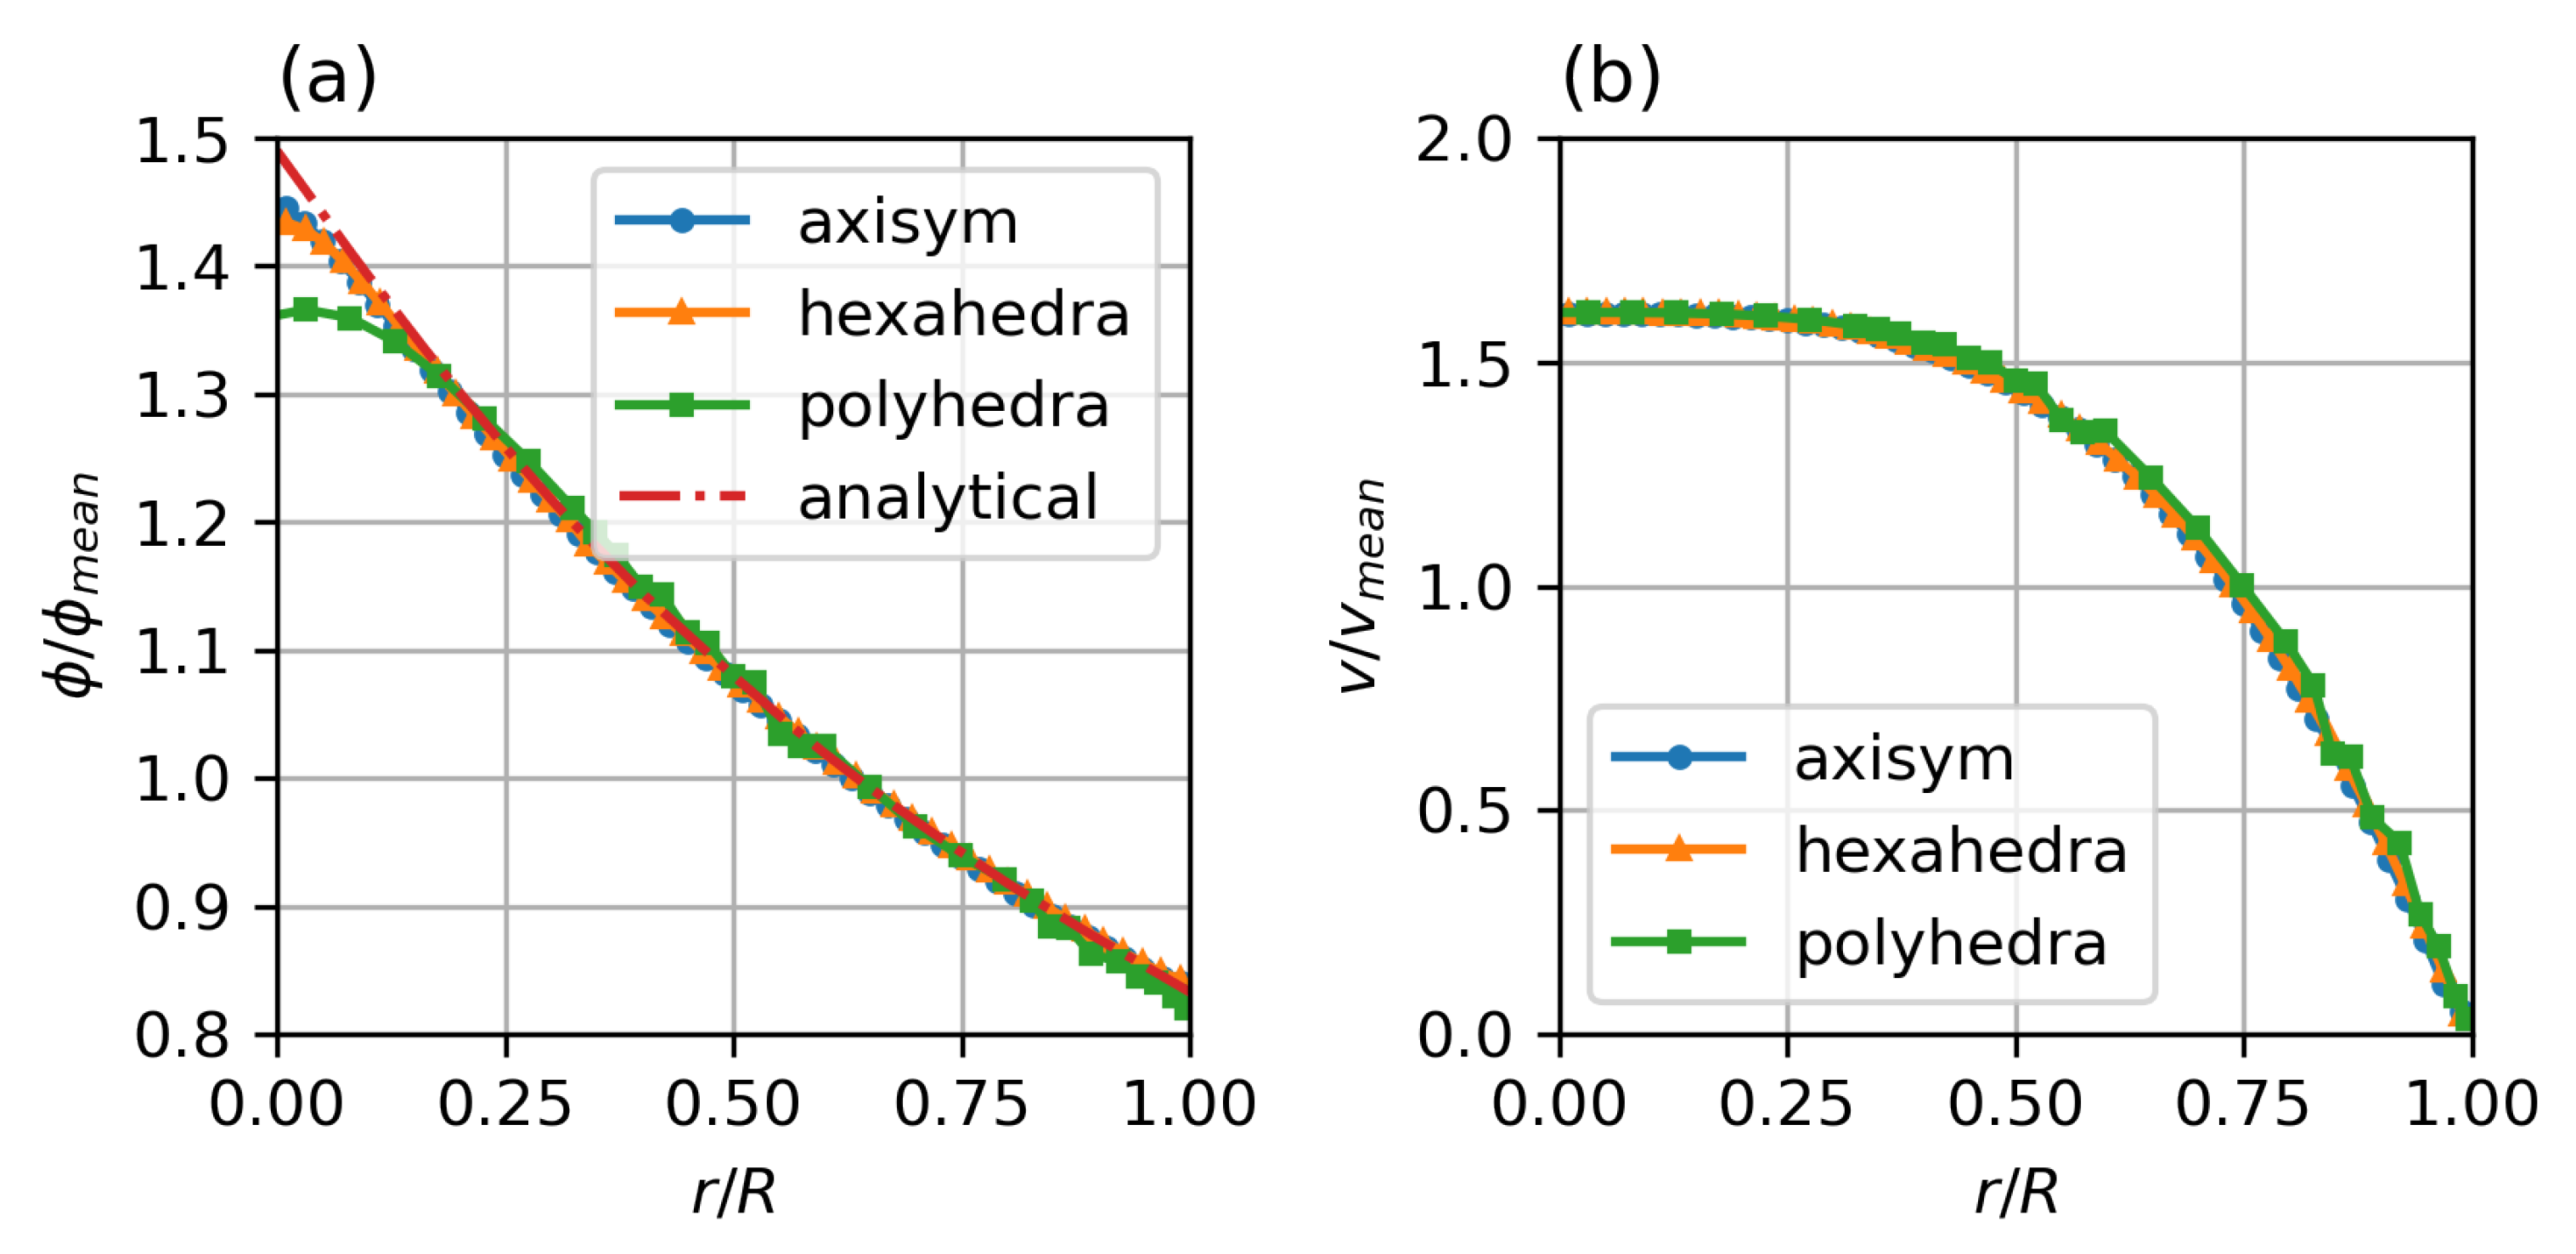
Figure 4 shows the results for the different meshes in comparison to the analytical solution of the migration model with the Krieger–Dougherty model. The axisymmetric two-dimensional and the hexahedral three-dimensional meshes show excellent agreement, with only a slight rounding of the peaked analytical solution at the axis. The polyhedral three-dimensional mesh also shows good agreement, but the additional numerical diffusion blunts the profile at the axis, the concentration close to the wall is well represented.
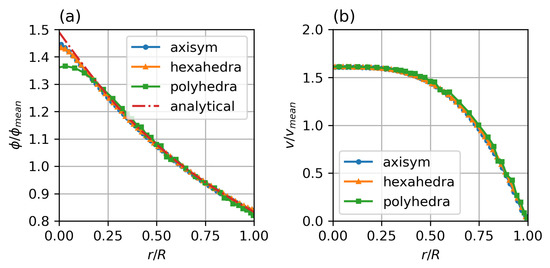
Figure 4.
Steady state particle distribution (a) and velocity profiles (b) for different mesh types, compared with analytical solution for particle distribution by Krieger et al. Parameters: fully developed pipe flow, , , , , , , Standard Krieger–Dougherty Model.
3.2. Length and Time Scale Dependency
3.2.1. Wall Shear Strain Scaling
The parabolic velocity profile for a Newtonian flow is given as:
where V is the average velocity.
Therefore, the velocity gradient in radial direction is:
So the gradient at the wall () scales with V and . The velocity is, therefore, scaled with R, such that the wall velocity gradient is constant. The Reynolds number scales with . For the given values of , , the wall velocity gradient is constant at , to cover the significant three decades of shear strain magnitude for shear-thinning non-Newtonian blood models.
The steady state particle distribution profile is independent of the length scale and the diameter ratio. It will only depend on the ratio of . Figure 5 shows steady state profiles for a range of diameters from 0.1 to 10 . The computational effort for the particle migration model, however, scales with , with R, the vessel radius, and a, the particle collision radius. While the small diameter case is fully converged after around iterations, the case requires iterations. This corresponds to the diffusion timescales.
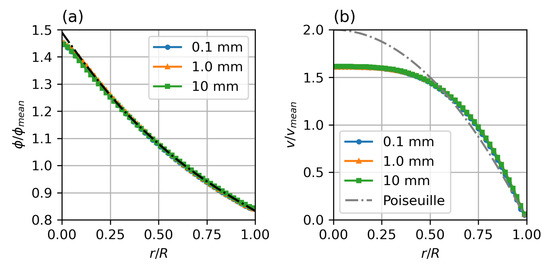
Figure 5.
Steady state particle distribution (a) and velocity profiles (b) for different diameters. Parameters: fully developed pipe flow, , , , , , , Standard Krieger–Dougherty Model.
3.2.2. Kinematic and Particle Migration Timescales
Blood flow with particle migration is governed by several different time scales for flow kinematics and particle migration. The timescale for the development of the velocity profile (kinematic timescale) is
The timescales for the development of the particle migration profile can be derived from the particle migration flux diffusion terms as:
The kinematic timescale scales with , while the particle migration timescales scale with the square diameter ratio , where R is the pipe radius, and a is the particle (collision) radius.
The kinematic viscosity, , while for an average collision radius of red blood cells of , the particle migration diffusion coefficients are of the order of 10–10. This means the particle migration happens on timescales that are three orders of magnitude greater than the kinematic timescales.
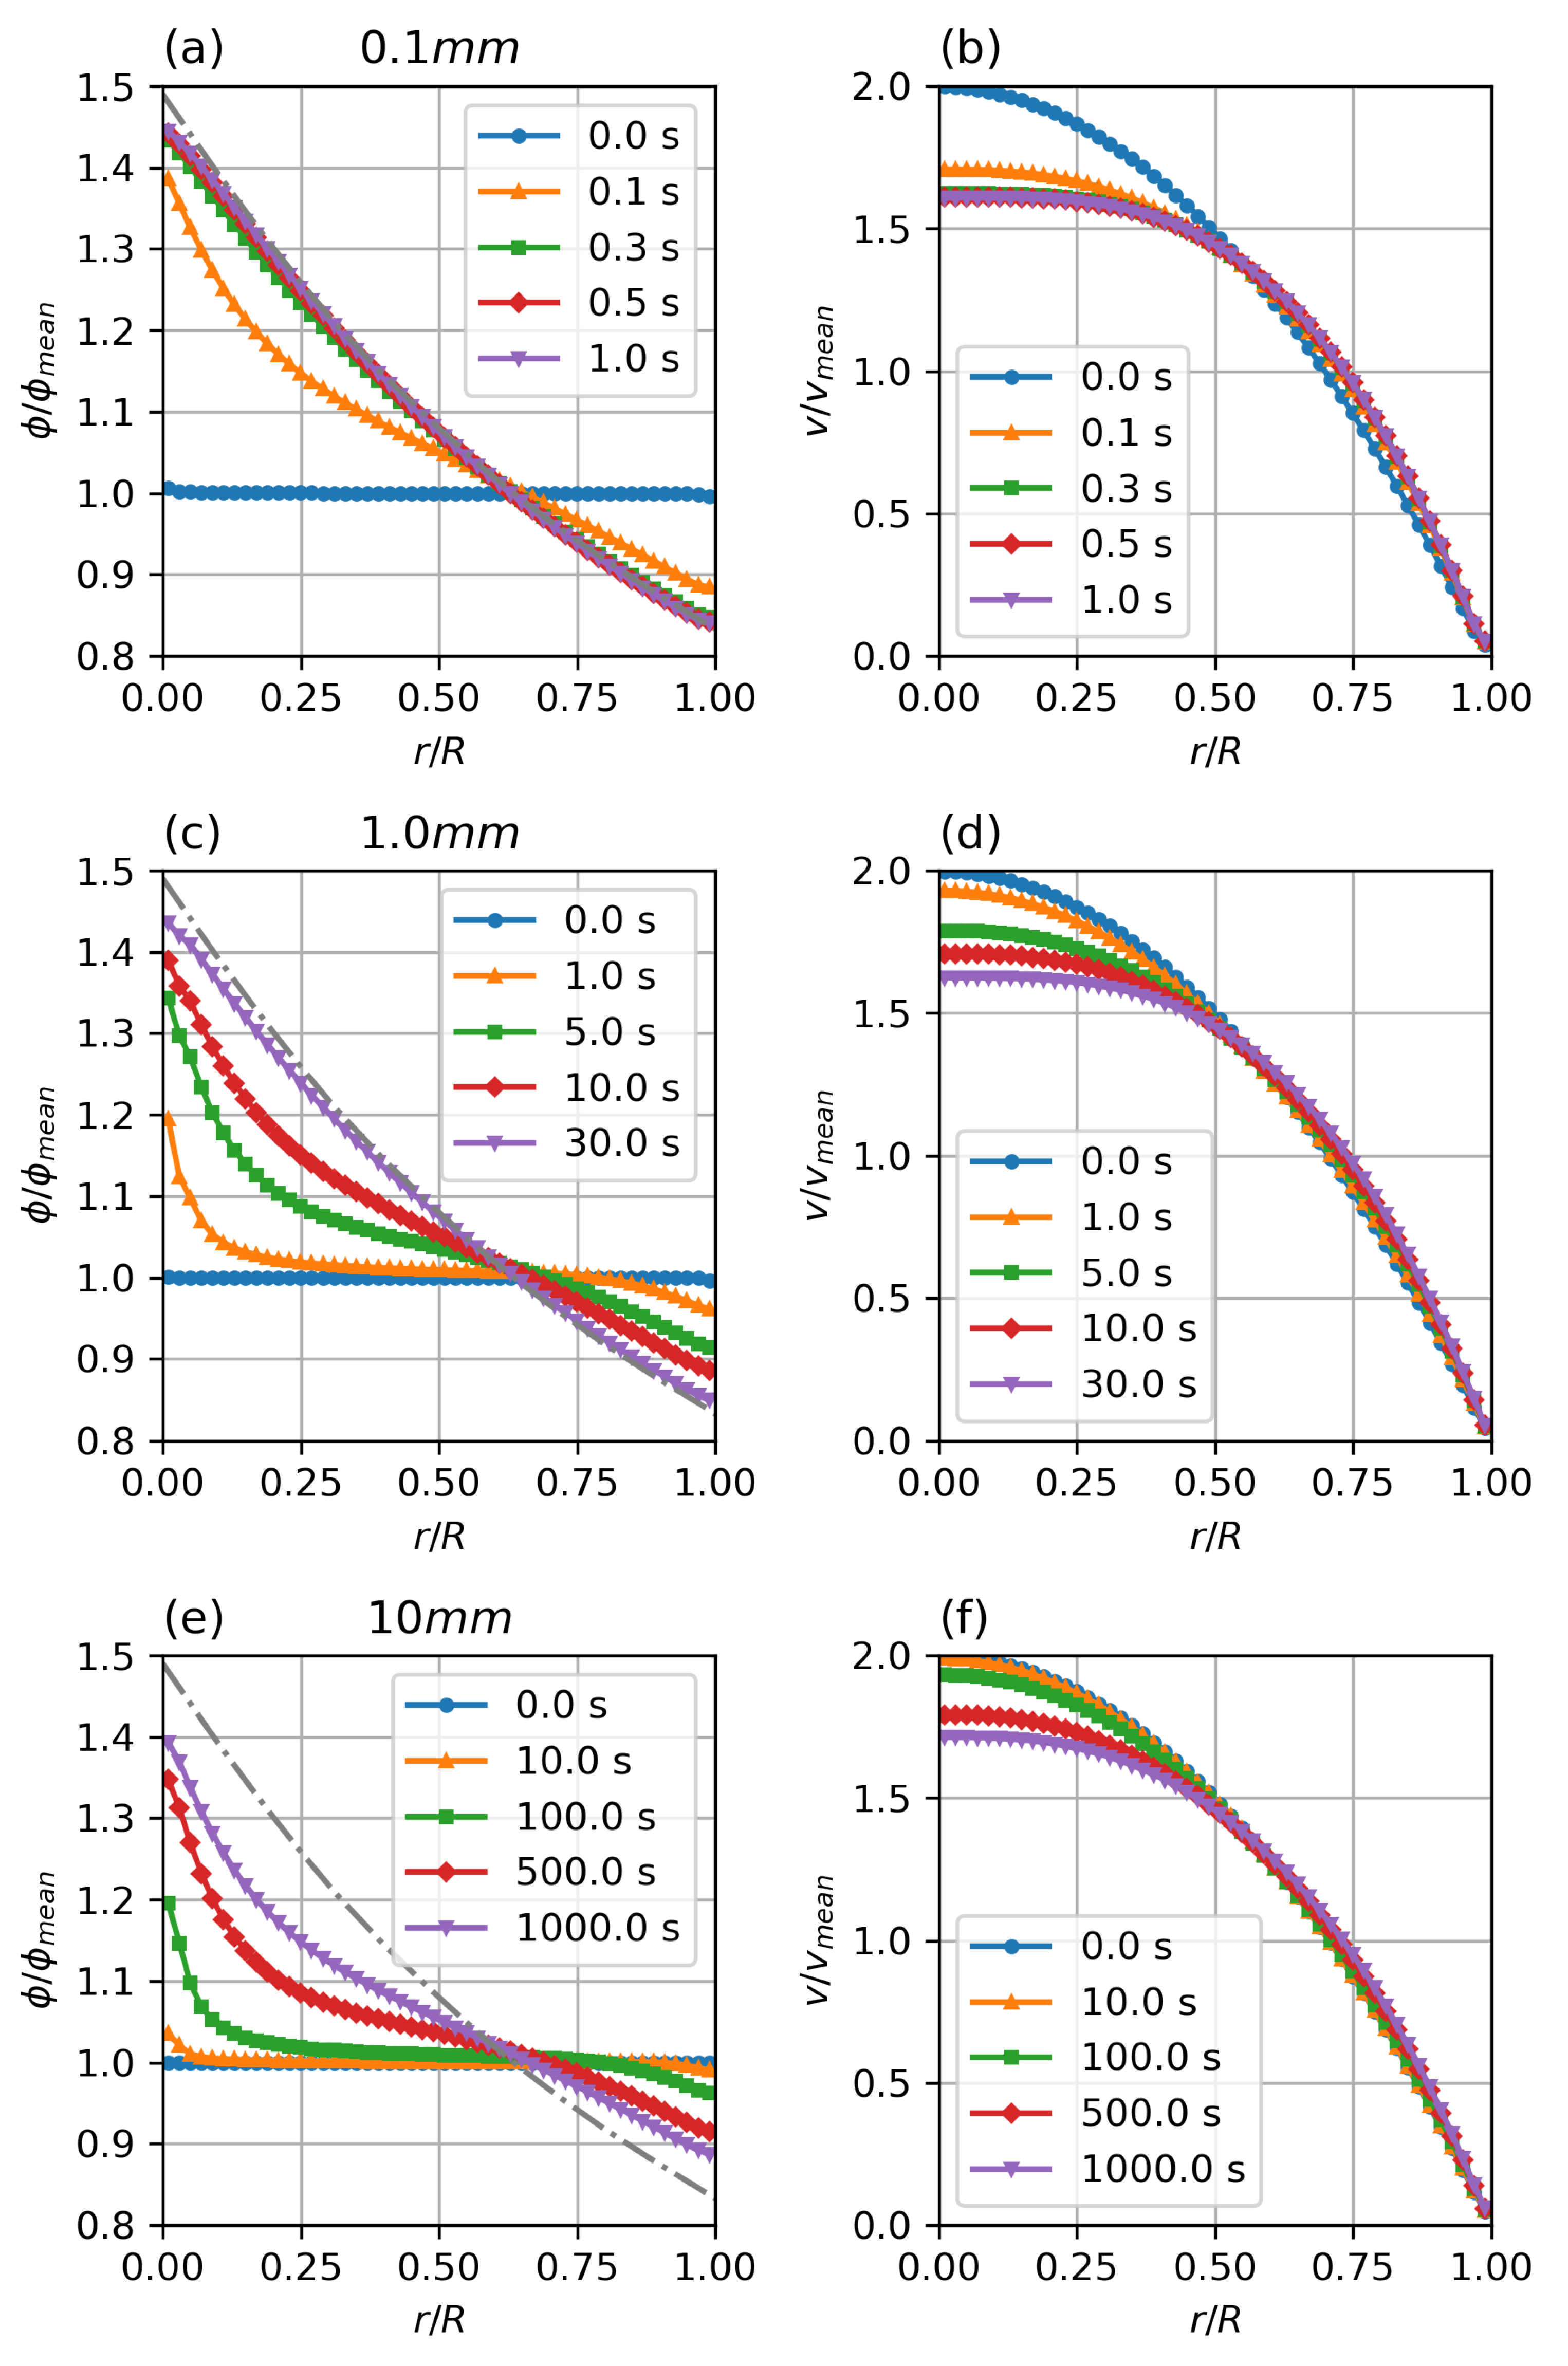
Figure 6 shows the temporal development of the particle distribution and non-Newtonian velocity profile. The flows were initialised with a fully developed parabolic velocity profile and a uniform particle distribution of volume fraction. The case has reached steady state conditions within , the case shows significant particle migration after physiologically relevant times, while the case does show only minimal migration after . It can be seen that temporal scaling follows the predicted scaling factor.
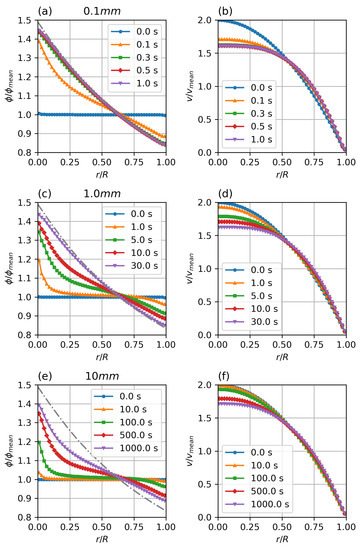
Figure 6.
Transient particle distribution (a,c,e) and velocity profiles (b,d,f) for different diameters. Parameters: fully developed pipe flow, , , , , , , Standard Krieger–Dougherty Model.
3.3. Variation of Rheology Model and Collision Parameter Ratio
As is obvious from Equation (5), the particle migration is strongly dependent on the viscosity model and the balance between collision and viscosity driven migration, as expressed in the model parameters and .
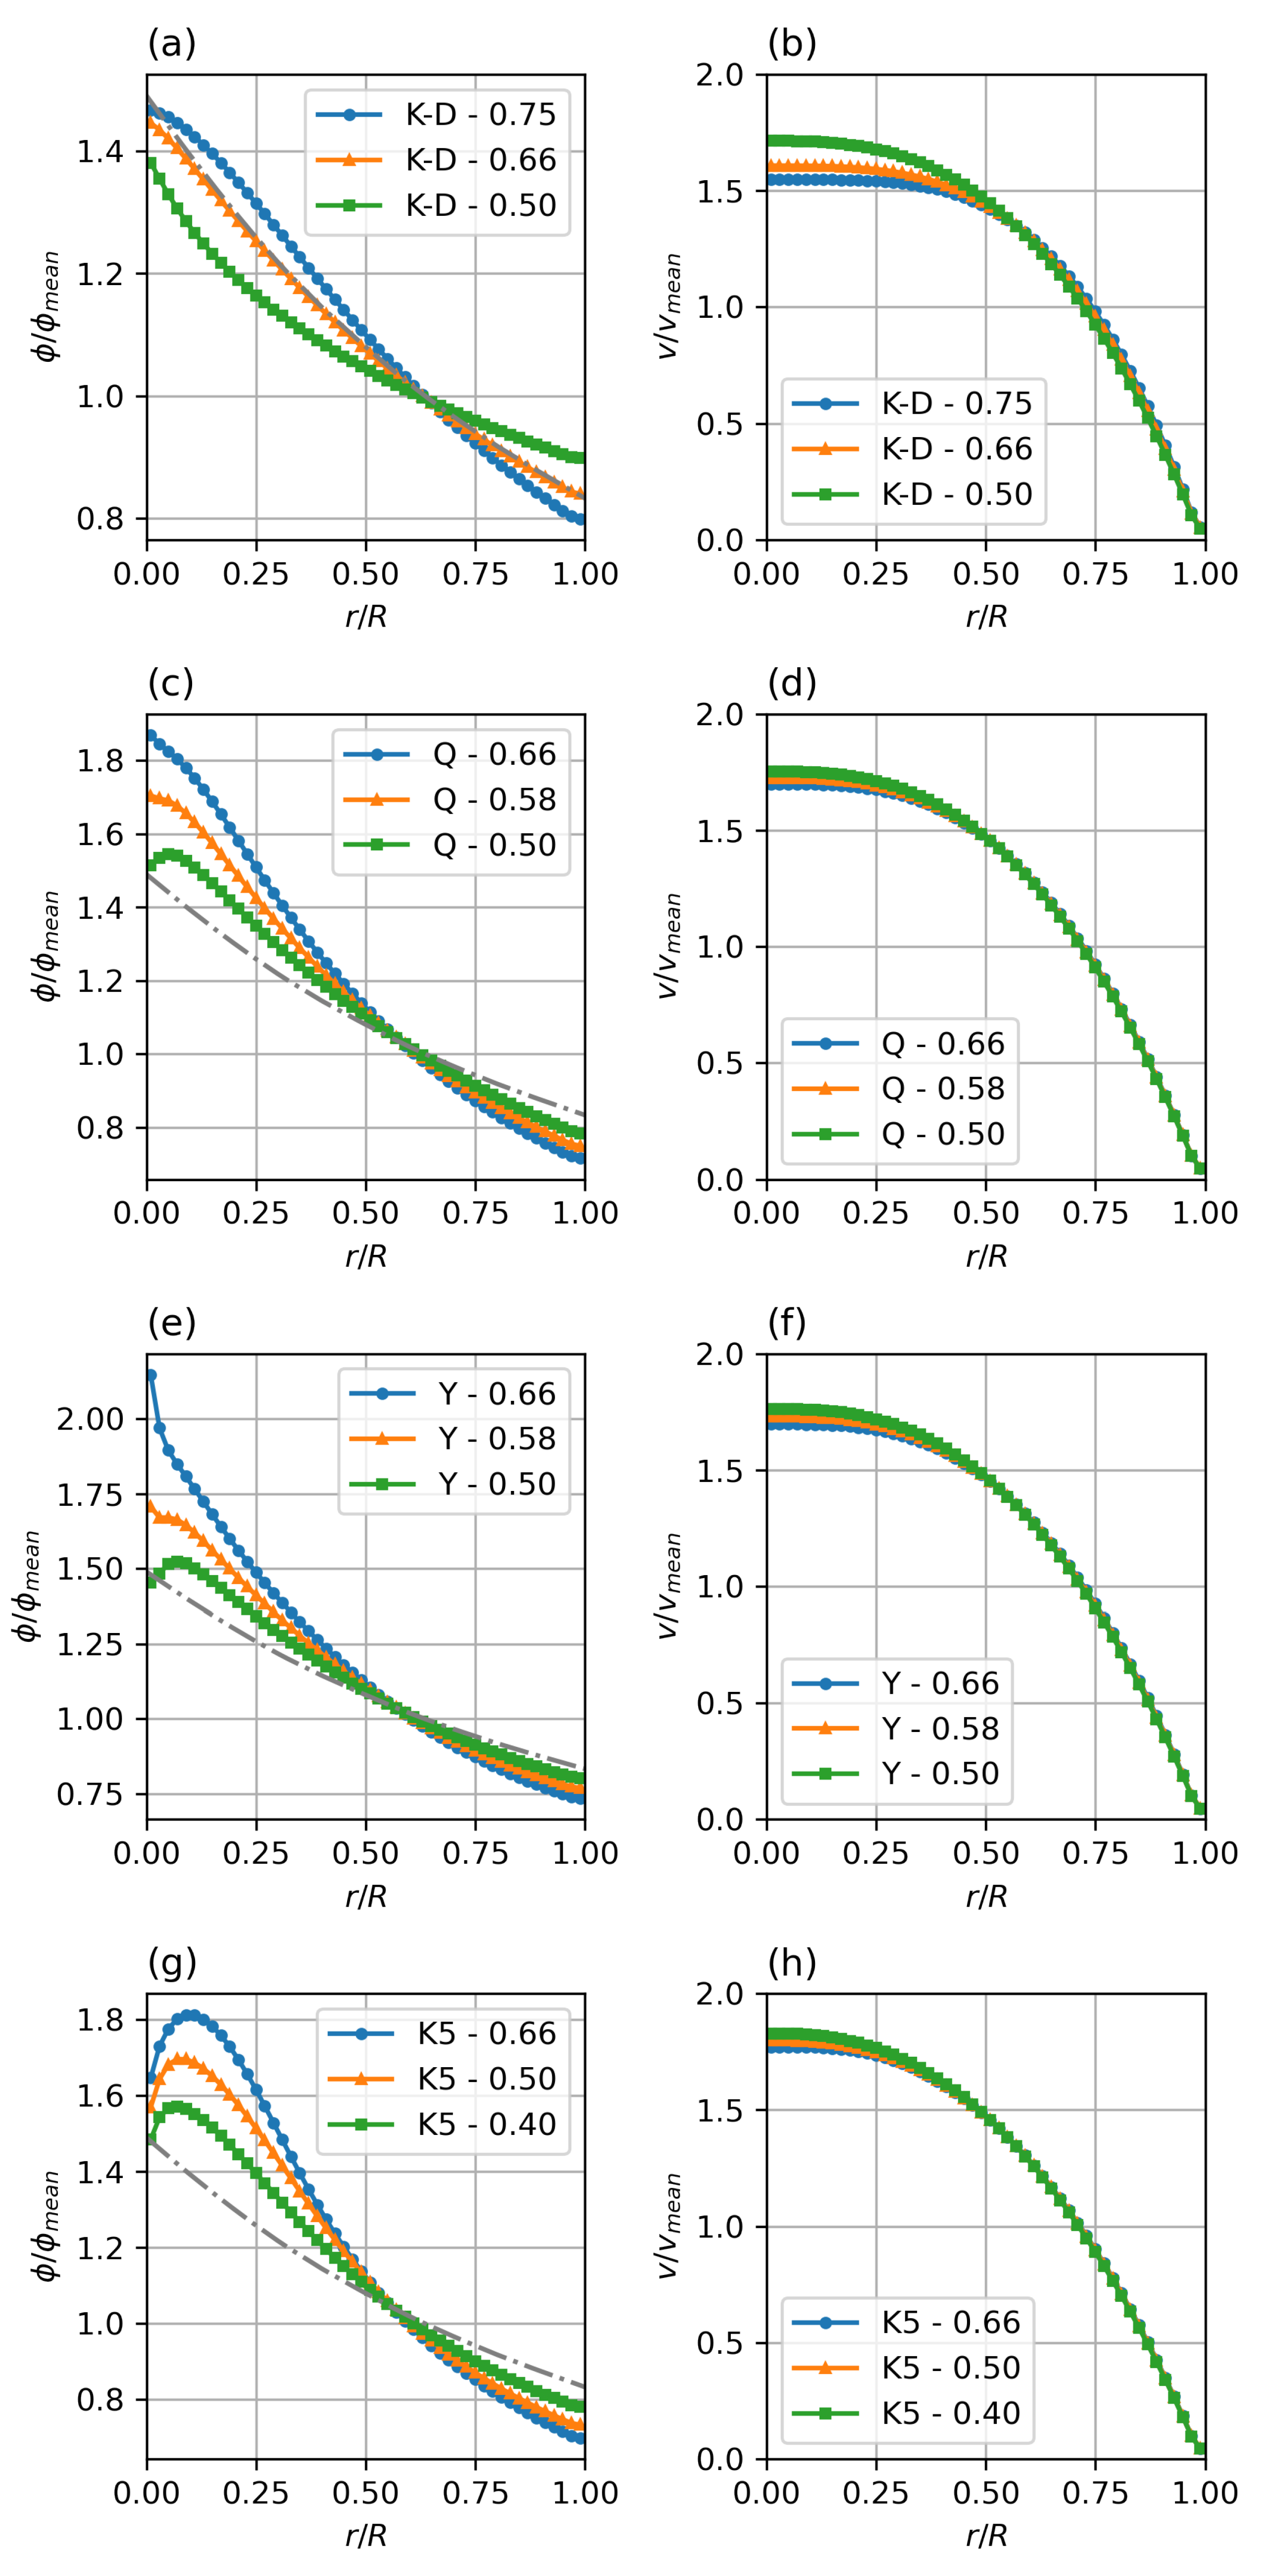
While the magnitude of and controls the magnitude of the migration pressures and thus the temporal response of the system, the concentration profile only depends on the balance between collision and viscosity driven fluxes. This balance is expressed by the ratio between the parameters . Figure 7 shows the haematocrit profiles as they develop for different viscosity models—Krieger–Dougherty (K-D), Quemada (Q), Yeleswarapu–Wu (Y), modified 5-parameter Krieger model (K5), and varying K-ratios .
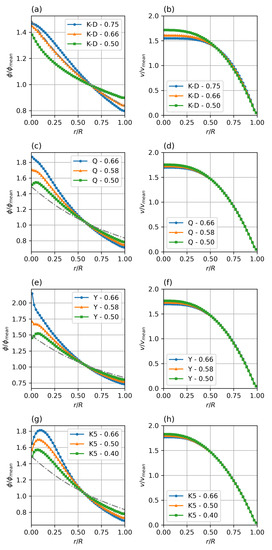
Figure 7.
Steady state particle distribution (a,c,e,g) and velocity profiles (b,d,f,h) for different viscosity models and collision parameter ratios (). Parameters: fully developed pipe flow, , , = 0.4–0.75 (given in legends). Standard Krieger–Dougherty (a,b), Quemada (c,d), Yeleswarapu (e,f), and modified 5-parameter Krieger (g,h) model.
Compared to the verification K-D case with K-ratio of , it can be seen that a shift in the balance to higher influence of the collision frequency (higher K-ratio) steepens the profile, while a lower K-ratio, i.e., a shift of the balance to the resistive influence of the viscosity increase in the low shear region causes a flatter profile.
Comparing the different viscosity models clearly shows the main difference in the core region, where the strong variation in the low shear behaviour, discussed earlier, leads to a strong variation in the relative viscosity gradient (last term in Equation (5)). It is obvious that there is a need for further study and comparison with experimental or meso-scale modelling data to find realistic parameters for each of the potential viscosity models. Especially the modified Krieger model (K5) shows a, most likely unrealistic, double-bump profile at the axis.
Based on these results, the Quemada model with a K-ratio of between and seems to be the most promising candidate for a semi-mechanistic rheology model for blood.
3.4. Application to Realistic Vessel Model
The hybrid implicit–explicit implementation presented here allows for transparent change of viscosity model and does not use any artificial stabilisation, allowing for low residual solutions on realistic complex geometries.
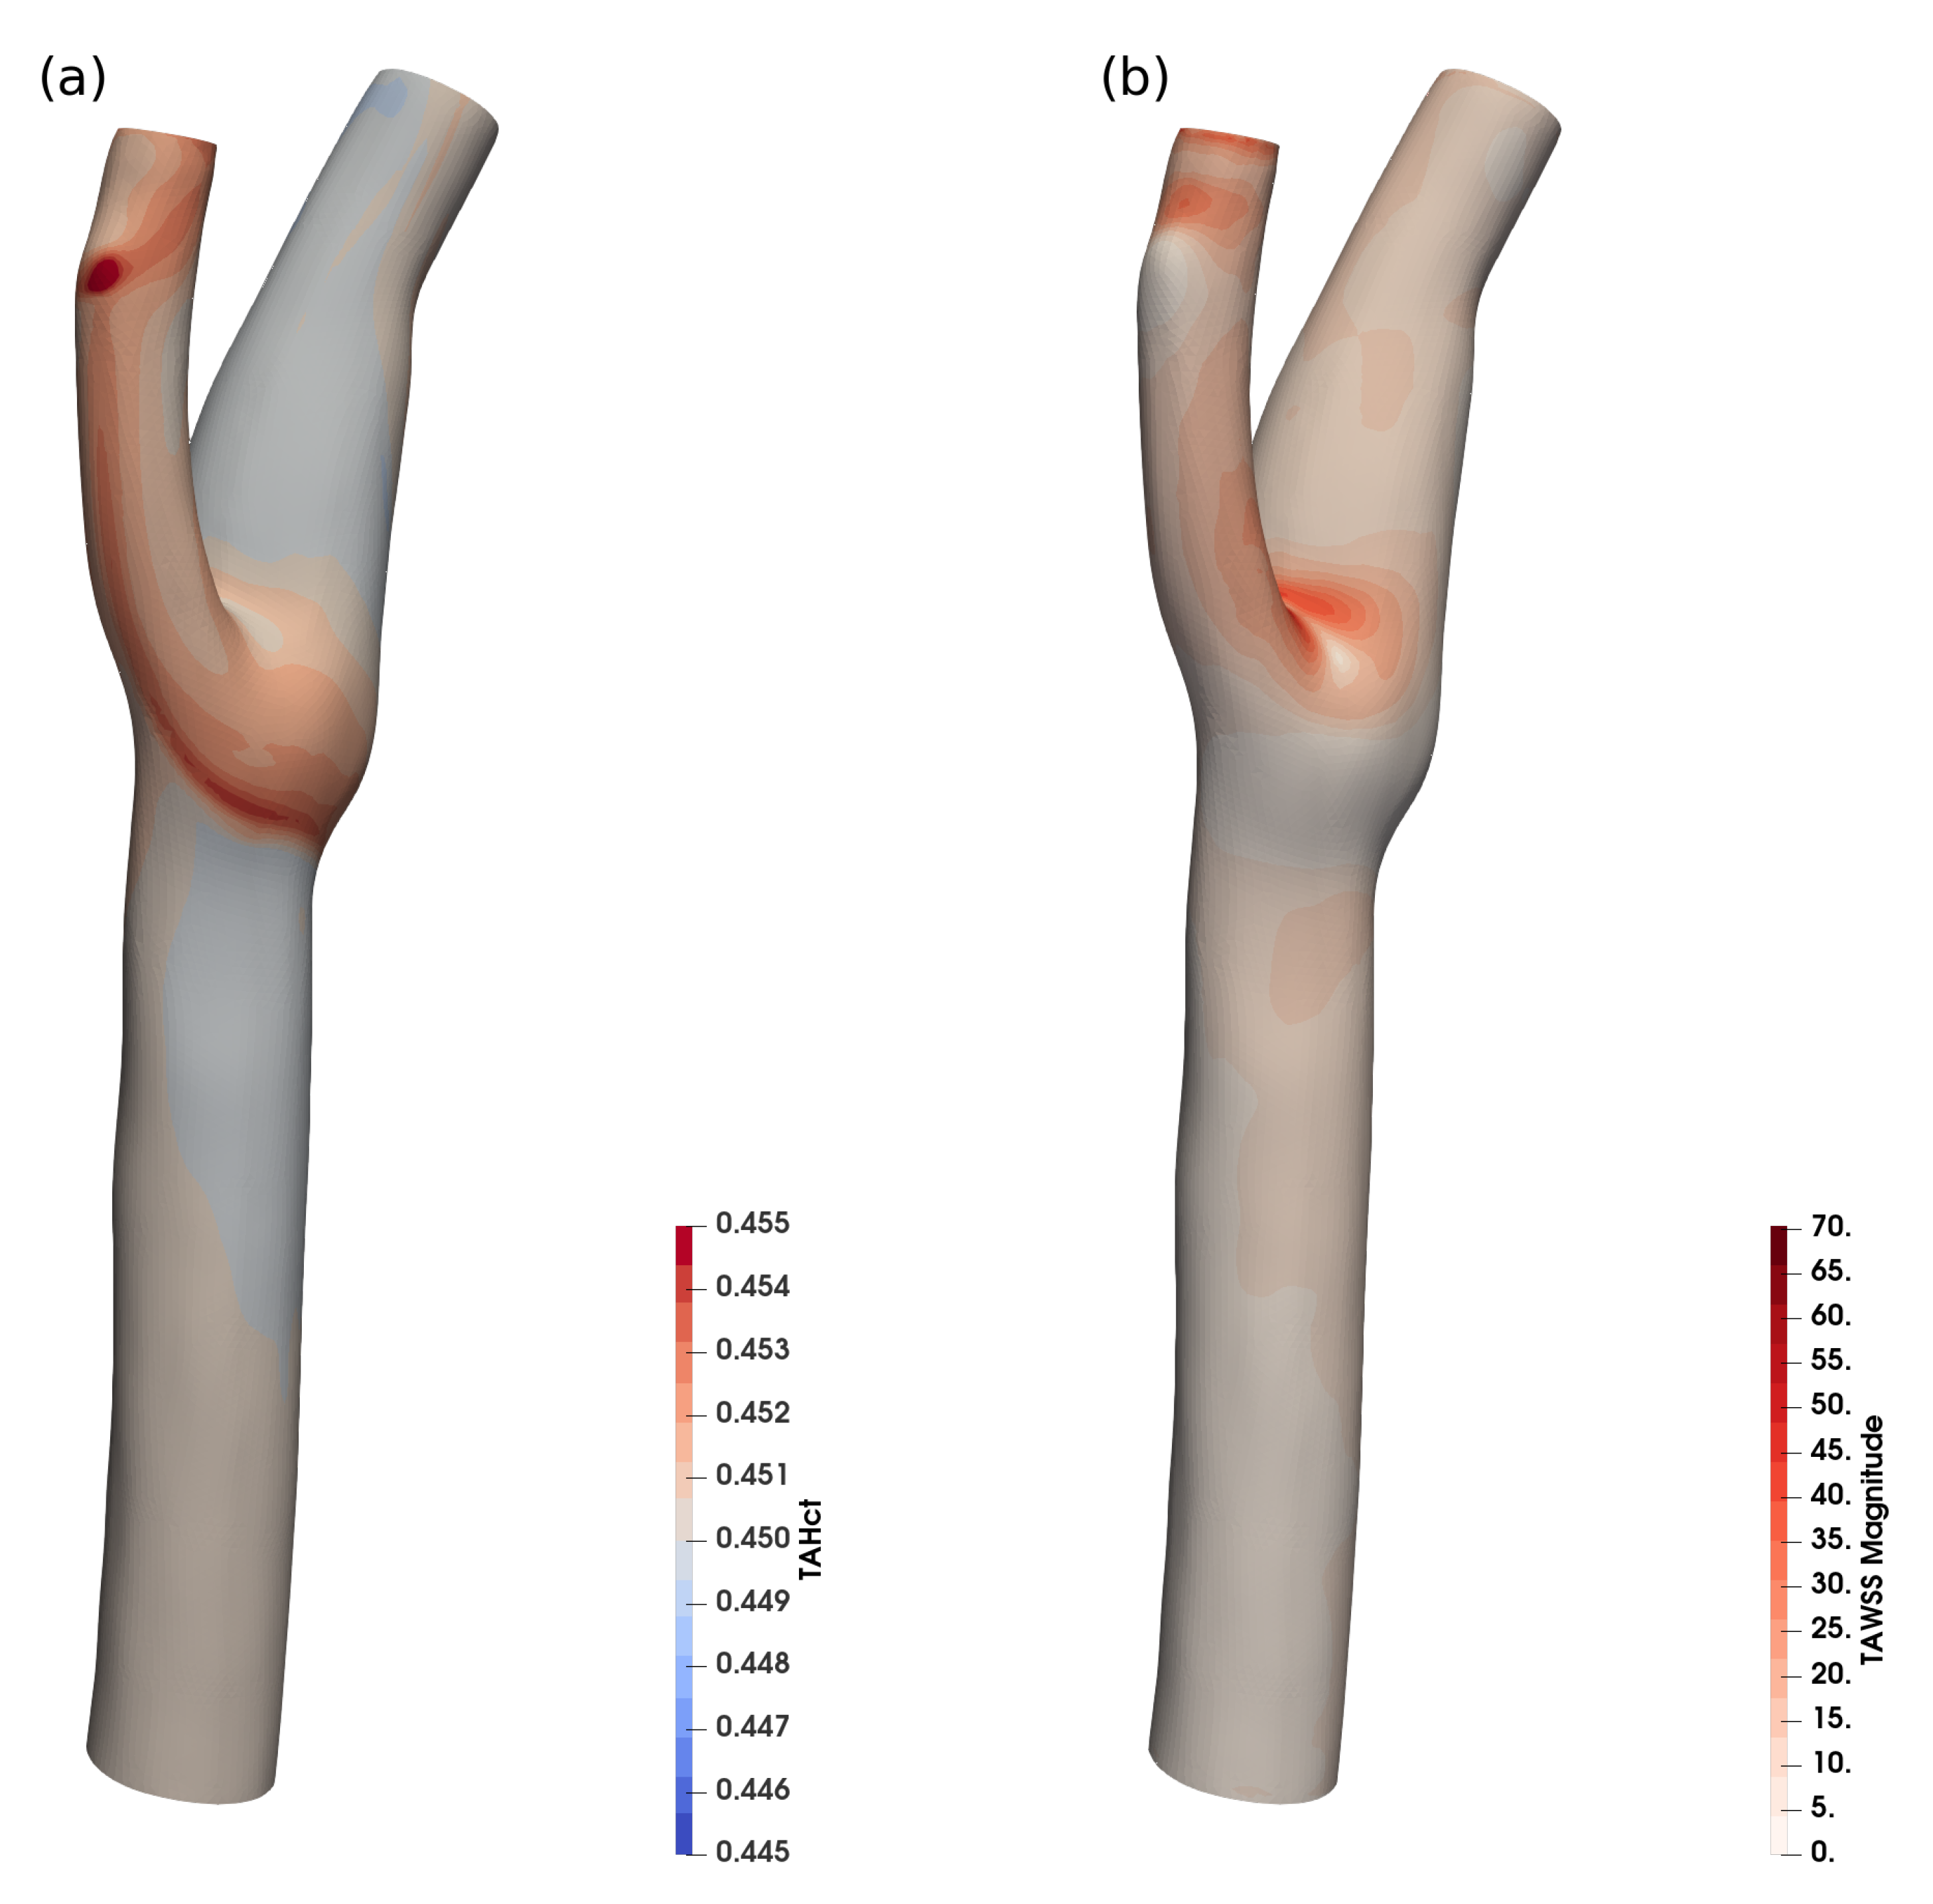
Figure 8 shows the time-averaged haematocrit concentration near the wall and the time-averaged WSS for a realistic human common carotid artery (CCA).

Figure 8.
Time averaged haematocrit (a) and WSS (b) in a realistic human carotid, 900 k cells.
The variation of haematocrit in this case is around , which is in agreement with the expected haematocrit variation for the size ().
While the haematocrit transport is not significant in this case, it shows that the implementation is also stable for physiological vessel shapes (and the reduced grid quality that is typical for clinical applications) and for highly dynamic flow. The haematocrit-dependent viscosity models can be employed, and for larger vessels, where the haematocrit transport can be neglected, the haematocrit equation can be frozen, to reduce simulation overhead.
4. Discussion
While previous implementations [17,19] of this class of model are limited by the fact that the viscosity term in Equation (5) is linearised in the viscosity gradient with H, our implementation avoids this by implementing the non-linear term directly, which (i) allows the use of different viscosity models and, crucially, (ii) facilitates the functional forms of transport parameter dependence on field variables we are constructing from the operation of our explicit, meso-scale models. Furthermore, the present implementation avoids the use of artificial stabilisation terms, that lead to underestimation of RBC migration [18].
The particle migration time scales with , where a is the RBC collision radius. This means that the particle migration is most relevant for small vessels of a diameter of 1 mm or lower, where the migration occurs on physiologically relevant timescales. For larger vessels, minor effects are caused by a synergy of particle migration and secondary flows [18] (Figure 8).
Limitations of the Model and Future Work
It has to be noted that the implementation presented here uses the magnitude of the shear in the particle flux formulation. As noted by Phillips [14], this assumes an essentially one-dimensional shear state, and an isotropic response. This limits the application of the model macroscopic to flow situations where the shear tensor is aligned with the flow and the main shear in radial direction, though it also provides a convenient initial simplification to our microscopic modelling. As with isotropic turbulence modelling the isotropic migration model will over-predict migration pressure in regions with high anisotropy, e.g., stagnation points, strong acceleration, or rotational shear. The authors are currently looking to implement an explicit formulation for a localised, anisotropic shear and migration pressure tensor, similar to approaches proposed by Miller [37] or Fang et al. [15].
Clearly, the parameters of the particle migration model we have used in this work are intentional targets for assignment using data from the operation of our explicit meso-scale simulations. Of course, for immediate impact, one might calibrate them to suitable experimental data, using established phenomenology. (Though note that the improved quantitative understanding we hope to obtain from our direct, meso-scale studies might produce the further benefit of insight into the functional form of transport parameter dependence upon field variables). While such experimental data are available, albeit scarce, for rigid particles in suspension, e.g., based on nuclear magnetic resonance measurements of particle profiles, the authors are not aware of any such data for soft vesicles, in particular RBCs. Here again, we hope eventually to use our recent meso-scale models (MCLBM) which account for the cellular-scale interactions in full detail [11] to refine and parameterise a constitutive equation for concentrated suspensions of deformable vesicles and hence to inform the present continuum model parameters. The results presented here provide us with the reassurance that, the final discussions below notwithstanding, a suitably sensitive, macro-scale model exists for this undertaking.
5. Software
The continuum-scale haemorheology framework was implemented in OpenFoam, version 1912 and 2012.
haemoFoam is a modelling framework for vascular flow simulation based on FOAM, that is intended to cater for the particular requirements of haemodynamics, in particular with respect to WSS related phenomena like atherosclerosis. At the time of writing it includes:
- Haematocrit transport model, modelling the shear driven transport of red blood cells in direction of the shear gradient.
- Blood specific non-Newtonian rheology models including haematocrit dependency and shear thinning behaviour:
- –
- Krieger Dougherty (non shear-thinning);
- –
- Modified K-D [25] (shear-thinning);
- –
- Quemada;
- –
- Yeleswarapu;
- –
- Casson–Merrill;
- –
- Carreau model (not concentration dependent, Fluent implementation).
- Windkessel boundary conditions for outlets.
- Fluid-Structure-Interaction (FSI) for flexible vessel walls.
- Post-processing for WSS and established WSS derived parameters:
- –
- TAWSS, TAWSSMag;
- –
- OSI;
- –
- Transverse WSS;
- –
- Relative Residence Time;
- –
- Temporal and spatial WSS gradients.
Planned future features are:
- Viscoelastic rheology models (e.g., Oldroyd B);
- Platelet transport;
- Low density lipoprotein (LDL) transport.
haemoFoam is open-sourced under GPL3 and will be made available to interested parties upon request.
Author Contributions
Conceptualization, T.S. and I.H.; methodology, T.S. and I.H.; software, T.S.; validation, T.S.; formal analysis, T.S.; writing—original draft preparation, T.S.; writing—review and editing, T.S. and I.H.; visualization, T.S.; funding acquisition, I.H. and T.S. All authors have read and agreed to the published version of the manuscript.
Funding
This research was funded by NHS Heart of England Trust grant number REC 15/WM/0164.
Institutional Review Board Statement
Not applicable.
Informed Consent Statement
Not appicable.
Data Availability Statement
The software (haemoFoam) is freely available to interested parties on github (TS-CUBED/haemoFoam). Please contact the author for testing and developer access.
Conflicts of Interest
The authors declare no conflict of interest.
Abbreviations
The following abbreviations are used in this manuscript:
| LBM | Lattice Boltzmann Method |
| CFD | Computational Fluid Mechanics |
| ADC | Antibody Drug Conjugates |
| MKM5 | Modified 5-parameter form of the Krieger model |
| FVM | Finite Volume Method |
| SIMPLE | Semi-Implicit Method for Pressure Linked Equations |
| PISO | Pressure-Implicit with Splitting of Operators |
| PIMPLE | compination of PISO and SIMPLE |
| CCA | Common Carotid Artery |
| WSS | Wall Shear Stress |
| OSI | Oscillatory Shear Index |
| TAWSS | Time Averaged WSS |
| TAWSSMag | Time Averaged WSS magnitude |
| RRS | Relative Residence Time |
References
- Holton, J.R. An Introduction to Dynamic Meteorology; Academic Press: Cambridge, MA, USA, 2004. [Google Scholar]
- Secomb, T.W. Blood Flow in the Microcirculation. Annu. Rev. Fluid Mech. 2017, 49, 443–461. [Google Scholar] [CrossRef]
- Bessonov, N.; Sequeira, A.; Simakov, S.; Vassilevskii, Y.; Volpert, V. Methods of Blood Flow Modelling. Math. Model. Nat. Phenom. 2016, 11, 1–25. [Google Scholar] [CrossRef] [Green Version]
- Tosenberger, A.; Salnikov, V.; Bessonov, N.; Babushkina, E.; Volpert, V. Particle Dynamics Methods of Blood Flow Simulations. Math. Model. Nat. Phenom. 2011, 6, 320–332. [Google Scholar] [CrossRef]
- Aidun, C.K.; Clausen, J.R. Lattice-Boltzmann Method for Complex Flows. Annu. Rev. Fluid Mech. 2010, 42, 439–472. [Google Scholar] [CrossRef]
- Clausen, J.R.; Reasor, D.A.; Aidun, C.K. Parallel Performance of a Lattice-Boltzmann/Finite Element Cellular Blood Flow Solver on the IBM Blue Gene/P Architecture. Comput. Phys. Commun. 2010, 181, 1013–1020. [Google Scholar] [CrossRef]
- Ladd, A.J.C. Numerical Simulations of Particulate Suspensions via a Discretized Boltzmann Equation. Part 1. Theoretical Foundation. J. Fluid Mech. 1994, 271, 285–309. [Google Scholar] [CrossRef] [Green Version]
- Ladd, A.J.C. Numerical Simulations of Particulate Suspensions via a Discretized Boltzmann Equation. Part 2. Numerical Results. J. Fluid Mech. 1994, 271, 311–339. [Google Scholar] [CrossRef] [Green Version]
- MacMeccan, R.M., III. Mechanistic Effects of Erythrocytes on Platelet Deposition in Coronary Thrombosis. Ph.D. Thesis, Georgia Institute of Technology, Atlanta, GA, USA, 2007. [Google Scholar]
- Dupin, M.M.; Halliday, I.; Care, C.M.; Alboul, L.; Munn, L.L. Modeling the Flow of Dense Suspensions of Deformable Particles in Three Dimensions. Phys. Rev. E Stat. Nonlinear Soft Matter Phys. 2007, 75, 066707. [Google Scholar] [CrossRef] [Green Version]
- Spendlove, J.; Xu, X.; Schenkel, T.; Seaton, M.A.; Halliday, I.; Gunn, J.P. Three-Dimensional Single Framework Multicomponent Lattice Boltzmann Equation Method for Vesicle Hydrodynamics. Phys. Fluids 2021, 33, 077110. [Google Scholar] [CrossRef]
- Burgin, K. Development of Explicit and Constitutive Lattice-Boltzmann Models for Food Product Rheology. Ph.D. Thesis, Sheffield Hallam University, Sheffield, UK, 2018. [Google Scholar]
- Leighton, D.; Acrivos, A. The Shear-Induced Migration of Particles in Concentrated Suspensions. J. Fluid Mech. 1987, 181, 415–439. [Google Scholar] [CrossRef]
- Phillips, R.J.; Armstrong, R.C.; Brown, R.A.; Graham, A.L.; Abbott, J.R. A Constitutive Equation for Concentrated Suspensions That Accounts for Shear-Induced Particle Migration. Phys. Fluids A Fluid Dyn. 1992, 4, 30–40. [Google Scholar] [CrossRef]
- Fang, Z.; Mammoli, A.A.; Brady, J.F.; Ingber, M.S.; Mondy, L.A.; Graham, A.L. Flow-Aligned Tensor Models for Suspension Flows. Int. J. Multiph. Flow 2002, 28, 137–166. [Google Scholar] [CrossRef]
- Nott, P.R.; Brady, J.F. Pressure-Driven Flow of Suspensions: Simulation and Theory. J. Fluid Mech. 1994, 275, 157–199. [Google Scholar] [CrossRef] [Green Version]
- Mansour, M.H.; Bressloff, N.W.; Shearman, C.P. Red Blood Cell Migration in Microvessels. Biorheology 2010, 47, 73–93. [Google Scholar] [CrossRef]
- Biasetti, J.; Spazzini, P.G.; Hedin, U.; Gasser, T.C. Synergy between Shear-Induced Migration and Secondary Flows on Red Blood Cells Transport in Arteries: Considerations on Oxygen Transport. J. R. Soc. Interface 2014, 11, 20140403. [Google Scholar] [CrossRef] [Green Version]
- Chebbi, R. Dynamics of Blood Flow: Modeling of Fåhraeus and Fåhraeus–Lindqvist Effects Using a Shear-Induced Red Blood Cell Migration Model. J. Biol. Phys. 2018, 44, 591–603. [Google Scholar] [CrossRef] [PubMed]
- Krieger, I.M.; Dougherty, T.J. A Mechanism for Non-Newtonian Flow in Suspensions of Rigid Spheres. Trans. Soc. Rheol. 1959, 3, 137–152. [Google Scholar] [CrossRef]
- Quemada, D. Rheology of Concentrated Disperse Systems and Minimum Energy Dissipation Principle—I. Viscosity-Concentration Relationship. Rheol. Acta 1977, 16, 82–94. [Google Scholar] [CrossRef]
- Quemada, D. Rheology of Concentrated Disperse Systems II. a Model for Non-Newtonian Shear Viscosity in Steady Flows. Rheol. Acta 1978, 17, 632–642. [Google Scholar] [CrossRef]
- Quemada, D. Rheology of Concentrated Disperse Systems III. General Features of the Proposed Non-Newtonian model. Comparison with Experimental Data. Rheol. Acta 1978, 17, 643–653. [Google Scholar] [CrossRef]
- Das, B.; Johnson, P.C.; Popel, A.S. Effect of Nonaxisymmetric Hematocrit Distribution on Non-Newtonian Blood Flow in Small Tubes. Biorheology 1998, 35, 69–87. [Google Scholar] [CrossRef]
- Hund, S.; Kameneva, M.; Antaki, J. A Quasi-Mechanistic Mathematical Representation for Blood Viscosity. Fluids 2017, 2, 10. [Google Scholar] [CrossRef]
- Merrill, E.W.; Gilliland, E.R.; Cokelet, G.; Shin, H.; Britten, A.; Wells, R.E. Rheology of Human Blood, near and at Zero Flow: Effects of Temperature and Hematocrit Level. Biophys. J. 1963, 3, 199–213. [Google Scholar] [CrossRef] [Green Version]
- Yeleswarapu, K.K.; Kameneva, M.V.; Rajagopal, K.R.; Antaki, J.F. The Flow of Blood in Tubes: Theory and Experiment. Mech. Res. Commun. 1998, 25, 257–262. [Google Scholar] [CrossRef]
- Brooks, D.E.; Goodwin, J.W.; Seaman, G.V. Interactions among Erythrocytes under Shear. J. Appl. Physiol. 1970, 28, 172–177. [Google Scholar] [CrossRef]
- Papir, Y.S.; Krieger, I.M. Rheological Studies on Dispersions of Uniform Colloidal Spheres: II. Dispersions in Nonaqueous Media. J. Colloid Interface Sci. 1970, 34, 126–130. [Google Scholar] [CrossRef]
- Cokelet, G.R.; Merrill, E.W.; Gilliland, E.R.; Shin, H.; Britten, A.; Wells, R.E. The Rheology of Human Blood—Measurement near and at Zero Shear Rate. Trans. Soc. Rheol. 1963, 7, 303–317. [Google Scholar] [CrossRef]
- Sequeira, A.; Janela, J. An Overview of Some Mathematical Models of Blood Rheology. In A Portrait of State-of-the-Art Research at the Technical University of Lisbon; Seabra Pereira, M., Ed.; Springer: Dordrecht, The Netherlands, 2007; pp. 65–87. [Google Scholar] [CrossRef]
- Wu, W.; Pott, D.; Mazza, B.; Sironi, T.; Dordoni, E.; Chiastra, C.; Petrini, L.; Pennati, G.; Dubini, G.; Steinseifer, U.; et al. Fluid–Structure Interaction Model of a Percutaneous Aortic Valve: Comparison with an In Vitro Test and Feasibility Study in a Patient-Specific Case. Ann. Biomed. Eng. 2015, 44, 590–603. [Google Scholar] [CrossRef]
- Jung, J.; Hassanein, A. Three-Phase CFD Analytical Modeling of Blood Flow. Med. Eng. Phys. 2008, 30, 91–103. [Google Scholar] [CrossRef]
- Casson, M. A Flow Equation for Pigment-Oil Suspensions of the Printing Ink Type. In Rheology of Disperse Systems; Pergamon Press: Oxford, UK, 1959; pp. 84–104. [Google Scholar]
- Patankar, S.V.; Spalding, D.B. A Calculation Procedure for Heat, Mass and Momentum Transfer in Three-Dimensional Parabolic Flows. Int. J. Heat Mass Transf. 1972, 15, 1787–1806. [Google Scholar] [CrossRef]
- Issa, R.I.; Gosman, A.D.; Watkins, A.P. The Computation of Compressible and Incompressible Recirculating Flows by a Non-Iterative Implicit Scheme. J. Comput. Phys. 1986, 62, 66–82. [Google Scholar] [CrossRef]
- Miller, R.M.; Singh, J.P.; Morris, J.F. Suspension Flow Modeling for General Geometries. Chem. Eng. Sci. 2009, 64, 4597–4610. [Google Scholar] [CrossRef]


Publisher’s Note: MDPI stays neutral with regard to jurisdictional claims in published maps and institutional affiliations. |
© 2021 by the authors. Licensee MDPI, Basel, Switzerland. This article is an open access article distributed under the terms and conditions of the Creative Commons Attribution (CC BY) license (https://creativecommons.org/licenses/by/4.0/).