Abstract
In this study, a new three-statement randomized response estimation method is proposed to improve the drawback that the maximum likelihood estimation method could generate a negative value to estimate the sensitive-nature proportion (SNP) when its true value is small. The Bayes estimator of the SNP is obtained via using a hierarchical Bayesian modeling procedure. Moreover, a hybrid algorithm using Gibbs sampling in Metropolis–Hastings algorithms is used to obtain the Bayes estimator of the SNP. The highest posterior density interval of the SNP is obtained based on the empirical distribution of Markov chains. We use the term 3RR-HB to denote the proposed method here. Monte Carlo simulations show that the quality of 3RR-HB procedure is good and that it can improve the drawback of the maximum likelihood estimation method. The proposed 3RR-HB procedure is simple for use. An example regarding the homosexual proportion of college freshmen is used for illustration.
1. Introduction
Warner [1] is the pioneer to propose the randomized response (RR) method for evaluating the sensitive-nature proportion (SNP). An individual in the RR method of [1] is required to answer “yes” or “no” to either the statement “I am a member of group A” or “I am not a member of group A” where group A is a sensitive-nature statement. Since the interviewees do not need to release the selected statement to the interviewer, the interviewees can be supposed to confide in the interviewer the true answer.
Let denote the population SNP and n be the sample size of interviewees. In the RR survey, Y interviewees answer “yes”. It is trivial to show that Y follows a binomial distribution with the sample size n and proportion of , where denotes the proportion of selecting the sensitive-nature statement. Denote . Warner [1] obtained the maximum likelihood estimator of , denoted by , and its variance is as follows:
and
We use the term MLE to denote maximum likelihood estimator/estimate here. Equations (1) and (2) can be used to construct the confidence interval of . The MLE proposed by [1] is valid only if and . When the value of is small, the MLE of could be negative. This fact makes the method of [1] invalid to infer , as its true value is small.
New RR methods have been proposed after [1]. Greenberg et al. [2] proposed an unrelated question RR methods. They proposed a theoretical framework to infer the model parameters for the design of two statements. A new RR procedure was proposed by Mangat and Singh [3]. Their method used two randomization devices to design the RR strategy. Mangat and Singh [3] demonstrated that their new strategy was more efficient than the usual strategy of [1].
Kuk [4] proposed an alternative method to perform an RR survey. The design method of [4] does not require direct answers from the interviewees, and such a design can enhance the confidence of interviewees to tell the true answer. The method of [4] can be applied to both qualitative and quantitative questions. Kuk [4] suggested to collect data for a mixture distribution, and the problem can reduce to the estimation of a mixture proportion.
Chaudhuri [5] emphasized the protection of the interviewee’s privacy and also studied the impact of simple random sampling design on the final conclusions. Chaudhuri [5] illustrated two existing RR devices for indicating how an estimator along with an estimated measure of its error could be developed when the RR sample may be drawn adopting a complex survey design involving unequal selection probabilities with or without replacement.
Christofides [6] proposed a generalized RR (GRR) technique to eliminate a major bias in surveys of the population SNP resulting from an interviewee’s refusal when using the RR method of [1]. Chang et al. [7] considered a simple generalization for some existing investigations and suggested suitable selection strategies for design parameters. They also discussed the superiority of their proposed strategies over the RR strategy of [1].
Hsieh et al. [8] proposed a modified GRR (MGRR) approach for a multi-level attribute using a single sensitive item. The MGRR approach has some merits over the other counterparts. Hsieh et al. [8] suggested using the Markov chain Monte Carlo (MCMC) method to obtain the Bayes estimator of the SNP instead of the maximum likelihood estimation method. We use the term BE to denote Bayes estimator/Bayes estimate here. Examples about using Bayesian methods for real applications can be found in the book of Gelman et al. [9].
Bar-Lev et al. [10] presented a Bayesian approach to four RR models. They used truncated beta distributions in a common conjugate prior structure to obtain the BE of the SNP. Barabesi and Marcheselli [11] proposed a Bayesian estimation procedure to obtain the BE of the SNP based on Frankin’s RR procedure. They conducted a simulation study to evaluate the quality of their proposed method.
Barabesi and Marcheselli [12] proposed a Bayesian method to the joint estimation of the SNPs and sensitivity level of a stigmatizing attribute via applying a two-stage RR design. The MGRR method is designed for a multi-level attribute using a single sensitive-nature statement. Hsieh et al. [8] suggested using the MCMC approach to obtain the BE of the SNP. The MGRR method is effective to obtain a reliable BE of the SNP. However, the MGRR method could be too complicated to implement for users.
Bayesian estimation methods are useful for modeling multi-faceted or nonlinear practical phenomena other than the maximum likelihood estimation method. Among all popular Bayesian estimation methods, the hierarchical Bayesian (HB) modeling method can be run with multiple hierarchical levels for estimating the parameters of posterior distribution. If grouped observations are used in a survey, hierarchical modeling is a relevant design to obtain the reliable BEs of model parameters.
The example in Section 4 of this study is based on college students from different groups to study the homosexual proportion in a region during different years. Hence, the HB modeling method is helpful to obtain the reliable BEs of model parameters. The HB modeling method has been commonly applied in many different areas when the information on several different levels of observational units is available; see [12] for comprehensive discussions. It is helpful to apply hierarchical analysis forms to understand multi-parameter problems and design computational strategies.
However, heavy computation loading is a problem to obtain BEs of the model parameters using the HB modeling method. Taking advantage of the recent advances of computer power, it becomes easier to reduce the impact of computation loading when using HB modeling methods for data analysis. Some applications using the HB modeling method other than the RR design can be found in [13,14,15,16,17,18,19,20,21,22]. The HB modeling method is not yet applied for RR design. The implementation of the proposed 3RR-HB modeling method is discussed in Section 3.
2. Motivation and Organization
The traditional RR methods of [1,2] are simple to use. However, the MLE of the SNP could be negative when the true value of the SNP is small. In order to make interviewees more confident to tell the true answer in the survey, it is helpful to use more than one non-sensitive-nature statement in the RR method. Hence, we extend the traditional RR design of [2] to a three-statement RR method, which contains one sensitive-nature and two non-sensitive-nature statements.
To escape the trap of obtaining a negative MLE of the SNP, the HB modeling method is adopted to improve the drawback of the maximum likelihood estimation method when the true value of the SNP is small. In order to overcome the complexity of numerical computation to obtain the BE of the SNP, the hybrid algorithm of using Gibbs sampling in the Metropolis–Hastings algorithm is proposed to implement the MCMC method to obtain the BEs of model parameters. The main contribution of this study is to propose a 3RR-HB procedure to obtain the BE of the SNP. Moreover, the highest posterior density interval (HPDI) of the SNP is constructed. The proposed 3RR-HB procedure can improve the drawback of using a negative MLE to estimate the population SNP when its true value is small.
The rest of this paper is organized as follows: In Section 3, we present the data structure and introduce the proposed 3RR-HB procedure. In Section 4, an example regarding the homosexual proportion of college freshmen is used to demonstrate the applications of the proposed 3RR-HB procedure. A Monte Carlo simulation study is also conducted in Section 4 to study the weakness of maximum likelihood estimation method and evaluate the quality of the proposed 3RR-HB procedure. Some concluding remarks are given in Section 5.
3. Materials and Methods
Conducting a RR survey with two non-sensitive-nature and one sensitive-nature statements as follows: (i) I am in Group A; (ii) I am in Group B; and (iii) I am in Group C. Group A is a sensitive-nature statement; Group B and Group C are non-sensitive-nature statements. Interviewees have probabilities , and to randomly answers the Statements (i), (ii) and (iii). In this study, the values of , and are pre-assigned.
The interviewees do not need to release which statement they have replied to the interviewer. Let , and denote the probabilities of individual answering “yes” under the Statement (i), (ii) and (iii), respectively and denote the probability of answering “yes” in the sample. It is trivial to shown that . In this study, the values of and are known in the RR design.
Let the sample size be n, in which Y of them answer “yes”. It can be shown that . The log-likelihood function based on the data can be presented as
The MLE of to maximize can be presented by
where . We note that is valid only if the working condition of
is true. Unfortunately, Equation (5) is often violated when the value of is small. The fact makes the maximum likelihood estimation method unreliable for the cases of small . We will show that the failure rate of is high via using the Monte Carlo simulation method in Section 4.
The Bayesian inference method is used to obtain the BE of . Let be random and follow the prior distribution of Beta, :
where and are hyper-parameters. The posterior distribution can be presented by
In some occasions, we may collect RR samples from different regions or time periods. One example is to evaluate the homosexual proportions of the freshmen who enrolled in a university over different years. Since the enrolled freshmen come from different cities year by year, it is reasonable to assume that the proportion of homosexual freshmen varies year by year. Therefore, the SNPs are the proportions of homosexual freshmen in k years, denoted by .
These values of are different. In this study, we are interested in studying the trend of the population proportion of the homosexual freshmen in a university over years. A 3RR-HB method is developed to obtain the BEs of SNPs along with . If all SNPs are same; that is, for .
Taking summation to the both sides of the equation for , we can obtain . Let , and , we can obtain
Assume that RR sub-samples were collected from k different regions or time periods and the values of are different. Let denote the ith RR sample and , where for . Let and , and the data structure can be simplified as . To avoid subjectively setting up the values of hyper-parameters, the HB modeling method is used to develop the proposed Bayesian inference procedure. Let for . The density function of can be denoted by
Using the square loss function for the Bayesian inference, the BE of , denoted by , is the posterior mean based on the in Equation (7), and we can present by
Therefore, the BE of can be obtained by
It is trivial that if . It could be subjective to select the values of and for Bayesian inference. Hence, the HB modeling method is used in the proposed Bayesian estimation procedure to obtain the BEs of model parameters.
To implement the HB modeling method, we need to assume the second layer of prior distribution. Let and follow a hyper-prior distribution with the structure of a product of two Gamma distributions:
where
and
For simplification, let . The full posterior distribution can be presented by
Moreover, the conditional posterior of , given and can be presented by , . The value of during the MCMC computation can be updated by
Based on the condition of , we can obtain
Given the values of and , we can shown that
where
The set can be used to guarantee for . Hence, can be a reference set to select the hyper-parameter when a value of is generated and the data of are collected.
The proposed hybrid algorithm is constructed as follows: Let and denote the vector of parameters by removing and from , respectively. After algebraic computation, the marginal density distributions of and can be obtained, respectively, by
and
In order to overcome the difficulty to update and via using Equations (18) and (19) in the Gibbs sampling procedure, the Metropolis and Hastings algorithm is used to update and . Hence, the proposed hybrid algorithm for implementing the HB modeling method can be followed based on the following steps:
- Step 1:
- For , generate and , where is the proposal to generate . Update by if , whereotherwise, .
- Step 2:
- For , generate and , where is the proposal to generate . Update by if , whereotherwise, .
- Step 3:
- Generate and evaluate by for . If , update ; otherwise, , .
- Step 4:
- Repeat Step 1 to Step 3 B times, where B is a big positive integer. Perform the burn-in step by removing the leading Markov chains. The BE of parameter is obtained via using the remainder Markov chains. Since the square loss function is considered in this study, the BEs and , .
Some proposals with the property of , where is the target parameter for update, can be selected to reduce the computation loading of MCMC—for example, the normal or uniform distribution. When such proposals are used to implement the MCMC approach, Equations (20) and (21) can reduce to
and
respectively. In this study, the normal distribution is considered as the proposal for MCMC approach. Generate and . If , we do not update ; if , we do not update . The obtained Markov chains based on the proposed 3RR-HB procedure can also be used to construct the empirical distribution of BE. Then, the HPDI of the model parameter can be obtained via using the empirical distribution of BE. The applications of the proposed 3RR-HB procedure and its quality will be studied in Section 4 via using a real example and Monte Carlo simulations.
4. Applications
4.1. Homosexual College Freshmen Survey Example
A RR survey was first conducted in October of 2019 and repeated in October of 2020 to evaluate the homosexual proportion of freshmen in a university, located in north Taiwan. College students from different majors were interviewed and asked to answer “yes” or “no” to one of the following three statements: (i) Is the last code of your ID card even? (ii) Is the last code of your student ID card even? (iii) Are you homosexual? Clearly, only Statement (iii) is a sensitive-nature statement.
Each student in the RR survey randomly draw a ball from a urn, which contains five white, five green and five red balls. If the drawn ball is white, answer Statement (i); if the drawn ball is green, answer Statement (ii); otherwise, answer Statement (iii). Students do not need to release the ball’s color to the interviewer. The three-statement RR design can make students fully confide the true answer in the interviewer.
The samples are , in 2019 and , in 2020. It is trivial to obtain that and . The data set is composed of and . The MLEs of and can be obtained by and via using Equation (4). We note that the values of and are small and that these two MLEs could be unreliable. The proposed 3RR-HB procedure in Section 3 is applied to characterize the data sets and obtain the BEs with and .
We need to set up the parameters of , , , in the hyper-prior distribution. Based on the sample information of and , we can assume that the expected values is in (0.33, 0.36). Since we do not have sufficient information to set up the values of , , , in Equations (13) and (14), we would select the proper vales of , , , to generate large variances of and , and hence the prior distributions of and become non-informative to obtain BEs of the model parameters.
The combinations of , , and that satisfy the condition of can be selected for simulations where . A simulation study of sensitivity analysis for the selections of possible values of , , and was conducted to show that our proposed method is less sensitive to the selection of , , and ; that is, the obtained BEs of model parameters are less sensitive to the selection of , , and . Five combinations of , , and were selected.
All these combinations can generate a wide range of large to extreme large variances of and . All selected parameters combinations can have similar values of ; see Table 1. We label these five combinations as C-I: , C-II: , C-III: , C-IV: and C-V: . Using the normal proposals for the proposed MCMC procedure to generate and . If , we do not update ; if , we do not update . All the estimation results are reported in Table 2 and Table 3.

Table 1.
The parameters in the hyper-prior for simulations.
Table 2.
The obtained BEs and their standard errors (SEs) via using the proposed 3RR-HB method.
Table 3.
The acceptance rates for , , and .
In view of Table 2 and Table 3, we can find the strength of the proposed 3RR-HB procedure. Table 2 shows that the obtained BEs based on the proposed 3RR-HB procedure are reliable. All bias and standard errors (SEs) of BEs based on the proposed 3RR-HB procedure with 10,000 iterations, where and , are small. Moreover, all acceptance rates in Table 3 are larger than . Since , all the generated values are accepted. Therefore, the acceptance rates of and are . Moreover, the obtained BE of the homosexual proportion of college freshmen in the region is about in 2019 and in 2020.
The empirical distribution can be constructed based on the obtained Markov chains of BEs. Using the values of , , and of C-III in Table 1, the HPDI of and are (0, 0.174) and (0, 0.168), respectively. Overall, we can conclude that the point homosexual proportion of college freshmen in the region in 2019 and 2020 was about and and then up to and , respectively, under the considering of sampling error with confidence. The length of HPDI is long as the sample size is small. If the confident coefficient is used instead of , the length of the HPDI of will be longer than the HPDI for .
4.2. Monte Carlo Simulations
A Monte Carlo simulation study was conducted to verify the quality of the proposed 3RR-HB procedure. Referring to the example information in Section 4.1, we let , and with to generate random samples of and . For each given value of , we generate for .
Let and . The proposed 3RR-HB procedure with B = 50,000, = 10,000 is implemented. Moreover, the BEs of are obtained based on the values of , , , of C-III in Table 1. Repeat each simulation procedure 10,000 times, and then the bias and mean squared error (MSE) of each BE are evaluated based on the 10,000 runs. All simulation results are reported in Figure 1 and Table 4, Table 5 and Table 6.
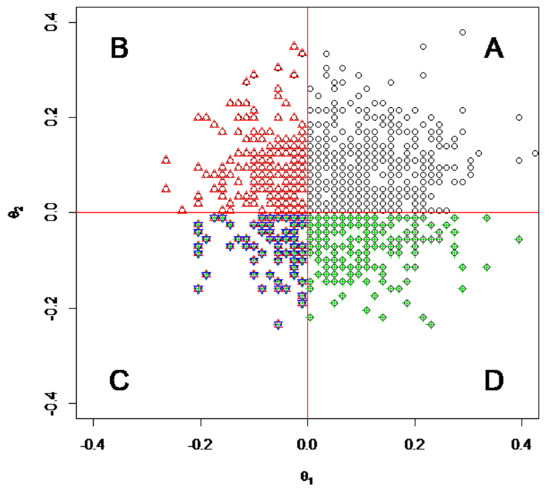
Figure 1.
The scatter plot of 1000 MLEs of and for the case of and .
Table 4.
The sample proportions of the MLEs of and based on 10,000 runs.
Table 5.
The bias and MSEs of BEs for .
Table 6.
The bias and MSEs of BEs for .
Figure 1 displays the scatter plot of the first MLEs of and for and . We can see that many pairs of and are in Zones B, C, or D, and those pairs are invalid MLEs due to or . Only the pairs of and in Zone A are valid due to the required conditions and .
We found that 7020 MLEs of with the proportion of 0.702 and 6930 MLEs of with the proportion of 0.603 in Table 4 were positive when and . In a scan of Table 4, we find that the maximum likelihood estimation method has a high risk to generate invalid values of and if the true values of and are closed to zero. The sample proportions of and are increased as n is increased. However, as the RR method goes through an interview process, it could be difficult to collect an large sample to obtain reliable MLEs of and .
As many negative MLEs were found, the bias and MSE of MLE are not reliable. Table 5 and Table 6 only report the bias and MSE of BE. In view of Table 5 and Table 6, we found that the bias and MSE of BE is declined as n increased. The bias and MSEs of and were small. Hence, the simulation results indicate that the proposed 3RR-HB procedure can be a reliable method to evaluate SNP.
5. Conclusions
In this paper, we proposed a 3RR-HB procedure to infer the SNP by considering a hierarchical structure for the prior distribution in Bayesian modeling. Moreover, the Beta-Binomial distribution was applied to characterize the RR samples. In order to overcome the computation complexity, the hybrid algorithm of using Gibbs sampling in Metropolis–Hastings algorithm was adopted to update the model parameters during MCMC computation. The proposed 3RR-HB procedure method is simple and minimally subjective for use.
A data set regarding the homosexual proportion of college freshmen was used to illustrate the applications of the proposed 3RR-HB procedure. We also conducted Monte Carlo simulations to study the performance of the proposed 3RR-HB procedure. The simulation results showed that the proposed 3RR-HB procedure was reliable to obtain the BEs of model parameters. Moreover, the 3RR-HB procedure can help users to escape the drawback of using invalid MLE to estimate the SNP.
The design of equal probabilities for the three statements was used to obtain RR samples. Such a design will reduce the chance of interviewees to select the sensitive-nature statement. However, such a design can enhance the willing of interviewees to confide in the interviewer the true answer. The equal-probability design is a trade-off. Practitioners can use unequal-probability design to obtain RR samples to implement the proposed 3RR-HB procedure based on their considerations.
We only used one sensitive-nature statement to obtain RR samples. It will be interesting to expand the proposed method for the RR method containing two or more sensitive-nature statements. How to establish the HB modeling inference procedure for the RR method with two or more sensitive-nature statements is an open question that can be studied in the future.
Author Contributions
Data curation, C.-Y.H.; Funding acquisition, T.-R.T.; Investigation, T.-R.T.; Methodology, H.X. and J.Z.; Project administration, T.-R.T.; Resources, J.Z.; Software, H.X. and C.-Y.H.; Supervision, T.-R.T.; Writing—original draft, T.-R.T.; Writing—review and editing, T.-R.T. All authors have read and agreed to the published version of the manuscript.
Funding
This study is supported by the grant of Ministry of Science and Technology, Taiwan MOST 108-2221-E-032-018-MY2.
Informed Consent Statement
Informed consent was obtained from all subjects involved in the study. The randomize response survey is based on the project of Ministry of Science and Technology, Taiwan MOST 108-2813-C-032-002-M for the authors Chieh-Yi Hung and under the supervision of the author Tzong-Ru Tsai.
Data Availability Statement
The data can be found in Section 4.
Conflicts of Interest
The authors declare no conflict of interest.
References
- Warner, S.L. Randomized response: A survey technique for eliminating evasive answer bias. J. Am. Stat. Assoc. 1965, 60, 63–69. [Google Scholar] [CrossRef]
- Greenberg, B.G.; Abul-Ela, E.L.A.; Simmons, W.R.; Horvitz, D.G. The unrelated question randomized response model: Theoretical framework. J. Am. Stat. Assoc. 1969, 64, 520–539. [Google Scholar] [CrossRef]
- Mangat, N.S.; Singh, R. An alternative randomized response procedure. Biometrika 1990, 77, 439–442. [Google Scholar] [CrossRef]
- Kuk, A.Y.C. Asking sensitive questions indirectly. Biometrika 1990, 77, 436–438. [Google Scholar] [CrossRef]
- Chaudhuri, A. Using randomized response from a complex survey to estimate a sensitive proportion in a dichotomous finite population. J. Stat. Plan. Inference 2001, 94, 37–42. [Google Scholar] [CrossRef]
- Christofides, T.C. A generalized randomized response technique. Metrika 2003, 57, 195–200. [Google Scholar] [CrossRef]
- Chang, H.-J.; Wang, C.-L.; Huang, K.-C. On estimating the oroportion of a qualitative sensitive character using randomized response sampling. Qual. Quant. 2004, 38, 375–680. [Google Scholar]
- Hsieh, S.H.; Lee, S.-M.; Tu, S.-H. Randomized response techniques for a multi-level attribute using a single sensitive question. Stat. Pap. 2018, 59, 291–306. [Google Scholar] [CrossRef]
- Gelman, A.; Carlin, J.B.; Stern, H.S.; Rubin, D.B. Bayesian Data Analysis, 2nd ed.; CRC Press: Boca Raton, FL, USA, 2004; ISBN 1-58488-388-X. [Google Scholar]
- Bar-Lev, S.K.; Bobovich, E.; Boukai, B. A common conjugate prior structure for several randomized response models. Test 2003, 12, 101–113. [Google Scholar] [CrossRef]
- Barabesi, L.; Marcheselli, M. A practical implementation and Bayesian estimation in Franklin’s randomized response procedures. Commun. Stat.-Simul. Comput. 2006, 35, 563–573. [Google Scholar] [CrossRef]
- Barabesi, L.; Marcheselli, M. Bayesian estimation of proportion and sensitivity level in randomized response procedures. Metrika 2010, 72, 75–88. [Google Scholar] [CrossRef]
- Arnab, R.; Singh, S. Randomized response techniques: An application to the Botswana AIDS impact survey. J. Stat. Plan. Inference 2010, 140, 941–953. [Google Scholar] [CrossRef]
- Bae, K.; Mallick, B.K. Gene selection using a two-level hierarchical Bayesian model. Bioinformatics 2004, 20, 3423–3430. [Google Scholar] [CrossRef] [Green Version]
- Dobigeon, N.; Tourneret, J.-Y.; Chang, C.-I. Semi-Supervised linear spectral unmixing using a hierarchical Bayesian model for hyperspectral imagery. IEEE Trans. Signal Process. 2008, 56, 2684–2695. [Google Scholar] [CrossRef] [Green Version]
- Behmanesh, I.; Moaveni, B.; Lombaert, G.; Papadimitriou, C. Hierarchical Bayesian model updating for structural identification. Mech. Syst. Signal Process. 2015, 64, 360–376. [Google Scholar] [CrossRef] [Green Version]
- Weber, S.A.; Insaf, T.Z.; Hall, E.S.; Talbot, T.O.; Huff, A.K. Assessing the impact of fine particulate matter (PM2.5) on respiratory-cardiovascular chronic diseases in the New York City Metropolitan area using Hierarchical Bayesian model estimates. Environ. Res. 2016, 151, 399–409. [Google Scholar] [CrossRef] [PubMed] [Green Version]
- Gastelu, J.V.; Trujillo, J.D.M.; Padilha-Feltrin, A. Hierarchical Bayesian model for estimating spatial-temporal photovoltaic potential in residential areas. IEEE Trans. Sustain. Energy 2018, 9, 971–979. [Google Scholar] [CrossRef]
- Xie, Z.; Wu, T.; Yang, X.; Zhang, L.; Wu, K. Jointly social grouping and identification in visual dynamics with causality-induced hierarchical Bayesian model. J. Vis. Commun. Image Represent. 2019, 59, 62–75. [Google Scholar] [CrossRef]
- Alarcon, A.; Sánchez, C.; Bernstein, G.M. Redshift inference from the combination of galaxy colours and clustering in a hierarchical Bayesian model. Mon. Not. R. Astron. Soc. 2019, 498, 2801–2813. [Google Scholar]
- Zhang, X.; Dong, Q.; Costa, V.; Wang, X. A hierarchical Bayesian model for decomposing the impacts of human activities and climate change on water resources in China. Sci. Total. Environ. 2019, 665, 836–847. [Google Scholar] [CrossRef]
- Tonkin-Hill, G.; Lees, J.A.; Bentley, S.D.; Frost, S.D.W.; Corander, J. Fast hierarchical Bayesian analysis of population structure. Nucleic Acids Res. 2019, 47, 5539–5549. [Google Scholar] [CrossRef] [PubMed] [Green Version]

Publisher’s Note: MDPI stays neutral with regard to jurisdictional claims in published maps and institutional affiliations. |
© 2021 by the authors. Licensee MDPI, Basel, Switzerland. This article is an open access article distributed under the terms and conditions of the Creative Commons Attribution (CC BY) license (https://creativecommons.org/licenses/by/4.0/).