Abstract
Digital storytelling platforms have proven to be a great way of bringing cultural heritage closer to people. What lacks is a deeper understanding of the user experience of such systems, especially in multi-platform digital storytelling. For the last three years, we have been developing a project called Spotlight Heritage Timisoara, which is at its core a digital storytelling platform for the city of Timisoara (Romania), soon to be European Capital of Culture in 2023. The project consists of a website, mobile applications, and interactive museographic and street exhibitions. This paper presents a multi-platform usability evaluation study which employed semi-structured interviews, observations, think-aloud protocol, SUS questionnaire, Net Promoter Score and Product Reaction Cards to gather insights from 105 participants and reveal usability problems in the Spotlight Heritage context. We found out that the four platforms, i.e., interactive touchscreen table, desktop/laptop, mobile and Augmented Reality, have very good usability scores, are considered accessible and useful, work seamlessly together, and create user satisfaction and loyalty, across demographic groups, having the potential to bring people closer to cultural heritage.
1. Introduction
Digital Storytelling is a successful combination between the ancient and time-proven art of telling a story and the possibilities of technology today. It has been applied in various domains, one of the most interesting areas being the Cultural Heritage, where it has proven its capabilities of bringing heritage elements closer to people.
Cultural Heritage is experimented in many forms today, from visiting a museographic exhibition to surfing the museum’s website or mobile app or using Augmented Reality applications while in front of artworks. Because of this, there is a strong need for testing and adapting the user experience of such digital products in order to provide a fulfilling experience to the visitor.
In the next subsections, we introduce a multi-platform digital storytelling concept that we developed and tested. We also describe the research aims of this paper.
1.1. Project Description
Spotlight Heritage Timisoara is a digital cultural initiative of the Politehnica University of Timisoara, through the eLearning Centre and the Multimedia Center, realized in partnership with the National Museum of Banat, part of the Timisoara European Capital of Culture program. Spotlight Heritage Timisoara reveals, by digital storytelling, the city of Timisoara through stories of cultural and historical heritage, technical development, communities, and neighborhoods, interwoven with the personal stories of the inhabitants of yesterday and today.
The open, participatory mobile applications and web platform contain Landmarks (data and information of cultural and historical heritage, geographically mapped, photos and films, with recognition of buildings by augmented reality—with information and old pictures superimposed, as well as 360 images), Sequences (personal stories of the inhabitants which provide a historical, social, and cultural background to the landmarks in the neighborhood presented in the classic exhibition in the attic of the Maria Theresia Bastion), Community (information from the history of neighborhoods, communities, ethnic groups, organizations that were or are present in the neighborhood), Your story (users can add their own personal stories, comments, photos, videos), and Events (events from exhibitions, guided tours offered with high school teenagers).
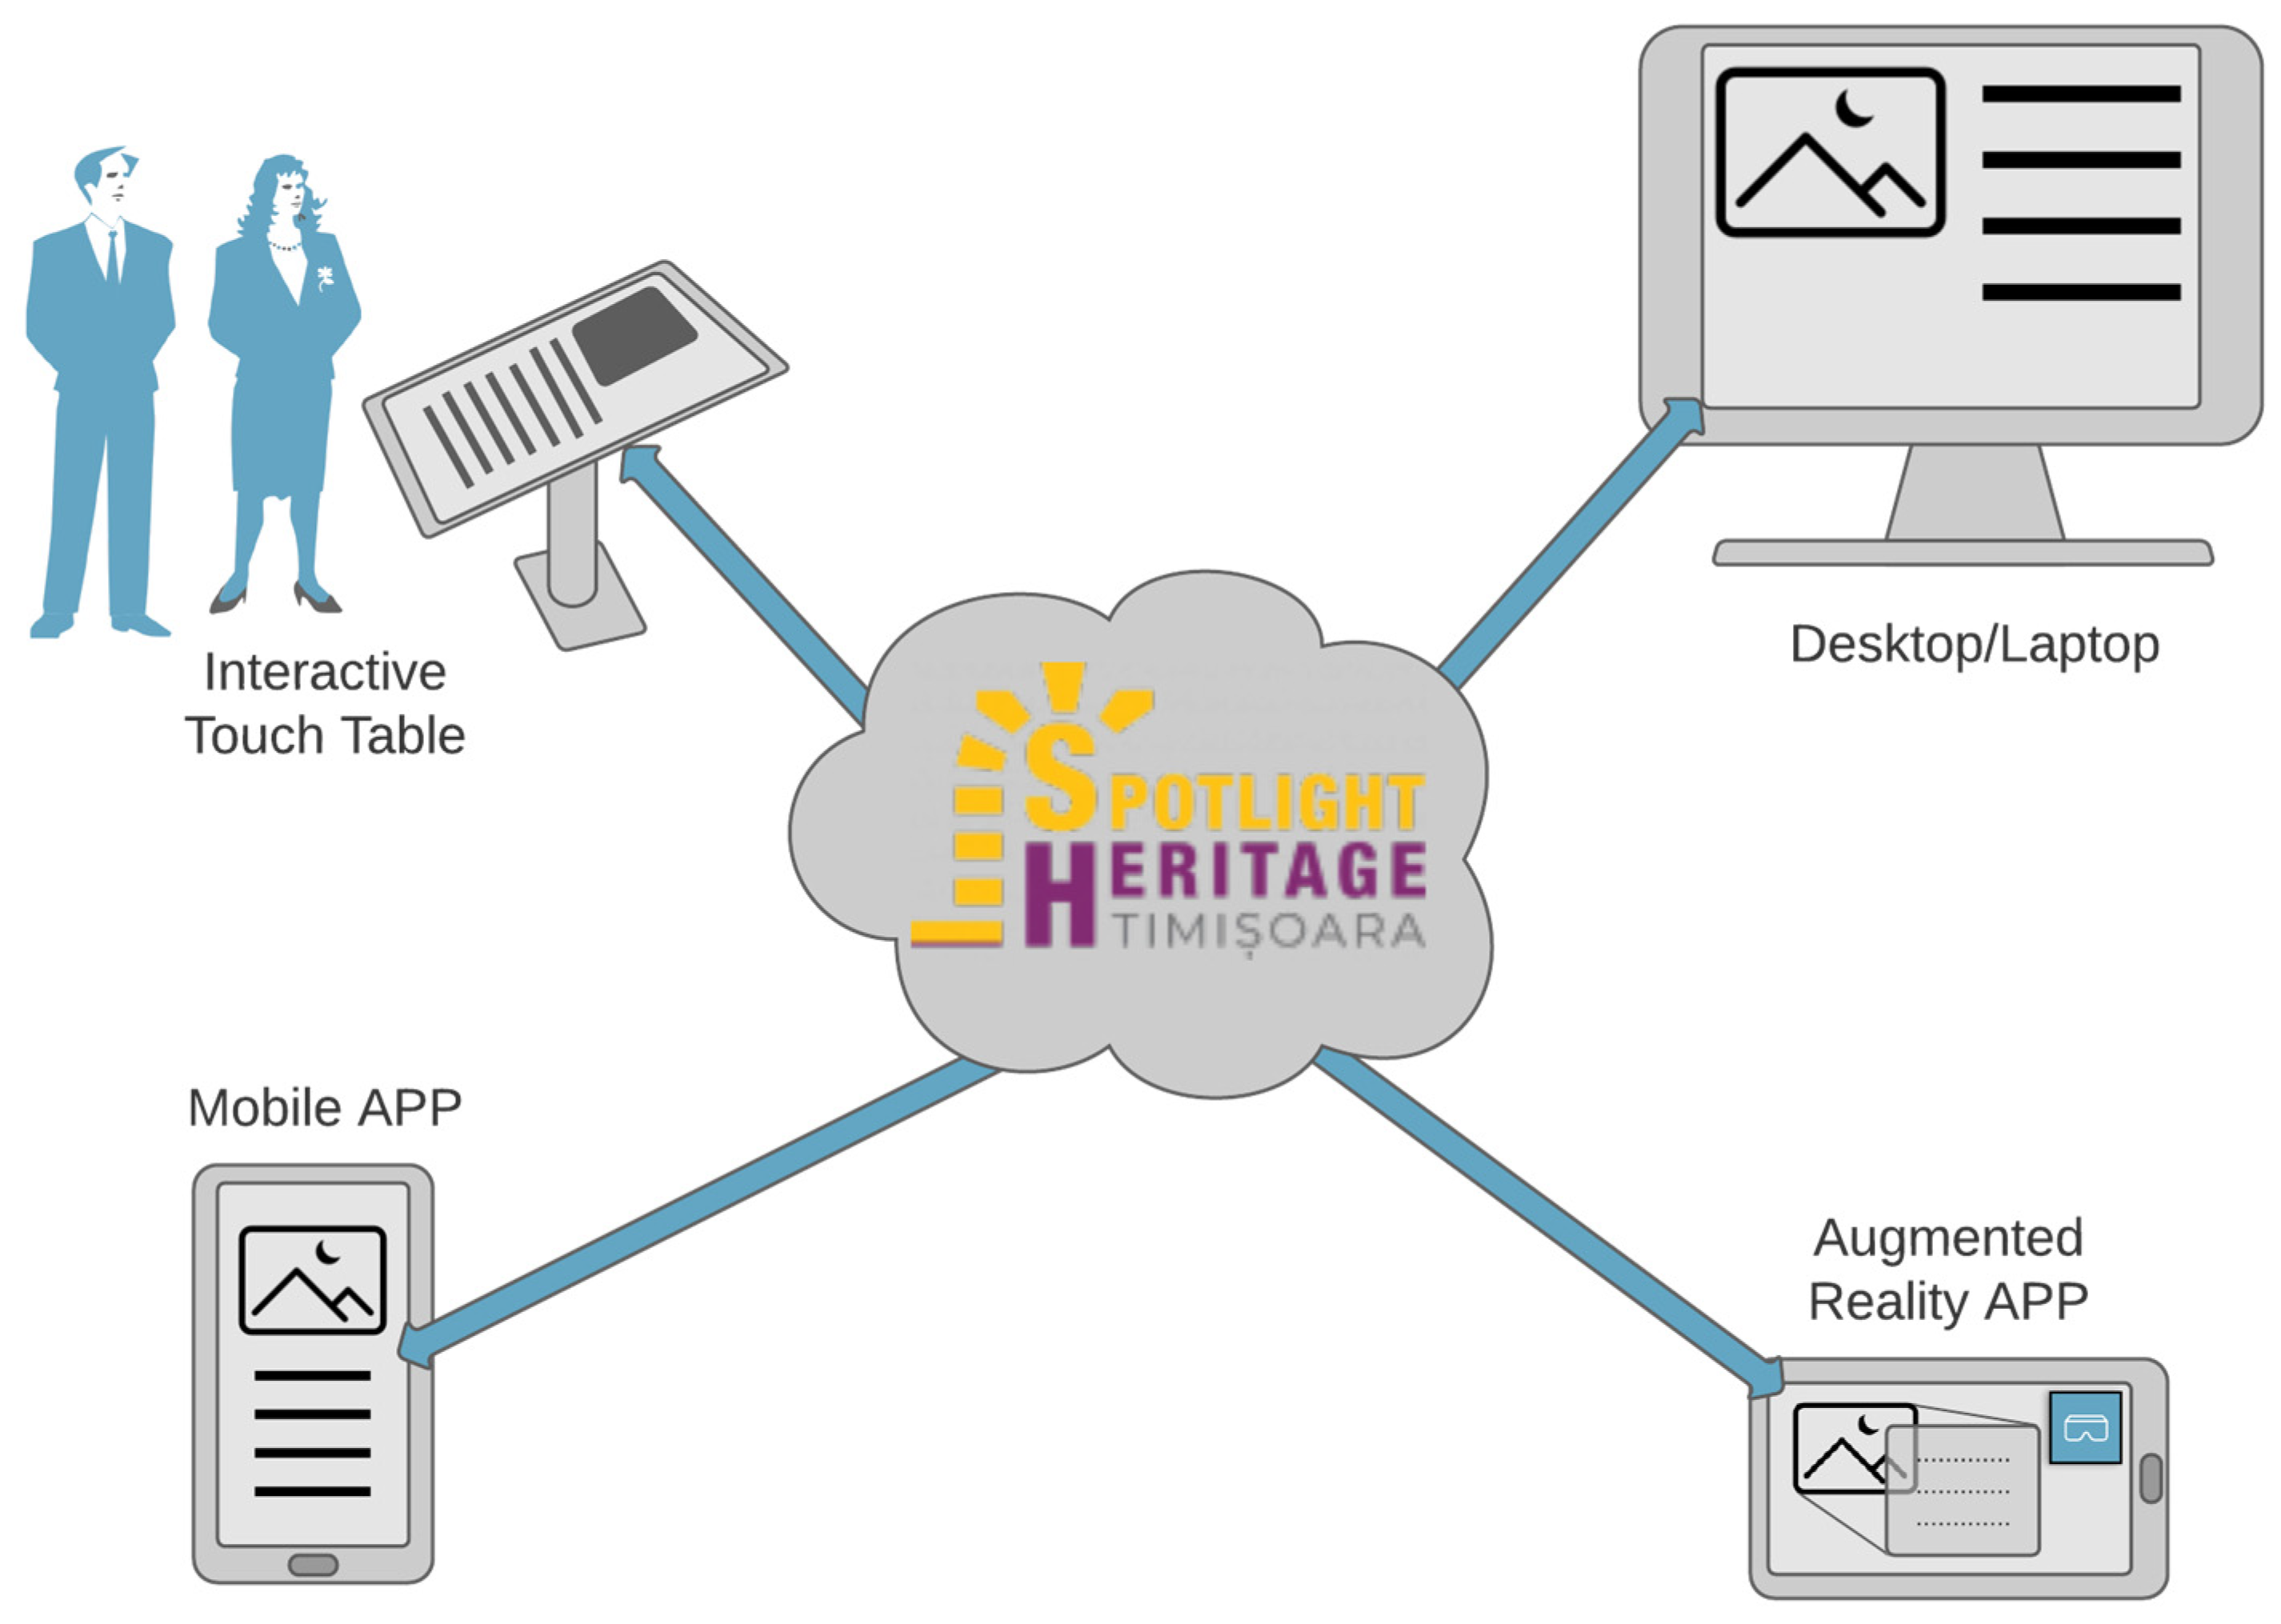
Spotlight Heritage Timisoara was planned to be publicly delivered as a multi-platform environment—on an interactive display in the National Banat Museum, on a dedicated website, as a mobile app, and as an augmented reality mobile app (Figure 1). The information provided with each of these delivery devices is similar, in some cases identical, but the displayed information differs, as dictated by their technical affordances, hence each creating a different user experience.

Figure 1.
Multi-platform architecture of Spotlight Heritage Timisoara.
1.2. Spotlight Heritage Evaluation Study
These complex digital products have been evaluated in a multi-platform setting, i.e., touchscreen table, desktop/laptop, mobile, and Augmented Reality. The user evaluation followed a mixed methods approach, to respond to the stringent need for multiple platform evaluation and comprehensive user testing [1]. Spotlight Heritage is a multi-annual project and from our previous evaluation and use cases, we identified that users navigate seamlessly between different platforms—they might initiate it online, on the website, then move and continue the exploration on the mobile app, go and visit the physical exhibition and use the interactive display, or visit one of the landmarks in location and use the augmented reality app.
Our research paper aims to indicate our research results so as to:
- (1)
- Validate the technical design and implementation of the multi-platform digital storytelling concept for the neighborhoods of Timisoara, European Capital of Culture in 2023.
- (2)
- Identify the user evaluation, methodology, and process of the multi-platform digital products developed as part of the cultural concept.
- (3)
- Provide insights and good practice on how to improve the user experience of such a multi-platform digital storytelling project.
First of all, qualitative and quantitative data were collected via a survey that was sent to participants of the opening of the Elisabetin exhibition, in 2020. The survey, which was completed by 75 respondents, included demographic questions, System Usability Scale questionnaires and Net Promoter Score (NPS) questions. Secondly, the digital applications have been tested with 30 participants using a combination of in-person and remote moderated usability testing, System Usability Scale questionnaires, and Product Reaction Cards.
1.3. Organization of the Paper
In Section 2, we discuss best practices and challenges in designing and implementing digital storytelling platforms in Cultural Heritage. In Section 3, we describe the planning, architecture, and implementation of the Spotlight Heritage project. In Section 4, we describe the methodology used to evaluate the digital storytelling platform, showing how it is grounded in similar peer-reviewed research. In Section 5, we present the results of the evaluation and some discussions. Section 6 is dedicated to an overall discussion of the results of this research, while Section 7 ends the paper with general conclusions.
2. Background
2.1. Digital Storytelling Platforms in Cultural Heritage
Digital Storytelling is short, narrated films (2 to 5 min) best known because of the work of the Centre of Digital Storytelling (CDS) in Berkeley, California. Originating in the arts community, Digital Storytelling has been adapted to work very well in healthcare, business, education, research, or cultural heritage [2,3].
The CDS digital stories are personal reflections on a subject, are revealing insights of the author, are narrating a lived experience, are based on photos and soundtracks, are short in length (for brevity), and are about self-expression and self-awareness (over concerns of publication and audience) [4].
One of the most interesting applications for Digital Storytelling is in Cultural Heritage, where it demonstrated its effectiveness in communicating heritage interpretation to the public [5]. Cultural Heritage, in Bill Ivey’s words, “tells us where we came from by preserving and presenting voices from the past, grounding us in the linkages of family, community, ethnicity, and nationality, giving us our creative vocabulary” [6].
Digital Storytelling engages the museum visitor by combining the powerful mechanism of the story with the possibilities of the digital technologies. Firstly, it is a vehicle for edutainment, meaning that it combines the instructive part of the museum with the entertaining part that the visitor expects. Secondly, Digital Storytelling enhances the visitor experience, transforming the static and traditional form of museum exhibitions into lively, accessible, and engaging experiences [7].
These types of platforms have been designed and implemented in several culturally rich places.
In ref. [5], the authors describe the design, implementation, and evaluation of a mobile digital storytelling experience for the Athens University History Museum. The evaluation focuses both on the technological aspects and on the story perspective. The evaluation confirmed that their approach to digital storytelling promoted engagement, learning and deeper reflection, while it also revealed several insights for good practice.
In ref. [8], the authors describe the development and evaluation of SensiMAR, a Multisensory Augmented Reality system for outdoor cultural heritage, implemented in the Conimbriga Ruins, part of the Monographic Museum of Conimbriga National Museum (Portugal). The prototype combines visual, audio and olfactive contents.
In ref. [9], the authors focus on digital storytelling strategies that promote active audience engagement in urban cultural heritage. They propose a collaborative model, which fuels audience engagement and collaboration of cultural organizations, and build a prototype for the culturally rich city of Thessaloniki (Greece).
In ref. [10], the authors use Interactive Digital Storytelling to enhance the visitor experience at the White Bastion, which is a fortress overlooking the city of Sarajevo. Ten digital stories and 6 interactive virtual models of the fortress have been made available for the users.
Details on the evaluation of these platforms will be given later, in our Methodology section.
2.2. Usability Evaluations
Usability is considered to be one of the most important factors for the use of web or mobile applications, along with reliability or security. The challenge to develop more usable web or mobile applications has led to various methods, techniques, and tools in order to discover usability issues [11].
According to [12], even if it is performed as part to the design process or after the product was launched, the evaluation of a cultural heritage application plays a crucial role in its usability or acceptance.
Being a multi-platform app, the usability evaluation of Spotlight Heritage is really important when it comes to testing functionality on different devices, to enhance the general design on web or mobile, intuitiveness, efficiency, effectiveness, users’ satisfaction [13].
A simple way of evaluating the usability of a platform is the System Usability Scale questionnaire (SUS) [14], which was also applied in our case.
SUS is a standardized questionnaire, with alternating questions, half of them worded positively and half negatively. According to [15], the advantages of positive and negative items in a survey can be the ability to provide protection against the extreme responders while also keeping the participants engaged, being careful for each question’s tone. There are also disadvantages for alternating questions when it comes to the possibility of misinterpreting them when the users do not pay enough attention to the item’s tone or miscoding when it comes to calculate the SUS score.
There are many other usability evaluation questionnaires like SUMI, PSSUQ, or QUIS [16], but after researching which one is best applicable in our case, we decided that SUS is the proper choice, being short, easy, and in an objective tone.
3. Development of the Spotlight Heritage Multi-Platform Digital Storytelling Concept
As previously stated, the Spotlight Heritage Timisoara project is an integral part of the application bid with which the city of Timisoara won the title of European Capital of Culture 2021 (transformed into European Capital of Culture 2023 due the global COVID-19 pandemic). It aims not only to provide information to visitors, in the form of presentations of objectives, photos, short videos, but is also designed to be interactive in the sense that it offers them the opportunity to post their own stories and memories of the neighborhoods through the website and the applications. This way, users become co-creators of the exhibition, through a participatory approach and responding to the objectives with which Timisoara won the title of European Capital of Culture: involvement and activation of various audiences. Visitors and citizens of Timisoara add their personal layer over that of the exhibition discourse and the historical reality, enriching and keeping the city’s heritage alive.
3.1. Spotlight Heritage Planning
There are two main target groups of people that the project aims to reach. Firstly, the visitors who will be present, mostly physically but virtually as well, in the city of Timisoara around the year 2023. They will learn about the history of the city through these visits, which means that they need to be memorable. Secondly, the citizens currently residing here, many of whom can trace their ancestral roots hundreds of years into the city’s history. They need to be able to reconnect with their forebears and cement their sense of belonging. All these people need to be able to leave their mark into the tapestry of Timisoara’s continuing story.
Planning and designing the implementation of the project considered the stated objectives: to present information in an engagingly interactive fashion and to encourage the audience participation in the cultural act by transforming passive consumption of experiences into active contribution.
Taking all these considerations into account, the project was designed with multiple distinct components in mind:
- The physical yearly expositions hosted by the National Museum of Banat;
- Location-based expositions, highlighting different historically significant neighborhoods from Timisoara;
- The digital components.
Even if these components seem unrelated through their scope, target audience and implementation methods, they complement each other, and by a carefully orchestrated design, manage to bring to life Timisoara’s rich history.
In order to increase interactivity, classical exhibitions are being enhanced through modern technologies. Visitors in the museum or in the neighborhoods can access more information than is available on site through the use of digital tools which they either own or are provided on location.
The exhibitions hosted by the National Museum of Banat, for instance, provide stand-mounted tablets and an interactive touch table which they can use to access additional information regarding past or present exhibits. The large table promotes cooperation and discussion as well as an unusual and exciting medium which provides related content, while the tablets give a taste of advanced interactions (like augmented reality) which the visitors may be enticed to replicate by themselves later.
The stations placed in relevant point-of-interest alongside the current spotlighted neighborhood provide printed QR codes which can be accessed by appropriate applications on the visitors’ own mobile devices for further content, increasing the sense of active participation.
These complex scenarios involving physical visits by different types of participants, combined with virtual users who can access many of the same resources from the Internet, have provided the inspiration for the multi-platform architecture that forms the basis of the Spotlight Heritage Timisoara Project.
3.2. Spotlight Heritage Multi-Platform Architecture
Developing the software architecture was heavily dependent on the multi-platform architecture (Figure 1) based on the hardware being used in each of the envisioned scenarios. The display terminals provided on location represented known quantities: the tablets have specific versions of the Operating Systems and technical specifications, and the interactive touch table can support—in the simplest use case scenario—a web browser with online access. However, the personal devices that visitors use in the museum or in the neighborhoods can vary widely in specifications, capabilities, and performance. The same goes for the terminals that virtual visitors use to access via the Internet.
The most versatile medium of providing the virtual experience was therefore the website. A modern, adaptive, and responsive platform was developed which can be accessed from most Internet capable terminals. This platform provides a classic navigation experience for accessing the virtual exhibits which are usually static images with extended text descriptions, as well as audio and video content. The exhibits are grouped by collections and can be filtered or visited in a guided tour, if desired.
A particular use case of the website is its access on the large interactive touch table, by multiple visitors simultaneously, and in a crowded museum setting. This innovative use case is of particular interest and has separate sections of this paper dedicated to it.
While the website can be efficiently accessed on a mobile device with a smaller screen, current web technologies cannot fully take advantage of all the facilities that a mobile smartphone or tablet has to offer. Accessing sensors such as the gyroscope (for orientation), the location, or even the camera through the mobile browser is not fully optimized, or problematic at times due to privacy issues [17]. In order to access the greatest number of users possible, native mobile applications were developed for the two main mobile ecosystems: Apple’s iOS and Google’s Android Operating Systems (OS). These applications benefit from high compatibility and integration with the host OS as well as native access to location, providing a seamless experience with which users are accustomed. The application provides the same virtual exhibits as the website, as well as dynamic positioning and real-time recommendations for nearby physical exhibits.
A more advanced use case of the mobile device is through the Augmented Reality capabilities that some terminals can provide. Using image recognition, it is possible to superimpose additional information to the images captured in real-time by a device’s camera. In order to keep the compatibility with as many devices as possible, it was decided that different applications needed to be developed solely for this functionality. Therefore, the Augmented Reality Applications (for iOS and Android) were created.
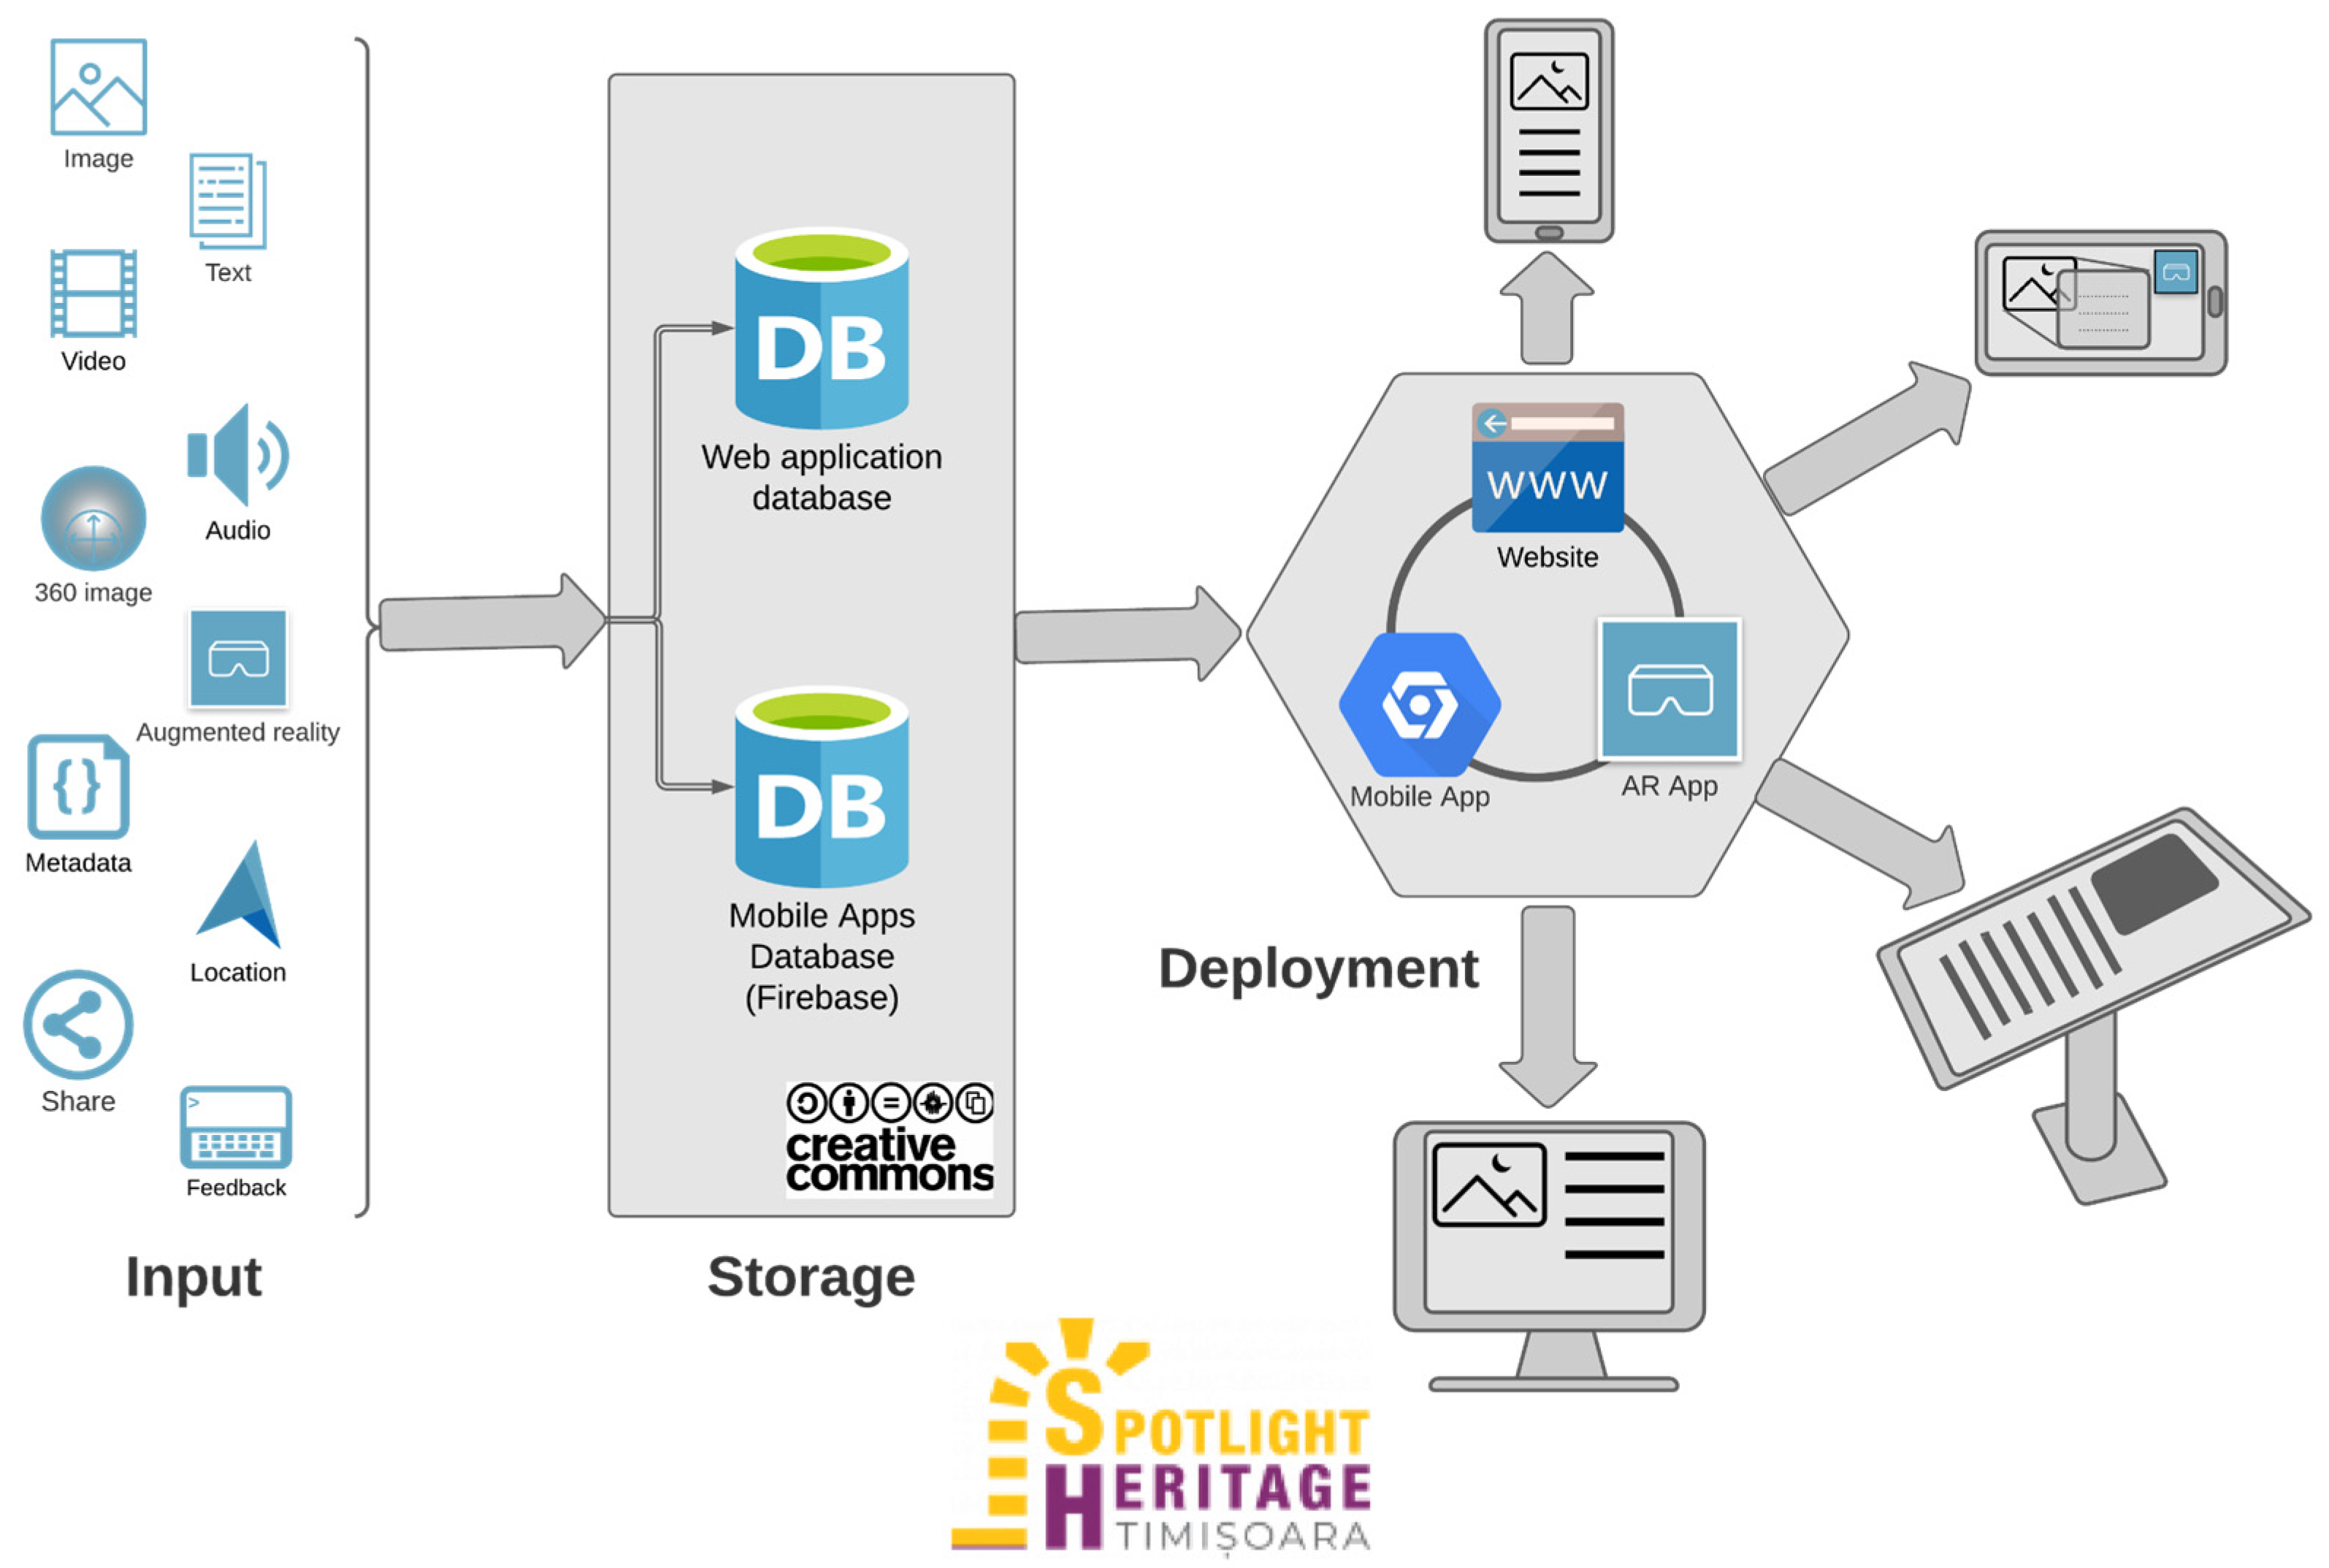
These are the main channels through which the virtual content encompassed in the Spotlight Heritage Timisoara project can be accessed. Figure 2 aims to synthesize in a graphical form the architecture of the digital components of the project and highlights the four directions for evaluation that this research paper analyses.

Figure 2.
Data architecture and flow.
3.3. Spotlight Heritage Implementation
Following the developed architecture, the different parts of the project were subsequently implemented.
The physical components (the temporary exhibitions at the National Museum of Banat and on location in each of the neighborhoods) were staged with a different focus in each of the previous years. In 2019, the focus was on the Iosefin neighborhood, in 2020 on the Elisabetin neighborhood, and in 2021 on the Fabric neighborhood.
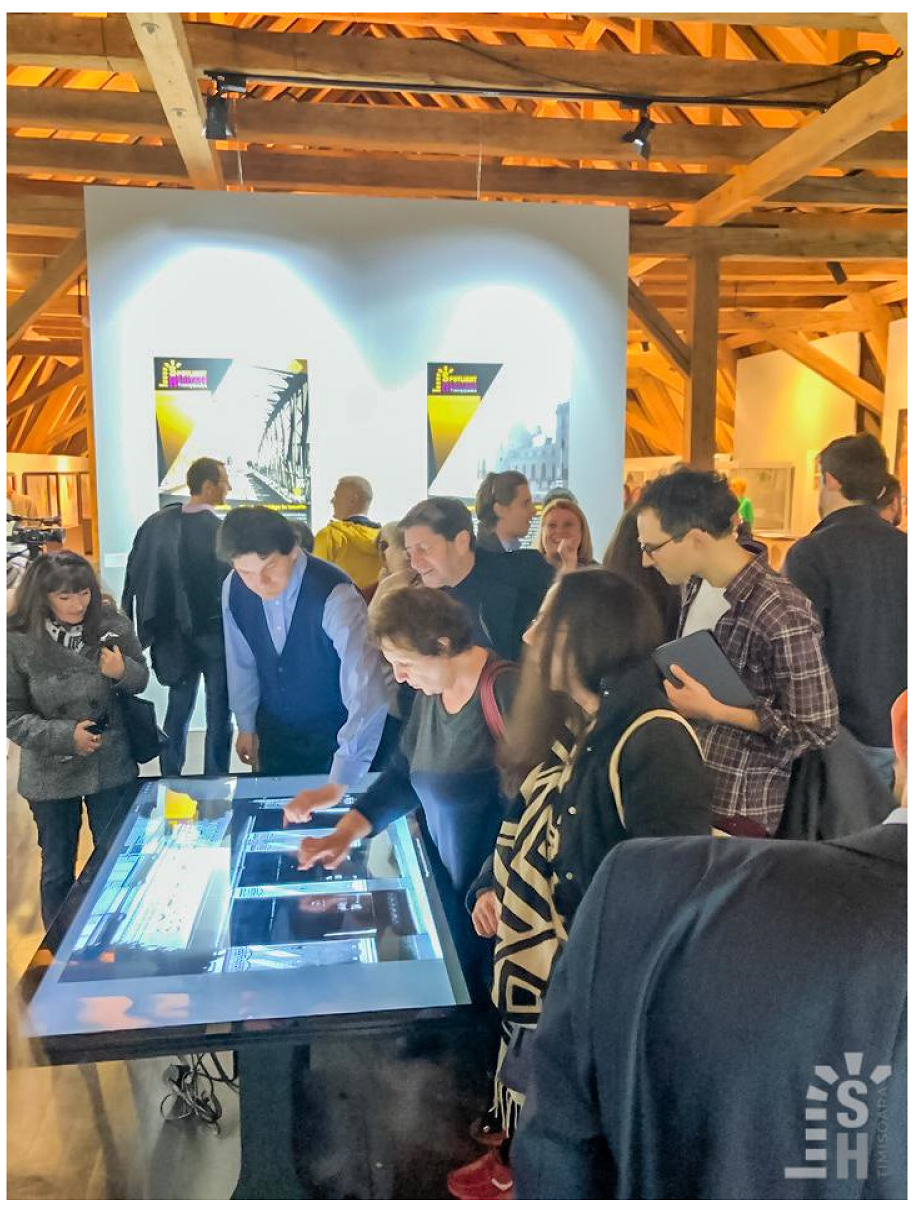
The temporary exhibits at the Museum featured objects representative for the respective neighborhood, with the added interactivity provided by the large interactive touch table and stands with tablets showcasing the mobile applications (Figure 3).
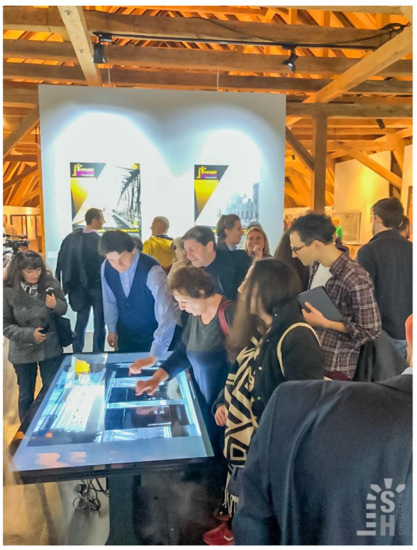
Figure 3.
Large Interactive Touch Table at the National Museum of Banat exhibition (2019).
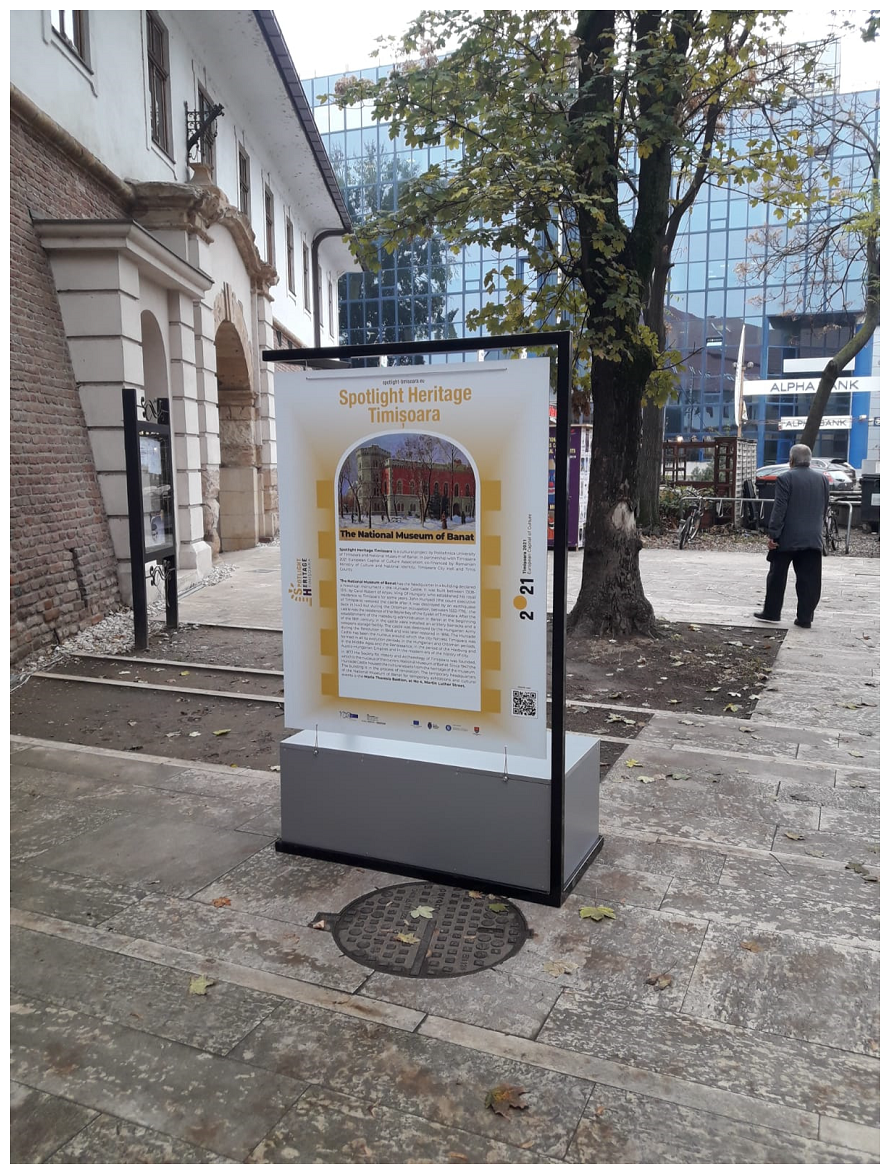
During each of the three years since the beginning of the project, near the landmarks of the highlighted neighborhood, informational stations were positioned with descriptions of the landmark, a short history, and the invitation of using the available technologies (website or mobile applications) to find further details about that specific landmark, and other similar ones. Stations were created and deployed for 18 locations in the Iosefin neighborhood, 16 in Elisabetin and 23 in Fabric (Figure 4).

Figure 4.
Street stand with project information near a neighborhood landmark (2019).
Both the museum exhibitions and the stations displayed on location were active only temporarily. However, all the information was preserved digitally in the third component of the architecture described in the Section 3.1.
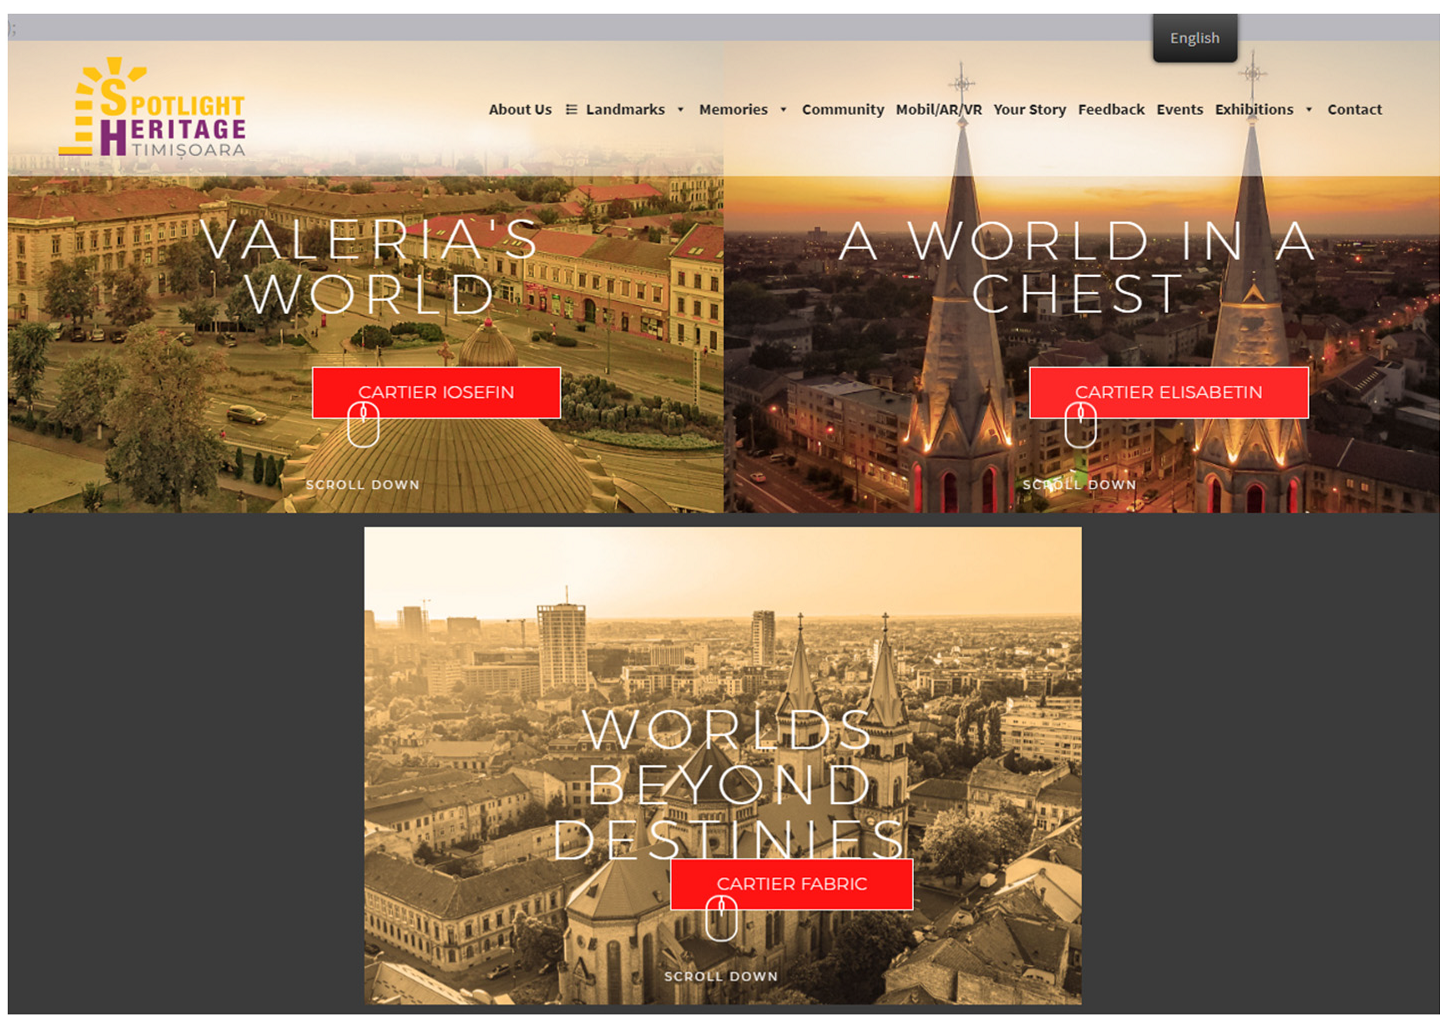
The main repository of information is available through the online web platform, at https://spotlight-timisoara.eu (accessed on 10 October 2021). Pictures with descriptions and other related metadata are available, categorized into the three main neighborhoods (Figure 5), as well as audio and video excerpts, related to the different landmarks from each of the locations. The platform is optimized for access from any size screen from the very small (mobile terminal) to the very large (interactive touch table).
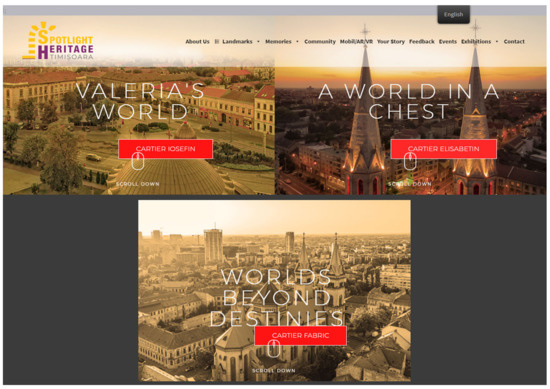
Figure 5.
The Spotlight Heritage Timisoara website in 2021.
Development also included a total of four mobile applications: the mobile and augmented reality apps, each with a different version for the two major mobile operating systems: iOS and Android.
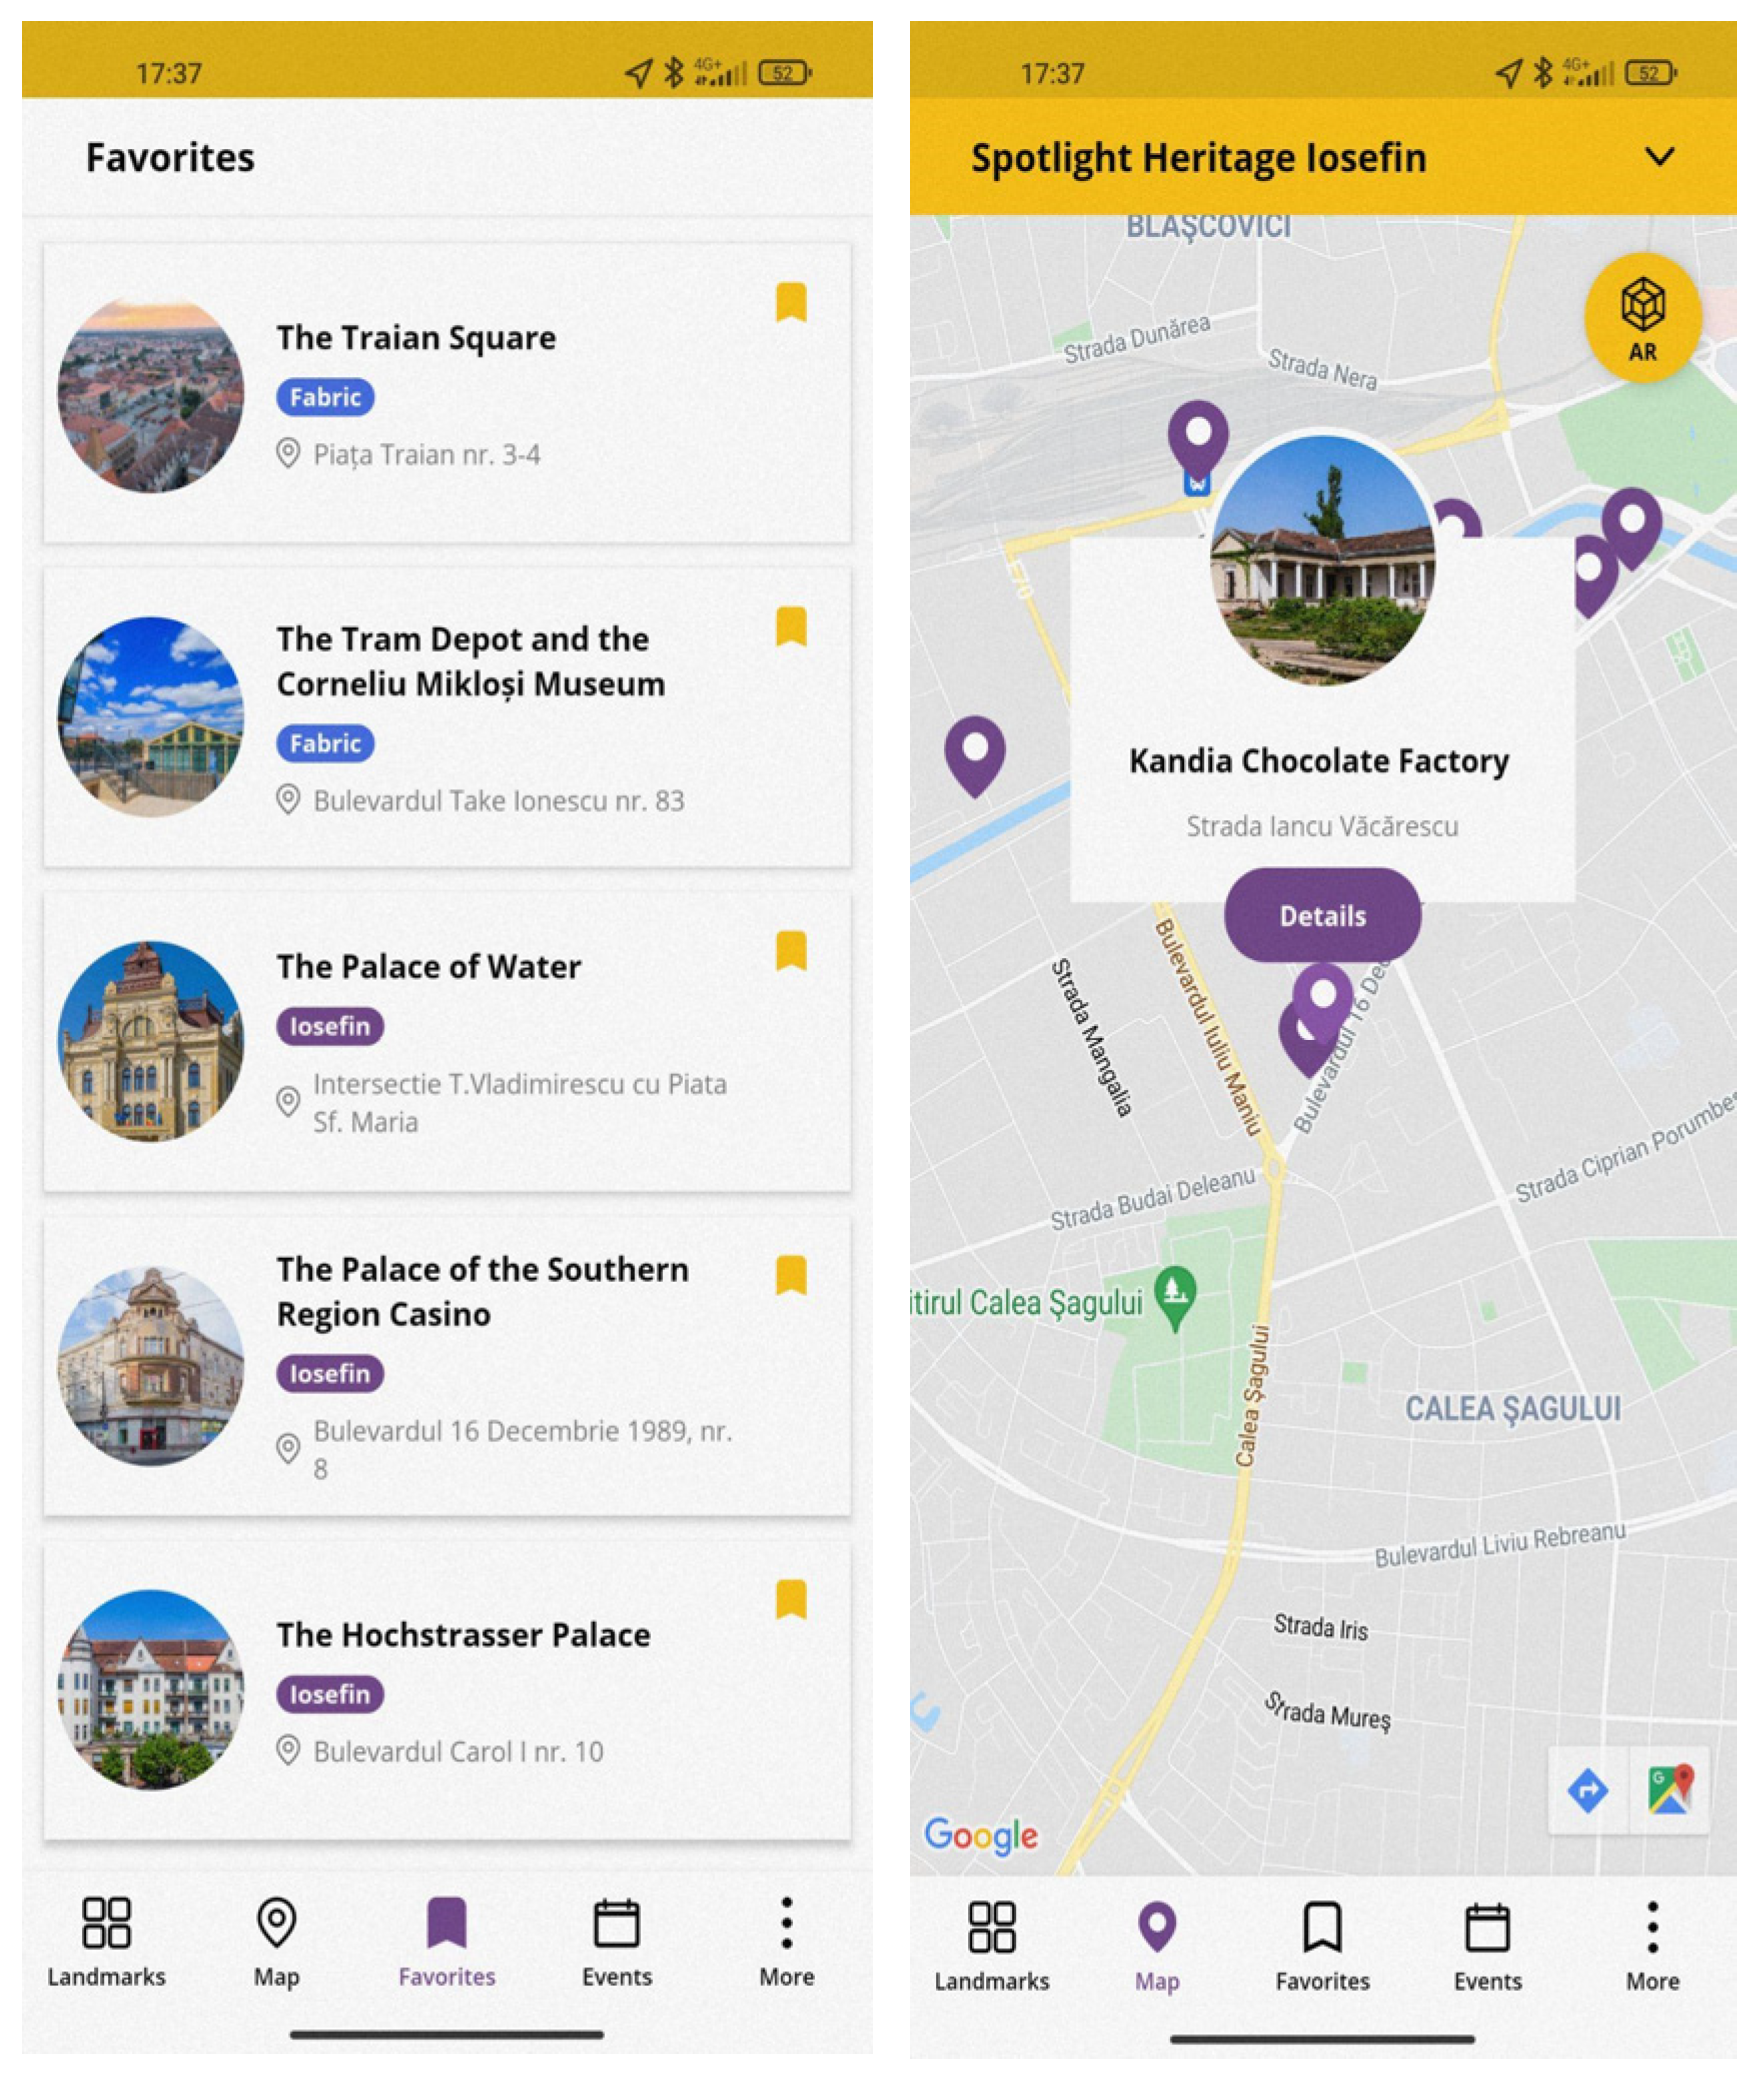
The mobile application provides most of the same information as the web platform, as well as easy navigation towards the landmarks showcased in the project (Figure 6).

Figure 6.
Screen captures from the Spotlight Heritage Timisoara mobile application in 2021.
The augmented reality app offers advanced facilities, such as superimposing old photos over the current landmark, which is being filmed in real-time, or by adding information cards over landmarks which it recognizes (Figure 7).
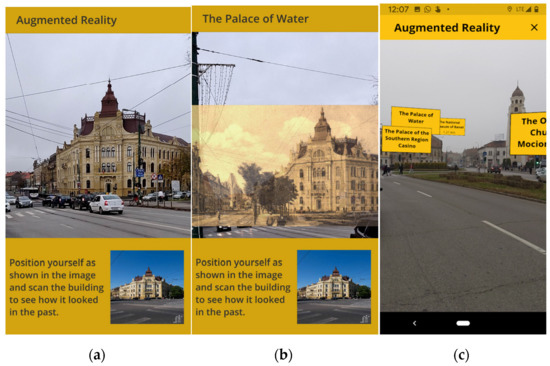
Figure 7.
Features of the Augmented Reality App: (a) original image, captured real-time in the application, (b) historical image, over-imposed on the screen, (c) landmarks which are identified and labeled by the app.
Both applications are available for free in the respective application stores, Apple’s App Store and Android’s Google Play Store.
As a rough estimate, the human effort that was put in during the lifetime of the project so far is 120 persons/month, which includes the 2014–2018 period in which the concept of the project emerged and was refined and the first 3 years of implementation (2019–2021). The first year of implementation demanded the most effort, around 50 persons/month, since most of the physical and software infrastructure was created at this point.
Each cycle of implementation, i.e., adding new information and developing additional features, involved a plethora of competencies and professions: architects, historians, anthropologists, curators, web developers, mobile developers, data specialists, (video) photographers, audio-video editing specialists, augmented reality professionals, event managers, public relation specialists, and many more.
A lesson learned is that such a complex multi-platform digital storytelling project for cultural heritage requires a dozen of professionals working interdisciplinary in a smooth and efficient manner, time and budget accordingly, and high attention to how the user experience integrates all the components.
4. Spotlight Heritage Evaluation Methodology
4.1. Related Work
Our evaluation methodology is grounded in similar peer-reviewed research.
The app for Athens University History Museum in [5] was evaluated with 43 museum visitors, of which 28 invited participants and 15 participants recruited on the spot. The authors used a combination of semi-structured interviews, focus group sessions, and user observation sessions.
The authors of SensiMART [8] performed a usability study on 67 random visitors of the archaeological site. The participants were invited to explore the application (with minimal intervention from the researchers) and then fill a SUS questionnaire followed by a generic socio-demographic questionnaire. Researchers found that there are no statistically significant differences in the usability of the product, when considering sex, age or previous experience with the technology.
The researchers in Thessaloniki [9] performed a formative qualitative and quantitative evaluation prior and after the development of the model. Specifically for the usability of the pilot website, a quantitative assessment was conducted, based on the heuristic analysis metrics by Jakob Nielsen.
4.2. Methods
In the following subsections, we briefly describe the evaluation methods which we have used throughout our study.
4.2.1. Semi-Structured Interviews
The Semi-structured Interview is a blend between open- and closed-ended questions and it is also a method often used in the usability evaluation of a web or mobile app [18].
4.2.2. User Observation Sessions
The User Observation session also known simply as User Testing is one of the most important and used usability evaluation methods and it is clearly one of the most applicable methods for the evaluation of a web or mobile product.
As explained in [19], User Testing evaluations are usability evaluation methods where the users actively participate. They are invited to do some typical tasks for a product or simply asked to explore the application/website to observe design issues or functional errors of the product. During these sessions, the time taken to do a task, the task completion rates, and the number and types of errors are recorded [4]. This method usually takes place in a designated laboratory, properly equipped with cameras which record the activities. Additionally, a group of observers, a moderator and a facilitator is involved in the user testing session [4].
4.2.3. Think-Aloud Protocol
The Think-aloud protocol is a method used also in the usability evaluations and it implies that the participants are verbalizing their thoughts while doing the requested task. The researchers record the comments and analyze them afterwards in a way that depends on the research questions [20].
4.2.4. System Usability Scale (SUS) Questionnaire
According to [14], SUS is an instrument which is used in the usability testing of commercial products. However, it can be a useful way of evaluating websites, desktop/mobile applications, which is also our case. Basically, SUS is an easy-to-use questionnaire consisting of 10 simple statements. The tool measures the users’ perception of agreement or disagreement with 10 aspects of the product under evaluation [21]. The questions use mixed scaling and the final score is a number between 0 and 100.
An adjective rating scale (“Worst Imaginable”, “Awful”, “Poor”, “OK”, “Good”, “Excellent”, “Best Imaginable”) can be used to explain the final score [22].
4.2.5. Net Promoter Score
According to [23], the Net Promoter Score is linked to the measurements of loyalty of the target group of a product and it is a very useful instrument for the managers, but also for the researchers, which is our case.
4.2.6. Product Reaction Cards
The Product Reaction Cards method is a tried and tested evaluation tool in the software development environment. It can be realized in a physical way, with physical cards to be picked by the participants, or by electronic means with the help of an Excel or Word file. According to [24], the Product Reactions Cards were initially created by Microsoft as part of a “desirability toolkit” which they used to measure the level of desirability in using a certain software product. The initial kit consisted of two components: the first one—a “study of the faces”, where participants were tasked with choosing a picture of a face seeming to express their own experience with using the product, and the second component—a card study, where participants had to choose a few appropriate words from a large, predefined set of product reaction cards [5].
4.2.7. Error Testing
The Error testing method is somehow included in the usability testing method, being targeted on the free exploration of the application done by the participants, in order to find functional errors of the product.
4.3. Participants
The following subsection describes the two main stages of the user evaluation, i.e., an online survey and a set of usability testing sessions, and the participant demographic profiles.
4.3.1. Survey Respondents
An online survey with 75 respondents was conducted in November 2020, during the opening of the exhibition for a new neighborhood (Elisabetin) in Spotlight Heritage Timisoara. The survey included demographic questions (Table 1), separate SUS and NPS questionnaires for the desktop and the mobile versions of the digital storytelling concept and other questions regarding the usability and usefulness of the digital applications and cultural heritage data.

Table 1.
Demographic profile of the survey respondents.
4.3.2. Usability Evaluation Participants
A usability evaluation with 25 participants (Table 2) was conducted in May 2021 using multiple methods: semi-structured interviews, observation sessions, think-aloud protocol, SUS questionnaire, and Product Reaction Cards. The testing sessions were organized both in-person and remotely by students enrolled in the Interactivity and Usability graduate class at the Politehnica University of Timisoara, under the supervision of the authors of this research, using a pedagogical approach already presented in [25] for website usability testing and in [26] for mobile usability testing. They recruited 10 participants for testing the desktop/laptop version, 10 participants for the mobile version, and 5 participants for the augmented reality version.
Table 2.
Demographic profile of the usability evaluation participants.
Another smaller usability evaluation was conducted directly by the researchers in July 2021, during the opening of the exhibition for the newest neighborhood (Fabric) in Spotlight Heritage. No demographic data were gathered for these additional 5 participants.
4.4. Procedure
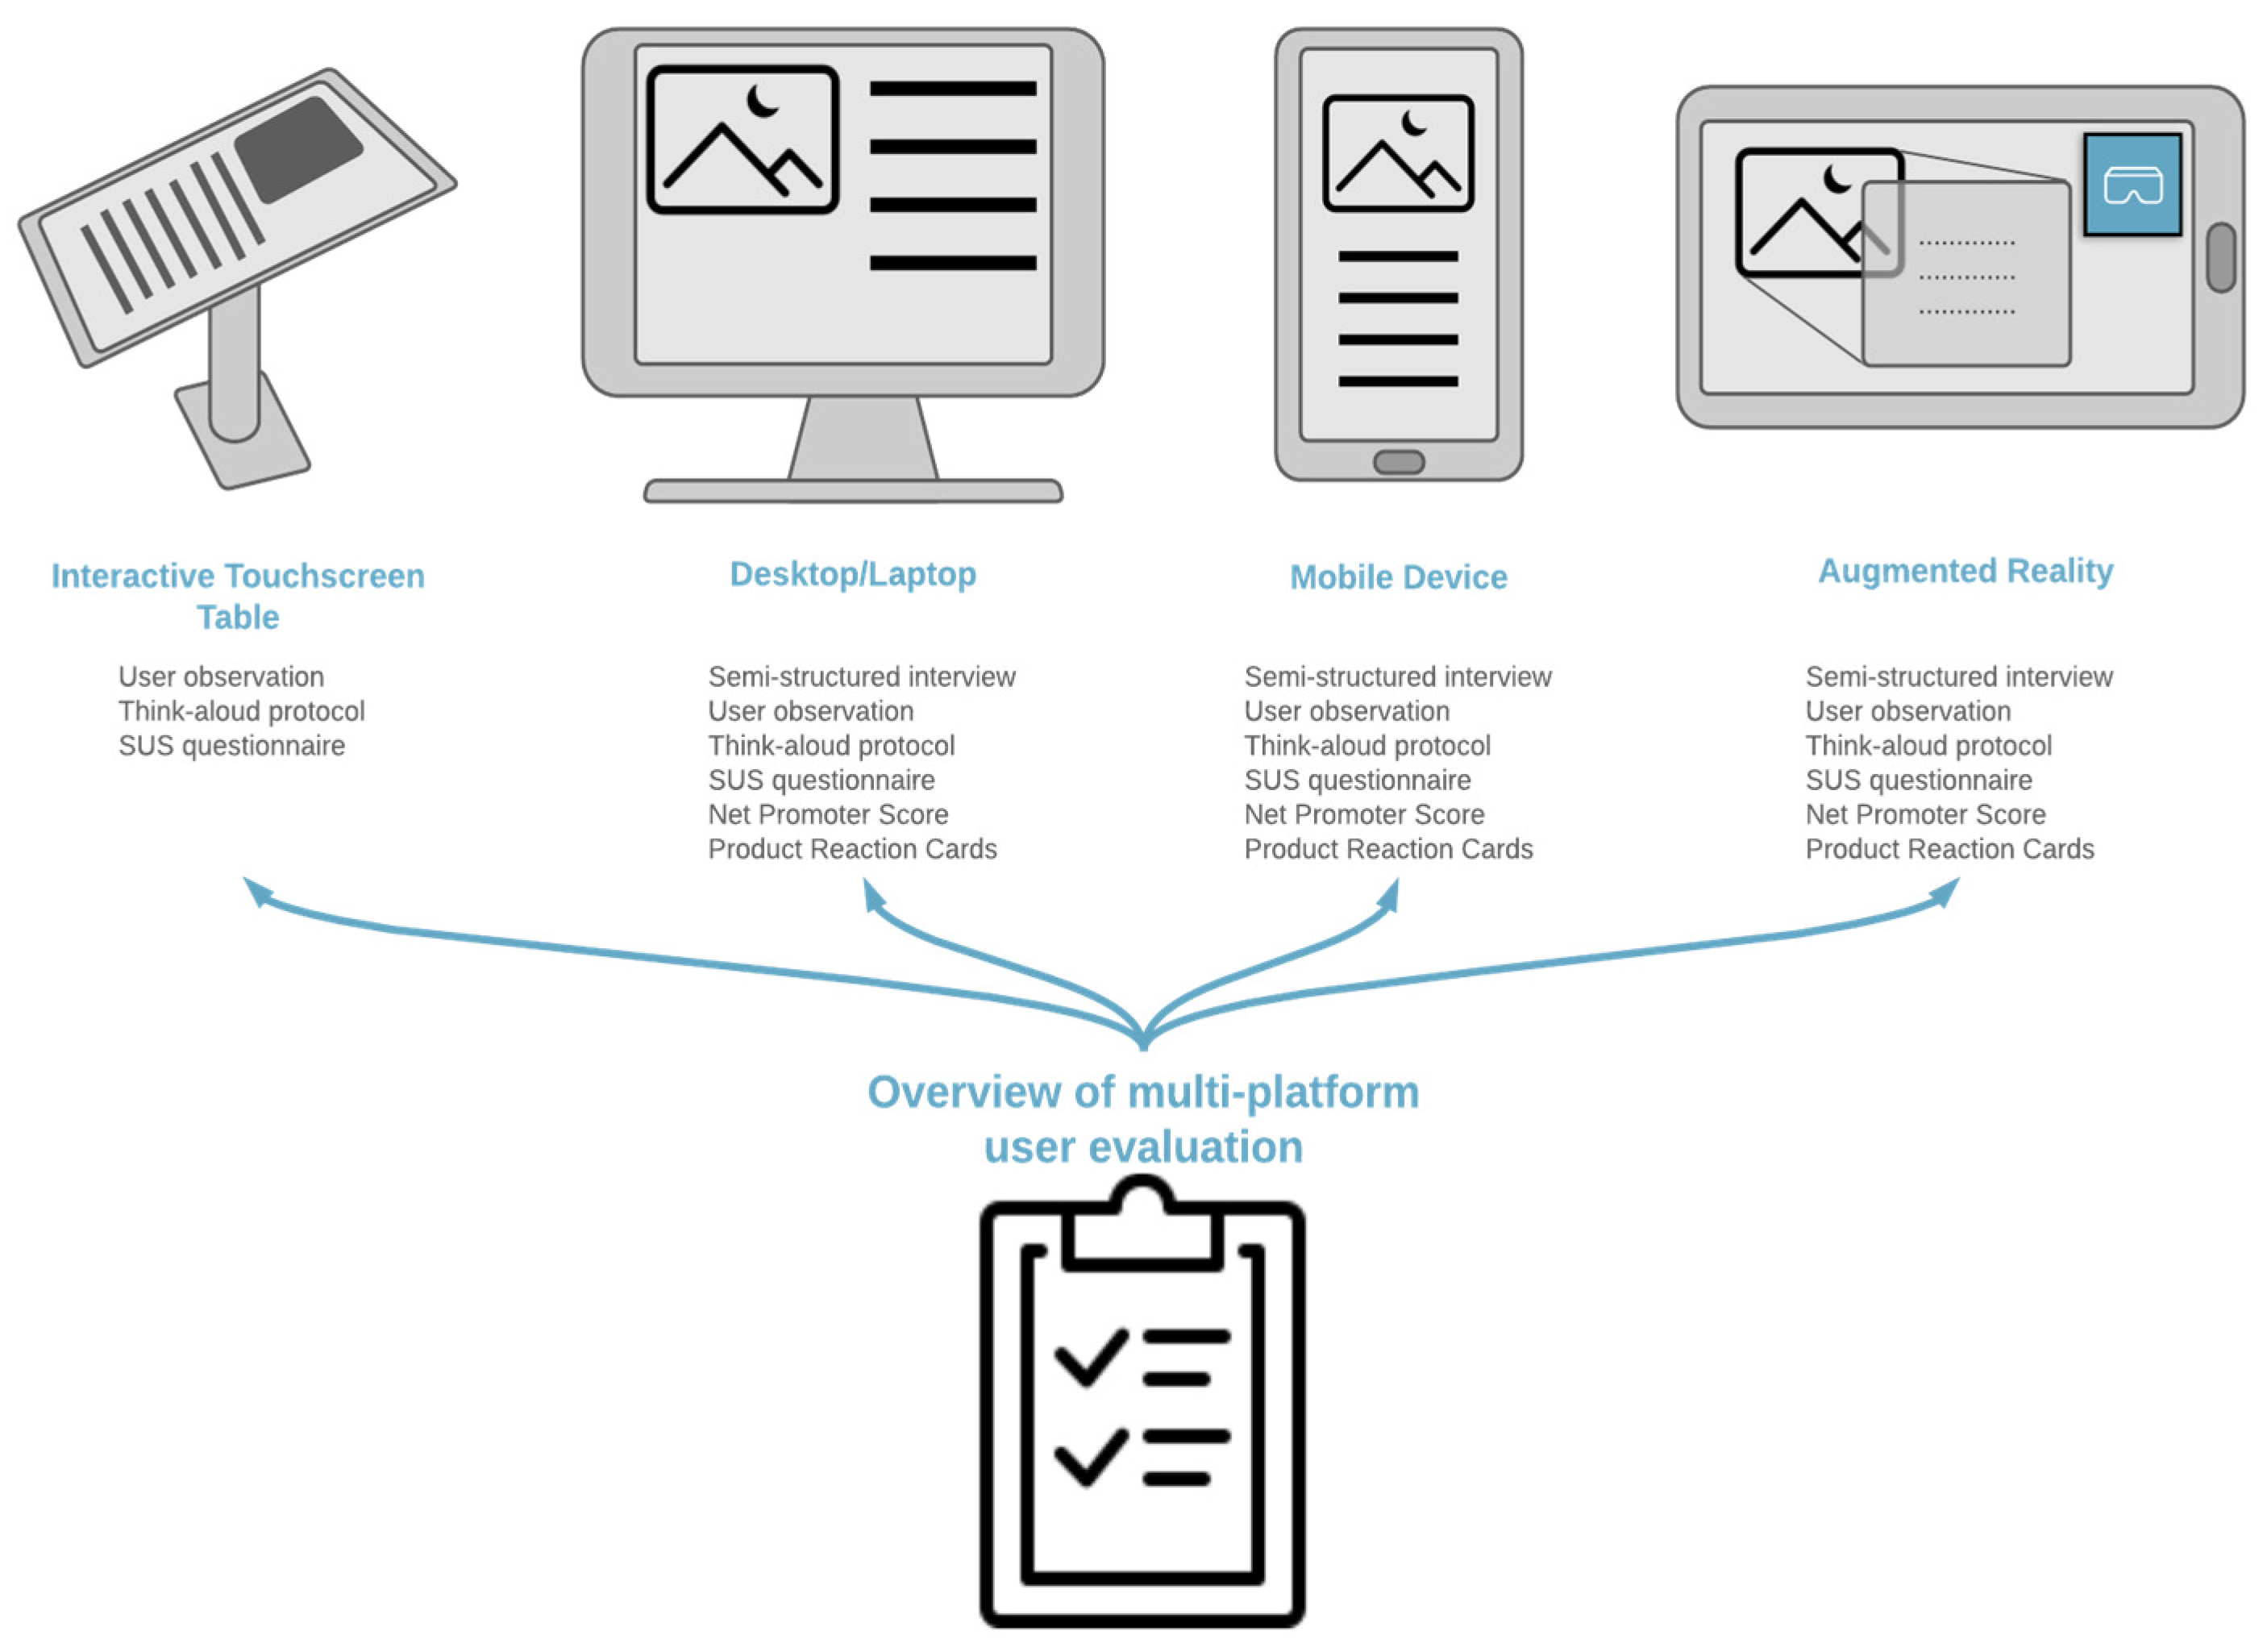
The following subsection describes the user evaluation procedure for each of the targeted platforms. The evaluation was then centralized to derive usability problems and insights, as indicated in Figure 8.
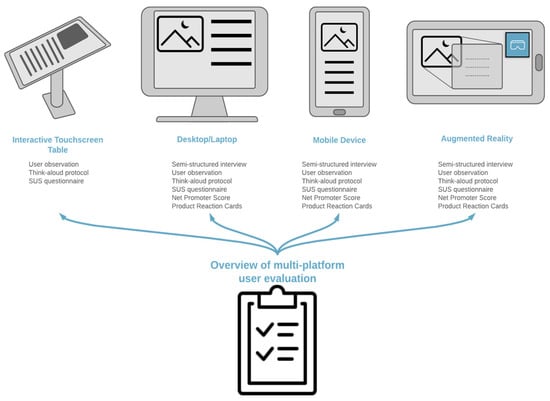
Figure 8.
Mixed method approach for the multi-platform evaluation.
4.4.1. Evaluation Procedure for the Interactive Touchscreen Table
An informal in-person usability testing session was organized for the Spotlight Heritage platform running on the interactive touchscreen table (Figure 9). We randomly selected 5 participants who were trying out the interactive touchscreen table at the opening of the exhibition. We ran observation sessions with the think-aloud protocol and requested the participants to fill in a SUS questionnaire.
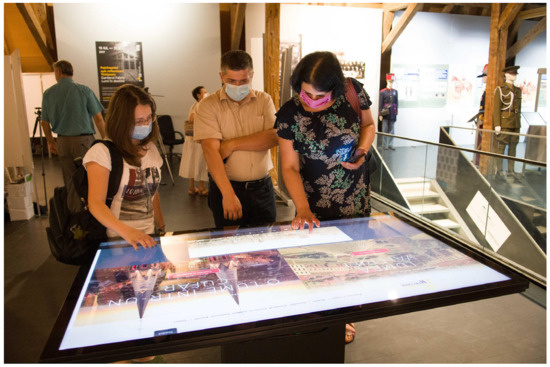
Figure 9.
Users trying out the interactive touchscreen table platform, July 2021.
4.4.2. Evaluation Procedure for Desktop/Laptop
The user evaluation for desktop/laptop was organized remotely on Zoom, due to COVID-19 pandemic restrictions, in May 2021. Each session took approximately 60 min, and the evaluation was done with, in total, 10 participants.
Firstly, the participants signed a consent form which allowed us to record the meeting and process the resulting data for research purposes. Afterwards, they were instructed on how to share their browser in Zoom, and other technical aspects.
Secondly, we ran a semi-structured interview with the participants, whose aim was to find out their previous frustrations and satisfactions in using web platforms on desktop/laptop, their existing knowledge on the cultural heritage of Timisoara, and what kind of information would they be searching for (and how) on a website about this topic.
Thirdly, we ran an observation session with each participant. They were instructed to complete a list of pre-made tasks, consisting in exploring the homepage of the website, finding information about a landmark, adding a personal story, and participating in the online virtual tours. We were able to watch, measure and record what the participants did in the browser, as well as their face expressions. Using the think-aloud protocol, we encouraged the participants to speak what was on their mind while completing the task.
Fourthly, we verbally requested some short feedback about their interaction with the website and we handed them an online questionnaire where they were requested to answer the 10 SUS questions and to choose 5 words that best represented their experience with the website from the Product Reaction Cards set.
Finally, we thanked the participants for their time and noted down if they are interested in being notified about future events related to Spotlight Heritage Timisoara.
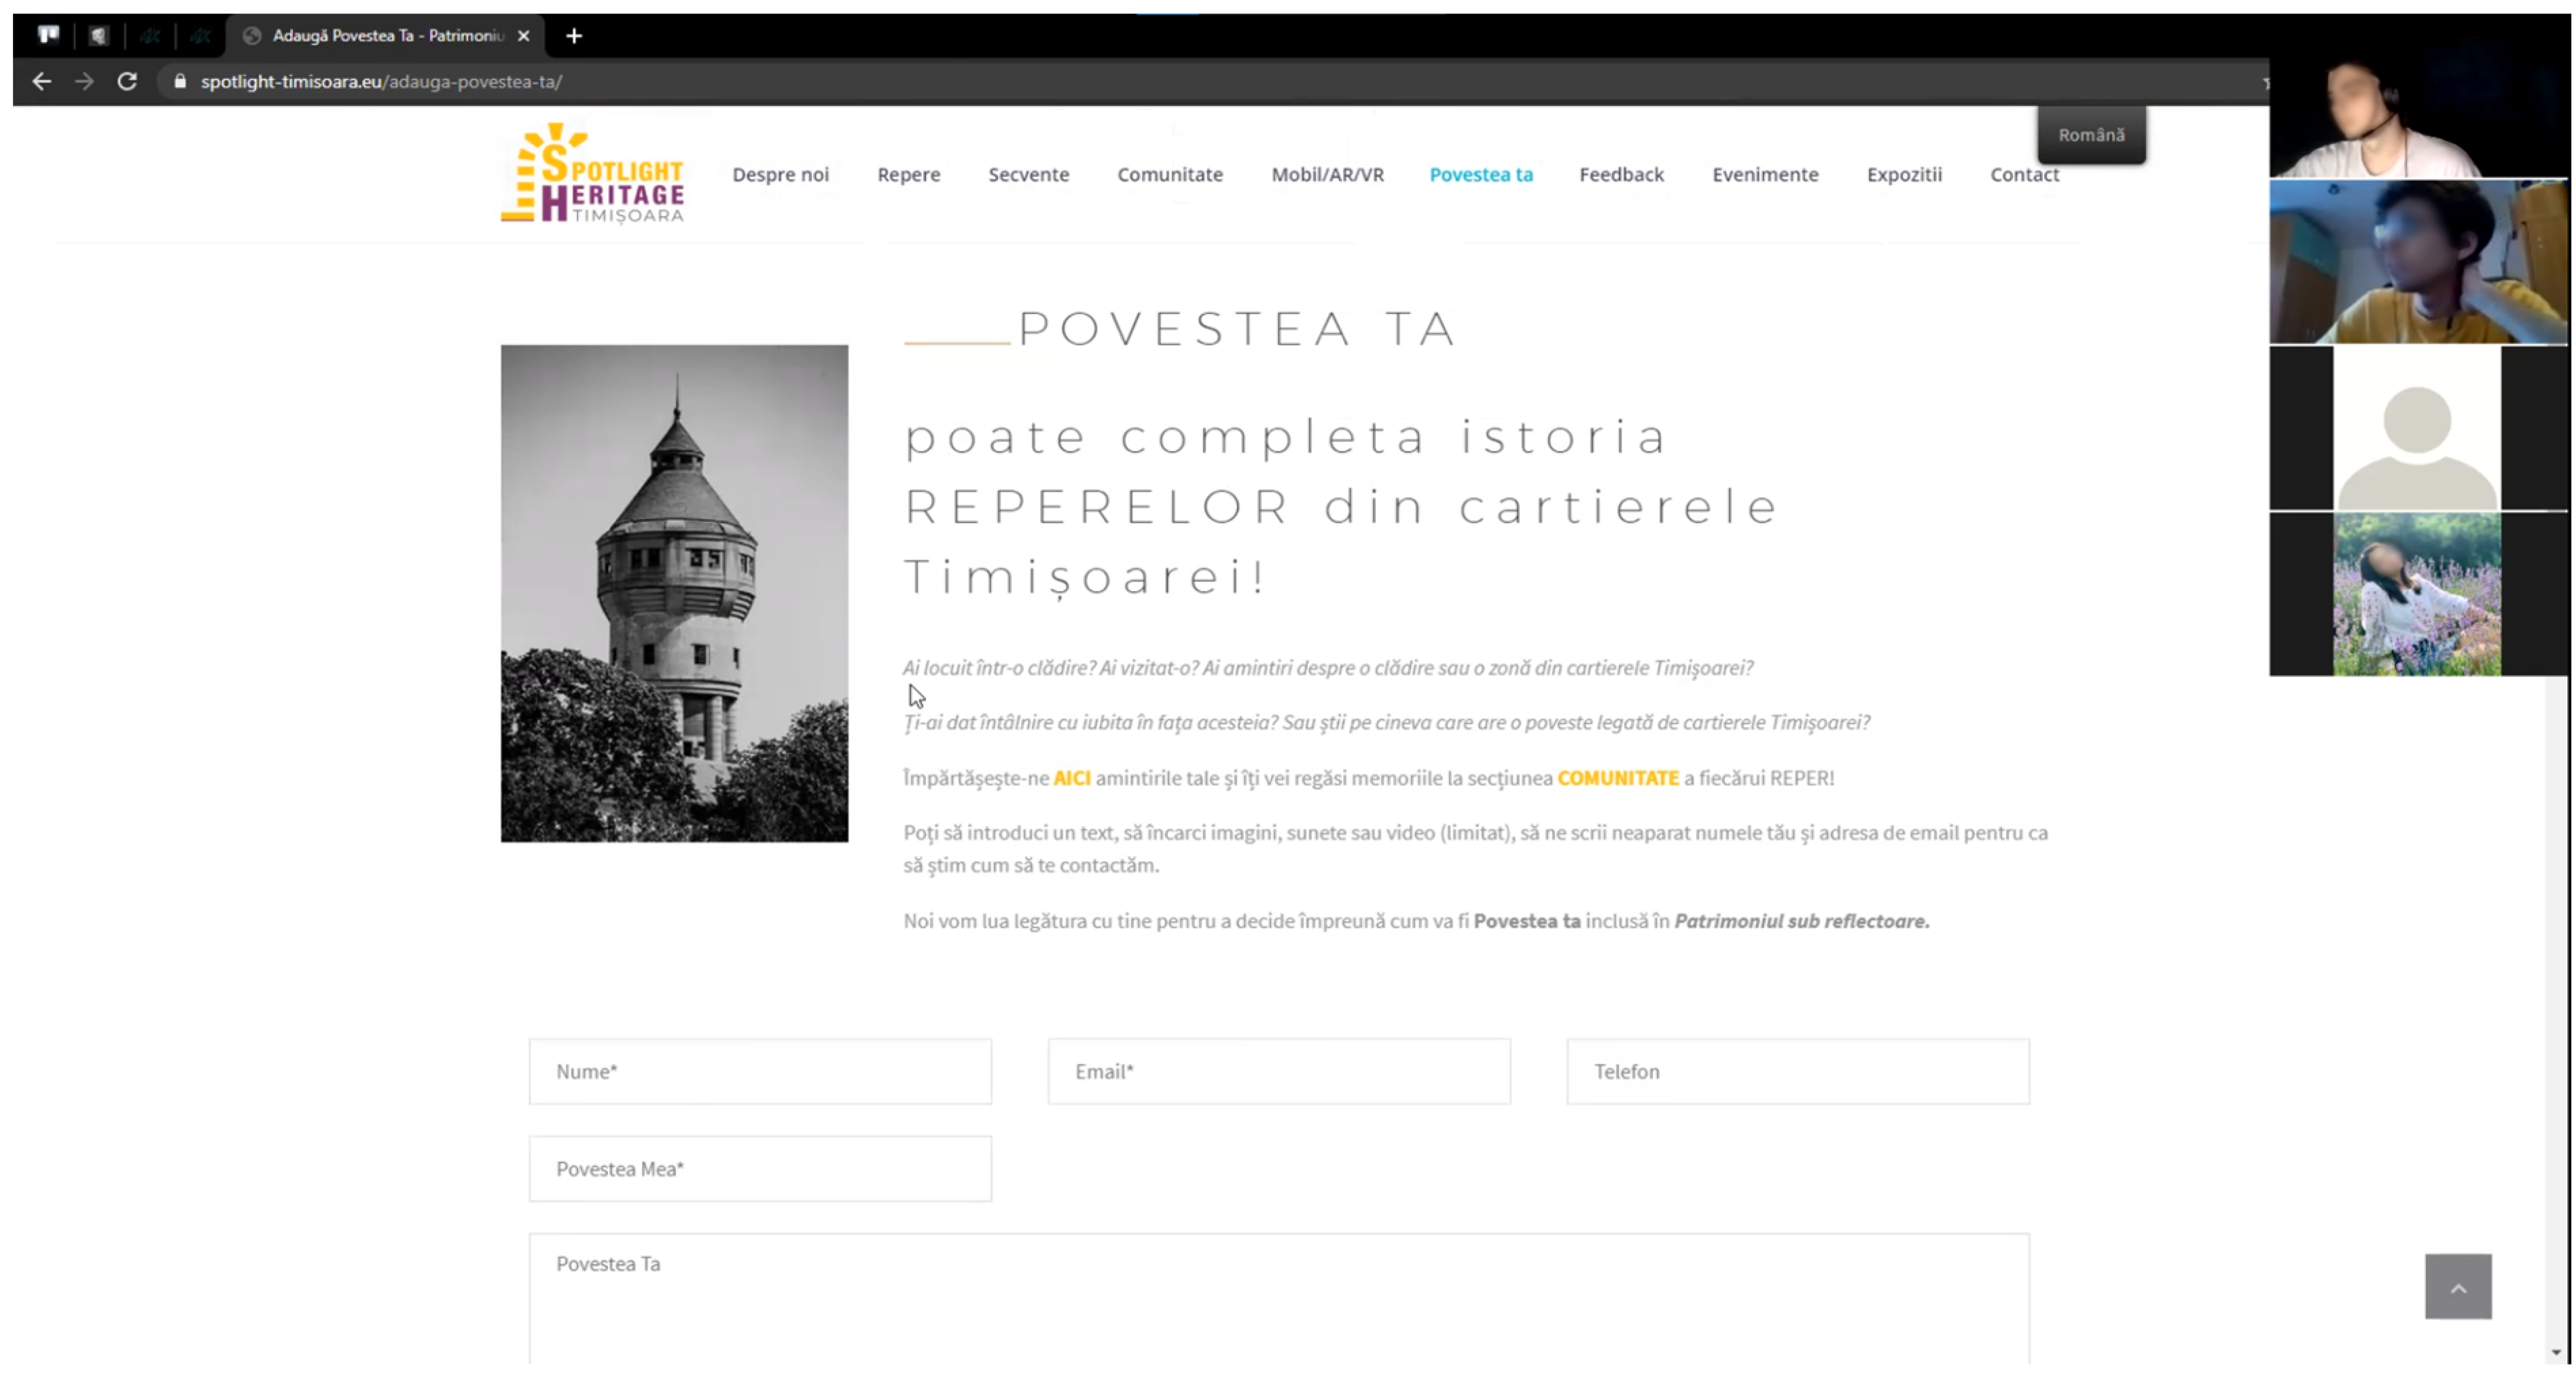
In Figure 10, we present a screenshot from the usability evaluation of the Spotlight Heritage website.
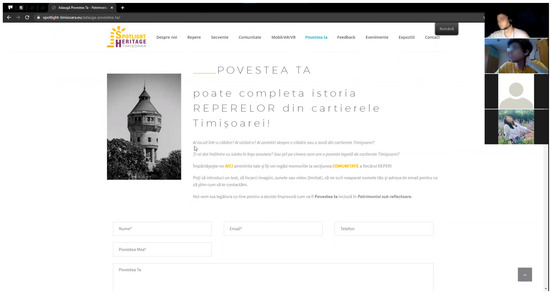
Figure 10.
Spotlight Heritage website evaluation.
The desktop/laptop platform was also evaluated via a SUS questionnaire, an NPS question, and some open-ended questions through the 75-respondents online survey that was mentioned in the previous sections.
4.4.3. Evaluation Procedure for the Mobile Device
The evaluation on the mobile platform was conducted very similarly to the one on the desktop/laptop platform and with the same number of users (10), also in May 2021. What we noticed was a slightly higher technical difficulty for the participants, since they needed to join the meeting both from their computer, in order for us to follow what they say and their non-verbal feedback, and their smartphone, in order for them to be able to share with us how they complete the tasks in the mobile application (Figure 11).
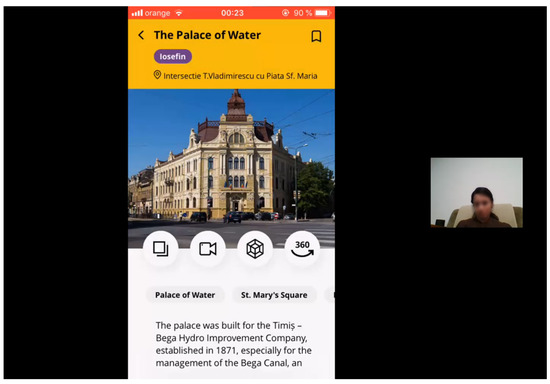
Figure 11.
Usability evaluation for the mobile app, using remote conferencing tools.
Similarly to the desktop/laptop platform, feedback for the mobile version was collected also through the 75-respondents survey.
4.4.4. Evaluation Procedure for the Augmented Reality Application
The user evaluation for augmented reality was again performed very similarly to the evaluations described above. This time, however, it was an in-person moderated usability testing session, as augmented reality applications cannot be tested otherwise. Due to the pandemic, as it was performed in May 2021, we restricted the number of participants to 5, who met the moderators in front of the landmarks where the AR application was working (Figure 12). The number of tasks was reduced, the main one being the scanning of the landmark with the AR app.
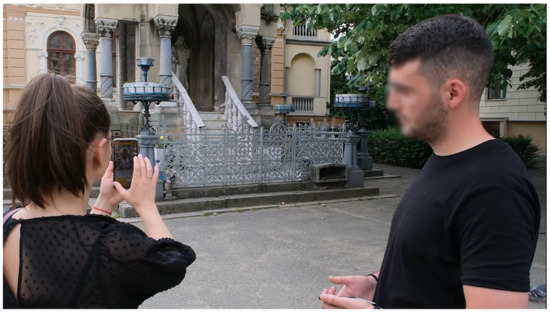
Figure 12.
Usability evaluation with the AR application in front of a landmark.
5. Spotlight Heritage Evaluation Results
5.1. Evaluation Results on the Interactive Touchscreen Table
The usability evaluation for Spotlight Heritage on the interactive touchscreen table revealed some positive and negative aspects. Some of the positive aspects mentioned by the participants were related to the capability to see the interface more clearly and to have a closer view. However, one of the disadvantages of navigating on the app on a device of this size is the necessity for wider gestures in order to reach buttons, menus, keyboards.
The users also mentioned the better user experience, since accessing the information as a part of a group allowed them to discover facts, data and information more easily, and discussing with the near-by users improved the social experience. This will be further investigated as part of our future research, seeking the social usability of our multi-platform cultural product [27].
The average SUS score for the interactive touchscreen table was 90, corresponding to the “Best Imaginable” usability adjective.
5.2. Evaluation Results on Desktop/Laptop
From the Spotlight Heritage website evaluation session, the emphasized positive aspects are referring to the simple yet very attractive user interface design, the existence of the map which is very useful for finding the buildings presented on the platform, the navigation which is quite simple and intuitive, and the presence of useful icons. Moreover, the possibility of adding your own memories related to some landmarks was highly appreciated by participants, bringing a higher level of interaction between the user and the platform and also increasing credibility and confidence among users.
On the other hand, the usability issues found on the website referred to the overcrowded menu, the lack of a search bar, the similarity between the icons of some buttons, and the fact that the syntagm “My story” was not very intuitive for its purpose.
As part of the usability testing sessions, we ran the SUS questionnaire which resulted in an average score of 92, corresponding to the “Best Imaginable” usability adjective. In addition, we ran the Product Reaction Cards method, the first 5 words chosen by the participants being “Complex”, “Accessible”, “Understandable”, “Efficient”, and “Useful”.
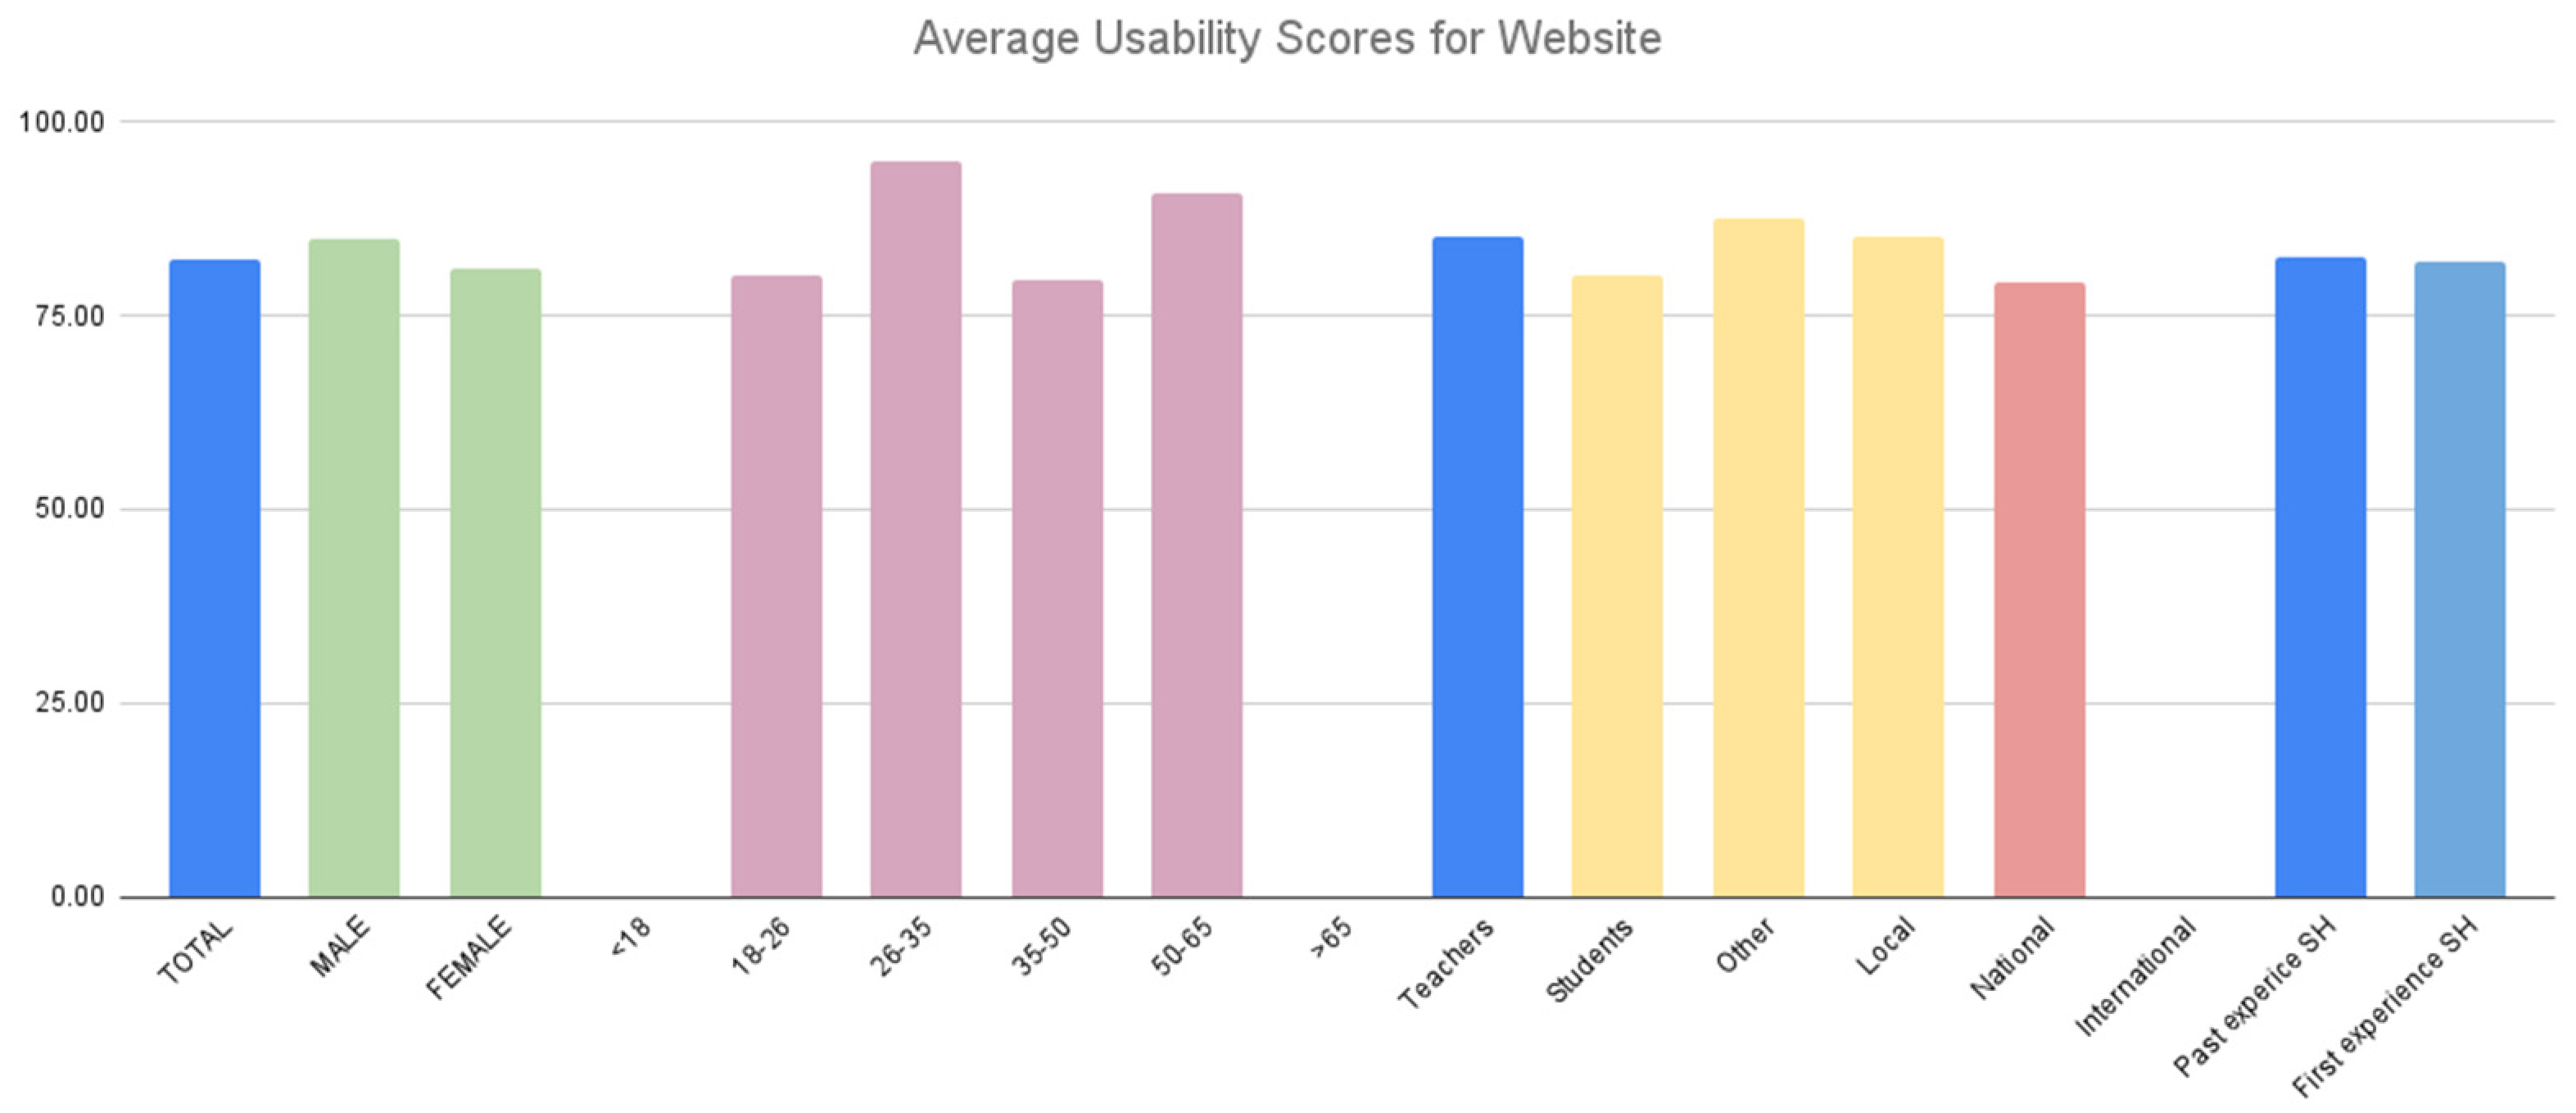
On the other hand, through the online survey that we conducted, we were able to segment the SUS scores based on respondent demographics (Table 3 and Figure 13).
Table 3.
Average usability scores and adjectives, presented by sex, age, and past experience with the Spotlight Heritage concept, for the desktop/laptop platform (data collected from the online survey and represented as a table).
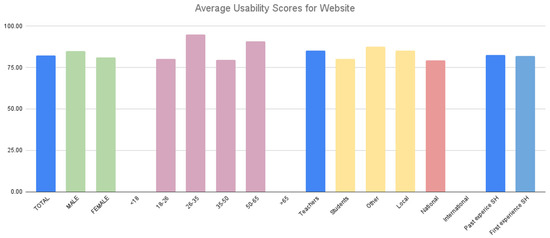
Figure 13.
Average usability scores and adjectives, presented by sex, age, and past experience with the Spotlight Heritage concept, for the desktop/laptop platform (data collected from the online survey and represented as a graphic).
As part of the online survey, we also asked for feedback regarding specific aspects of the website (Figure 14).
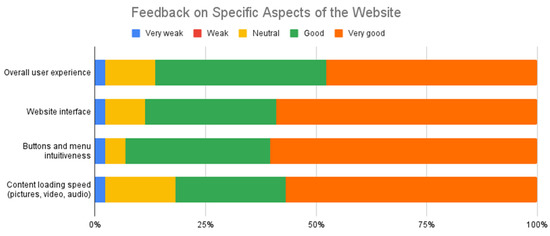
Figure 14.
Respondent feedback regarding the user experience on the website (data collected from the online survey).
The average NPS score obtained by the desktop/laptop platform in the online survey was 68.09.
5.3. Evaluation Results on the Mobile Device
After the Spotlight Heritage mobile application evaluation session, the positive aspects found include the general easy and intuitive design, the matching colors of the app, the good functionality of the map, and the navigation which was considered quite easy.
The usability issues found here include the lack of a search bar, some non-intuitive icons and the long loading time for opening the app.
The average SUS score obtained after the usability testing sessions was 85.5, corresponding to the “Excellent” usability adjective. We applied again the Product Reaction Cards method; the first 5 words which were emphasized by the participants were “Captivating”, “Accessible”, “Attractive”, “Useful”, and “Good quality”.
Similarly, through the online survey that we conducted, we were able to segment the SUS scores based on respondent demographics (Table 4 and Figure 15).
Table 4.
Average usability scores and adjectives, presented by sex, age, and past experience with the Spotlight Heritage concept, for the mobile platform (data collected from the online survey and represented as a table).
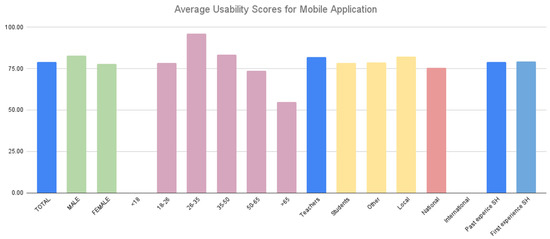
Figure 15.
Average usability scores and adjectives, presented by sex, age, and past experience with the Spotlight Heritage concept, for the mobile platform (data collected from the online survey and represented as a graphic).
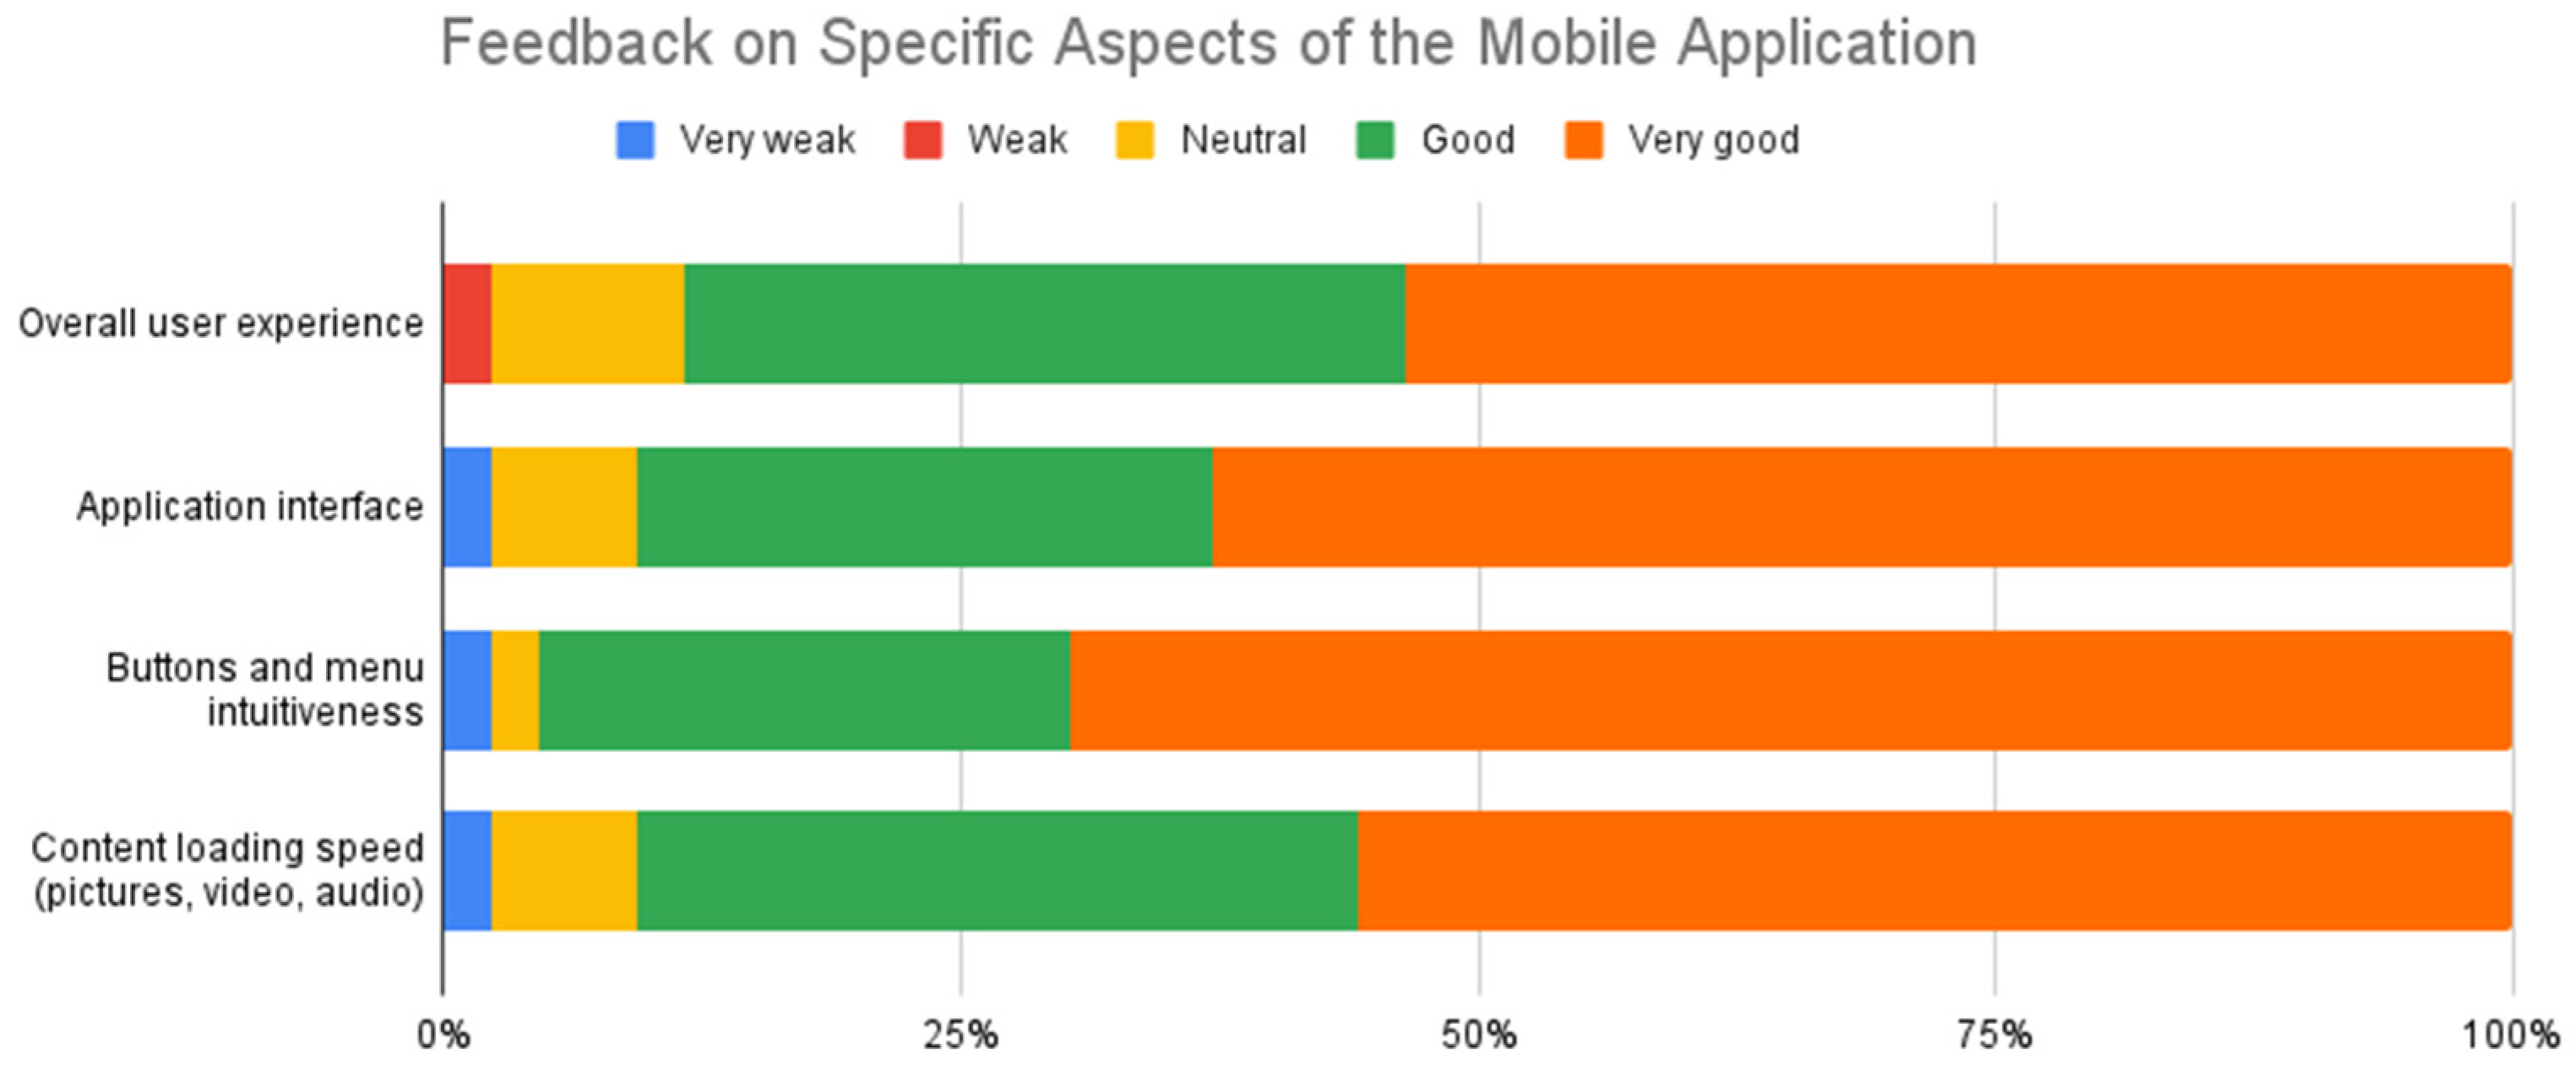
Similarly, as part of the online survey, we also asked for feedback regarding specific aspects of the mobile app (Figure 16).

Figure 16.
Respondent feedback regarding the user experience in the mobile app (data collected from the online survey).
The average NPS score obtained by the mobile platform in the online survey was 70.45.
5.4. Evaluation Results on the AR App
The evaluation of the Spotlight Heritage AR mobile app resulted in a general positive impression about the design and intuitiveness, as well as the easy flow of the navigation. The negative aspects discovered during the evaluation are based on the difficulties of positioning the smartphone camera in space in order to properly scan a building. Because of this, there were buildings which were not recognized. The fluctuating weather was also a challenge.
As mentioned before, the Product Reaction Cards method was applied after the user observation sessions, as part of the post-questionnaire method. The first 5 words which have dominated the usability evaluation for the AR app were: “Accessible”, “Attractive”, “Convincing”, “Useful”, “Intuitive”.
The SUS score for the AR mobile app of Spotlight Heritage was 89.5, corresponding to the “Best Imaginable” usability adjective.
6. Discussion on the Overall Multi-Platform User Evaluation
6.1. General Discussion
Let us first look into some general positive and negative aspects of the usability of the digital components of Spotlight Heritage (SH). As we expected, the Interactive Touchscreen Table was appreciated for the enhanced view and the possibility of seeing the interface more clearly. The website evaluation session on the desktop/laptop and the evaluation of the SH mobile app and SH AR mobile app highlighted the ease of use and navigation but also the intuitiveness of the design. In addition, we found that the map is considered a very useful functionality for finding the landmarks of the project, both on the desktop website and on the SH mobile app. For the mobile apps, the users evaluated the matching colors to be on a positive note.
Very intriguing are the mixed feelings related to the possibility of adding your own memories about the project landmarks. Even if the idea is deemed very positive, increasing interactivity, credibility, and confidence, the implementation is considered to be the least intuitive section of the website.
Other common usability issues found on the website and the mobile app referred to the lack of a search bar, which is very important for users [28], and the similarity between the icons of some buttons.
For each of the chosen digital components for evaluation, there was an individual usability problem. For the website, it was the overcrowded menu, and for the Spotlight Heritage mobile app, it was the long loading time. For the Spotlight Heritage AR mobile app, the problems are based on the difficulties of positioning the camera in order to scan a building. Because of this, and also depending on weather (rain, strong sun, etc.), there were buildings which were not recognized, frustrating users. The authors are working on improving the building recognition algorithm for the SH AR mobile app [29,30].
Finally, the large dimensions of the Interactive Touchscreen Table bring some disadvantages, as not all buttons, menus, and keyboards are easily accessible from only one point, the user being required to move around the table.
Another discussion is related to the Product Reaction Cards, which we used for evaluating the website on desktop/laptop, but also for the two mobile applications. The most chosen words in the desktop/laptop evaluation were “Complex”, “Accessible”, “Understandable”, “Efficient”, and “Useful”. The Spotlight Heritage mobile app was described as “Captivating”, “Accessible”, “Attractive”, “Useful”, and of “Good quality”. Finally, the words most chosen in the Spotlight Heritage Augmented Reality mobile app evaluation were “Accessible”, “Attractive”, “Convincing”, “Useful”, and “Intuitive”.
What we can conclude here is that all the digital products related to the Spotlight Heritage project are considered to be accessible and useful. The mobile applications are both rated as attractive. An interesting aspect is the fact that the website is most often described as Complex, even if the Spotlight Heritage mobile app has more or less the same information displayed. All words chosen in this evaluation method are positive ones, which proves to us that the digital components of this project were appreciated by the participants of the evaluation study.
Another intriguing aspect to compare is the SUS scores obtained by the different platforms (Table 5). The first remark is that all the four platforms received a very high SUS score, i.e., 89.5 to 92 out of 100, which is in the range of Excellent to Best Imaginable. This means that the digital components are highly usable, despite the usability problems that were described above.
Table 5.
Comparison of average SUS scores for the four platforms (data collected during the usability testing sessions).
The second remark is that the difference between them is very small, which suggests that users will not have big surprises when switching between platforms and will find the experience seamless and unitary.
However, the average SUS scores obtained through the online survey differ from the average SUS scores obtained during the usability testing sessions with as many as 10 points. In the online survey, the desktop/laptop version obtained 82.20 (compared to 92 in the usability testing sessions) and the mobile version obtained 79.19 (compared to 85 in the usability testing sessions).
An explanation could be that the usability testing sessions “gave” the participants some concrete tasks to perform in the application, which is consistent with scientific findings such as that “SUS scores are sensitive to successful task completion, with those completing tasks successfully providing higher scores” [31].
A complementary explanation is that participants in moderated usability testing sessions tend to please the moderator by giving higher scores [32] (p. 255).
Finally, a third explanation could be related to the fact that the online survey had many more older adults responding than similarly-aged people participating in the usability session, which is consistent with scientific literature which found out that younger adults tend to give better usability scores than older ones [33].
Regarding differences in SUS scores between men and women, we found a gap of 1.17 points for the desktop/laptop version (82.20 for men and 81.03 for women) and a gap of 4.76 for the mobile version (82.73 for men and 77.97 for women). While some studies suggest that gender plays a role in technology anxiety and adoption [34], others did not find significant differences in usability scores between men and women [35].
Concerning differences between respondents that had previously heard about or even used the Spotlight Heritage applications and respondents that were interacting with Spotlight Heritage for the first time, we did not find any significant difference in SUS scores (less than 0.5 points).
Lastly, both the desktop/laptop version and the mobile version got a very high score in the Net Promoter Score question in the online survey (68.09 for desktop/laptop and 70.45 for mobile), which means that the Spotlight Heritage scores very well in user satisfaction and loyalty.
Overall, the multi-platform evaluation indicates that the digital products are considered accessible and useful and that they score high in usability, across gender and age, which is an important factor in bringing people closer to cultural heritage.
6.2. Comparison with Similar Works
Compared to similar works described in Section 2.1 and Section 4.1, our study addresses a more complex, multi-platform cultural concept, and uses a wider user evaluation methodology.
In ref. [5], the authors evaluate a museum mobile application with 43 participants using a combination of semi-structured interviews, focus group sessions and user observation sessions. In ref. [8], the authors evaluate an augmented reality app with olfactive extension, for an archaeological site, with 67 visitors, employing usability testing sessions, SUS questionnaires, and socio-demographic questionnaires. In ref. [9], the authors evaluate a cultural website using a quantitative assessment based on heuristic analysis metrics (it is not clear how many participants were involved in this part of their larger study). Finally, in [10], the researchers evaluate a 3D desktop application for a fortress with 6 experts from various fields.
In comparison with these works, our study evaluates a multi-platform system, composed of a interactive touchscreen table, desktop/laptop, mobile, and Augmented Reality platforms, with 105 participants, using a combination of semi-structured interviews, observations, think-aloud protocol, SUS questionnaire, Net Promoter Score, and Product Reaction Cards. This suggests a higher reliability of the results obtained.
Regarding the actual findings, there are similarities and differences between our study and these related works. For example, the researchers in [10] also emphasize the necessity of engaging professionals from multiple fields in the development of a storytelling cultural concept. Another example is that the researchers in [8] found no differences in the usability of the digital product when considering the sex of the participants, similarly to our results, but they also found no differences when considering the age, which was not the case in our study.
6.3. Threats to the Validity of the Study
Regarding the limitations of this evaluation, we acknowledge the existence of potential threats to the validity of our study. First of all, there is a selection threat to the validity of the moderated usability testing sessions, as the participants were not chosen randomly. Instead, a convenience-based sampling was used, i.e., our students probably recruited participants from their friends, colleagues, and acquaintances, although they were strongly advised not to do so. We attempted to alleviate this threat by also running the online survey evaluation, which gathered participants in a more random fashion.
Secondly, there is a risk that participants might have dropped interest in the experiment at some point, due to the high number of evaluation methods used in one session. We tried to alleviate this threat by arranging the methods in time in such a way that they feel natural and the session does not seem too fragmented. Additionally, the participants were instructed that they can leave the session at any point in time, without obligations or explanations.
Thirdly, another threat to the validity of our study is the population sample, which relates to the first acknowledged threat. We aimed to get participants with a representative demographic profile, but it proved to be difficult to engage professionals that work in other domains than ours. For example, the usability testing session participants mostly work in IT (10), while 6 are working in Education and 1 in Arts/Culture. As for the online survey respondents, 29 are teachers, 41 are students, and only 3 work in Public Administration. These numbers might affect the generalization of our study’s results.
7. Conclusions
In this paper, we have described the technical design and implementation of a multi-platform digital storytelling concept called Spotlight Heritage, a 3-year project that we developed in Timisoara (Romania), European Capital of Culture in 2023. The digital architecture of the concept consists in applications which run on interactive touchscreen tables, desktop/laptop, mobile devices, and Augmented Reality.
Because of the lack of user evaluation models for such multi-platform digital storytelling concepts for cultural heritage, we have described here the user evaluation methodology, procedure, and results that we obtained after applying a mix of usability testing methods for each of the platforms and unified the insights.
For this purpose, we ran an online survey with 75 respondents in November 2020 and performed a set of in-person and remote moderated usability testing sessions with 30 participants in May and July 2021, using all-together a mix of methods consisting of semi-structured interviews, observations, think-aloud protocol, SUS questionnaire, Net Promoter Score question, and Product Reaction Cards.
We discovered that all the four platforms of the Spotlight Heritage concept have “Excellent” and “Best Imaginable” usability scores and that they are considered accessible and useful. This contributes to a seamless navigation between platforms and user satisfaction and loyalty towards the cultural heritage concept. We found that each platform complements the experience of the cultural heritage consumer: the interactive touchscreen table allows for social interaction around the cultural information, the desktop/laptop version provides the possibility of exploring deeply the content, the mobile platform allows for exploring the information on-the-go and sharing it with the others, and the Augmented Reality version provides the means for exploring the landmarks right in front of them.
We also identified some usability problems, such as the lack of a search button in the website, and in the mobile app, the effort needed to interact with certain areas of the application on the interactive touchscreen table or the difficulties in recognizing a landmark with the Augmented Reality application because of weather conditions.
The mix of evaluation methods that we used gave us a robust picture of the positive and negative aspects of the multi-platform usability and the results correlate, taken separately, with the scientific literature at hand.
We will use this research to improve the user experience of the multi-platform digital storytelling concept that we described here and as a basis for deeper research into user experience models for multi-platform concepts that include even newer technologies (mixed reality, outdoor holographic displays). Moreover, we intend to broaden the discussion of our findings in a future paper, on topics such as the comprehension and memorability of the digital storytelling techniques that we presented.
Author Contributions
Conceptualization, S.V. and D.A.; Data curation, S.V., O.R., M.M. and C.O.; Funding acquisition, R.V.; Methodology, S.V., D.A. and O.R.; Project administration, D.A.; Software, A.T. and C.O.; Supervision, R.V.; Validation, D.A. and V.M.; Visualization, A.T., O.R. and C.O.; Writing—original draft, S.V., V.M. and O.R.; Writing—review & editing, A.T. and M.M. All authors have read and agreed to the published version of the manuscript.
Funding
This research was funded by the Politehnica University of Timisoara under grant number 10162/11.06.2021.
Institutional Review Board Statement
The study was conducted according to the Ethical Regulations and Guidelines of the Politehnica University of Timisoara, Romania http://upt.ro/Informatii_etica-si-deontologie_164_ro.html (accessed on 30 July 2021).
Informed Consent Statement
GDPR data protection information was provided and respected and informed consent was obtained from all subjects involved in the study.
Data Availability Statement
The data presented in this study are available on request from the corresponding author.
Acknowledgments
We gratefully acknowledge the contributions of all participants in our experiments, as well as those involved in the Spotlight Heritage Timisoara cultural project.
Conflicts of Interest
The authors declare no conflict of interest.
References
- Tiriteu, D.; Vert, S. Usability Testing of Mobile Augmented Applications for Cultural Heritage—A Systematic Literature Review. In Proceedings of the RoCHI 2020, Sibiu, Romania, 22–23 October 2020; p. 144. [Google Scholar] [CrossRef]
- De Jager, A.; Fogarty, A.; Tewson, A.; Lenette, C.; Boydell, K.M. Digital storytelling in research: A systematic review. Qual. Rep. 2017, 22, 2548–2582. [Google Scholar]
- Wu, J.; Chen, D.-T.V. A systematic review of educational digital storytelling. Comput. Educ. 2020, 147, 103786. [Google Scholar] [CrossRef]
- Lambert, J. Digital Storytelling: Capturing Lives, Creating Community, 4th ed.; Routledge: New York, NY, USA; London, UK, 2012. [Google Scholar]
- Katifori, A.; Tsitou, F.; Pichou, M.; Kourtis, V.; Papoulias, E.; Ioannidis, Y.; Roussou, M. Exploring the Potential of Visually-Rich Animated Digital Storytelling: The Mobile Experience of the Athens University History Museum. In Visual Computing for Cultural Heritage; Springer International Publishing: Berlin/Heidelberg, Germany, 2020; p. 325. [Google Scholar]
- Ivey, B. Arts, Inc.: How Greed and Neglect Have Destroyed Our Cultural Rights; University of California Press: Berkeley, CA, USA, 2010. [Google Scholar]
- Ioannidis, Y.; El Raheb, K.; Toli, E.; Katifori, A.; Boile, M.; Mazura, M. One object many stories: Introducing ICT in museums and collections through digital storytelling. In Proceedings of the 2013 Digital Heritage International Congress (DigitalHeritage), Marseille, France, 28 October–1 November 2013; Volume 1, pp. 421–424. [Google Scholar]
- Marto, A.; Melo, M.; Gonçalves, A.; Bessa, M. Development and Evaluation of an Outdoor Multisensory AR System for Cultural Heritage. IEEE Access 2021, 9, 16419–16434. [Google Scholar] [CrossRef]
- Psomadaki, I.; Dimoulas, C.A.; Kalliris, G.M.; Paschalidis, G. Technologies of Non Linear Storytelling for the Management of Cultural Heritage in the Digital City: The Case of Thessaloniki. In Digital Cultural Heritage; Springer: Berlin/Heidelberg, Germany, 2018; pp. 337–349. [Google Scholar]
- Rizvic, S.; Djapo, N.; Alispahic, F.; Hadzihalilovic, B.; Cengic, F.F.; Imamovic, A.; Okanovic, V.; Boskovic, D. Guidelines for interactive digital storytelling presentations of cultural heritage. In Proceedings of the 2017 9th International Conference on Virtual Worlds and Games for Serious Applications (VS-Games), Athens, Greece, 6–8 September 2017; pp. 253–259. [Google Scholar]
- Fernandez, A.; Insfran, E.; Abrahão, S. Usability evaluation methods for the web: A systematic mapping study. Inf. Softw. Technol. 2011, 53, 789–817. [Google Scholar] [CrossRef]
- Koukopoulos, Z.; Koukopoulos, D. Evaluating the Usability and the Personal and Social Acceptance of a Participatory Digital Platform for Cultural Heritage. Heritage 2019, 2, 1. [Google Scholar] [CrossRef] [Green Version]
- Ahmad, N.A.N.; Lokman, A.; Ab Hamid, N.I.M. Performing Usability Evaluation on Multi-Platform Based Application for Efficiency, Effectiveness and Satisfaction Enhancement. Int. J. Interact. Mob. Technol. 2021, 15, 103–117. [Google Scholar] [CrossRef]
- Grier, R.A.; Bangor, A.; Kortum, P.; Peres, S.C. The System Usability Scale: Beyond Standard Usability Testing. In Proceedings of the Human Factors and Ergonomics Society Annual Meeting, Torino, Italy, 1 September 2013; Volume 57, pp. 187–191. [Google Scholar] [CrossRef]
- Sauro, J.; Lewis, J. When designing usability questionnaires, does it hurt to be positive? In Proceedings of the SIGCHI Conference on Human Factors in Computing Systems, Vancouver, BC, Canada, 7–12 May 2011; p. 2224. [Google Scholar] [CrossRef]
- Sauro, J.; Lewis, J.R. Chapter 8—Standardized usability questionnaires. In Quantifying the User Experience, 2nd ed.; Sauro, J., Lewis, J.R., Eds.; Morgan Kaufmann: Boston, MA, USA, 2016; pp. 185–248. [Google Scholar] [CrossRef]
- Das, A.; Acar, G.; Borisov, N.; Pradeep, A. The Web’s Sixth Sense: A Study of Scripts Accessing Smartphone Sensors. In Proceedings of the 2018 ACM SIGSAC Conference on Computer and Communications Security, New York, NY, USA, 15–19 October 2018; pp. 1515–1532. [Google Scholar] [CrossRef]
- Adams, W. Conducting Semi-Structured Interviews. In Handbook of Practical Program Evaluation; John Wiley & Sons, Ltd.: Hoboken, NJ, USA, 2015; pp. 492–505. [Google Scholar] [CrossRef]
- Bastien, J.M.C. Usability testing: A review of some methodological and technical aspects of the method. Int. J. Med. Inf. 2010, 79, e18–e23. [Google Scholar] [CrossRef] [PubMed] [Green Version]
- Krahmer, E.; Ummelen, N. Thinking About Thinking Aloud: A Comparison of TwoVerbal Protocols for Usability Testing. IEEE Trans. Prof. Commun. 2004, 47, 105–117. [Google Scholar] [CrossRef]
- Mclellan, S.; Muddimer, A.; Peres, S. The Effect of Experience on System Usability Scale Ratings. J. Usability Stud. 2012, 7, 56–67. [Google Scholar]
- Bangor, A.; Kortum, P.; Miller, J. Determining what individual SUS scores mean: Adding an adjective rating scale. J. Usability Stud. 2009, 4, 114–123. [Google Scholar]
- Keiningham, T.; Aksoy, L.; Cooil, B.; Andreassen, T.; Williams, L. A Holistic Examination of Net Promoter. J. Database Mark. Cust. Strategy Manag. 2008, 15, 79–90. [Google Scholar] [CrossRef] [Green Version]
- Barnum, C.M. 7—Conducting a usability test. In Usability Testing Essentials, 2nd ed.; Barnum, C.M., Ed.; Morgan Kaufmann: Boston, MA, USA, 2021; pp. 249–285. [Google Scholar] [CrossRef]
- Andone, D.; Vert, S.; Mihaescu, V.; Stoica, D.; Ternauciuc, A. Evaluation of the Virtual Mobility Learning Hub. In Learning and Collaboration Technologies. Designing, Developing and Deploying Learning Experiences; Springer Nature: Cham, Switzerlands, 2020; pp. 20–33. [Google Scholar] [CrossRef]
- Vert, S.; Andone, D. Mobile usability evaluation: The case of the Art Encounters 2017 application. In Proceedings of the International Conference on Human-Computer Interaction (RoCHI 2018), Cluj-Napoca, Romania, 3–4 September 2018; pp. 42–45. [Google Scholar]
- Jung, M.; Lazaro, M.J.S.; Yun, M.H. Evaluation of Methodologies and Measures on the Usability of Social Robots: A Systematic Review. Appl. Sci. 2021, 11, 1388. [Google Scholar] [CrossRef]
- Hur, Y.; Jo, J. Development of Intelligent Information System for Digital Cultural Contents. Mathematics 2021, 9, 238. [Google Scholar] [CrossRef]
- Orhei, C.; Vert, S.; Vasiu, R. A Novel Edge Detection Operator for Identifying Buildings in Augmented Reality Applications. In Information and Software Technologies; Elsevier: Cham, Switzerlands, 2020; pp. 208–219. [Google Scholar] [CrossRef]
- Orhei, C.; Vert, S.; Mocofan, M.; Vasiu, R. End-To-End Computer Vision Framework: An Open-Source Platform for Research and Education. Sensors 2021, 21, 3691. [Google Scholar] [CrossRef] [PubMed]
- Lewis, J.R.; Sauro, J. Item benchmarks for the system usability scale. J. Usability Stud. 2018, 13, 158–167. [Google Scholar]
- Barnum, C. Usability Testing Essentials: Ready, Set...Test! 2nd ed.; Morgan Kaufmann: Boston, MA, USA, 2020. [Google Scholar]
- Sonderegger, A.; Schmutz, S.; Sauer, J. The influence of age in usability testing. Appl. Ergon. 2016, 52, 291–300. [Google Scholar] [CrossRef]
- Schmidt, M.; Kafka, J.X.; Kothgassner, O.D.; Hlavacs, H.; Beutl, L.; Felnhofer, A. Why Does It Always Rain on Me? Influence of Gender and Environmental Factors on Usability, Technology Related Anxiety and Immersion in Virtual Environments. In Proceedings of the 10th International Conference on Advances in Computer Entertainment—Volume 8253, Boekelom, The Netherlands, 12–15 November 2013; pp. 392–402. [Google Scholar]
- Bangor, A.; Kortum, P.T.; Miller, J.T. An Empirical Evaluation of the System Usability Scale. Int. J. Human Comput. Interact. 2008, 24, 574–594. [Google Scholar] [CrossRef]


Publisher’s Note: MDPI stays neutral with regard to jurisdictional claims in published maps and institutional affiliations. |
© 2021 by the authors. Licensee MDPI, Basel, Switzerland. This article is an open access article distributed under the terms and conditions of the Creative Commons Attribution (CC BY) license (https://creativecommons.org/licenses/by/4.0/).