Möbius Transformation-Induced Distributions Provide Better Modelling for Protein Architecture
Abstract
:1. Introduction
1.1. Brief Overview
1.2. Our Contribution
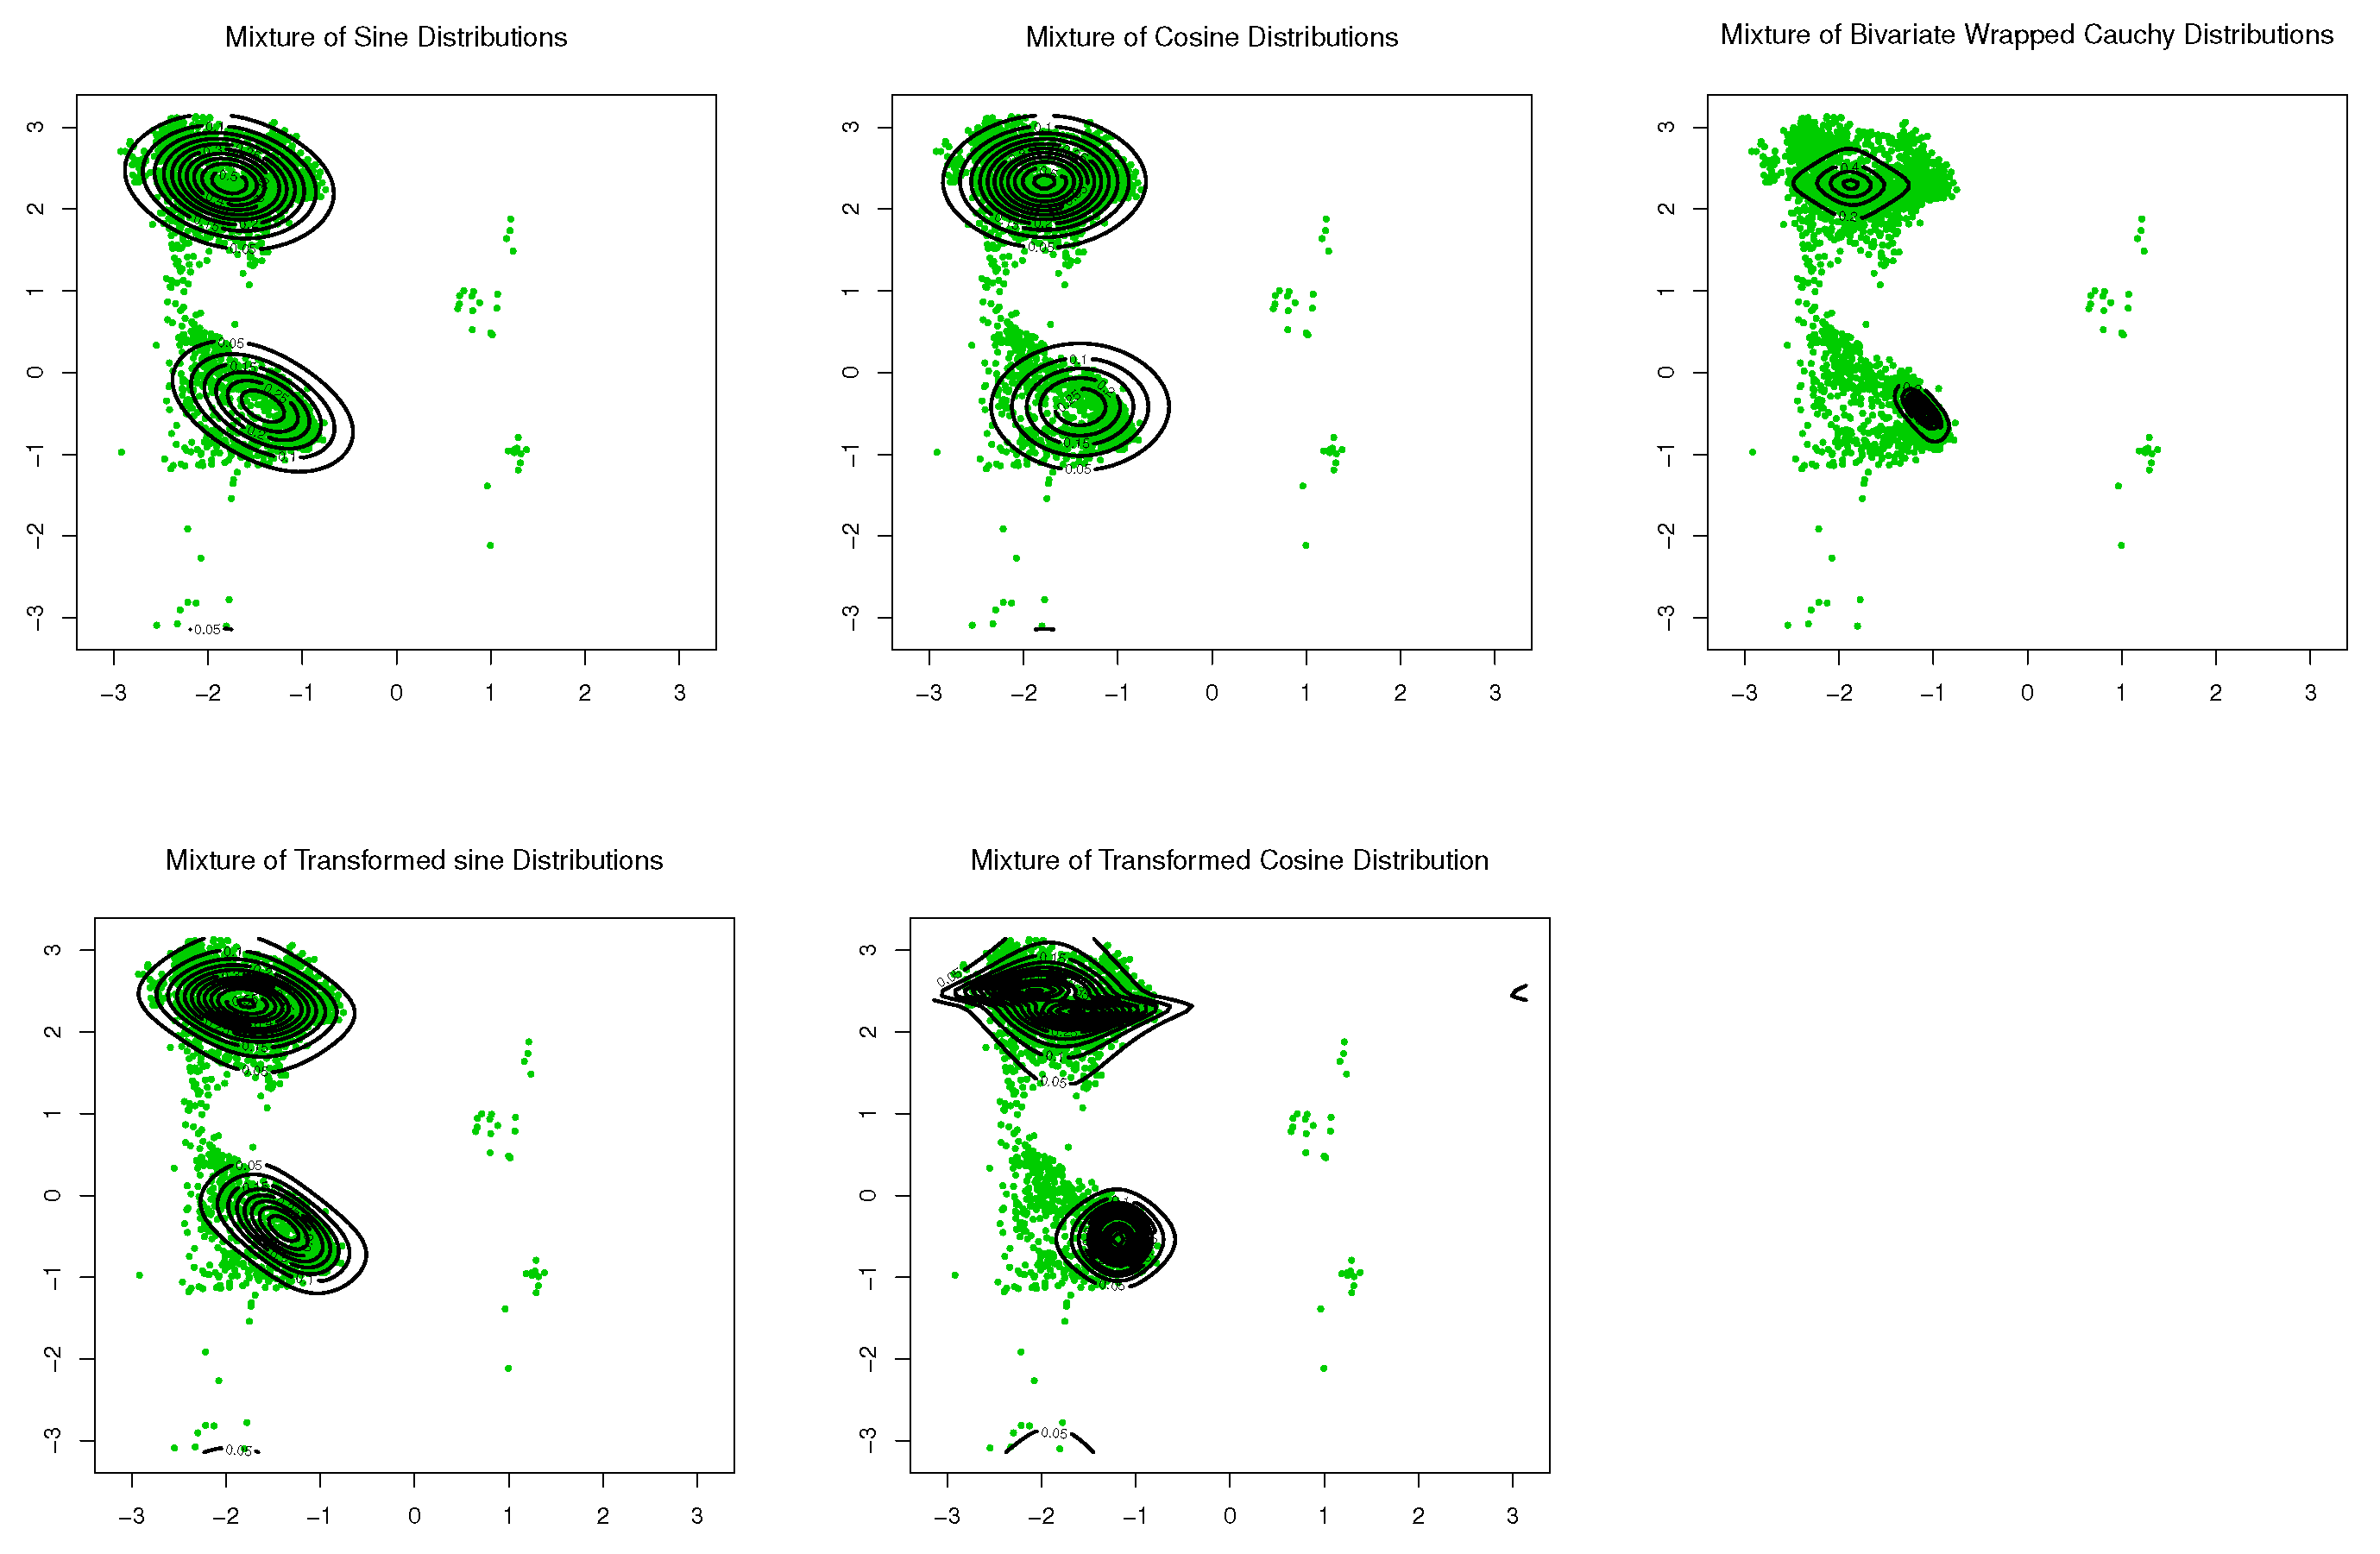
- New Möbius transformation-induced toroidal distributions are developed, acting as alternatives for existing models and efficiently outperforming them in the data application in this paper;
- The proposed distributions reflect the protein structure more accurately than the existing models and can serve as proposal distributions for MCMC sampling of proteins since we should incorporate protein structure information into proposal distributions to obtain more accurate results;
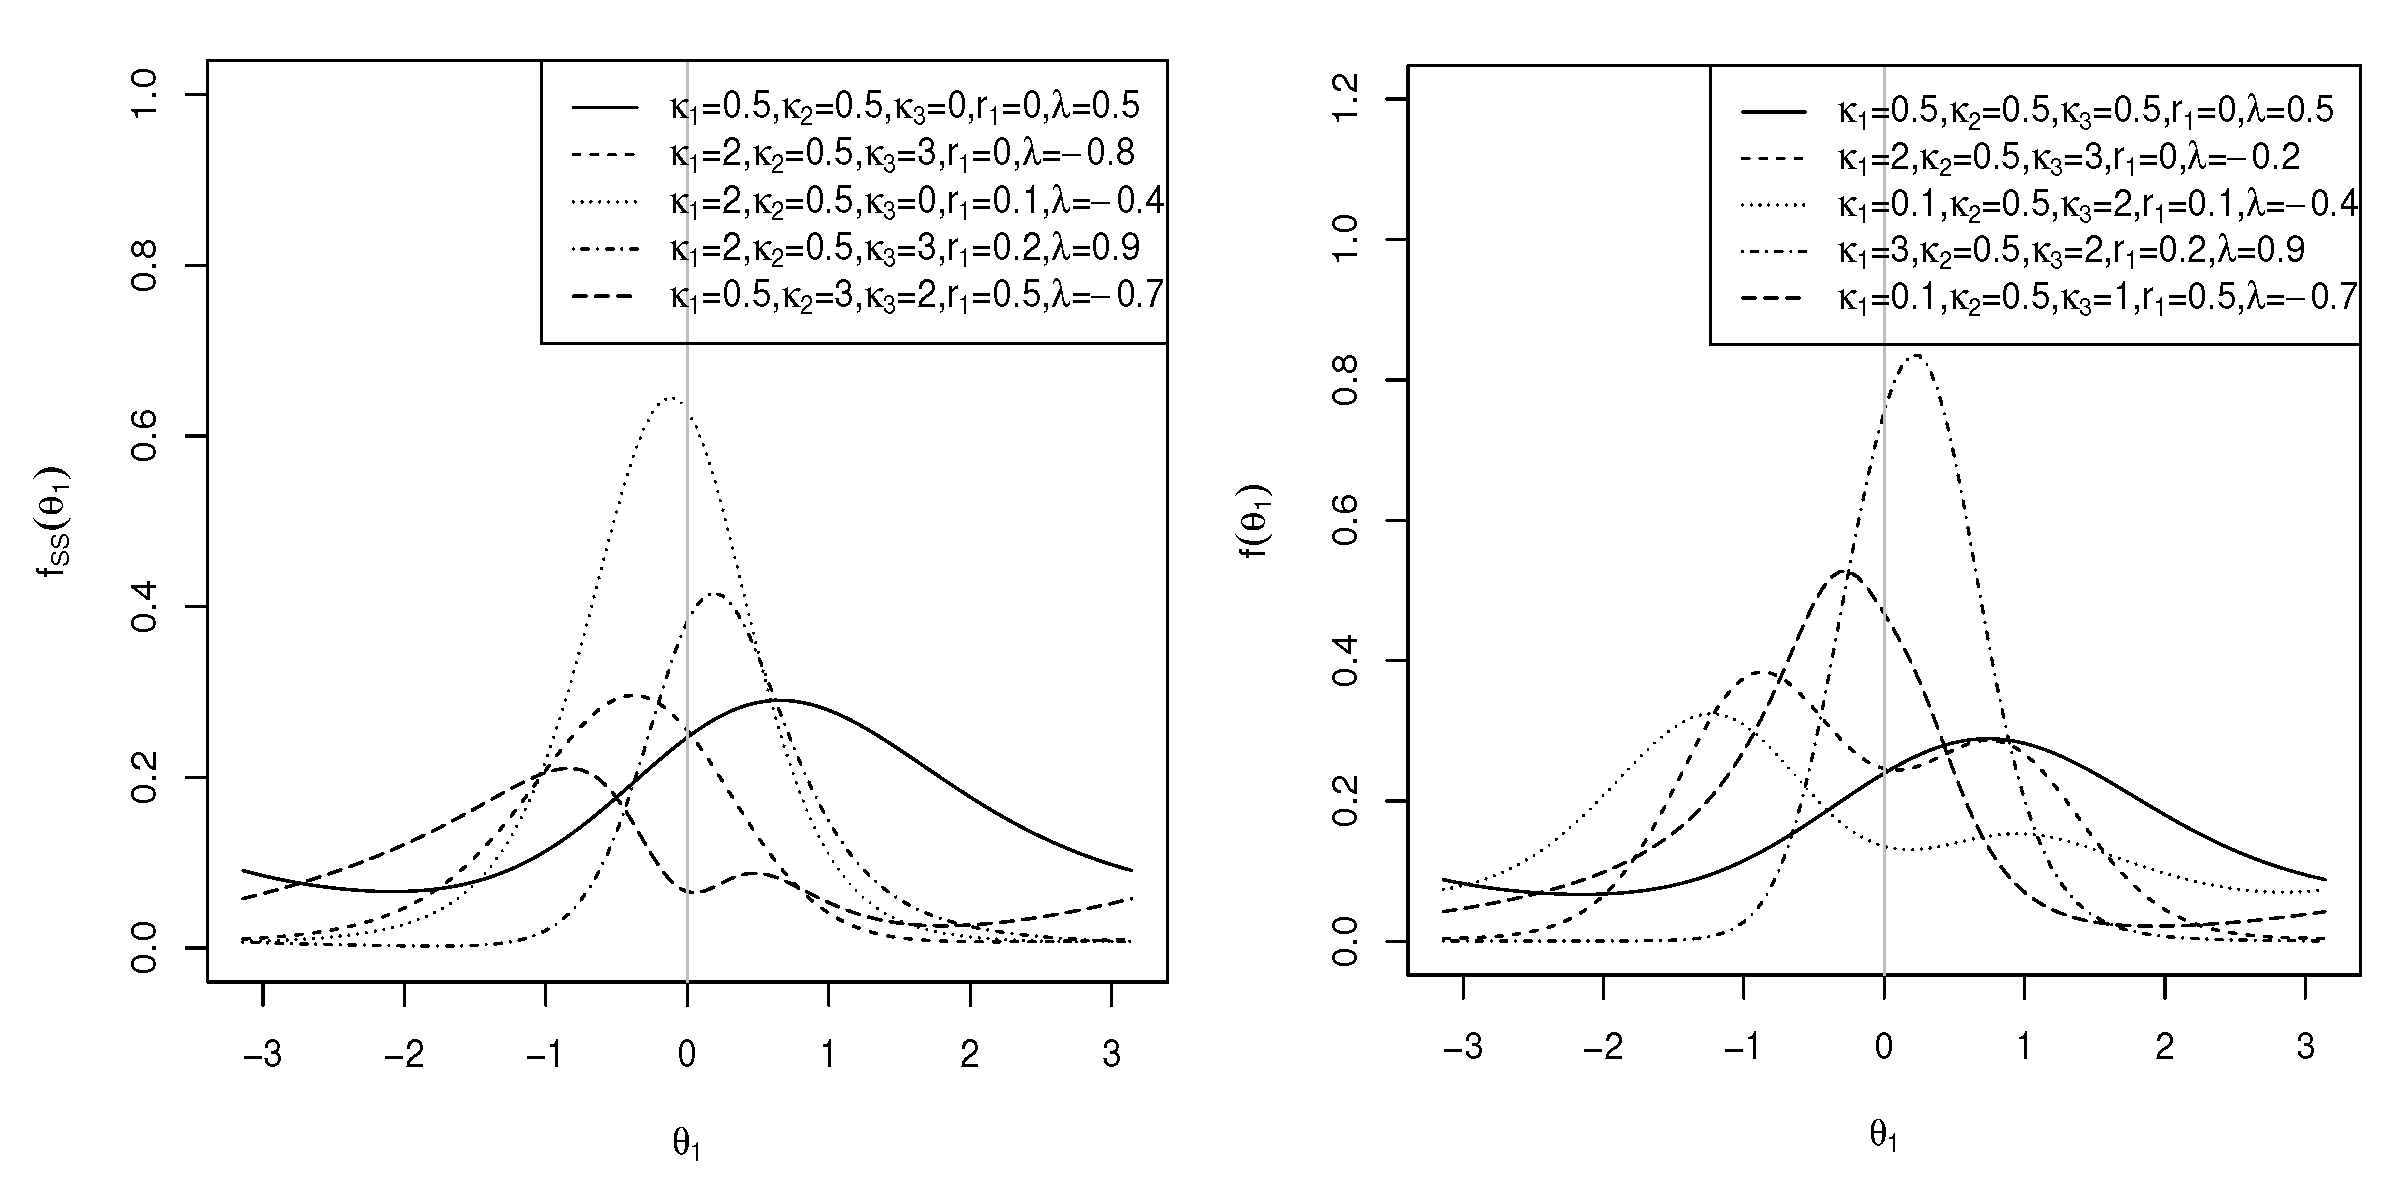
- Sine-skewed versions of these proposed models are introduced to meet the increasing demand for the modelling of asymmetric toroidal data;
- The marginals of the new models lead to new multimodal circular distributions.
2. Two New Models on the Torus
2.1. Transformed Cosine Model
2.2. Transformed Sine Model
3. Sine-Skewed Transformed Sine and Cosine Distributions
4. Maximum Likelihood Estimation
5. Protein Structure Application
6. Simulation Study
7. Conclusions
Author Contributions
Funding
Institutional Review Board Statement
Informed Consent Statement
Data Availability Statement
Acknowledgments
Conflicts of Interest
Appendix A
Appendix A.1. Proof of Proposition 1
Appendix A.2. Proof of Corollary 1
Appendix A.3. Proof of Corollary 2
References
- Ramachandran, G.T.; Sasisekharan, V. Conformation of polypeptides and proteins. Adv. Protein Chem. 1968, 23, 283–437. [Google Scholar]
- Holley, L.H.; Karplus, M. Protein secondary structure prediction with a neural network. Proc. Natl. Acad. Sci. USA 1989, 86, 152–156. [Google Scholar] [CrossRef] [Green Version]
- Metropolis, N.; Rosenbluth, A.W.; Rosenbluth, M.N.; Teller, A.H.; Teller, E. Equation of state calculations by fast computing machines. J. Chem. Phys. 1953, 21, 1087–1092. [Google Scholar] [CrossRef] [Green Version]
- Hastings, W.K. Monte Carlo sampling methods using Markov chains and their applications. Biometrika 1970, 57, 97–109. [Google Scholar] [CrossRef]
- Irbäck, A.; Mohanty, S. PROFASI: A Monte Carlo simulation package for protein folding and aggregation. J. Comput. Chem. 2006, 27, 1548–1555. [Google Scholar] [CrossRef]
- Jones, D.T. Successful ab initio prediction of the tertiary structure of NK-lysin using multiple sequences and recognized supersecondary structural motifs. Proteins Struct. Funct. Bioinform. 1997, 29, 185–191. [Google Scholar] [CrossRef]
- Jones, T.A.; Thirup, S. Using known substructures in protein model building and crystallography. Embo J. 1986, 5, 819–822. [Google Scholar] [CrossRef]
- Simons, K.T.; Kooperberg, C.; Huang, E.; Baker, D. Assembly of protein tertiary structures from fragments with similar local sequences using simulated annealing and Bayesian scoring functions. J. Mol. Biol. 1997, 268, 209–225. [Google Scholar] [CrossRef] [Green Version]
- Ley, C.; Verdebout, T. Applied Directional Statistics: Modern Methods and Case Studies; CRC Press: Boca Raton, FL, USA, 2018. [Google Scholar]
- Ley, C.; Verdebout, T. Modern Directional Statistics; CRC Press: Boca Raton, FL, USA, 2017. [Google Scholar]
- Mardia, K.V. Statistics of directional data. J. R. Stat. Soc. Ser. B (Methodol.) 1975, 37, 349–371. [Google Scholar] [CrossRef]
- Rivest, L.P. A distribution for dependent unit vectors. Commun. Stat.-Theory Methods 1988, 17, 461–483. [Google Scholar] [CrossRef]
- Singh, H.; Hnizdo, V.; Demchuk, E. Probabilistic model for two dependent circular variables. Biometrika 2002, 89, 719–723. [Google Scholar] [CrossRef]
- Mardia, K.V.; Taylor, C.C.; Subramaniam, G.K. Protein bioinformatics and mixtures of bivariate von-Mises distributions for angular data. Biometrics 2007, 63, 505–512. [Google Scholar] [CrossRef]
- Kent, J.T.; Mardia, K.V.; Taylor, C.C. Modelling strategies for bivariate circular data. In Proceedings of the Leeds Annual Statistical Research Conference; The Art and Science of Statistical Bioinformatics, Leeds University Press: Leeds, UK, 2008; pp. 70–73. [Google Scholar]
- Mardia, K.V.; Frellsen, J. Statistics of bivariate von Mises distributions. In Bayesian Methods in Structural Bioinformatics; Springer: Berlin/Heidelberg, Germany, 2012; pp. 159–178. [Google Scholar]
- Mardia, K.V.; Hughes, G.; Taylor, C.C.; Singh, H. A multivariate von Mises distribution with applications to bioinformatics. Can. J. Stat. 2008, 36, 99–109. [Google Scholar] [CrossRef]
- Wehrly, T.E.; Johnson, R.A. Bivariate models for dependence of angular observations and a related Markov process. Biometrika 1980, 67, 255–256. [Google Scholar] [CrossRef]
- Jones, M.C.; Pewsey, A.; Kato, S. On a class of circulas: Copulas for circular distributions. Ann. Inst. Stat. Math. 2015, 67, 843–862. [Google Scholar] [CrossRef]
- Fernández-Durán, J.J. Models for circular–linear and circular–circular data constructed from circular distributions based on nonnegative trigonometric sums. Biometrics 2007, 63, 579–585. [Google Scholar] [CrossRef]
- García-Portugués, E.; Crujeiras, R.M.; González-Manteiga, W. Exploring wind direction and SO2 concentration by circular–linear density estimation. Stoch. Environ. Res. Risk Assess. 2013, 27, 1055–1067. [Google Scholar] [CrossRef] [Green Version]
- Pewsey, A.; García-Portugués, E. Recent advances in directional statistics. TEST 2021, 30, 1–58. [Google Scholar] [CrossRef]
- Di Marzio, M.; Panzera, A.; Taylor, C.C. Kernel density estimation on the torus. J. Stat. Plan. Inference 2011, 141, 2156–2173. [Google Scholar] [CrossRef] [Green Version]
- Ameijeiras-Alonso, J.; Ley, C. Sine-skewed toroidal distributions and their application in protein bioinformatics. Biostatistics 2020. Available online: https://doi.org/10.1093/biostatistics/kxaa039 (accessed on 20 January 2021). [CrossRef]
- Kato, S.; Shimizu, K.; Shieh, G.S. A circular–circular regression model. Stat. Sin. 2008, 18, 633–645. [Google Scholar]
- Shieh, G.S.; Johnson, R.A. Inferences based on a bivariate distribution with von-Mises marginals. Ann. Inst. Stat. Math. 2005, 57, 789–802. [Google Scholar] [CrossRef]
- Shieh, G.S.; Zheng, S.; Johnson, R.A.; Chang, Y.F.; Shimizu, K.; Wang, C.C.; Tang, S.L. Modeling and comparing the organization of circular genomes. Bioinformatics 2011, 27, 912–918. [Google Scholar] [CrossRef]
- Liu, D.; Peddada, S.D.; Li, L.; Weinberg, C.R. Phase analysis of circadian-related genes in two tissues. BMC Bioinform. 2006, 7, 87. [Google Scholar] [CrossRef] [PubMed] [Green Version]
- Downs, T.D.; Mardia, K.V. Circular regression. Biometrika 2002, 89, 683–697. [Google Scholar] [CrossRef]
- Jones, M.C. The Möbius distribution on the disc. Ann. Inst. Stat. Math. 2004, 56, 733–742. [Google Scholar] [CrossRef]
- Kato, S.; Jones, M.C. A family of distributions on the circle with links to, and applications arising from, Möbius transformation. J. Am. Stat. Assoc. 2010, 105, 249–262. [Google Scholar] [CrossRef] [Green Version]
- Wang, M.Z.; Shimizu, K. On applying Möbius transformation to cardioid random variables. Stat. Methodol. 2012, 9, 604–614. [Google Scholar] [CrossRef]
- Kato, S.; Pewsey, A. A Möbius transformation-induced distribution on the torus. Biometrika 2015, 102, 359–370. [Google Scholar] [CrossRef]
- Kato, S. A distribution for a pair of unit vectors generated by Brownian motion. Bernoulli 2009, 15, 898–921. [Google Scholar] [CrossRef]
- Kato, S.; McCullagh, P. Some properties of a Cauchy family on the sphere derived from the Möbius transformation. Bernoulli 2020, 26, 3224–3248. [Google Scholar] [CrossRef]
- McCullagh, P. Möbius transformation and Cauchy parameter estimation. Ann. Stat. 1996, 24, 787–808. [Google Scholar] [CrossRef]
- Abe, T.; Pewsey, A. Sine-skewed circular distributions. Stat. Pap. 2011, 52, 683–707. [Google Scholar] [CrossRef]
- Mullen, K.; Ardia, D.; Gil, D.L.; Windover, D.; Cline, J. DEoptim: An R package for global optimization by differential evolution. J. Stat. Softw. 2011, 40, 1–26. [Google Scholar] [CrossRef] [Green Version]
- Storn, R.; Price, K. Differential evolution-a simple and efficient heuristic for global optimization over continuous spaces. J. Glob. Optim. 1997, 11, 341–359. [Google Scholar] [CrossRef]
- Price, K.; Storn, R.M.; Lampinen, J.A. Differential Evolution: A Practical Approach to Global Optimization; Springer: Berlin/Heidelberg, Germany, 2006. [Google Scholar]
- Najibi, S.M.; Maadooliat, M.; Zhou, L.; Huang, J.Z.; Gao, X. Protein structure classification and loop modeling using multiple Ramachandran distributions. Comput. Struct. Biotechnol. J. 2017, 15, 243–254. [Google Scholar] [CrossRef] [PubMed] [Green Version]
- Moghimbeygi, M.; Golalizadeh, M. Spherical logistic distribution. Commun. Math. Stat. 2020, 8, 151–166. [Google Scholar] [CrossRef]
- Martin, A.D.; Quinn, K.M.; Park, J.H.; Park, M.J.H. MCMCpack: Markov Chain Monte Carlo (MCMC) Package; Version 1.5-0; R Package: Vienna, Austria, 2020; Available online: https://cran.r-project.org/web/packages/MCMCpack/index.html (accessed on 25 August 2020).
- Li, L. gibbs.met: Naive Gibbs Sampling with Metropolis Steps; Version 1.1-3; R Package: Vienna, Austria, 2015; Available online: https://cran.r-project.org/web/packages/gibbs.met/index.html (accessed on 25 August 2020).
- Albert, J. LearnBayes: Functions for Learning Bayesian Inference; Version 2.15.1; R Package: Vienna, Austria, 2018; Available online: https://cran.r-project.org/web/packages/LearnBayes/index.html (accessed on 25 August 2020).
- Chivers, C.; Chivers, M.C. MHadaptive: General Markov Chain Monte Carlo for Bayesian Inference Using Adaptive Metropolis-Hastings Sampling; Version 1.1-8; R Package: Vienna, Austria, 2015; Available online: https://cran.r-project.org/web/packages/MHadaptive/index.html (accessed on 25 August 2020).
- Fernández-i-Marın, X. ggmcmc: Analysis of MCMC samples and Bayesian inference. J. Stat. Softw. 2016, 70, 1–20. [Google Scholar] [CrossRef] [Green Version]
- Mersmann, O. Microbenchmark: Accurate Timing Functions; Version 1.4-7; R Package: Vienna, Austria, 2019; Available online: https://www.rdocumentation.org/packages/microbenchmark/versions/1.4-7/topics/microbenchmark (accessed on 25 August 2020).






| Model | Log-Likelihood | AIC | BIC | |||||||||||
|---|---|---|---|---|---|---|---|---|---|---|---|---|---|---|
| Sine | – | 25.2085 | 0.3679 | 7.3700 | – | – | 1.8976 | 2.4624 | – | – | – | 31,790.16 | 31,827.74 | |
| [13] | ||||||||||||||
| Sine-skewed sine | – | 18.8058 | 0.0852 | 4.8449 | – | – | 1.8701 | 0.4051 | – | 36,193.42 | 36,244.02 | |||
| [24] | ||||||||||||||
| Mixture of sine | – | 4.9938 | 0.4603 | 2.3512 | – | – | 2.0560 | 2.5011 | – | – | 0.3476 | |||
| 31,460.22 | 31,540.04 | |||||||||||||
| – | 0.0217 | 0.0413 | – | – | 1.0912 | – | – | 0.6524 | ||||||
| Cosine | – | 11.6274 | 0.6507 | – | – | 1.8807 | – | – | – | 39,848.07 | 39,884.22 | |||
| [14] | ||||||||||||||
| Sine-skewed cosine | – | 11.6274 | 0.6507 | – | – | 1.8807 | 0.0789 | – | 39,852.07 | 39,902.68 | ||||
| [24] | ||||||||||||||
| Mixture of cosine | – | 9.6015 | 2.6459 | 0.0087 | – | – | 1.7967 | 0.8676 | – | – | 0.5266 | |||
| [14] | 36,262.18 | 36,341.70 | ||||||||||||
| – | 8.4761 | 0.0820 | 2.3228 | – | – | 2.1309 | 0.9647 | – | – | 0.4734 | ||||
| Mixture of bivariate | – | – | – | 0.9551 | 0.5649 | 1.6129 | 1.5337 | – | – | 0.4463 | ||||
| wrapped Cauchy | 34,220.72 | 34,300.24 | ||||||||||||
| [33] | – | – | – | 0.8513 | 0.5433 | 2.1128 | – | – | 0.5537 | |||||
| Transformed sine | – | 2.1585 | 0.3489 | 3.1712 | 0.6036 | 0.0131 | 1.8573 | 2.4321 | – | – | – | −15,558.98 | 31,131.97 | 31,182.56 |
| Sine-skewed transformed sine | – | 2.1582 | 0.3487 | 3.1712 | 0.6037 | 0.0131 | 1.8573 | 2.4321 | – | 31,135.97 | 31,201.02 | |||
| Transformed cosine | – | 4.5122 | 2.7905 | 0.2632 | 0.4164 | 1.8806 | – | – | – | 33,854.86 | 33,905.46 | |||
| Sine-skewed transformed cosine | – | 4.4704 | 2.8185 | 0.2656 | 0.4228 | 1.8805 | -0.6871 | 0.6225 | – | 33,858.86 | 33,923.92 |
| Model | Log-Likelihood | AIC | BIC | |||||||||||
|---|---|---|---|---|---|---|---|---|---|---|---|---|---|---|
| Sine | – | 27.0312 | 0.3243 | 8.0789 | – | – | 1.8810 | 2.4618 | – | – | – | 13,950.18 | 13,982.36 | |
| [13] | ||||||||||||||
| Sine-skewed sine | – | 26.8304 | 0.3224 | 8.0732 | – | – | 1.8960 | 2.4724 | – | 13,896.62 | 13,941.67 | |||
| [24] | ||||||||||||||
| Mixture of sine | – | 7.3842 | 2.0013 | – | – | 2.0918 | – | – | 0.6632 | |||||
| 13,901.15 | 13,879.61 | |||||||||||||
| – | 2.8774 | 0.0347 | – | – | 1.9306 | – | – | 0.3368 | ||||||
| Cosine | – | 11.5883 | 0.6404 | – | – | 1.8537 | – | – | – | 18,067.45 | 18,099.62 | |||
| [14] | ||||||||||||||
| Sine-skewed cosine | – | 11.5883 | 0.6404 | – | – | 1.8537 | – | 18,071.45 | 18,116.49 | |||||
| [24] | ||||||||||||||
| Mixture of cosine | – | 29.9375 | 1.9210 | 0.0213 | – | – | 1.6840 | 0.8043 | – | – | 0.5648 | |||
| [14] | 13,941.52 | 14,012.31 | ||||||||||||
| – | 17.3302 | 0.0211 | 1.9456 | – | – | 2.0575 | 0.8866 | – | – | 0.4352 | ||||
| Mixture of bivariate | – | – | – | 0.9169 | 0.5546 | 1.5969 | 1.1037 | – | – | 0.4712 | ||||
| wrapped Cauchy | 14,297.04 | 14,367.83 | ||||||||||||
| [33] | – | – | – | 0.8388 | 0.5100 | 1.9792 | – | – | 0.5288 | |||||
| Transformed sine | – | 3.8755 | 0.3414 | 3.6786 | 0.4950 | 1.8589 | 2.4490 | – | – | – | −6905.08 | 13,824.17 | 13,869.22 | |
| Sine-skewed transformed sine | – | 3.8764 | 0.3415 | 3.7066 | 0.4883 | 1.8591 | 2.4491 | 0.0796 | – | 13,828.17 | 13,886.08 | |||
| Transformed cosine | – | 4.1351 | 2.8283 | 0.2884 | 0.4183 | 1.8604 | – | – | – | 15,148.56 | 15,193.61 | |||
| Sine-skewed transformed cosine | – | 4.1350 | 2.8283 | 0.2884 | 0.4183 | 1.8604 | 0.6868 | – | 15,152.56 | 15,210.46 |
| Model | Log-Likelihood | AIC | BIC | |||||||||
|---|---|---|---|---|---|---|---|---|---|---|---|---|
| Mixture of sine | – | 4.4364 | 7.6222 | – | – | 2.3336 | 0.6239 | |||||
| 9824.25 | 9889.04 | |||||||||||
| – | 5.4606 | 7.7290 | – | – | 0.3761 | |||||||
| Mixture of cosine | – | 4.2849 | 6.1824 | – | – | 0.3787 | ||||||
| [14] | 10,032.03 | 10,096.82 | ||||||||||
| – | 4.6268 | 7.8256 | – | – | 2.3358 | 0.6213 | ||||||
| Mixture of bivariate | – | – | – | 0.8545 | 0.8118 | 0.3108 | ||||||
| wrapped Cauchy | 10,588.85 | 10,653.64 | ||||||||||
| [33] | – | – | – | 0.7038 | 0.7778 | 2.3037 | 0.6892 | |||||
| Mixture of transformed sine | – | 2.8274 | 7.3718 | 0.2930 | 0.0872 | 0.3515 | ||||||
| 9683.61 | 9771.96 | |||||||||||
| – | 4.0949 | 1.6545 | 0.02450 | 0.4387 | 2.3495 | 0.6485 | ||||||
| Mixture of transformed cosine | – | 2.3349 | 9.3385 | 0.0063 | 0.4909 | 0.1287 | 0.2645 | |||||
| 9794.28 | 9882.64 | |||||||||||
| – | 3.9496 | 0.0117 | 0.8886 | 0.0553 | 0.8668 | 2.3841 | 0.7355 |
| Method | Distribution | n | ||||||||
|---|---|---|---|---|---|---|---|---|---|---|
| MLE | 1.8450 | 0.2876 | 2.8360 | 0.6001 | 0.0063 | 1.7744 | 2.6177 | |||
| Bias | 0.1185 | |||||||||
| MSE | 0.0879 | 0.0921 | 0.1864 | 0.0083 | 0.0044 | 0.0087 | 0.0344 | |||
| Transformed sine | ||||||||||
| MLE | 2.1311 | 0.2649 | 3.1546 | 0.6243 | 0.0395 | 1.8491 | 2.4263 | |||
| Bias | 0.0142 | 0.0130 | ||||||||
| MSE | 0.0527 | 0.0588 | 0.0002 | 0.0018 | 0.0008 | 0.0005 | ||||
| MCMCmetrop1R | ||||||||||
| MLE | 3.7753 | 0.5985 | 1.5693 | 0.2564 | 0.4660 | 1.0937 | ||||
| Bias | 0.0143 | 0.0957 | 0.0421 | |||||||
| MSE | 0.0998 | 0.0932 | 0.1007 | 0.0028 | 0.0116 | 0.0135 | 0.0275 | |||
| Transformed cosine | ||||||||||
| MLE | 4.0693 | 0.6305 | 1.8210 | 0.2546 | 0.5557 | 1.0116 | ||||
| Bias | 0.0758 | 0.0305 | 0.0241 | 0.0329 | 0.0037 | 0.0238 | ||||
| MSE | 0.0065 | 0.0426 | 0.0085 | 0.0007 | 0.0014 | 0.0007 | 0.0011 | |||
| MLE | 1.8186 | 0.2260 | 3.2619 | 0.6444 | 0.0359 | 1.8815 | 2.6027 | |||
| Bias | 0.3837 | 0.0398 | 0.0205 | 0.0370 | 0.1006 | |||||
| MSE | 0.1094 | 0.0350 | 0.0726 | 0.0016 | 0.0406 | 0.0022 | 0.0291 | |||
| Transformed sine | ||||||||||
| MLE | 1.9735 | 0.3887 | 3.1546 | 0.6204 | 0.0159 | 1.8701 | 2.4270 | |||
| Bias | 0.0979 | 0.0360 | 0.0131 | 0.0046 | 0.0129 | |||||
| MSE | 0.0340 | 0.0482 | 0.0003 | 0.0004 | 0.0001 | 0.0005 | ||||
| rwmetrop | ||||||||||
| MLE | 3.8086 | 0.5397 | 1.4956 | 0.1726 | 0.5929 | 1.0417 | ||||
| Bias | 0.0883 | 0.0524 | ||||||||
| MSE | 0.0902 | 0.0893 | 0.1003 | 0.0033 | 0.0088 | 0.0009 | 0.0037 | |||
| Transformed cosine | ||||||||||
| MLE | 3.9139 | 0.7320 | 1.8188 | 0.2546 | 0.4667 | 0.9962 | ||||
| Bias | 0.0703 | 0.0241 | 0.0084 | |||||||
| MSE | 0.0056 | 0.0674 | 0.0007 | 0.0013 | 0.0014 | 0.0007 | 0.0018 | |||
| MLE | 2.5400 | 0.4480 | 3.1322 | 0.6963 | 0.1087 | 1.8321 | 2.3133 | |||
| Bias | 0.3469 | 0.0904 | 0.0837 | 0.0916 | ||||||
| MSE | 0.1773 | 0.0583 | 0.0117 | 0.0092 | 0.0091 | 0.0009 | 0.0141 | |||
| Transformed sine | ||||||||||
| MLE | 1.9022 | 0.2894 | 3.3403 | 0.6649 | 0.0016 | 1.8619 | 2.3822 | |||
| Bias | 0.1137 | 0.0607 | 0.0042 | |||||||
| MSE | 0.1268 | 0.0042 | 0.0286 | 0.0043 | 0.0025 | 0.0024 | ||||
| met_gaussian | ||||||||||
| MLE | 3.4389 | 0.5409 | 1.4373 | 0.2530 | 0.5214 | 1.0526 | ||||
| Bias | 0.0143 | 0.0113 | 0.0210 | 0.0623 | ||||||
| MSE | 0.1927 | 0.0993 | 0.1251 | 0.0853 | 0.0082 | 0.0005 | 0.0041 | |||
| Transformed cosine | ||||||||||
| MLE | 3.6491 | 0.5341 | 1.6260 | 0.2420 | 0.5134 | 1.0158 | ||||
| Bias | 0.0195 | 0.0027 | 0.0126 | |||||||
| MSE | 0.1214 | 0.0915 | 0.0875 | 0.0019 | 0.0032 | 0.0005 | 0.0024 | |||
| MLE | 2.1465 | 0.2728 | 2.6713 | 0.6912 | 0.0010 | 1.8107 | 2.2024 | |||
| Bias | 0.0856 | |||||||||
| MSE | 0.0434 | 0.0883 | 0.2498 | 0.0073 | 0.0059 | 0.0046 | 0.0527 | |||
| Transformed sine | ||||||||||
| MLE | 2.1657 | 0.2743 | 3.2124 | 0.5813 | 0.0762 | 1.8487 | 2.4826 | |||
| Bias | 0.0362 | 0.0433 | 0.0531 | 0.0404 | ||||||
| MSE | 0.0246 | 0.0556 | 0.0027 | 0.0011 | 0.0039 | 0.0025 | ||||
| Metro_Hastings | ||||||||||
| MLE | 3.8290 | 0.5903 | 2.0419 | 0.2857 | 0.5753 | 0.8373 | ||||
| Bias | 0.2407 | 0.0577 | 0.0709 | 0.0172 | ||||||
| MSE | 0.1998 | 0.0944 | 0.1208 | 0.0061 | 0.0059 | 0.0006 | 0.0266 | |||
| Transformed cosine | ||||||||||
| MLE | 3.8936 | 0.6747 | 1.5822 | 0.2775 | 0.4859 | 0.9935 | ||||
| Bias | 0.0298 | 0.0470 | 0.0057 | |||||||
| MSE | 0.0091 | 0.0847 | 0.0829 | 0.0030 | 0.0003 | 0.0002 | 0.0051 | |||
| MLE | 2.2340 | 0.2728 | 2.8277 | 0.6198 | 0.1398 | 1.8437 | 2.1688 | |||
| Bias | 0.0712 | 0.0143 | 0.1220 | |||||||
| MSE | 0.1171 | 0.0583 | 0.1179 | 0.0092 | 0.0160 | 0.0003 | 0.0692 | |||
| Transformed sine | ||||||||||
| MLE | 2.1901 | 0.3555 | 3.1760 | 0.6016 | 0.0156 | 1.8573 | 2.4342 | |||
| Bias | 0.0315 | 0.0066 | 0.0048 | 0.0024 | 0.0021 | |||||
| MSE | 0.0963 | 0.0221 | 0.0464 | 0.0008 | 0.0003 | 0.0018 | ||||
| gibbs_met | ||||||||||
| MLE | 3.6123 | 0.5732 | 1.5193 | 0.2006 | 0.5852 | 0.8808 | ||||
| Bias | 0.0869 | |||||||||
| MSE | 0.1419 | 0.0893 | 0.1067 | 0.0082 | 0.0087 | 0.0005 | 0.0187 | |||
| Transformed cosine | ||||||||||
| MLE | 3.6322 | 0.5978 | 1.7613 | 0.2626 | 0.5793 | 0.9668 | ||||
| Bias | 0.0221 | 0.0648 | ||||||||
| MSE | 0.0915 | 0.0726 | 0.0008 | 0.0031 | 0.0074 | 0.0002 | 0.0046 |
Publisher’s Note: MDPI stays neutral with regard to jurisdictional claims in published maps and institutional affiliations. |
© 2021 by the authors. Licensee MDPI, Basel, Switzerland. This article is an open access article distributed under the terms and conditions of the Creative Commons Attribution (CC BY) license (https://creativecommons.org/licenses/by/4.0/).
Share and Cite
Arashi, M.; Nakhaei Rad, N.; Bekker, A.; Schubert, W.-D. Möbius Transformation-Induced Distributions Provide Better Modelling for Protein Architecture. Mathematics 2021, 9, 2749. https://doi.org/10.3390/math9212749
Arashi M, Nakhaei Rad N, Bekker A, Schubert W-D. Möbius Transformation-Induced Distributions Provide Better Modelling for Protein Architecture. Mathematics. 2021; 9(21):2749. https://doi.org/10.3390/math9212749
Chicago/Turabian StyleArashi, Mohammad, Najmeh Nakhaei Rad, Andriette Bekker, and Wolf-Dieter Schubert. 2021. "Möbius Transformation-Induced Distributions Provide Better Modelling for Protein Architecture" Mathematics 9, no. 21: 2749. https://doi.org/10.3390/math9212749
APA StyleArashi, M., Nakhaei Rad, N., Bekker, A., & Schubert, W.-D. (2021). Möbius Transformation-Induced Distributions Provide Better Modelling for Protein Architecture. Mathematics, 9(21), 2749. https://doi.org/10.3390/math9212749


