Abstract
Alzheimer’s disease (AD) is a leading health concern affecting the elderly population worldwide. It is defined by amyloid plaques, neurofibrillary tangles, and neuronal loss. Neuroimaging modalities such as positron emission tomography (PET) and magnetic resonance imaging are routinely used in clinical settings to monitor the alterations in the brain during the course of progression of AD. Deep learning techniques such as convolutional neural networks (CNNs) have found numerous applications in healthcare and other technologies. Together with neuroimaging modalities, they can be deployed in clinical settings to learn effective representations of data for different tasks such as classification, segmentation, detection, etc. Image filtering methods are instrumental in making images viable for image processing operations and have found numerous applications in image-processing-related tasks. In this work, we deployed 3D-CNNs to learn effective representations of PET modality data to quantify the impact of different image filtering approaches. We used box filtering, median filtering, Gaussian filtering, and modified Gaussian filtering approaches to preprocess the images and use them for classification using 3D-CNN architecture. Our findings suggest that these approaches are nearly equivalent and have no distinct advantage over one another. For the multiclass classification task between normal control (NC), mild cognitive impairment (MCI), and AD classes, the 3D-CNN architecture trained using Gaussian-filtered data performed the best. For binary classification between NC and MCI classes, the 3D-CNN architecture trained using median-filtered data performed the best, while, for binary classification between AD and MCI classes, the 3D-CNN architecture trained using modified Gaussian-filtered data performed the best. Finally, for binary classification between AD and NC classes, the 3D-CNN architecture trained using box-filtered data performed the best.
1. Introduction
Alzheimer’s disease (AD) is a brain disorder that has no effective treatment [,]. AD affects brain regions such as the hippocampus, gyrus, etc., during the course of its progression [,]. Deposition of amyloid-β plaques and tau concentrates is likely the first stage in the development of AD. In addition, neurodegeneration, associated with brain atrophy and hypometabolism, affects cognition [,]. Due to the extreme and progressive pathological changes, mild cognitive impairment (MCI), which is a prodromal stage and an important clinical group of AD and advanced AD stages, is highly correlated [,,,]. Predictors of progression from MCI to AD include hippocampal volume, APOE ε4 alleles, memory, language, executive function, and other factors [].
Neuroimaging modalities such as positron emission tomography (PET) can be used to visualize amyloid-β and tau plaques, while structural magnetic resonance imaging (MRI) can examine neurodegeneration and macroscopic tissue atrophy [,,]. The structural MRI modality provides structural connectivity information of the brain, while the PET modality provides measures of glucose metabolism, which represents the functional activity of the underlying brain tissue in AD [,,].
Deep learning methods are hallmarks of modern artificial intelligence techniques and have been widely deployed in recent studies in a number of applications such as segmentation, classification, and natural language processing tasks. These methods can learn strong features from the input distribution, forming high-level hierarchical pathways []. There are many desirable properties of these networks that make them useful for different applications such as end-to-end representation and high distinction among classes [].
In the literature, studies have been proposed to integrate features using structured sparse regularization for multiclass classification between cognitively normal (NC), MCI, and AD classes []; single-nucleotide polymorphisms for MCI/AD classification []; and a multitask feature selection method using MRI and PET MCI-converter (MCI-C)/MCI-nonconverter (MCI-NC), AD/NC, and MCI/NC binary classification tasks [].
Furthermore, research has been conducted to propose a deep-learning-based latent feature representation framework with a stacked autoencoder for AD/NC, MCI/NC, AD/MCI, and MCI-C/MCI-NC binary classification tasks []; unsupervised feature learning through a locally linear embedding algorithm to transform multivariate MRI data for MCI-C/MCI-NC, NC/MCI-NC, AD/MCI-NC, NC/MCI-C, AD/MCI-C, and AD/NC binary classification tasks []; a longitudinal measurement framework for MCI-C/MCI-NC binary classification tasks []; and compare gray matter density and volume, cortical thickness, and region-of-interest (ROI)-based volumetric markers for MCI-C/MCI-NC and AD/NC binary classification tasks [].
In addition, research has been conducted to integrate semi-supervised learning for MCI-C/MCI-NC binary classification tasks [] to extract spatially distributed diagnostic biomarkers from structural MR brain images for AD/NC, MCI-C/NC, and MCI-C/MCI-NC binary classification tasks []; utilize intrinsic useful correlation information using multidomain transfer learning frameworks for AD/NC, MCI/NC, and MCI-C/MCI-NC binary classification tasks []; combine features such as hippocampal volume and classify them using machine learning methods such as linear discriminant analysis (LDA) and support vector machine (SVM) classifiers for AD/NC, MCI-C/MCI-NC, and NC/MCI-C binary classification tasks []; utilize a multimodal and multiscale deep-learning-based network for MCI-C/MCI-NC and NC/AD binary classification tasks []; combine MRI, PET, and CSF biomarkers using a kernel combination method for AD/NC and MCI/NC binary classification tasks []; and propose a diagnostic framework with deep learning architecture to fuse multimodal neuroimaging features for AD/NC, MCI/NC binary, and NC/MCI-C/MCI-NC/AD multiclass classification tasks [].
Furthermore, great strides have been taken to propose cascade CNNs to learn multilevel and multimodal features for AD/NC, MCI-C/NC, and MCI-NC/NC binary classification tasks []; capture metabolic activity of the brain through a deep learning framework for AD/NC and MCI-C/MCI-NC binary classification tasks [], using Laplacian eigenmaps for AD/NC, MCI-C/NC, and MCI-NC/NC binary classification tasks []; combine sparse autoencoders and convolutional neural networks for AD/NC/MCI multiclass and AD/NC, MCI/NC, and AD/MCI binary classification tasks []; and propose an interpretation system using fluorodeoxyglucose and florbetapir PET modalities for AD/NC and MCI-C/MCI-NC binary classification tasks [].
Finally, another avenue that has been explored is utilizing graph theory and machine learning for MCI-C/MCI-NC binary classification tasks [] to propose a multivariate prognostic model for MCI-C/MCI-NC binary classification tasks []; propose a high-order, multimodal, multimask feature-learning model for deciphering the temporal relationship between longitudinal measures and progressive cognitive scores [] for the integration of SPARE-AD and cerebrospinal fluid (CSF) values for MCI-C/MCI-NC binary classification tasks []; build a combination of independent component analysis (ICA) and Cox models to predict MCI progression []; propose a framework for the integration of MRI and PET modalities for binary classification tasks such as AD/NC, MCI-C/MCI-NC, NC/MCI-C, NC/MCI, etc. []; propose an approach for building a robust classifier for AD/NC and NC/MCI binary classification tasks []; employ sparse logistic regression for MCI-C/MCI-NC binary classification tasks []; and utilize multimodality image data for diagnosis and prognosis of AD at the MCI or preclinical stages [], as well as a demographic-adjusted multivariable Cox model for MCI to AD conversion [].
Image filtering methods are commonly deployed in different applications to modify an image. These methods alter the appearance and properties of an image to emphasize or remove certain features. They have found numerous applications in smoothing, sharpening, and edge enhancement. Box filtering, median filtering, Gaussian filtering, and their modifications have found a number of applications in the domain of image processing. Median filtering uses neighborhood operations to remove noise, as well as fine image details using maximum-likelihood-based operations. Gaussian filtering introduces blurring to an image in an asymmetric fashion, ignoring image brightness and helping in smoothing the images significantly by performing nonlinear low-pass filtering. Box filtering, a type of low-pass filter, works by averaging the values in the neighborhood region, and the filter kernel defines the type of filtering in a general fashion for different operations such as smoothing.
In this work, we explored the impact of different image filtering methods such as box filtering, median filtering, Gaussian filtering, and modified Gaussian filtering on the performance of deep convolutional neural networks (CNNs) for the early diagnosis of AD. We deployed 3D-CNN architectures to extract features from the PET neuroimaging modality and classified them into NC, MCI, and AD classes simultaneously and bilaterally. We considered four problems: three-class classification among MCI, NC, and AD classes and binary classifications between MCI and NC, MCI and AD, and NC and AD classes. We did not employ data augmentation for the binary and multiclass classification tasks studied using the PET modality.
2. Datasets Description
We used scans of the PET neuroimaging modality from the Alzheimer’s Disease Neuroimaging Initiative (ADNI) database, as shown in Table 1. The data are presented in mean (min–max) format. We split the datasets at subject level for the experiments.

Table 1.
Demographics of subjects with PET scans presented in mean (min–max) format.
3. Methodology
In this study, we considered four problems: multiclass (three classes) classification between MCI, NC, and AD classes and three-binary classification problems; that is, binary classification between MCI and NC classes, MCI and AD classes, and NC and AD classes. We will now describe the deep learning architectures for solving these problems using the PET dataset.
The detailed 3D-CNN architecture for three binary and one multiclass (3 classes) classification tasks between NC, MCI, and AD classes using the PET neuroimaging modality and box filtering, Gaussian filtering, modified Gaussian filtering, and median filtering approaches is presented in Figure 1, while Figure 2 presents some of the scans used in the experiments. In Figure 2, SSIM is the structural similarity index. Figure 2b–e shows the SSIM index of PET scans from the reference image. Here, modified Gaussian filtering means that Gaussian filtering is applied to the input volume, followed by a second round of Gaussian filtering. Mathematically,
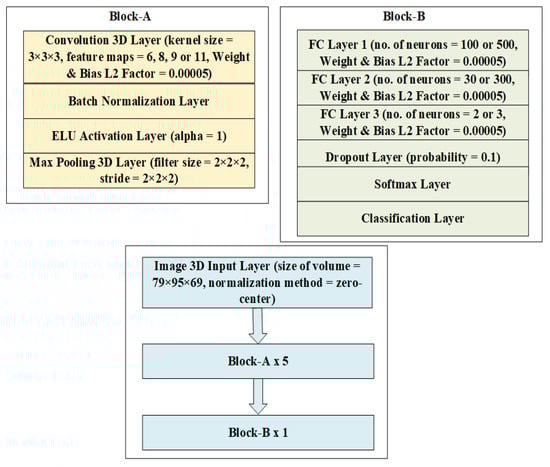
Figure 1.
Three-dimensional (3D)-CNN architecture for processing PET scans for binary and multiclass classification tasks.
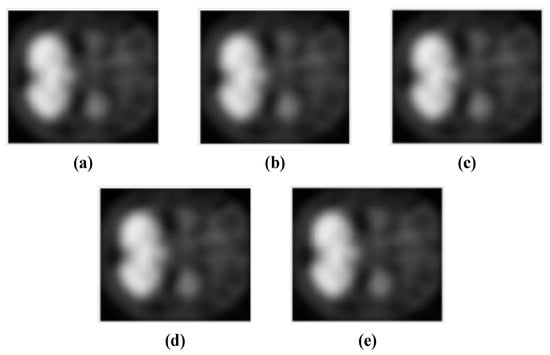
Figure 2.
Filtered images used for simulations in our study for binary and multiclass classification of AD: (a) reference image belonging to AD class without filtering; (b) box-filtered image belonging to AD class with SSIM = 0.9921; (c) modified Gaussian-filtered image belonging to AD class with SSIM = 0.9971; (d) Gaussian-filtered image belonging to AD class with SSIM = 0.9992; (e) median-filtered image belonging to AD class with SSIM = 0.9952.
In Equation (1), N represents the total number of inputs.
For the AD-MCI binary classification task, the number of feature maps in the convolutional feature extracting layers is 8, while the number of neurons is 100, 30, and 2 for Fully Connected (FC) Layer 1, FC Layer 2, and FC Layer 3, respectively. For the AD-NC binary classification task, the number of feature maps in the convolutional feature extracting layers is 6, while the number of neurons is 100, 30, and 2 for FC Layer 1, FC Layer 2, and FC Layer 3, respectively.
For the MCI-NC binary classification task, the number of feature maps in the convolutional feature extracting layers is 9, while the number of neurons is 100, 30, and 2 for FC Layer 1, FC Layer 2, and FC Layer 3, respectively.
For the AD-MCI-NC multiclass classification task, the number of feature maps in the convolutional feature extracting layers is 11, while the number of neurons is 500, 300, and 3 for FC Layer 1, FC Layer 2, and FC Layer 3, respectively.
In the architecture given in Figure 1, there is an input layer accepting a volume of size with zero-center normalization applied to it that works by subtracting the mean and dividing it with the standard deviation to center the data volume on the origin. After that, a block named Block-A is repeated 5 times, and this block is made up of a 3D convolutional layer with a kernel of size 3 in all dimensions. A variable number of feature maps for the extraction of features with a weight and bias L2 factor of 0.00005 is applied to mitigate the impact of overfitting. After the convolutional layer, there is a batch normalization layer, the purpose of which is to normalize the incoming batches through division by standard deviation and subtracting the means, which helps in making the training process faster. After this layer, there is an exponential linear unit (ELU) activation layer with an α value of 1, the purpose of which is to introduce nonlinearity to the output of a neuron. Mathematically,
After this layer, there is a max-pooling layer with a filter and stride size of 2 in all dimensions to reduce the dimensions of feature maps for computational efficiency. Block-A is followed by Block-B, which is repeated a single time and is made up of three fully connected layers with a variable number of neurons for different classification tasks: FC Layer 1, FC Layer 2, and FC Layer 3; a dropout layer with a probability of 0.1; a softmax layer; and, finally, a classification layer. The FC layers offer full connections to the incoming data volumes for feature extraction, and these layers have bias and weight L2 factors of 0.00005 to mitigate the impact of overfitting. The dropout layer works by randomly dropping neurons, and in the process, performs regularization of the inputs, which helps to mitigate overfitting. In this case, a factor of 0.1 or 10% drops 10% neurons from the input. Finally, softmax and classification layers convert a vector of numbers into a vector of probabilities with uniform distribution and classify them into 2 or 3 classes, depending on the task.
4. Experiments and Results
To select an optimum set of hyperparameters for the experiments, we used a five-fold cross-validation approach. In order to test the effectiveness of the model in a real-world scenario, we built an independent test set and never used it for training. This set has 12 NC class instances, 7 MCI class subjects, and 4 instances of the AD class. Different performance metrics such as relative classifier information (RCI), confusion entropy (CEN), index of balanced accuracy (IBA), geometric mean (GM), Matthews correlation coefficient (MCC), sensitivity (SEN), specificity (SPEC), F-measure, precision, and balanced accuracy were chosen to assess the performance of different tasks. Only balanced classes, where training and validation sets have an equal number of samples, were considered for the experiments.
For the experiments, a learning rate of 0.001 was chosen using a piecewise decay policy, and this learning rate was reduced after every 7 epochs. The total number of epochs was set to 35, and the size of the batch was set to 2. Adam [] was chosen as the optimizer, while categorical cross-entropy was chosen as a loss function. Examples were randomized after each epoch. The results of the experiments are presented in Table 2, Table 3, Table 4 and Table 5.
Table 2.
Result of multiclass classification between AD, NC, and MCI classes.
Table 3.
Result of binary classification between AD and MCI classes.
Table 4.
Result of binary classification between AD and NC classes.
Table 5.
Result of binary classification between MCI and NC classes.
In Table 2, it can be seen that the 3D-CNN architecture trained on Gaussian-filtered data performed the best for the multiclass classification task. It is followed by box filtering and modified Gaussian-filtering-based approaches. The worst-performing architecture utilizes median-filtered data. As a matter of fact, considering RCI, average CEN, average IBA, average GM, and average MCC as performance metrics, the worst-performing model is the 3D-CNN architecture trained using median-filtered data. In terms of RCI and average CEN metrics, the best-performing model is the 3D-CNN architecture trained using box-filtered data, while, in terms of average IBA, average GM, and average MCC metrics, the best-performing model is the 3D-CNN architecture trained on Gaussian-filtered data. Figure 3 and Figure 4 display the results and rankings of methods for the multiclass classification task.
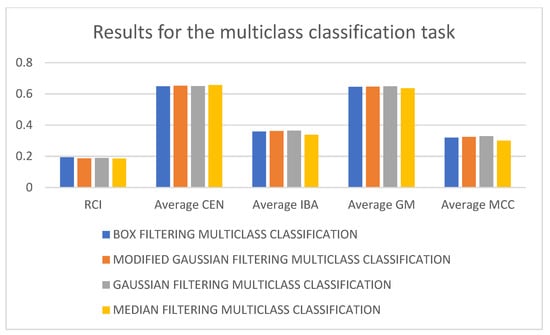
Figure 3.
Results of different 3D-CNN architectures for the multiclass classification task.
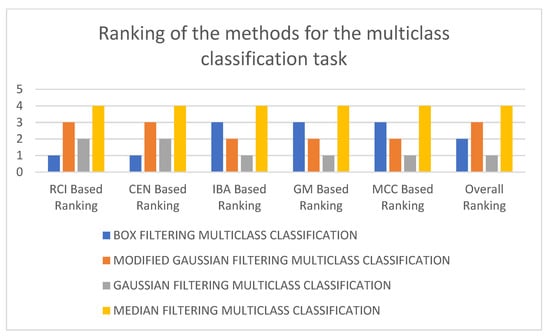
Figure 4.
Rankings of different 3D-CNN architectures for the multiclass classification task.
In Table 3, it can be seen that the 3D-CNN architecture trained using modified Gaussian-filtered data performed the best for the AD-MCI binary classification task. It is followed by the 3D-CNN architecture trained using Gaussian-filtered and 3D-CNN architecture trained using median-filtered data. The worst-performing model is the 3D-CNN architecture trained using box-filtered data. It can also be observed that, in terms of the SEN metric, the best-performing model is the 3D-CNN architecture trained on median-filtered data. In terms of SPEC, F-measure, precision, and balanced accuracy, the best-performing model is the 3D-CNN architecture trained on modified Gaussian-filtered data. Figure 5 and Figure 6 display the results and rankings of methods for the AD-MCI binary classification task.
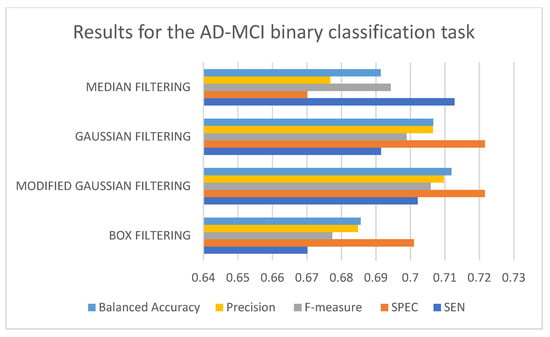
Figure 5.
Results of different 3D-CNN architectures for the AD-MCI binary classification task.
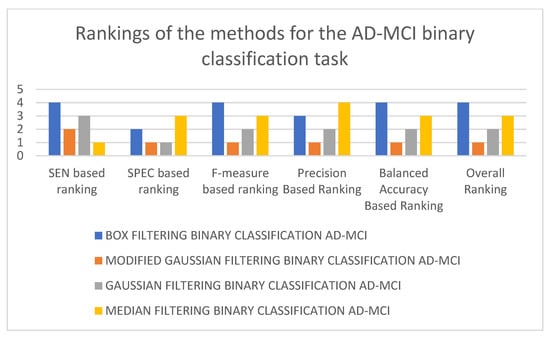
Figure 6.
Rankings of different 3D-CNN architectures for the AD-MCI binary classification task.
In Table 4, it can be seen that the 3D-CNN architecture trained using box-filtered data performed the best for the AD-NC binary classification task. It is followed by the 3D-CNN architectures trained on median-filtered and modified Gaussian-filtered data. The worst-performing model is the 3D-CNN architecture trained on Gaussian-filtered data. In terms of SEN, F-measure, and balanced accuracy, the worst-performing model is the 3D-CNN architecture trained on Gaussian-filtered data. In terms of SPEC and precision, the worst-performing model is the 3D-CNN architecture trained using modified Gaussian-filtered data. Figure 7 and Figure 8 display the results and rankings of methods for the AD-NC binary classification task.
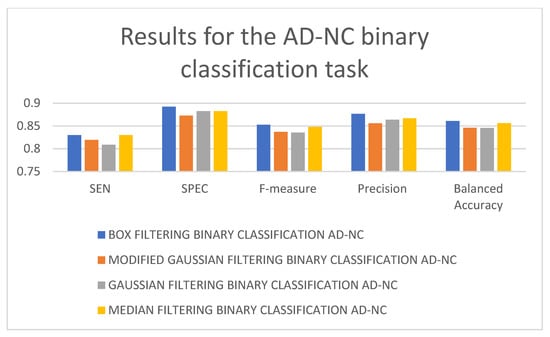
Figure 7.
Results of different 3D-CNN architectures for the AD-NC binary classification task.
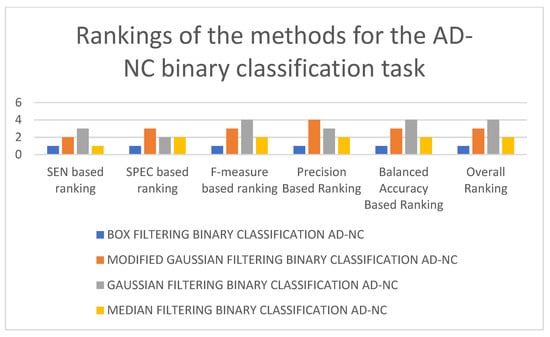
Figure 8.
Rankings of different 3D-CNN architectures for the AD-NC binary classification task.
In Table 5, it can be seen that the best-performing model is the 3D-CNN architecture trained on median-filtered data for the NC-MCI binary classification task. It is followed by the 3D-CNN architectures trained on modified Gaussian-filtered and Gaussian-filtered data. The 3D-CNN architecture trained using box-filtered data performed the worst. In terms of balanced accuracy, F-measure, and SEN, the best-performing model is the 3D-CNN architecture trained on median-filtered data, while in terms of SPEC and precision, the best-performing model is the 3D-CNN architecture trained on modified Gaussian-filtered data. The worst-performing model, in terms of SEN and F-measure, is the 3D-CNN architecture trained on modified Gaussian-filtered data. Figure 9 and Figure 10 display the results and rankings of methods for the MCI-NC binary classification task.
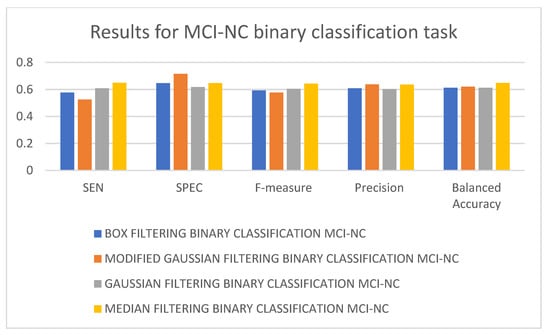
Figure 9.
Results of different 3D-CNN architectures for the MCI-NC binary classification task.
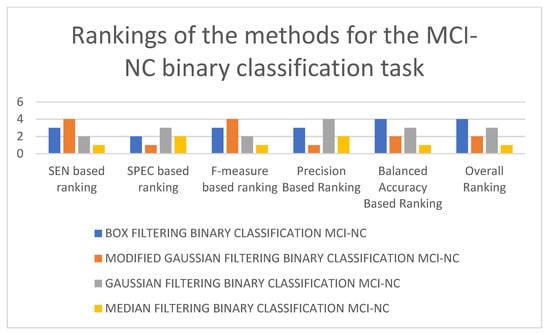
Figure 10.
Rankings of different 3D-CNN architectures for the MCI-NC binary classification task.
5. Discussion
Whole-brain-based methods such as those used in this study are most advantageous in advanced stages of the disease when AD-related brain changes have spread to affect cognitive functions such as daily living activities. This is also confirmed in our study, since performance on the MCI-NC binary classification task is not as good as on the AD-NC or MCI-AD binary classification task. Whole-brain-based methods may be helpful in capturing changes in brain regions that are otherwise nondetectable with other approaches such as region-of-interest-based approaches. Regions such as the medial temporal lobe, cingulate gyrus, frontal gyrus, fusiform gyrus, thalamus, and occipital cortices play a pivotal role in changes associated with AD and can be captured using whole-brain approaches effectively, which can be instrumental in preclinical studies [,,,,,,].
Despite using a deeper architecture for the MCI-NC binary classification task in comparison with the other two binary classification tasks AD-NC and AD-MCI, the performance of the compared filtering approaches is not as good due to the reasons mentioned above. For the multiclass classification task, we used a much deeper architecture in comparison with the architectures used in the other classification tasks; however, the performance on this task is the worst of all four tasks. This could be explained by the fact that adding more classes mostly results in deteriorating performances for classification-based studies if the samples are not increased appropriately. Performance on the AD-NC binary classification task is the best, despite using the shallowest architecture of all, which is, again, due to the fact that AD-related brain changes are easily identified at this level of discrimination. The performance on the AD-MCI binary classification task is in between the AD-NC and NC-MCI binary classification tasks, which could be explained by slightly more advanced changes at this stage in the brain. Perhaps the consideration of region-of-interest-based approaches could be beneficial for the MCI-NC binary and AD-MCI-NC multiclass classification tasks.
There are many limitations of this work, such as lack of utilization of multimodal information. This information includes neuropsychological and clinical data such as age, FAQ and NPI-Q scores, etc. Consideration of this information will likely increase the performance of classifiers further. Another limitation is generalization issues due to age in order of AD, MCI, and NC stages, since changes in the brain at the AD stage are more pronounced, followed by changes in the MCI and NC stages, respectively.
We did not consider longitudinal data in this study, which will likely increase the performance of classifiers further in comparison with cross-sectional data by learning better representation and encoding for individual subjects. MCI subjects could potentially benefit from such data, as MCI lies in continuum between NC and AD for a span of approximately 36 months and has many possible time points within this span. Finally, a comparison of our best methods with the other methods reported in the literature is given in Table 6.
Table 6.
Comparison with the state of- the art.
6. Conclusions
In this work, we presented a deep learning approach to quantify the impact of different image filtering techniques on the early diagnosis of AD. Box filtering, median filtering, Gaussian filtering, and modified Gaussian filtering approaches are studied, and their impacts on the early diagnosis of AD are explored. The obtained results clearly show that no scheme has superiority over another. As a matter of fact, all four schemes performed optimally on different binary and multiclass classification problems. The Gaussian-filtered image is more structurally similar to the reference image. It is followed by the modified Gaussian-filtered, then median-filtered, and, finally, box-filtered image. The Modified Gaussian filtering approach is unique and has been used for the first time in the literature. Its performance is found to be better among other filtering approaches, and an interesting observation is that it never performed the worst in any of the classification tasks considered in this study. This study can be extended further by considering other deep learning approaches such as graph convolutional networks, as well as filtering methods such as those based on deep learning [] (see also []).
Author Contributions
Conceptualization, A.B.T.; methodology, A.B.T.; software, A.B.T.; validation, R.K. and A.B.T.; formal analysis, A.U.R.; investigation, M.K.A.K.; resources, Y.-K.M.; data curation, A.B.T.; writing—original draft preparation, A.B.T.; writing—review and editing, A.B.T., Y.-K.M. and O.C.; visualization, O.C.; supervision, Y.-K.M. and O.C.; project administration, Y.-K.M., O.C. and M.K.A.K.; funding acquisition, Y.-K.M. and M.K.A.K. All authors have read and agreed to the published version of the manuscript.
Funding
This research received no external funding.
Institutional Review Board Statement
Not applicable.
Informed Consent Statement
Not applicable.
Data Availability Statement
Data are publicly available at http://adni.loni.usc.edu (accessed on 15 August 2021).
Conflicts of Interest
The authors declare no conflict of interest.
References
- Liu, F.; Wee, C.-Y.; Chen, H.; Shen, D. Inter-Modality Relationship Constrained Multi-modality Multi-Task Feature Selection for Alzheimer’s Disease and Mild Cognitive Impairment Identification. Neuroimage 2014, 84, 466–475. [Google Scholar] [CrossRef] [Green Version]
- Bruna, J.; Mallat, S. Invariant Scattering Convolution Networks. Comput. Vis. Pattern Recognit. 2012, 35, 1872–1886. [Google Scholar] [CrossRef] [PubMed] [Green Version]
- Schuff, N.; Woerner, N.; Boreta, L.; Kornfield, T.; Shaw, L.M.; Trojanowski, J.Q.; Thompson, P.M.; Jack, C.R.; Weiner, M.W. MRI of hippocampal volume loss in early Alzheimer’s disease in relation to ApoE genotype and biomarkers. Brain 2009, 132, 1067–1077. [Google Scholar] [CrossRef] [PubMed] [Green Version]
- Wang, H.; Nie, F.; Huang, H.; Kim, S.; Nho, K.; Risacher, S.L.; Saykin, A.J.; Shen, L. Identifying quantitative trait loci via group-sparse multitask regression and feature selection: An imaging genetics study of the ADNI cohort. Bioinformatics 2012, 28, 229–237. [Google Scholar] [CrossRef] [Green Version]
- Moradi, E.; Pepe, A.; Gaser, C.; Huttunen, H.; Tohka, J. Machine learning framework for early MRI-based Alzheimer’s conversion prediction in MCI subjects. Neuroimage 2015, 104, 398–412. [Google Scholar] [CrossRef] [Green Version]
- Jagust, W. Imaging the evolution and pathophysiology of Alzheimer disease. Nat. Rev. Neurosci. 2018, 19, 687–700. [Google Scholar] [CrossRef] [PubMed]
- Cheng, B.; Liu, M.; Shen, D.; Li, Z.; Zhang, D.; the Alzheimer’s Disease Neuroimaging Initiative. Multi-Domain Transfer Learning for Early Diagnosis of Alzheimer’s Disease. Neuroinformatics 2017, 15, 115–132. [Google Scholar] [CrossRef] [Green Version]
- Ye, J.; Farnum, M.; Yang, E.; Verbeeck, R.; Lobanov, V.; Raghavan, N.; Novak, G.; Dibernardo, A.; Narayan, V.A. Sparse learning and stability selection for predicting MCI to AD conversion using baseline ADNI data. BMC Neurol. 2012, 12, 46. [Google Scholar] [CrossRef] [Green Version]
- Wolz, R.; Julkunen, V.; Koikkalainen, J.; Niskanen, E.; Zhang, D.P.; Rueckert, D.; Soininen, H.; Lötjönen, J.; the Alzheimer’s Disease Neuroimaging Initiative. Multi-Method Analysis of MRI Images in Early Diagnostics of Alzheimer’s Disease. PLoS ONE 2011, 6, e25446. [Google Scholar] [CrossRef] [Green Version]
- Adeli, E.; Thung, K.-H.; An, L.; Wu, G.; Shi, F.; Wang, T.; Shen, D. Semi-Supervised Discriminative Classification Robust to Sample-Outliers and Feature-Noises. IEEE Trans. Pattern Anal. Mach. Intell. 2019, 41, 515–522. [Google Scholar] [CrossRef] [PubMed]
- Matthews, K.A.; Xu, W.; Gaglioti, A.H.; Holt, J.B.; Croft, J.B.; Mack, D.; McGuire, L.C. Racial and ethnic estimates of Alzheimers’ disease and related dementias in the United States (2015–2060) in adults aged 65 years. Alzheimers Dement. 2019, 15, 17–24. [Google Scholar] [CrossRef]
- Suk, H.-I.; Lee, S.-W.; Shen, D.; The Alzheimer’s Disease Neuroimaging Initiative. Latent feature representation with stacked auto-encoder for AD/MCI diagnosis. Brain Struct. Funct. 2015, 220, 841–859. [Google Scholar] [CrossRef] [PubMed]
- Esalvatore, C.; Ecerasa, A.; Battista, P.; Egilardi, M.C.; Equattrone, A.; Ecastiglioni, I. Magnetic resonance imaging biomarkers for the early diagnosis of Alzheimer’s disease: A machine learning approach. Front. Neurosci. 2015, 9, 307. [Google Scholar]
- Zhang, D.; Wang, Y.; Zhou, L.; Yuan, H.; Shen, D. Multimodal Classification of Alzheimer’s Disease and Mild Cognitive Impairment. Neuroimage 2011, 55, 856–867. [Google Scholar] [CrossRef] [Green Version]
- Lu, D.; Initiative, A.D.N.; Popuri, K.; Ding, G.W.; Balachandar, R.; Beg, M.F. Multimodal and Multiscale Deep Neural Networks for the Early Diagnosis of Alzheimer’s Disease using structural MR and FDG-PET images. Sci. Rep. 2018, 8, 5697. [Google Scholar] [CrossRef] [Green Version]
- Arbabshirani, M.R.; Plis, S.; Sui, J.; Calhoun, V.D. Single Subject Prediction of Brain Disorders in Neuroimaging: Promises and Pitfalls. Neuroimage 2017, 145, 137–165. [Google Scholar] [CrossRef] [PubMed] [Green Version]
- Vieira, S.; Pinaya, W.H.L.; Mechelli, A. Using deep learning to investigate the neuroimaging correlates of psychiatric and neurological disorders: Methods and applications. Neurosci. Biobehav. Rev. 2017, 74, 58–75. [Google Scholar] [CrossRef] [Green Version]
- Zeiler, M.D.; Fergus, R. Visualizing and Understanding Convolutional Networks. Comput. Vis. Pattern Recognit. 2013, arXiv:1311.2901v3. [Google Scholar]
- Wang, H.; Nie, F.; Huang, H.; Risacher, S.L.; Saykin, A.J.; Shen, L.; the Alzheimer’s Disease Neuroimaging Initiative. Identifying disease sensitive and quantitative trait relevant biomarkers from multidimensional heterogeneous imaging genetics data via sparse multimodal multitask learning. Bioinformatics 2012, 28, i127–i136. [Google Scholar] [CrossRef] [PubMed]
- Liu, X.; Tosun, D.; Weiner, M.W.; Schuff, N. Locally Linear Embedding (LLE) for MRI based Alzheimer’s Disease Classification. Neuroimage 2013, 83, 148–157. [Google Scholar] [CrossRef] [PubMed] [Green Version]
- Huang, M.; Initiative, T.A.D.N.; Yang, W.; Feng, Q.; Chen, W.; Weiner, M.W. Longitudinal measurement and hierarchical classification framework for the prediction of Alzheimer’s disease. Sci. Rep. 2017, 7, 39880. [Google Scholar] [CrossRef] [Green Version]
- Risacher, S.L.; Shen, L.; West, J.D.; Kim, S.; McDonald, B.C.; Beckett, L.A.; Harvey, D.J.; Jack, C.R.; Weiner, M.W.; Saykin, A.J. Longitudinal MRI atrophy biomarkers: Relationship to conversion in the ADNI cohort. Neurobiol. Aging 2010, 31, 1401–1418. [Google Scholar] [CrossRef] [Green Version]
- Liu, S.; Liu, S.; Cai, W.; Che, H.; Pujol, S.; Kikinis, R.; Feng, D.; Fulham, M.J. Multi-Modal Neuroimaging Feature Learning for Multi-Class Diagnosis of Alzheimer’s Disease. IEEE Trans. Biomed. Eng. 2015, 62, 1132–1140. [Google Scholar] [CrossRef] [PubMed] [Green Version]
- Liu, M.; Cheng, D.; Wang, K.; Wang, Y.; the Alzheimer’s Disease Neuroimaging Initiative. Multi-Modality Cascaded Convolutional Neural Networks for Alzheimer’s Disease Diagnosis. Neuroinformatics 2018, 16, 295–308. [Google Scholar] [CrossRef] [PubMed]
- Lu, D.; Popuri, K.; Ding, G.W.; Balachandar, R.; Beg, M.F. Multiscale deep neural network based analysis of FDG-PET images for the early diagnosis of Alzheimer’s disease. Med Image Anal. 2018, 46, 26–34. [Google Scholar] [CrossRef]
- Wolz, R.; Aljabar, P.; Hajnal, J.V.; Lötjönen, J.; Rueckert, D. Nonlinear dimensionality reduction combining MR imaging with non-imaging information. Med. Image Anal. 2012, 16, 819–830. [Google Scholar] [CrossRef]
- Payan, A.; Montana, G. Predicting Alzheimer’s disease: A neuroimaging study with 3D convolutional neural networks. arXiv 2015, arXiv:1502.02506v1. [Google Scholar]
- Choi, H.; Jin, K.H. Predicting cognitive decline with deep learning of brain metabolism and amyloid imaging. Behav. Brain Res. 2018, 344, 103–109. [Google Scholar] [CrossRef] [Green Version]
- Hojjati, S.H.; Ebrahimzadeh, A.; Khazaee, A.; Babajani-Feremi, A. Predicting conversion from MCI to AD using resting-state fMRI, graph theoretical approach and SVM. J. Neurosci. Methods 2017, 282, 69–80. [Google Scholar] [CrossRef] [Green Version]
- Korolev, I.O.; Symonds, L.L.; Bozoki, A.C. Predicting Progression from Mild Cognitive Impairment to Alzheimer’s Dementia Using Clinical, MRI, and Plasma Biomarkers via Probabilistic Pattern Classification. PLoS ONE 2016, 11, e0138866. [Google Scholar] [CrossRef] [Green Version]
- Lu, L.; Wang, H.; Yao, X.; Risacher, S.; Saykin, A.; Shen, L. Predicting progressions of cognitive outcomes via high-order multi-modal multi-task feature learning. In Proceedings of the 2018 IEEE 15th International Symposium on Biomedical Imaging (ISBI 2018), Washington, DC, USA, 4–7 April 2018. [Google Scholar]
- Davatzikos, C.; Bhatt, P.; Shaw, L.M.; Batmanghelich, K.N.; Trojanowski, J.Q. Prediction of mci to ad Conversion, via MRI, CSF Biomarkers, and Pattern Classification. Neurobiol. Aging 2011, 32, 2322.e19–2322.e27. [Google Scholar] [CrossRef] [PubMed] [Green Version]
- Liu, K.; Chen, K.; Yao, L.; Guo, X. Prediction of Mild Cognitive Impairment Conversion Using a Combination of Independent Component Analysis and the Cox Model. Front. Hum. Neurosci. 2017, 11, 33. [Google Scholar] [CrossRef] [PubMed]
- Samper-González, J.; Burgos, N.; Bottani, S.; Fontanella, S.; Lu, P.; Marcoux, A.; Routier, A.; Guillon, J.; Bacci, M.; Wen, J.; et al. Reproducible evaluation of classification methods in Alzheimer’s disease: Framework and application to MRI and PET data. Neuroimage 2018, 183, 504–521. [Google Scholar] [CrossRef] [PubMed] [Green Version]
- Li, S.; Okonkwo, O.; Albert, M.; Wang, M.-C. Variation in Variables that Predict Progression from MCI to AD Dementia over Duration of Follow-up. Am. J. Alzheimers Dis. 2013, 2, 12–28. [Google Scholar] [CrossRef] [PubMed]
- Diederik, K.; Ba, J. Adam: A method for stochastic optimization. arXiv 2014, arXiv:1412.6980. [Google Scholar]
- Cuingnet, R.; Gerardin, E.; Tessieras, J.; Auzias, G.; Lehéricy, S.; Habert, M.O.; Chupin, M.; Benali, H.; Colliot, O.; Alzheimer’s Disease Neuroimaging Initiative. Automatic classification of patients with Alzheimer’s disease from structural MRI: A comparison of ten methods using the ADNI database. Neuroimage 2011, 56, 766–781. [Google Scholar] [CrossRef] [Green Version]
- Basheer, S.; Bhatia, S.; Sakri, S.B. Computational Modeling of Dementia Prediction Using Deep Neural Network: Analysis on OASIS Dataset. IEEE Access 2021, 9, 42449–42462. [Google Scholar] [CrossRef]
- Choi, J.Y.; Lee, B. Combining of Multiple Deep Networks via Ensemble Generalization Loss, Based on MRI Images, for Alzheimer’s Disease Classification. IEEE Signal Process. Lett. 2020, 27, 206–210. [Google Scholar] [CrossRef]
- Zhu, T.; Cao, C.; Wang, Z.; Xu, G.; Qiao, J. Anatomical Landmarks and DAG Network Learning for Alzheimer’s Disease Diagnosis. IEEE Access 2020, 8, 206063–206073. [Google Scholar] [CrossRef]
- Lian, C.; Liu, M.; Zhang, J.; Shen, D. Hierarchical Fully Convolutional Network for Joint Atrophy Localization and Alzheimer’s Disease Diagnosis Using Structural MRI. IEEE Trans. Pattern Anal. Mach. Intell. 2020, 42, 880–893. [Google Scholar] [CrossRef] [PubMed]
- Xia, Z.; Zhou, T.; Mamoon, S.; Lu, J. Recognition of Dementia Biomarkers With Deep Finer-DBN. IEEE Trans. Neural Syst. Rehabil. Eng. 2021, 29, 1926–1935. [Google Scholar] [CrossRef] [PubMed]
- Er, F.; Goularas, D. Predicting the Prognosis of MCI Patients Using Longitudinal MRI Data. IEEE/ACM Trans. Comput. Biol. Bioinform. 2021, 18, 1164–1173. [Google Scholar] [CrossRef] [PubMed]
- Oh, K.; Chung, Y.-C.; Kim, K.W.; Kim, W.-S.; Oh, I.-S. Author correction: Classification and visualization of Alzheimer’s disease using volumetric convolutional neural network and transfer learning. Sci. Rep. 2020, 10, 1–16. [Google Scholar]
- Yagis, E.; Citi, L.; Diciotti, S.; Marzi, C.; Atnafu, S.W.; De Herrera, A.G.S. 3D Convolutional Neural Networks for Diagnosis of Alzheimer’s Disease via Structural MRI. In Proceedings of the 2020 IEEE 33rd International Symposium on Computer-Based Medical Systems (CBMS), Rochester, MN, USA, 28–30 July 2020. [Google Scholar]
- Ieracitano, C.; Mammone, N.; Hussain, A.; Morabito, F.C. A Convolutional Neural Network based self-learning approach for classifying neurodegenerative states from EEG signals in dementia. In Proceedings of the 2020 International Joint Conference on Neural Networks, IJCNN, Glasgow, UK, 19–24 July 2020. [Google Scholar]
- Prajapati, R.; Khatri, U.; Kwon, G.R. An Efficient Deep Neural Network Binary Classifier for Alzheimer’s disease Classification. In Proceedings of the 2021 International Conference on Artificial Intelligence in Information and Communication, ICAIIC, Jeju Island, Korea, 13–16 April 2021. [Google Scholar]
- Tomassini, S.; Falcionelli, N.; Sernani, P.; Müller, H.; Dragoni, A.F. An End-to-End 3D ConvLSTM-based Framework for Early Diagnosis of Alzheimer’s Disease from Full-Resolution Whole-Brain sMRI Scans. In Proceedings of the 2021 IEEE 34th International Symposium on Computer-Based Medical Systems, CBMS, Aveiro, Portugal, 7–9 June 2021. [Google Scholar]
- Rejusha, T.R.; Vipin Kumar, K.S. Artificial MRI Image Generation using Deep Convolutional GAN and its Comparison with other Augmentation Methods. In Proceedings of the 2021 International Conference on Communication, Control and Information Sciences, ICCISc, Idukki, India, 16–18 June 2021. [Google Scholar]
- Yagis, E.; de Herrera, A.G.S.; Citi, L. Convolutional Autoencoder based Deep Learning Approach for Alzheimer’s Disease Diagnosis using Brain MRI. In Proceedings of the 2021 IEEE 34th International Symposium on Computer-Based Medical Systems, CBMS, Aveiro, Portugal, 7–9 June 2021. [Google Scholar]
- Sarasua, I.; Lee, J.; Wachinger, C. Geometric Deep Learning on Anatomical Meshes for the Prediction of Alzheimer’s disease. In Proceedings of the 2021 IEEE 18th International Symposium on Biomedical Imaging, ISBI, Nice, France, 13–16 April 2021. [Google Scholar]
- Fedorov, A.; Wu, L.; Sylvain, T.; Luck, M.; DeRamus, T.P.; Bleklov, D.; Plis, S.M.; Calhoun, V.D. On Self-Supervised Multimodal Representation Learning: An Application to Alzheimer’s disease. In Proceedings of the 2021 IEEE 18th International Symposium on Biomedical Imaging, ISBI, Nice, France, 13–16 April 2021. [Google Scholar]
- Aderghal, K.; Boissenin, M.; Benois-Pineau, J.; Catheline, G.; Afdel, K. Classification of sMRI for AD Diagnosis with Convolutional Neuronal Networks: A Pilot 2-D+ɛ Study on ADNI. Proc. Int. Conf. Multimed. Model. MMM 2017, 10132, 690–701. [Google Scholar] [CrossRef]
- Aderghal, K.; Benois-Pineau, J.; Afdel, K. FuseMe: Classification of sMRI images by fusion of Deep CNNs in 2D+ε projections. Proc. Int. Workshop Content Based Multimed. Index. CBMI 2017, 1–7. [Google Scholar] [CrossRef]
- Kam, T.-E.; Zhang, H.; Jiao, Z.; Shen, D. Deep Learning of Static and Dynamic Brain Functional Networks for Early MCI Detection. IEEE Trans. Med. Imaging 2020, 39, 478–487. [Google Scholar] [CrossRef]
- Ahmed, O.B.; Mizotin, M.; Benois-Pineau, J.; Allard, M.; Catheline, G.; Amar, C.B. Alzheimer’s disease diagnosis on structural MR images using circular harmonic functions descriptors on hippocampus and posterior cingulate cortex. Comput. Med. Imaging Graph. 2015, 44, 13–25. [Google Scholar] [CrossRef] [PubMed]
- Khagi, B.; Kwon, G.-R. 3D CNN Design for the Classification of Alzheimer’s Disease Using Brain MRI and PET. IEEE Access 2020, 8, 217830–217847. [Google Scholar] [CrossRef]
- Puspaningrum, E.Y.; Wahid, R.R.; Amaliyah, R.P.; Nisa’, C. Alzheimer’s Disease Stage Classification using Deep Convolutional Neural Networks on Oversampled Imbalance Data. In Proceedings of the 2020 6th Information Technology International Seminar, ITIS, Surabaya, Indonesia, 14–16 October 2020. [Google Scholar]
- Li, Y.; Huang, J.-B. Narendra Ahuja and Ming-Hsuan Yang. Deep Joint Image Filtering. In European Conference on Computer Vision; Springer: Cham, Switzerland, 2016; pp. 154–169. [Google Scholar]
- Tufail, A.B.; Ma, Y.-K.; Kaabar, M.K.A.; Martínez, F.; Junejo, A.R.; Ullah, I.; Khan, R. Deep Learning in Cancer Diagnosis and Prognosis Prediction: A Minireview on Challenges, Recent Trends, and Future Directions. Comput. Math. Methods Med. 2021, 2021, 9025470. [Google Scholar] [CrossRef] [PubMed]
Publisher’s Note: MDPI stays neutral with regard to jurisdictional claims in published maps and institutional affiliations. |
© 2021 by the authors. Licensee MDPI, Basel, Switzerland. This article is an open access article distributed under the terms and conditions of the Creative Commons Attribution (CC BY) license (https://creativecommons.org/licenses/by/4.0/).