Article

Effects of Damaged Rotor Blades on the Aerodynamic Behavior and Heat-Transfer Characteristics of High-Pressure Gas Turbines

1
Department of Mechanical Engineering, Chung-Ang University, Seoul 06911, Korea
2
Department of Intelligent Energy and Industry, Chung-Ang University, Seoul 06911, Korea
*
Author to whom correspondence should be addressed.
Mathematics 2021, 9(6), 627; https://doi.org/10.3390/math9060627
Submission received: 21 February 2021 / Revised: 12 March 2021 / Accepted: 13 March 2021 / Published: 16 March 2021
(This article belongs to the Special Issue Computational Mechanics in Engineering Mathematics)

Abstract

:
Gas turbines are critical components of combined-cycle power plants because they influence the power output and overall efficiency. However, gas-turbine blades are susceptible to damage when operated under high-pressure, high-temperature conditions. This reduces gas-turbine performance and increases the probability of power-plant failure. This study compares the effects of rotor-blade damage at different locations on their aerodynamic behavior and heat-transfer properties. To this end, we considered five cases: a reference case involving a normal rotor blade and one case each of damage occurring on the pressure and suction sides of the blades’ near-tip and midspan sections. We used the Reynolds-averaged Navier-Stokes equation coupled with the kω SST γ turbulence model to solve the problem of high-speed, high-pressure compressible flow through the GE-E3 gas-turbine model. The results reveal that the rotor-blade damage increases the heat-transfer coefficients of the blade and vane surfaces by approximately 1% and 0.5%, respectively. This, in turn, increases their thermal stresses, especially near the rotor-blade tip and around damaged locations. The four damaged-blade cases reveal an increase in the aerodynamic force acting on the blade/vane surfaces. This increases the mechanical stress on and reduces the fatigue life of the blade/vane components.

1. Introduction

The combined-cycle power plant (CCPP) has attracted considerable attention with regard to meeting electricity demands for industrial and human consumption. CCPPs deliver high overall efficiencies (50 to 60%) while maintaining lower emissions. Moreover, for the same quantity of fuel burned, the electricity production capacity of CCPPs exceeds that of their traditional single-cycle counterparts by approximately 50% [1]. CCPPs represent a combination of the gas- and steam-turbine systems; the exhaust gas from the gas turbine is used to run the boiler, which generates the steam used for running the steam turbine. This coupled operation increases the overall power generated. Several means to increase the CCPP power output and overall efficiency exist, the most popular of which is increasing the turbine inlet temperature (TIT). However, the TIT is influenced by the complex flow characteristics and temperature distribution at the combustor exit. The flow complexities in the temperature field downstream of the combustor are called hot streaks (HSs), the characteristics of which are similar to those of an actual gas turbine operation. Several extant studies (experimental and numerical) have investigated the influence of HSs on the flow and heat-transfer behaviors in a gas-turbine engine [2,3]. Therefore, it is important to consider the HS instead of the uniform temperature-field condition during simulations to ensure accurate and reliable results.
Typically, the TIT exceeds the melting temperature of the material—metals alloys—used to fabricate the turbine blades. Therefore, increasing the TIT to enhance the power-generation efficiency affects not only the flow field but also the aerodynamic behavior and heat-transfer characteristics of the blade and vane surfaces. Operation under such high temperatures without the deployment of effective cooling methods tends to reduce the fatigue life of the blades and vanes. Moreover, the increased heat loads might damage their surfaces. There are several types of primary turbine-blade damages, such as a dent, score, and scratch, which might occur anywhere on any blade or vane, such as the leading edge, trailing edge, hub, and shroud. These damages significantly affect the flow and heat-transfer characteristics; this, in turn, affects the gas-turbine performance and overall power-plant efficiency. As the cost of replacing damaged blades significantly exceeds that of repairing, several researchers have devised appropriate means to repair damaged blades instead of replacing them. Kaewbumrung et al. [4] introduced a blended method for damaged blade repair by smoothening the roughened region around the damage location. They found an improvement in the aerodynamic behavior of the compressor blade after the repair. Mai and Ryu [5] recommended leading-edge modification to repair a damaged rotor blade installed in a high-pressure gas turbine. They reported an improved gas-turbine performance after modifying the damage on the near-tip pressure side of the blade. In fact, this modified blade even outperformed the undamaged blades.
The failure of gas-turbine blades and the underlying reasons have been extensively reported in the literature. Gallardo et al. [6] investigated the failure of the first-stage blade in a gas turbine. They concluded that the said failure could be attributed to a misfit between the rotor and lining sectors, thereby resulting in strong turbine-blade friction. Mishra et al. [7] investigated the failure of an uncooled turbine aero gas-turbine blade. The failure initiated near the leading edge and gradually propagated toward the trailing edge. Upon investigation, this failure was attributed to the initiation of thermal cracks owing to surface oxidation. Poursaeidi et al. [8] analyzed the effects of the damage occurring in the second-stage blade of a gas-turbine engine, thereby reducing its fatigue life. Their results demonstrated good agreement between analytical calculations and simulated physics. Yu et al. [9] proposed a new energy-critical plane-damage parameter for the fatigue-life prediction of gas-turbine blades. Their results revealed that the model predictions performed by Wang–Brown and Fatemi–Socie are acceptable with the maximum damage parameters. Several other models for fatigue-life prediction and crack propagation have been reported. Moreover, several studies have been published recently that focus on fault diagnosis and gas turbine performance prediction based on neural networks and machine learning [10,11]. Bazilevs et al. [12] proposed an isogeometric discretization and a complex-geometry mesh generation method for computational flow and structure analysis in gas turbines. However, most studies have examined the structure, failure, or fatigue-life prediction of turbine blades after the occurrence of a critical damage. Investigations concerning the effects of the original/primary damage on the aerodynamic behavior and heat-transfer characteristics of gas-turbine blades have seldom been undertaken.
Several studies have examined the heat-transfer characteristics of normal turbine blades under different conditions. Simone et al. [13] performed experiments and simulations to investigate the aerothermal performance of a modern gas turbine considering the uniform and nonuniform inlet temperature fields. Their results demonstrated good agreement between the experiments and simulations. Choi and Ryu [14] examined the thermal flow characteristics of a two-stage gas turbine under the effects of the axial gap and the inlet-temperature conditions. They concluded that a reduction in the axial gap between successive blade rows causes a sudden increase in the thermal load on the rotor blade. Wang et al. [15] performed unsteady simulations to analyze the effects of turbulence intensity on the heat-transfer characteristics of a high-pressure gas turbine. They concluded that a high turbulence intensity leads to significant effects on the heat-transfer coefficient of turbine airfoils. Yang et al. [16] performed numerical analyses to examine the effects of blade rotation on the tip-leakage flow and corresponding heat transfer. They found that the relative motions of the shroud were the main effects of rotation on the leakage flow and heat transfer. These studies have emphasized the influence of boundary conditions on the aerodynamics and heat-transfer characteristics of normal rotor blades. Therefore, it is necessary to perform additional analysis concerning the effects of primary blade damage coupled with the inlet (HS) conditions on the complicated heat flow through a gas turbine.
Numerical investigations regarding the complicated heat flow within a gas turbine must be performed considering a multistage domain to predict and closely match the actual operating conditions. However, multistage gas-turbine simulations are computationally expensive; therefore, prior studies were conducted considering a single stage. Wang et al. [15] investigated the influence of turbulence intensity on the heat transfer characteristics of a high pressure gas turbine stage with an inlet hot streak. Asgarshamsi et al. [17] examined the multi-objective optimization of lean and sweep angles for stator and rotor blades. Moreover, the influence of the rim seal flow and the guide vane passing wake on the aerodynamic and heat transfer in single stage axial gas turbine was fully introduced [18,19]. In this study, we considered the HS conditions at the inlet and minor damages on the rotor-blade surface. The HS condition primarily affects the flow and heat-transfer characteristics in the first stage of a gas turbine. Therefore, we considered a 1.5-stage turbine configuration as the computational domain of interest in this study. This domain is expected to not only capture the effects of the HS and minor rotor-blade damage on the complicated heat flow within a gas turbine accurately but also reduce the overall computational time and cost.
Although many studies have investigated the flow and heat transfer in gas turbines, comprehensive knowledge is lacking regarding the influences of various locations of minor damage on the rotor blade on the aerodynamic behavior and heat flow phenomenon with the HS condition. This study can contribute to a more detailed understanding about the complex flow and heat-transfer phenomenon under various rotor blade conditions. The results of this study can help engineers, especially those who work in the design of turbine blades, to know what parameters and which locations will be affected when the blades suffer minor damage. Hence, they can provide suitable methods for protecting the blade surface, thereby extending the fatigue life and reducing the maintenance cost during the operation of the power plant. Therefore, in this study, we conducted unsteady simulations to examine the combined effects of rotor damage and the HS condition on the aerodynamic behavior and the complex heat flow in a gas turbine.

2. Simulation Details

2.1. Geometry and Grid

In this study, the first three turbine-blade rows (1.5 stage) of the GE-E3 gas-turbine engine were considered the computational domain for performing unsteady simulations. These three rows comprised 46 stator vanes, 76 rotor blades, and 48 stator vanes, respectively [20]. To facilitate accurate result prediction and reduce the computational time, unsteady simulations based on the transient stator–rotor model must be set up such that the stator and rotor pitch angles remain constant. In this study, the domain-scaling method [21] was used to meet this requirement. To simplify the calculations, the number and dimensions of the rotor blades were kept constant. Subsequently, the domain-scaling method was used to scale the first and second stator-vane domains, considering scale ratios of 46/38 and 48/38, respectively; domain-scaling is a method aimed at reducing the computational domain in turbomachinery simulations by modifying the number of blades/vanes such that the blade-to-vane ratio is equal to the ratio of two small integers (1/1, 1/2, 1/3, 2/3, and so on), while maintaining the shape of the airfoil. Further details regarding the vane and blade dimensions are reported in [14]. Five different rotor-blade operating conditions—one case of normal blade and four cases of damaged blades—were considered for simulation. In the four damaged rotor blade cases, the suction and pressure sides of the blades’ near-tip and midspan sections were considered damaged. The damaged region occupied approximately 0.5% of the non-damaged-blade volume. Figure 1 presents the computational domain along with details concerning the rotor-blade operating conditions considered in this study.
We used ANSYS Turbogrid [22] to create the mesh for the computational domain. The grid-independent test revealed that the total mesh for the first stator guide vane (S1), the first rotor blade (R1), and the second stator guide vane (S2) were approximately 8 million hexahedral elements; moreover, the dimensionless wall distance (y+) was less than 1 at the blade surface. Additional details of the independent test mesh and the contour of y+ can be found in Table 1 and Figure 2.

2.2. Governing Equations and Turbulence Model

In this study, the simulations were performed to solve the continuity, momentum, and energy equations pertaining to the unsteady analysis of a complex fluid flow in a high-pressure gas turbine. These equations can be expressed as follows.
Continuity equation:
ρ t + x i ( ρ u i ) = 0
Momentum equation:
t ( ρ u i ) + ( ρ u i u j ) x i = P x i + x j [ μ ( u i x j + u j x i 2 3 δ i j u k x k ) ] + ( ρ { u i u j } ) x j
Energy equation:
t ( ρ E ) + x j ( u j ( ρ E + P ) ) = x j [ ( k e f f ) T x j ] + x j [ u i μ e f f ( u i x j + u j x i 2 3 δ i j u k x k ) ]
k e f f = k + μ t C p P r t
μ e f f = k e f f 1.393 C p
i ,   j ,   k = 1 ,   2 ,   3
where ρ , u , P, k , P r t , C p , and μ denote the fluid density, velocity, static pressure, thermal conductivity, Prandtl number, specific heat, and dynamic viscosity, respectively. In the energy equation, E, k e f f , and μ e f f denote the specific internal energy, effective thermal conductivity, and effective dynamic viscosity, respectively. The simulations were performed using ANSYS CFX—a finite-volume-method-based computational fluid dynamics (CFD) solver that was developed with a special focus on turbomachine flow physics [23].
For the accurate prediction of the flow field parameters, it is important to select an appropriate turbulence model prior to simulating the flow through a turbomachine. Several numerical approaches have been proposed to analyze such turbulent flow fields. These include the direct numerical simulations (DNS), large eddy simulations (LES), and Reynolds-average Navier-Stokes (RANS) approximation. Although DNS and LES provide highly accurate results, they are computationally expensive [24,25,26]. In contrast, the RANS approximation [27,28,29,30] is less expensive and yields accurate results in a reasonable simulation time. Therefore, it is usually considered the method of choice for performing low-cost steady and unsteady CFD simulations. Furthermore, prior investigations [31,32,33] have revealed that the SST γ and SST γ − θ models are the most appropriate for predicting transitional flows. Moreover, the numerical results in [11] obtained using the k ω SST γ turbulence model demonstrate good agreement with the experimental results reported in [34]. Accordingly, the k ω SST γ turbulence model was used in this study.
The k ω SST model was based on the standard k ω and the standard k ε model developed by Menter [35]. The corresponding equations for k and ω were formulated as follows:
( ρ k ) t + ( ρ u j k ) x j = P K 0.09 ρ ω k + x j [ ( μ + μ t σ k ) k x j ] ,
( ρ ω ) t + ( ρ u j ω ) x j = γ ν t P K β ρ ω 2 + x j [ ( μ + μ t σ ω ) k x j ] + 2 ρ ( 1 F 1 )   1 σ ω , 2 1 ω k x j ω x j
where:
P K = μ t ( u i x j + u j x i ) u i x j 2 3 u k x k ( 3 μ t u k x k + ρ k ) ,
  μ t ( kg / ms ) denotes the turbulence viscosity calculated using the following equation:
μ t = 0.31 ρ k max ( 0.31 ω , S F 2 ) ,
F 1 and F 2 are the blending functions formulated by the following variables:
a r g 1 = min [ max ( 100 k 9 ω y , 500 ν y 2 ω ) , 4 ρ σ ω , 2 k C D k ω y 2 ] ,
a r g 2 = max ( 200 k 9 ω y , 500 ν y 2 ω ) ,
as follows:
F 1 = tanh ( a r g 1 4 ) ,
F 2 = tanh ( a r g 2 2 ) ,
where σ k and σ ω denote the turbulent Prandtl numbers for k and ω , respectively. The definitions for these equations are expressed below:
σ k = 1 F 1 / σ k , 1 + ( 1 F 1 ) / σ k , 2 ,
σ ω = 1 F 1 / σ ω , 1 + ( 1 F 1 ) / σ ω , 2 ,
C D k ω = max ( 2 ρ σ ω , 2 1 ω k x i ω x j , 10 10 ) .
Furthermore, it is important to define the transport equation for the intermittency ( γ ) to obtain the full expression for the k ω SST γ turbulence model. The transport equation of γ can be expressed as:
( ρ γ ) t + ( ρ u j γ ) x j = P γ * + P γ * * + x j [ ( μ + μ t σ γ ) k x j ] .
Equation (17) includes the transition sources P γ * , and the destruction/relaminarization sources P γ * * , which are expressed as follows:
P γ * = 2 ( 1 γ ) F length ρ S ( γ F onset ) c γ 3 ,
P γ * * = 2 ( 1 γ c γ 2 ) c γ 1 ρ Ω γ F turb ,
To quantify the values of P γ * and P γ * * , we need to find out the F onset variable in the transition source and the F turb variable in the destruction/relaminarization sources. The following functions was used to control the transition onset:
R T = ρ k μ ω ,
F o n s e t 1 = 1000 ρ y 2 S 2193 μ R e θ c
F o n s e t 2 = min ( max ( F o n s e t 1 ,   F o n s e t 1 4 ) ,   2 ) ,
F o n s e t 3 = max ( 1 ( 2 R T 5 ) 3 ,   0 ) ,
F o n s e t = max ( F o n s e t 2 F o n s e t 3 ,   0 ) ,
F t u r b = e ( 0.25 R T ) 4 ,
where S, F length , Ω , and R e θ c denote the strain rate magnitude, an empirical correlation, the vorticity magnitude, and the critical Reynolds number, respectively. The other constant variables for the equations above are provided as follows [36]:
σ k , 1 = 1.176 ,   σ k , 2 = 1.0 ,   c γ 1 = 0.03 ,   c γ 2 = 50 ,
σ ω , 1 = 2.0 ,   σ ω , 2 = 1.168 ,   c γ 3 = 0.5 ,   σ γ = 1 .

2.3. Boundary Conditions and Unsteady Simulation

The simulation boundary conditions were defined in-line with the GE-E3 turbine test report [20], as described in Table 2. Ideal gas was considered the working fluid. Details concerning the domain inlet and outlet boundary conditions are listed in Table 2. Figure 3 depicts the TIT distribution at the domain inlet normalized with respect to the average temperature. The turbine rotational speed was 3600 RPM. Five cases of the rotor-blade operating conditions were considered, as described in the previous section. The normal blade was considered the reference case. The location of the blade damage was varied in the remaining cases to evaluate its effects on the aerodynamic behavior and heat-transfer characteristics of the passage flow and blade surface. Simulations were performed under both adiabatic and isothermal conditions applied to the blade and vane surfaces to compute their respective heat-transfer coefficients (HTCs). Adiabatic simulations were conducted to calculate the aerodynamic behaviors and the distribution of temperature on the blades/vanes surface under the non-heat transfer condition. Isothermal simulations were performed to investigate the heat flux, which were used for the heat-transfer calculations. Under isothermal conditions, the blade and vane surface temperatures were 389.95 K.
A steady-state simulation with a frozen-rotor interface between the stationary and rotating domains was first performed to obtain the initial condition for the subsequent unsteady simulations. The unsteady simulations were performed considering transient rotor–stator interfaces. The physical time step, i.e., the time taken by a single rotor blade to pass the upstream and downstream stator passages, was carefully selected to ensure high accuracy of the results. Prior studies [14,37] have revealed that 32 is a reasonable time-step estimate.
In addition, it is essential to define the domain rotation as the pitch count while performing unsteady simulations. If the pitch count is too small, a converged solution might not be obtained. Contrarily, a large pitch count would result in the wastage of computational resources. To find the appropriate pitch count used for the simulations, the most popular method was to choose some points near the blade/vane surface to check the periodic conditions of pressure/temperature. The pitch count was considered a suitable value when the measured values at these points became periodic. In this study, we monitored the flow pressure and temperature values at a few points near the blade and vane surfaces during initial simulations. As observed, the results become periodic after 10 pitches, i.e., a minimum of 10 pitches must be considered to obtain a convergence. The final simulation was performed with the pitch count set as 20 to ensure accurate prediction. The first 10 pitches were defined as the transitional period, whereas the last 10 pitches were used for calculation and analysis. The simulations were performed on a 96-core workstation (4 Intel(R) Xeon(R) CPU E7-8890 v4 @ 2.20 GHz, 512 GB RAM), and each unsteady simulation was completed in approximately 72 h.

3. Results and Discussion

3.1. Flow Characteristics

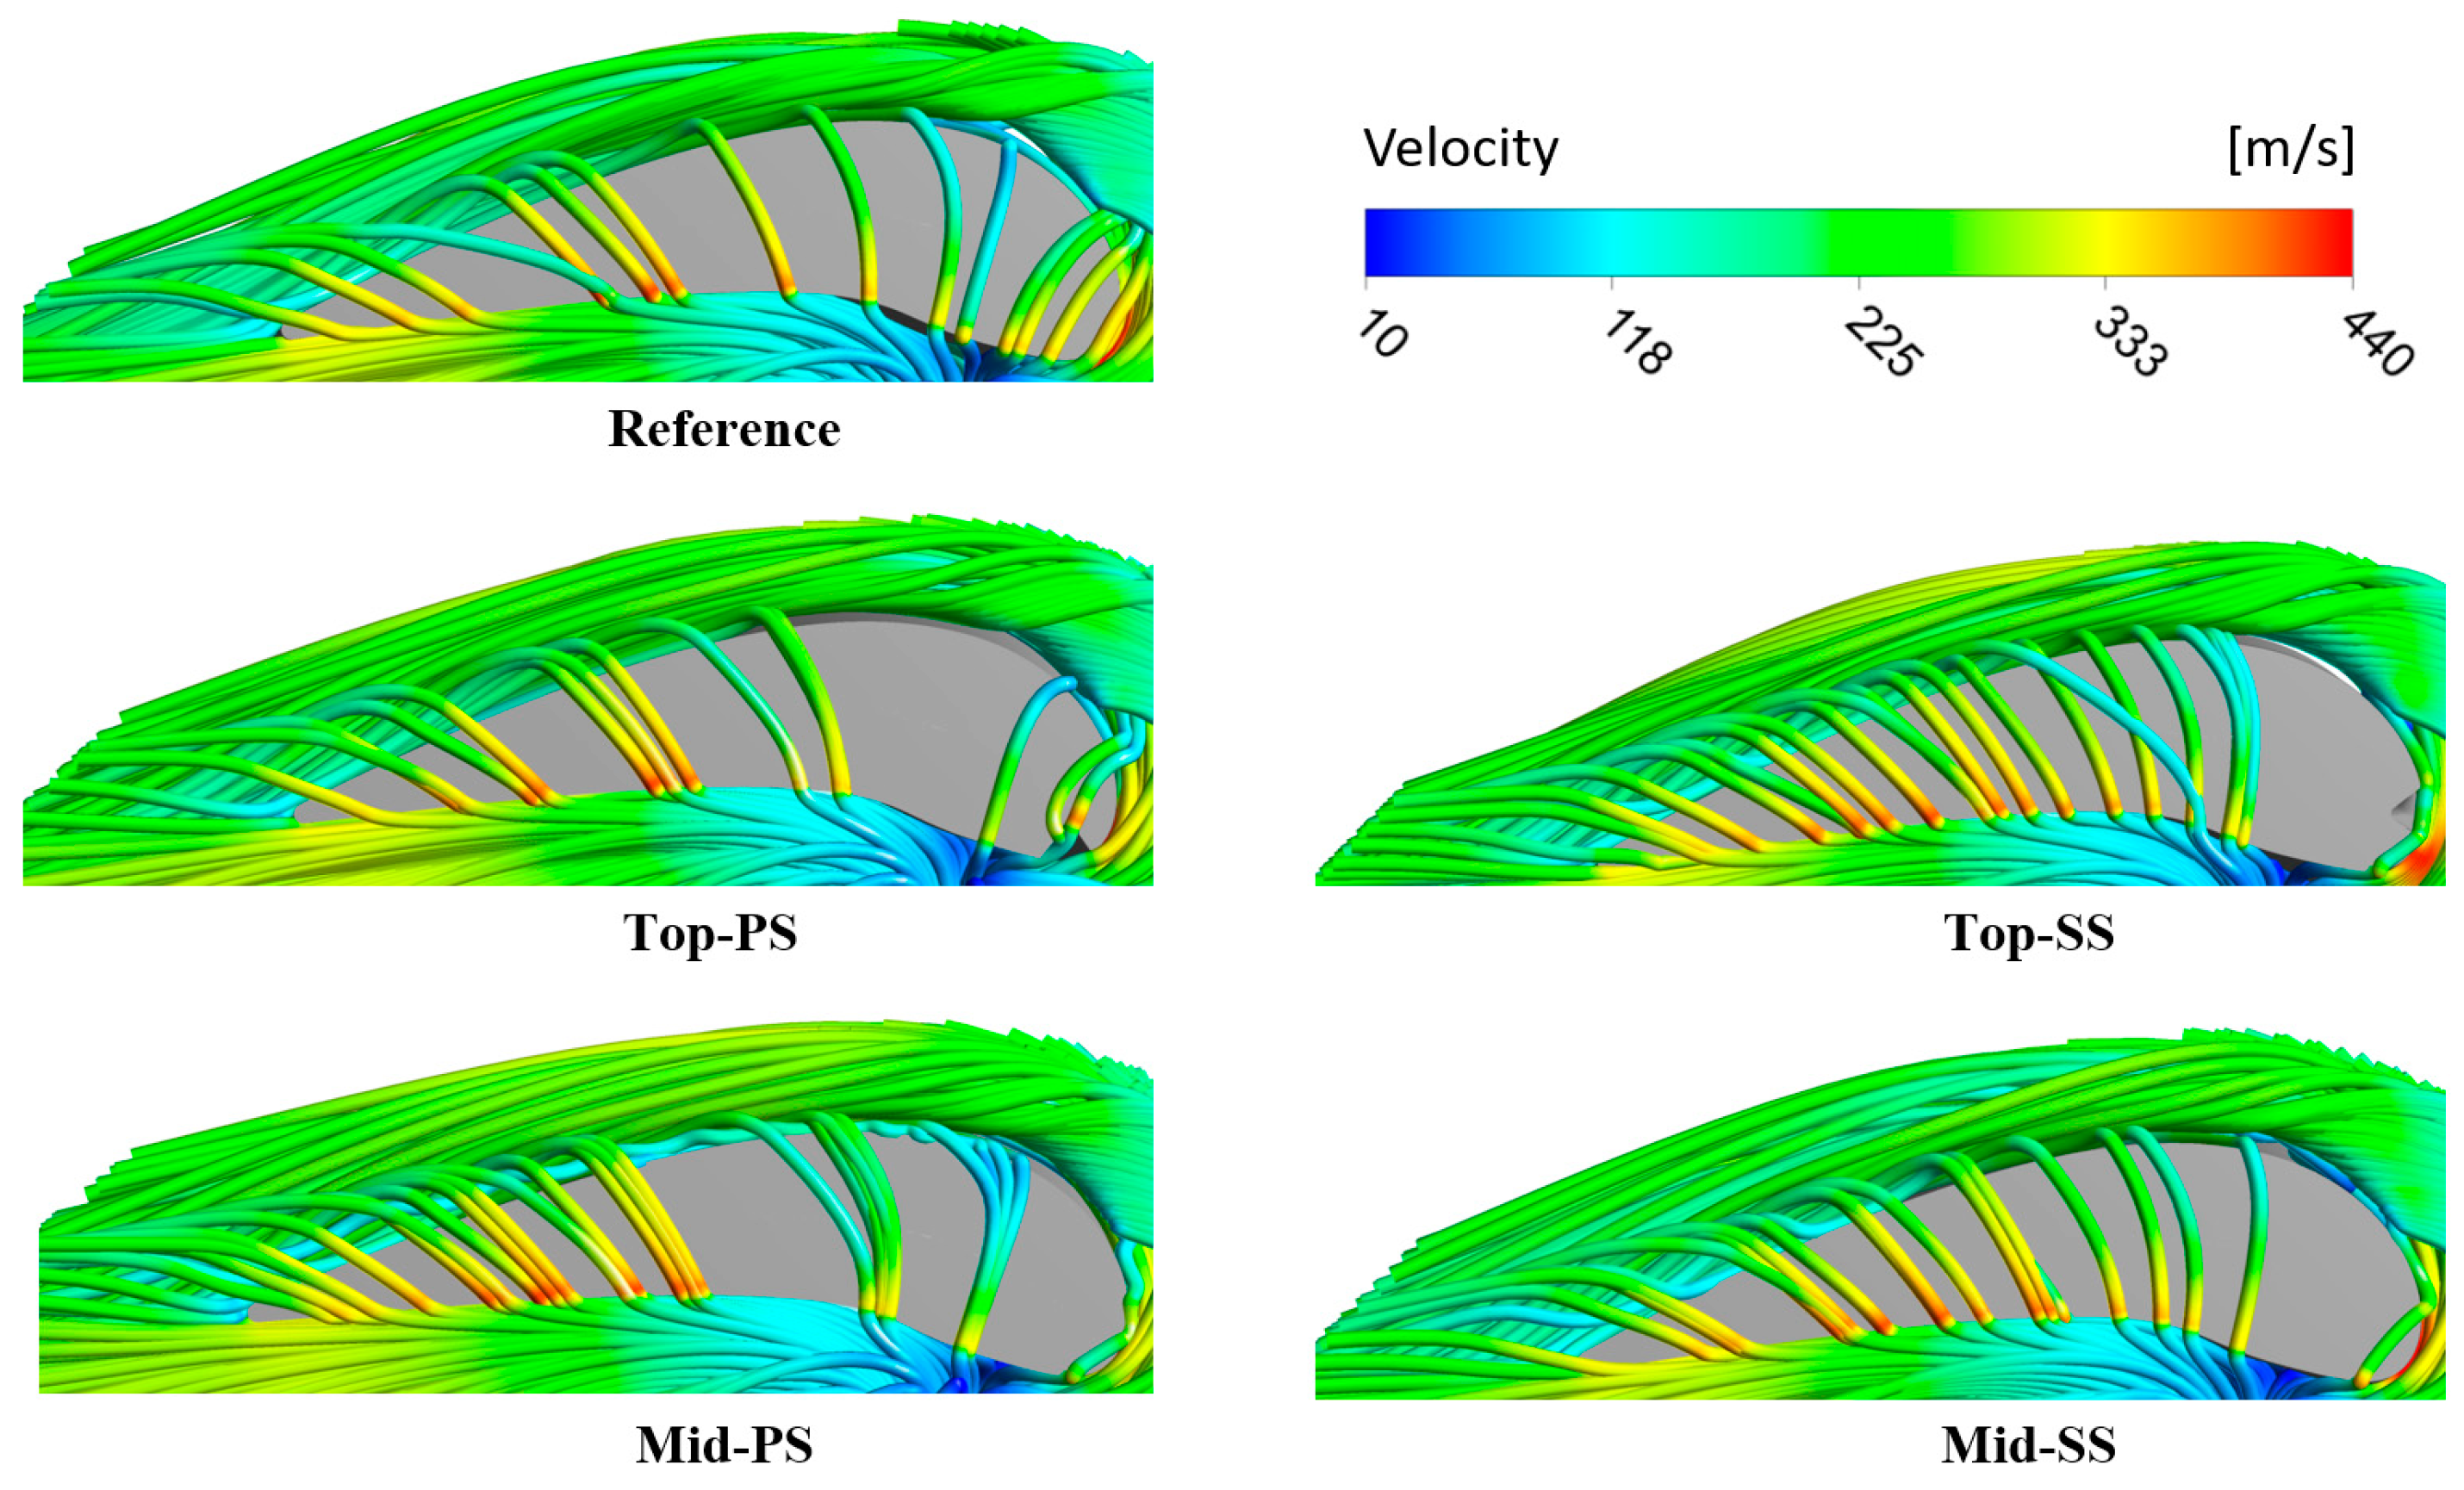
To investigate the flow field effects of the blade damage at different locations on the rotor-blade surface, we first considered the velocity streamline pertaining to the tip-leakage flow over the rotor-blade tip, as depicted in Figure 4. As can be observed, the damage locations not only affect the magnitude but also the distribution of the tip-leakage flow. In the reference case, the tip-leakage flow extends from the leading edge to the trailing edge of the blade tip. However, in the two near-tip damage cases, the tip-leakage flow remains concentrated between the leading edge and the points located at approximately 30% of the axial chord downstream of the leading edge. This can be considered an effect of the near-tip damage on the pressure field of the main flow passing through the rotor blade. Meanwhile, the two near-midspan damage cases have a flow distribution similar to that of the reference case. The tip-leakage flow covers the entire blade-tip surface. Furthermore, Figure 4 reveals that near-tip damage on the pressure side of the rotor blade results in reduced tip-leakage flow compared to the other cases, including the reference case. This can be considered the effect of the rotor-blade damage on the pressure difference between the rotor-blade pressure and suction sides, as well as the flow vortex on the suction side of the rotor blade. This result is in agreement with those reported in [5]. Thus, blade damage significantly affects the overall flow characteristics through the axial-turbine stages, thereby affecting the aerodynamic and heat-transfer performance of the blade and vane surfaces.
It is important to investigate the effects of blade damage at different locations on the downstream flow. Figure 5 depicts turbulence-intensity contours for the different cases at the outlet of the rotor domain (R1). As can be observed, the turbulence intensity is dependent not only on the rotor-blade conditions but also on the location of rotor-blade damage. All damaged-rotor cases yield a higher turbulence intensity than the reference case. This can be attributed to the change in the rotor-blade shape at the damage locations. Furthermore, the turbulence intensity generated by the damaged pressure side exceeds that observed in the two suction-side damage cases. Likewise, the near-midspan damage case generates higher turbulence intensity than its near-tip damage counterpart. These differences can be attributed to the HS condition applied to the inlet flow. The HS provides the highest flow condition near the blade center, thereby demonstrating noticeable effects in the midspan and near-tip flow fields.
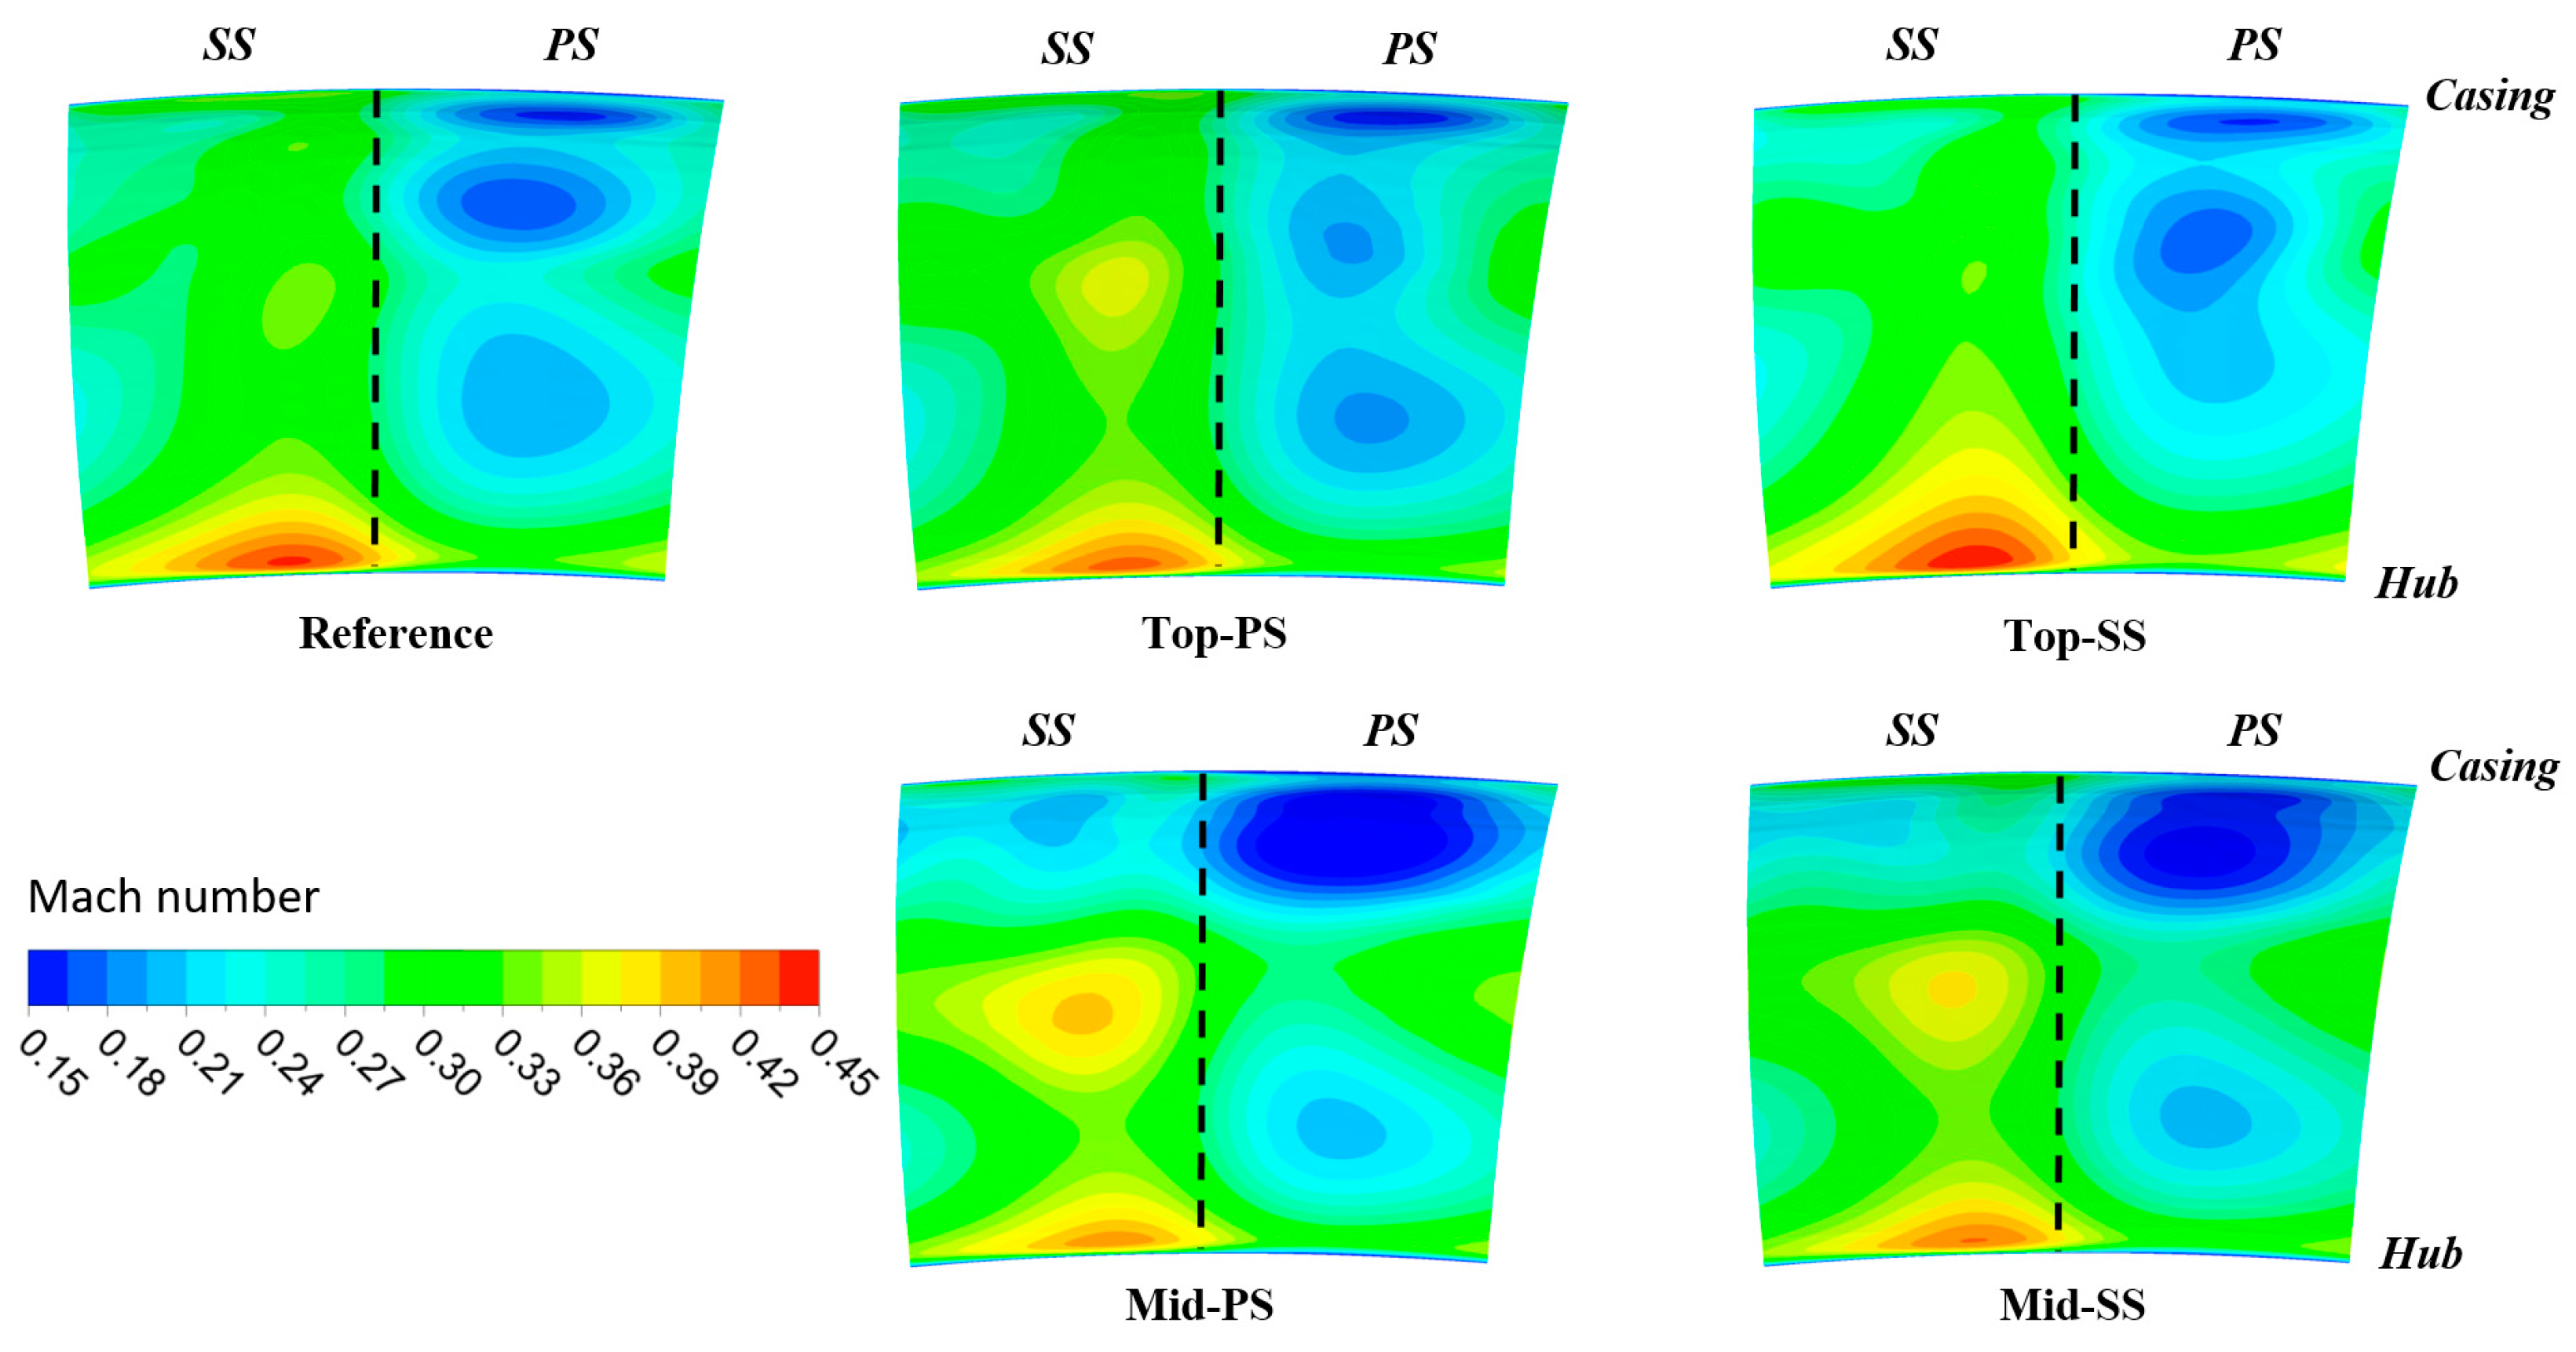
The Mach number contours at the S2-domain inlet (Figure 6) illustrate the detailed effects of the rotor-blade profile changes on the downstream flow. As can be observed, the incoming flow of the S2 vane strongly depends on the condition of the rotor blade. In the reference and near-tip damage cases, the flow spreads continuously from the hub to the casing on both the pressure and suction sides of the S2 vane. However, in the two near-midspan damage cases, the flow extends from the hub to approximately 60% of the S2 vane pressure side in spanwise direction. This can be attributed to the effects of rotor-blade damage on the leakage flow. In the near-tip damage cases, the leakage flow passing over the blade tip does not lead to much difference compared to the reference case. Therefore, the flow reaching the S2 vane remains nearly identical in these cases. However, in the near-midspan damage cases, the leakage flow includes the flow passing around the damaged rotor-blade sections near the midspan and the tip-leakage flow over the rotor-blade tip. Consequently, we observe that a higher flow rate remains concentrated near the midspan of the S2 vane, whereas a large region of low-velocity flow is observed near the casing. Further, Figure 6 reveals that a greater tip-leakage flow exists in the near-midspan damage cases. This is due to the greater difference between the flow velocities on the rotor-blade pressure and suction sides, which, in turn, originates from the higher difference in the pressure field in the near-midspan damage cases compared to the other cases. Overall, the flow conditions in the rotor domain strongly affect the downstream flow field, which, in turn, directly affects the aerodynamic behavior and heat-transfer characteristics of the turbine stages.
Figure 7 describes the temperature distribution at the hub and shroud of the S2 vane under different rotor-blade damage conditions. The temperatures at the hub and shroud noticeably increase in all damage conditions. Moreover, the hub and shroud temperatures strongly depend on the location of the rotor-blade damage. Rotor-blade damage on the pressure side results in a higher temperature at the S2-vane hub compared to the corresponding suction-side damage and reference cases. Furthermore, the near-midspan damage cases exhibit a higher temperature at the shroud than the corresponding near-tip damage and reference cases. This latter effect can be attributed to the effect of the tip-leakage flow. In addition, the near-midspan damage cases generate additional leakage flow passing through the damaged locations compared to the near-tip damage and reference cases. This causes a significant increase in temperature at both the hub and shroud surfaces of the S2 vane. These changes in the temperature field strongly affect the heat-transfer characteristics of the hub and shroud surfaces, thereby resulting in increased thermal stresses in these regions and reduced fatigue life.

3.2. Aerodynamic Behavior

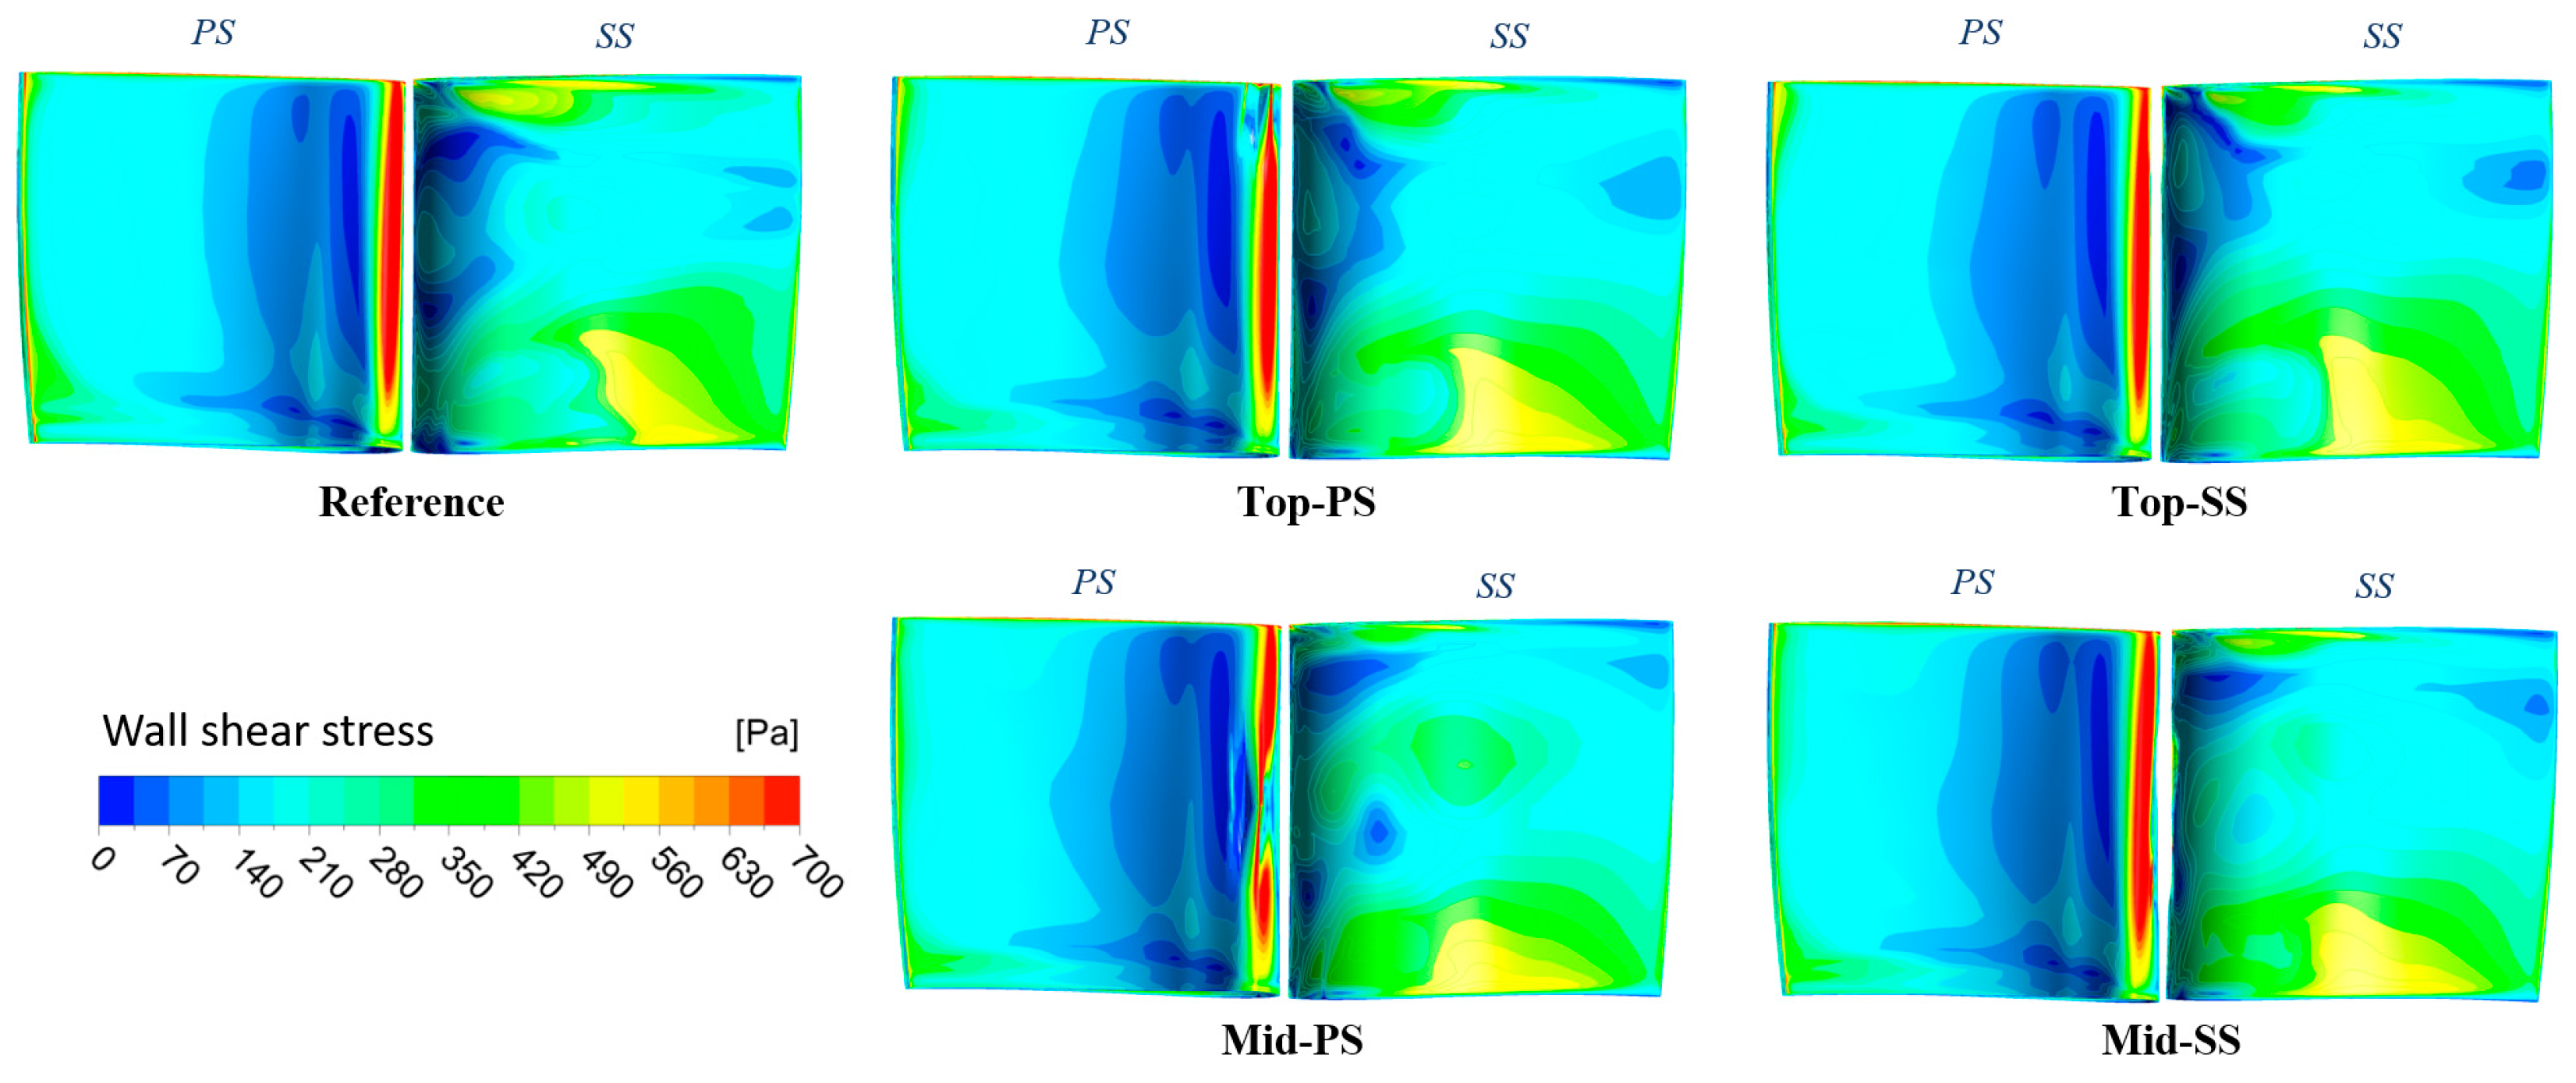
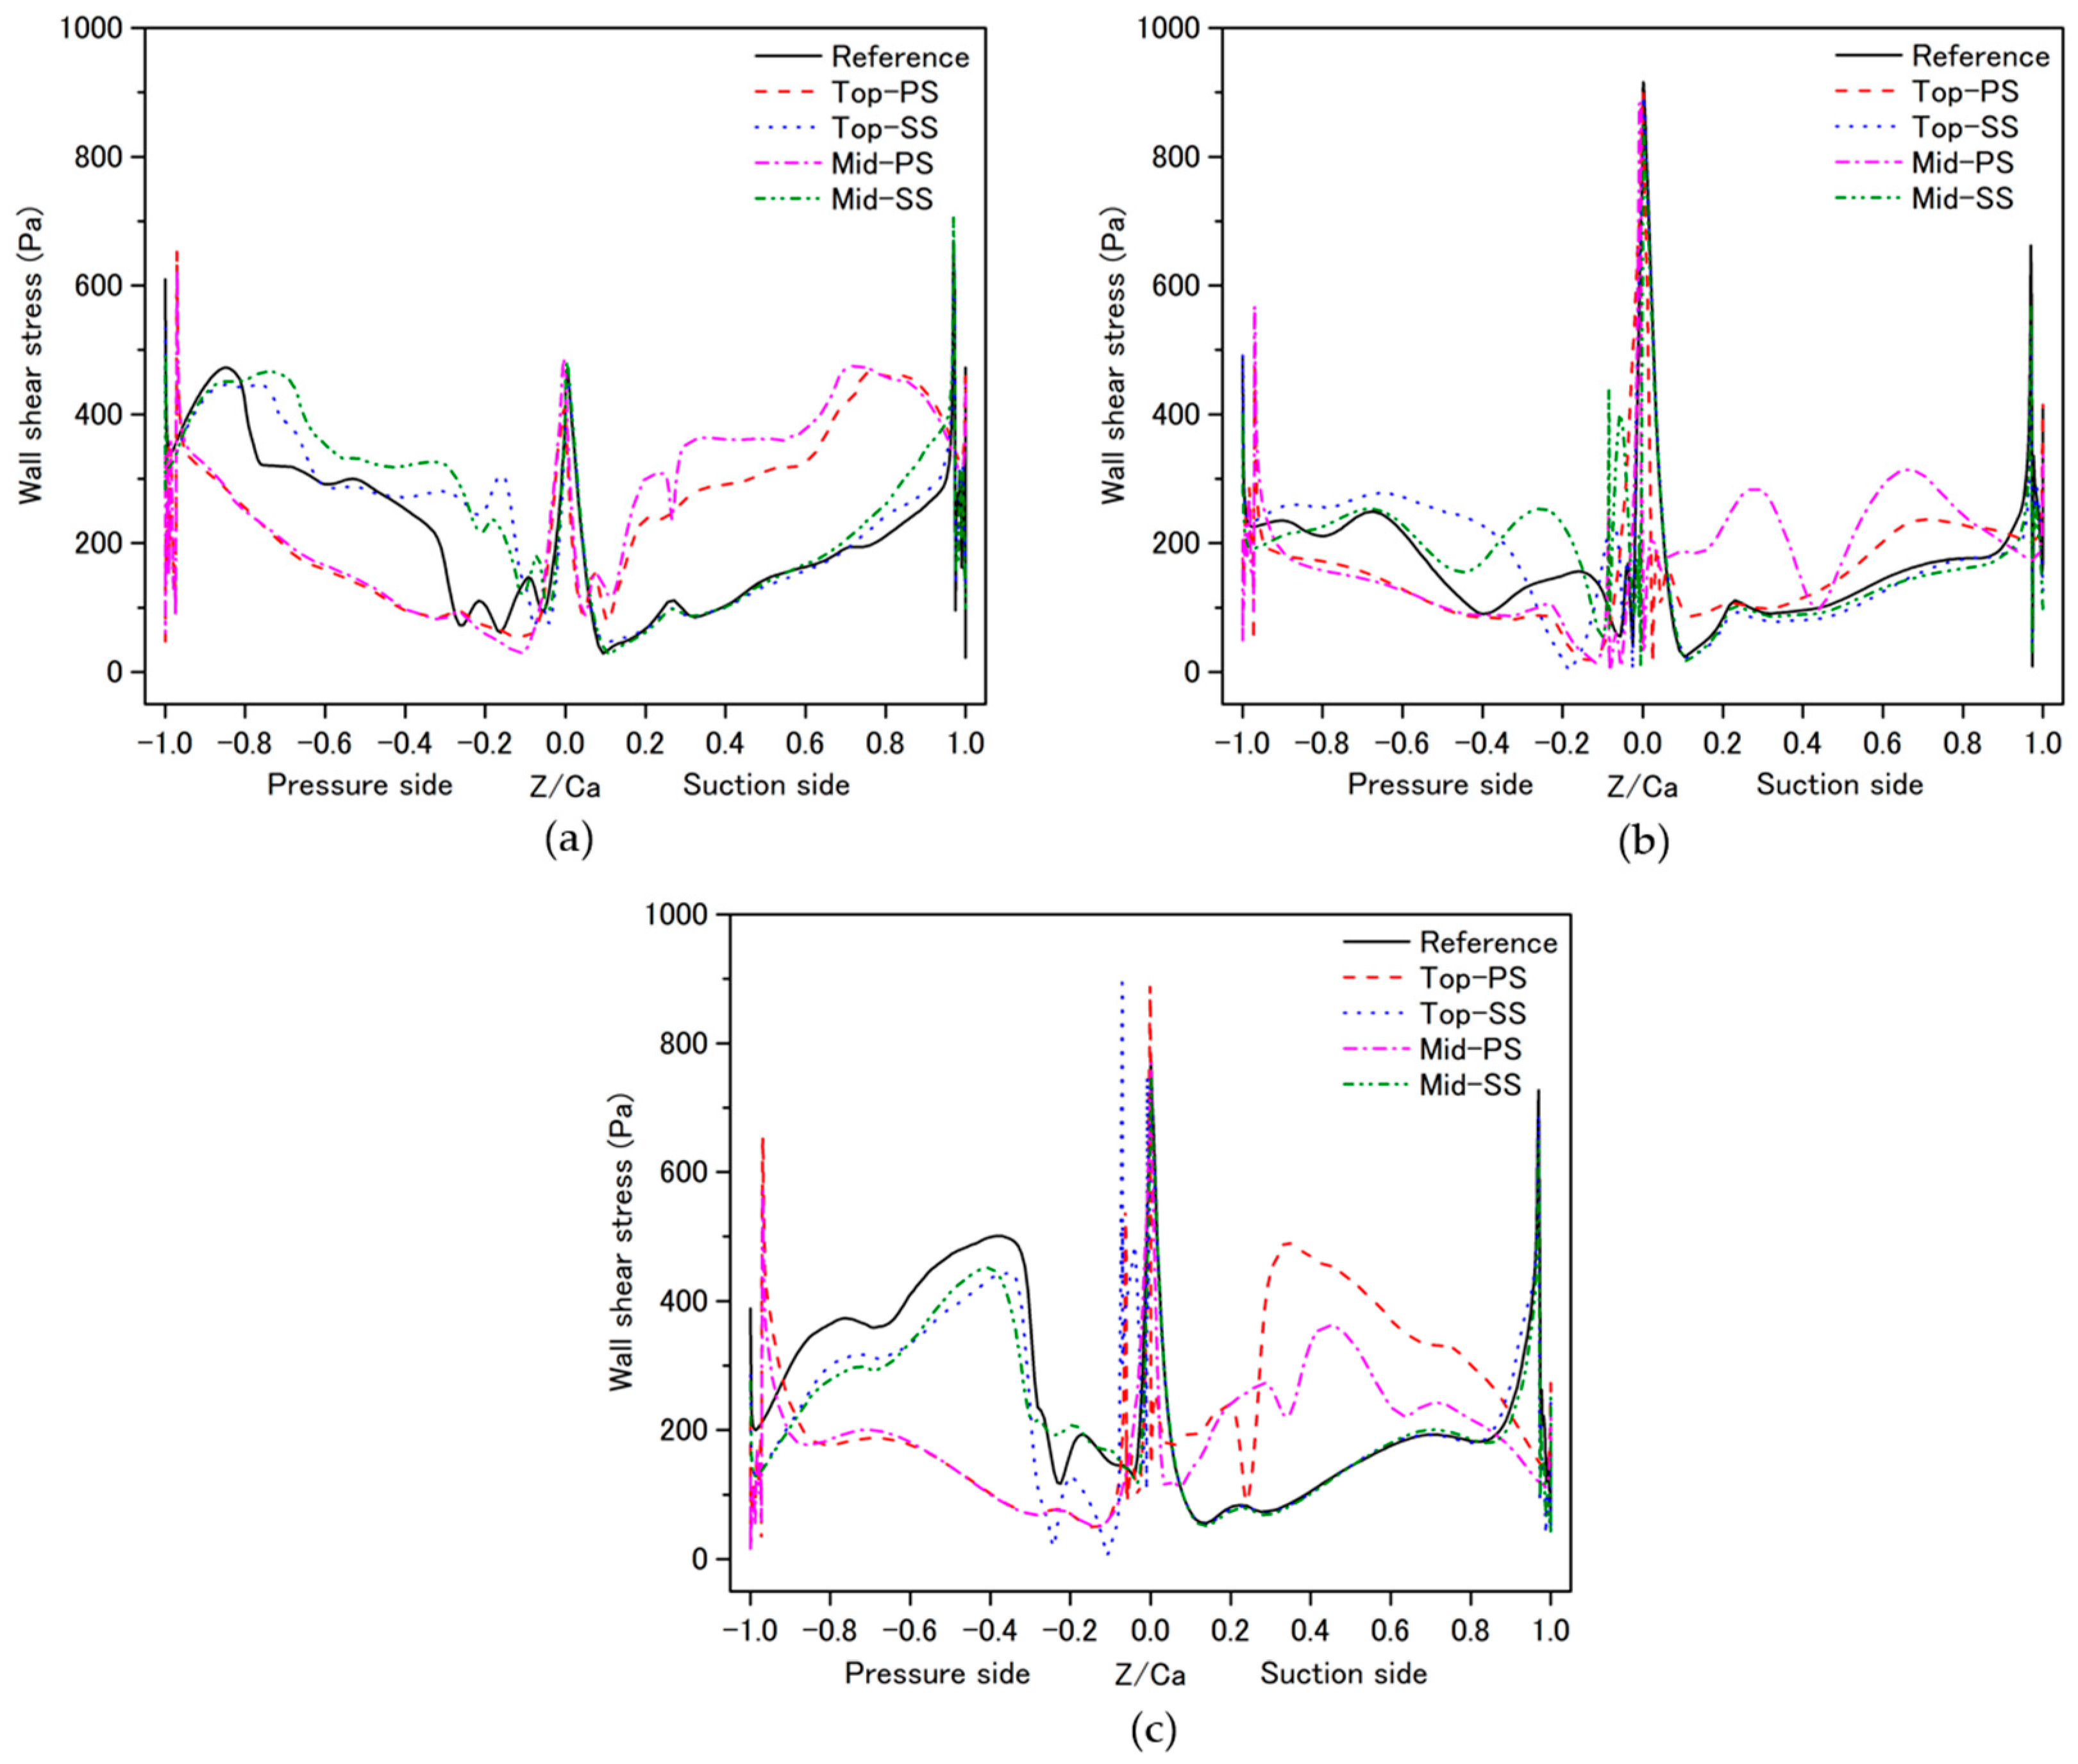
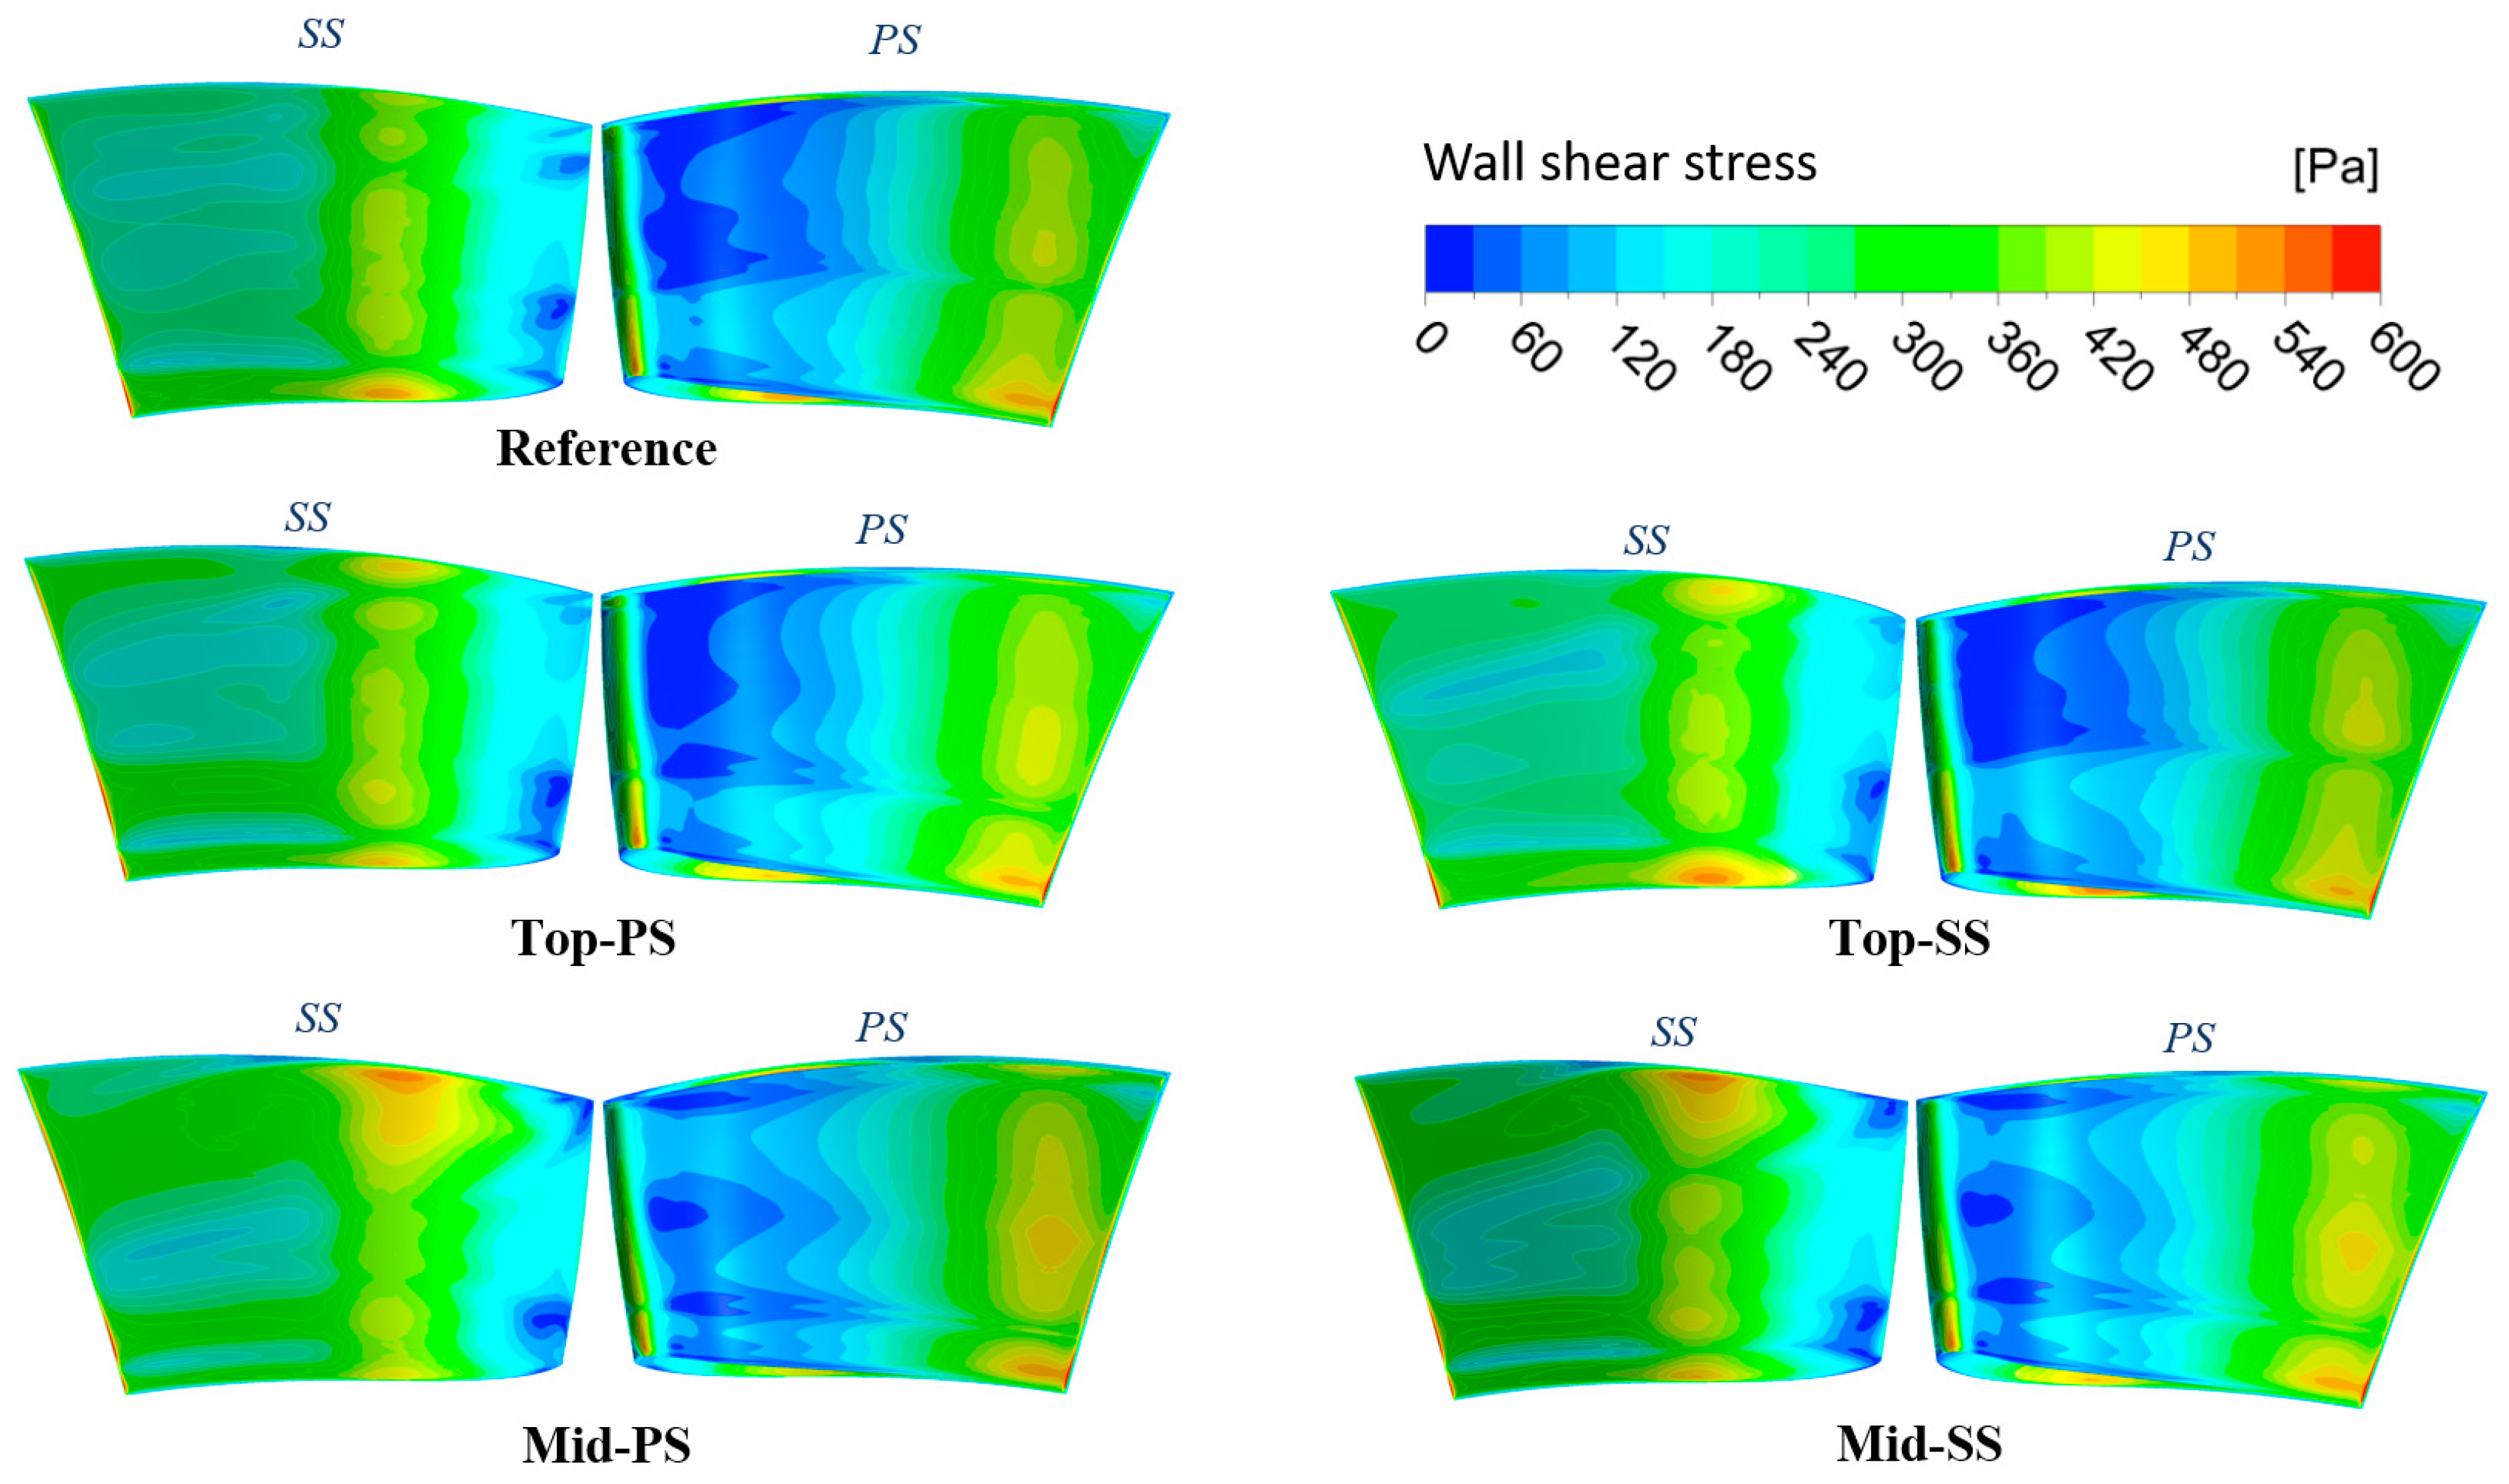
Figure 8 depicts the wall-shear-stress contour on the blade surface under different damage conditions. As can be observed, the wall-shear stress, in general, increases in all the damaged-rotor cases. The pressure-side contours exhibit extended regions of slightly increased wall-shear stress between the leading edge and 50% of the axial chord. Moreover, the rotor-damaged-blade conditions significantly affect the wall-shear stress over the entire suction surface. At the leading edge, for the damaged-rotor cases, the regions of low wall-shear stress are narrowed along the spanwise direction compared to the reference case. Accordingly, the region of high wall-shear stress near the midspan of the damaged rotor blade is widened. It is complicated to analyze the effects of the different rotor-damaged-blade conditions on the wall-shear stress based solely on the contour plots depicted in Figure 8. To address this concern, Figure 9 plots the wall-shear stress at different spanwise locations of the R1 blade surface. As can be observed, the effects of the damaged rotor blade are more noticeable on the wall-shear stresses at the near-hub and near-shroud sections. Moreover, blade damage on pressure side mainly affects the wall-shear stresses on the suction side and vice versa. Compared to the reference case, both cases of pressure-side damage exhibit higher wall-shear stresses on the blade suction side throughout the span. However, the corresponding suction-side damage cases lead to the generation of lower wall-shear stress on the blade pressure side, except at the shroud sections. The shroud region at the blade pressure side generates a complex vortex because the tip-leakage flow originates in this region. This explains the slightly different wall-shear stresses generated in the shroud region, which is highest in the reference case. However, the overall results may not be affected. These results only help us to highlight the effects of damage on the wall shear stress in some critical regions. In general, the damages on the pressure side or suction side have more significant effects on the wall shear stress than the effects of damage occurring at the middle or top of the blade.
Figure 10 depicts the wall-shear stress distribution on the S2-vane surface under different rotor-blade damage conditions. Generally, no significant differences can be observed between these cases, even though the near-midspan damage cases involve greater tip-leakage flows. A slight difference is observed in the hub and shroud stress distributions on the suction side. These minor effects might not have an impact on the aerodynamic behavior of the S2 vane. Therefore, the effects of rotor blade conditions on the aerodynamic characteristics of the S2 vane can be neglected.
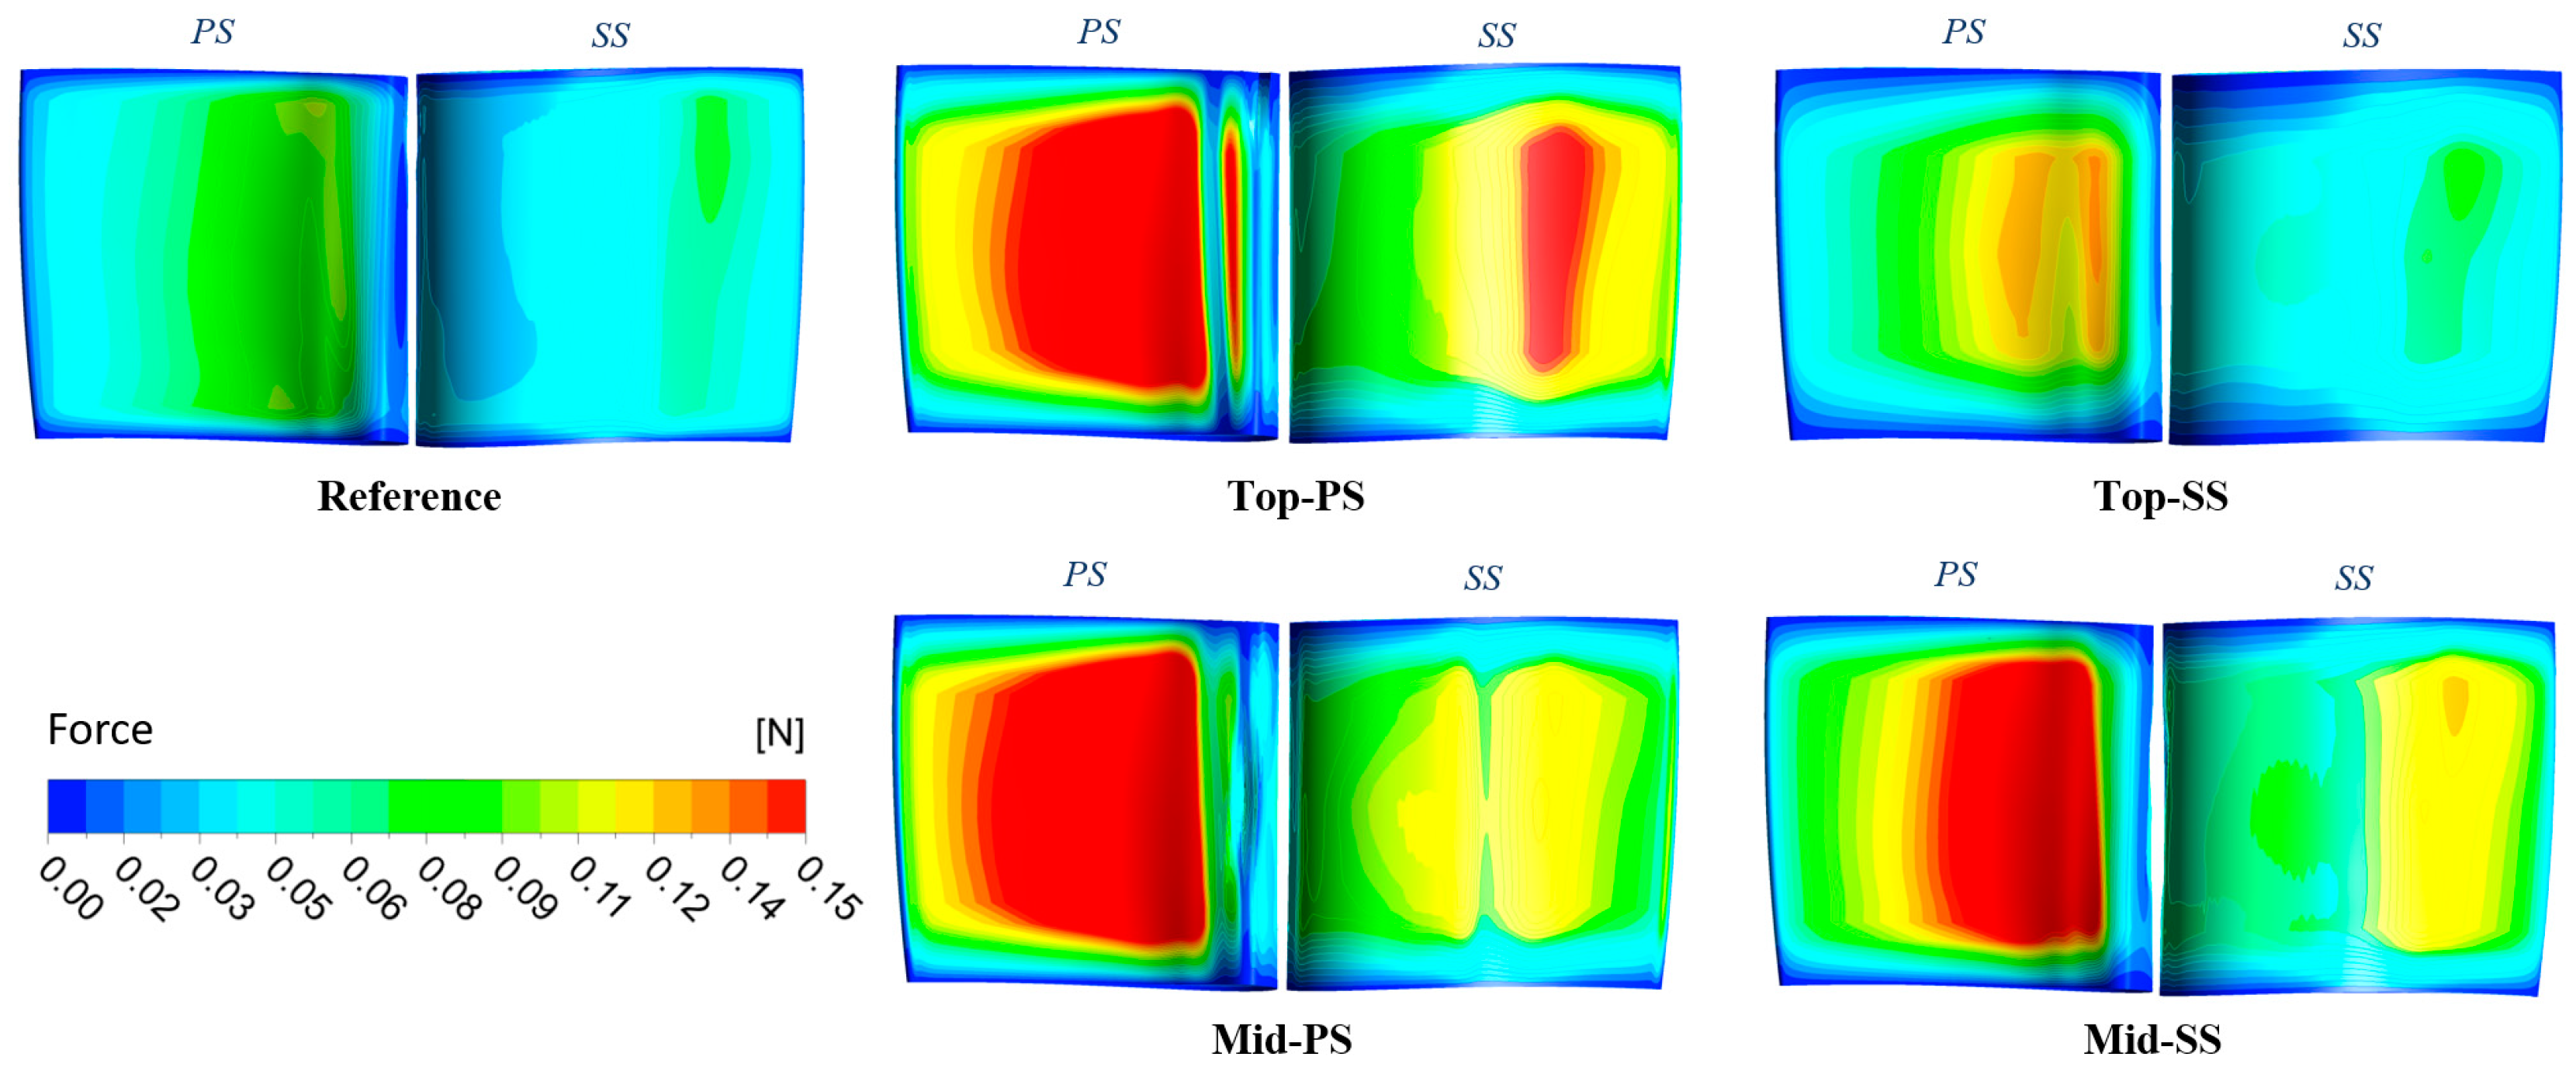
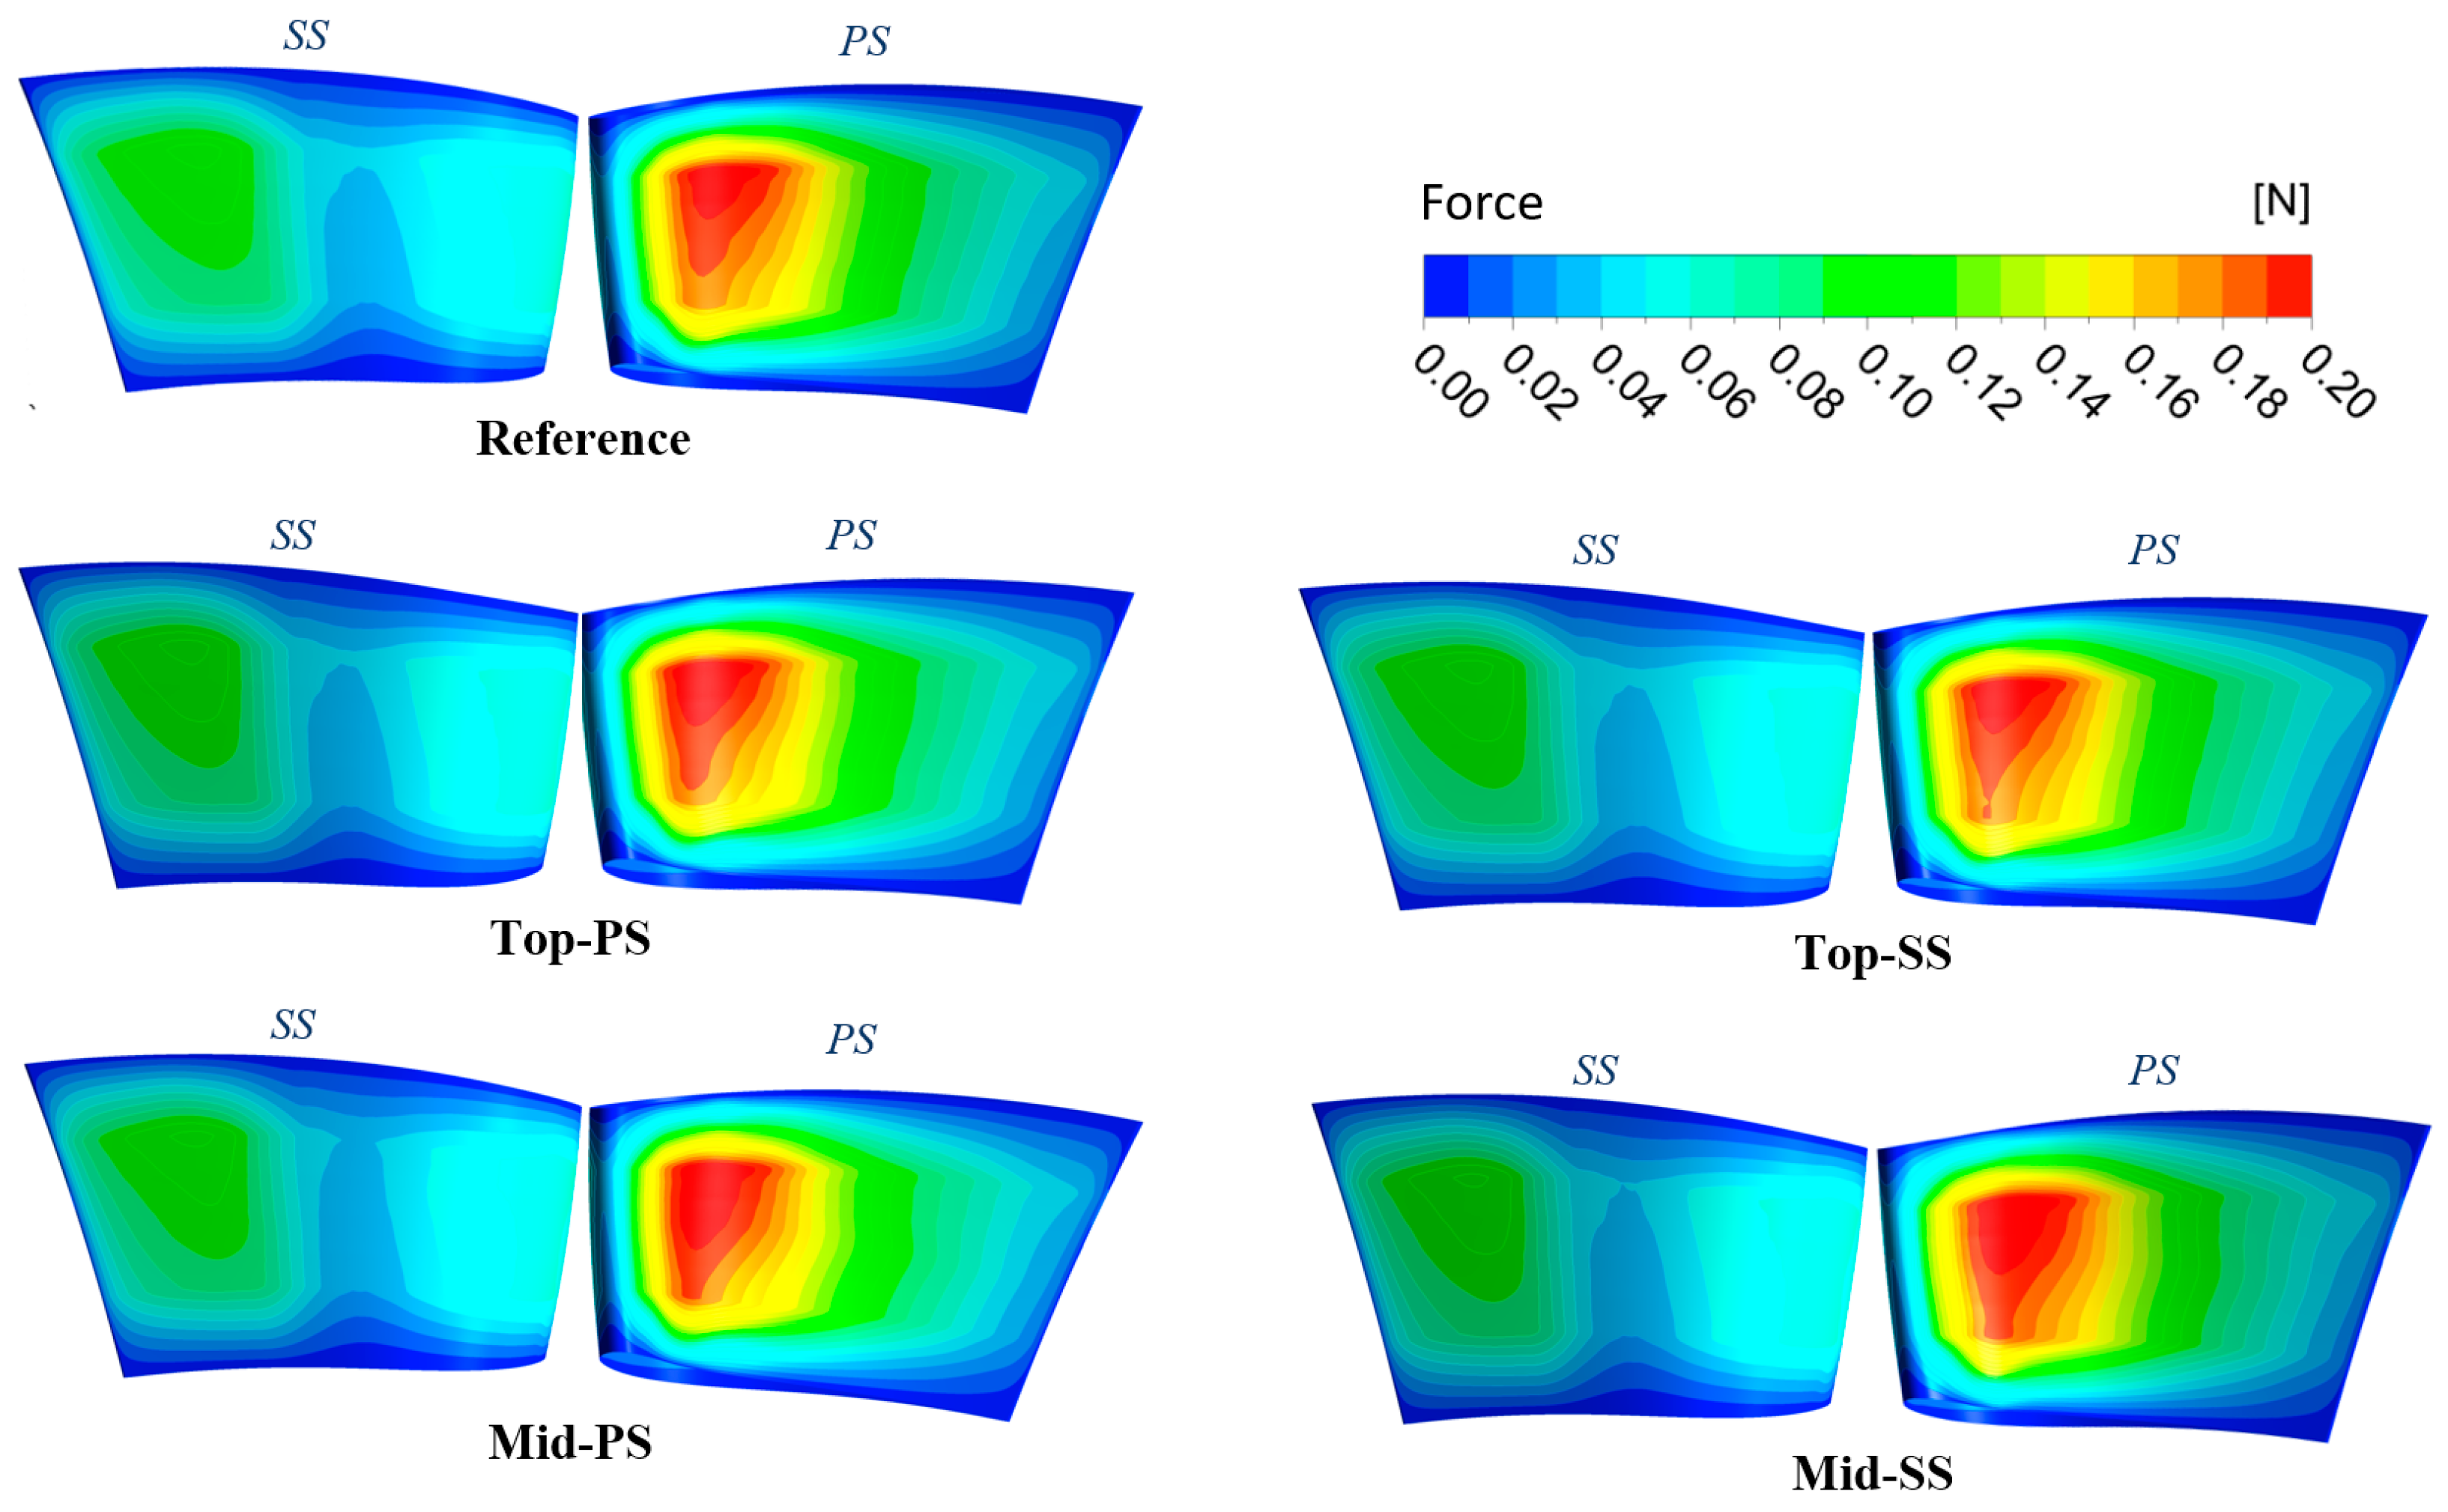
Figure 11 and Figure 12 depict the force distributions on the R1-blade and S2-vane surfaces, respectively. Compared to the reference case, the damaged-rotor cases result in the generation of a greater force on the pressure and suction sides of the blade surface. On the pressure side, the surface force demonstrates a sudden increase owing to the rotor imbalance caused by the damage. These regions of increased surface force extend over the entire pressure side, whereas they remain concentrated between the leading edge and 40% of the axial chord on the suction side (Figure 11). This results in significantly increased mechanical stresses on the blade surface, thereby reducing its fatigue life. Conversely, no effects of the rotor-blade surface conditions are observed on the S2-vane surface (Figure 12). No significant difference is observed among the individual damage cases. The region of higher surface force remains concentrated between the leading edge and 50% axial chord on the pressure side. On the suction side, it extends from approximately 60% of the axial chord up to the trailing edge. These results are consistent with those inferred from Figure 8 and Figure 10. In conclusion, the rotor-blade conditions strongly affect the aerodynamic force acting on the blade surface, with a negligible impact on the vane-surface force. These results are expected to equip turbine-blade designers with useful knowledge concerning the effects of minor blade damages on the aerodynamic force acting on the blade and vane surfaces. Accordingly, effective means can be devised to protect the turbine blades from such damages, thereby increasing their fatigue life.

3.3. Heat-Transfer Characteristics

To quantify the heat-transfer characteristics of the blade and vane surfaces, the heat-transfer coefficient (HTC) can be expressed as:
h = q / ( T a T i )
where h denotes the HTC, q denotes the heat flux computed from the isothermal condition, T a denotes the adiabatic surface temperature, and T i denotes the temperature applied to the blade and vane surfaces during the isothermal simulation.
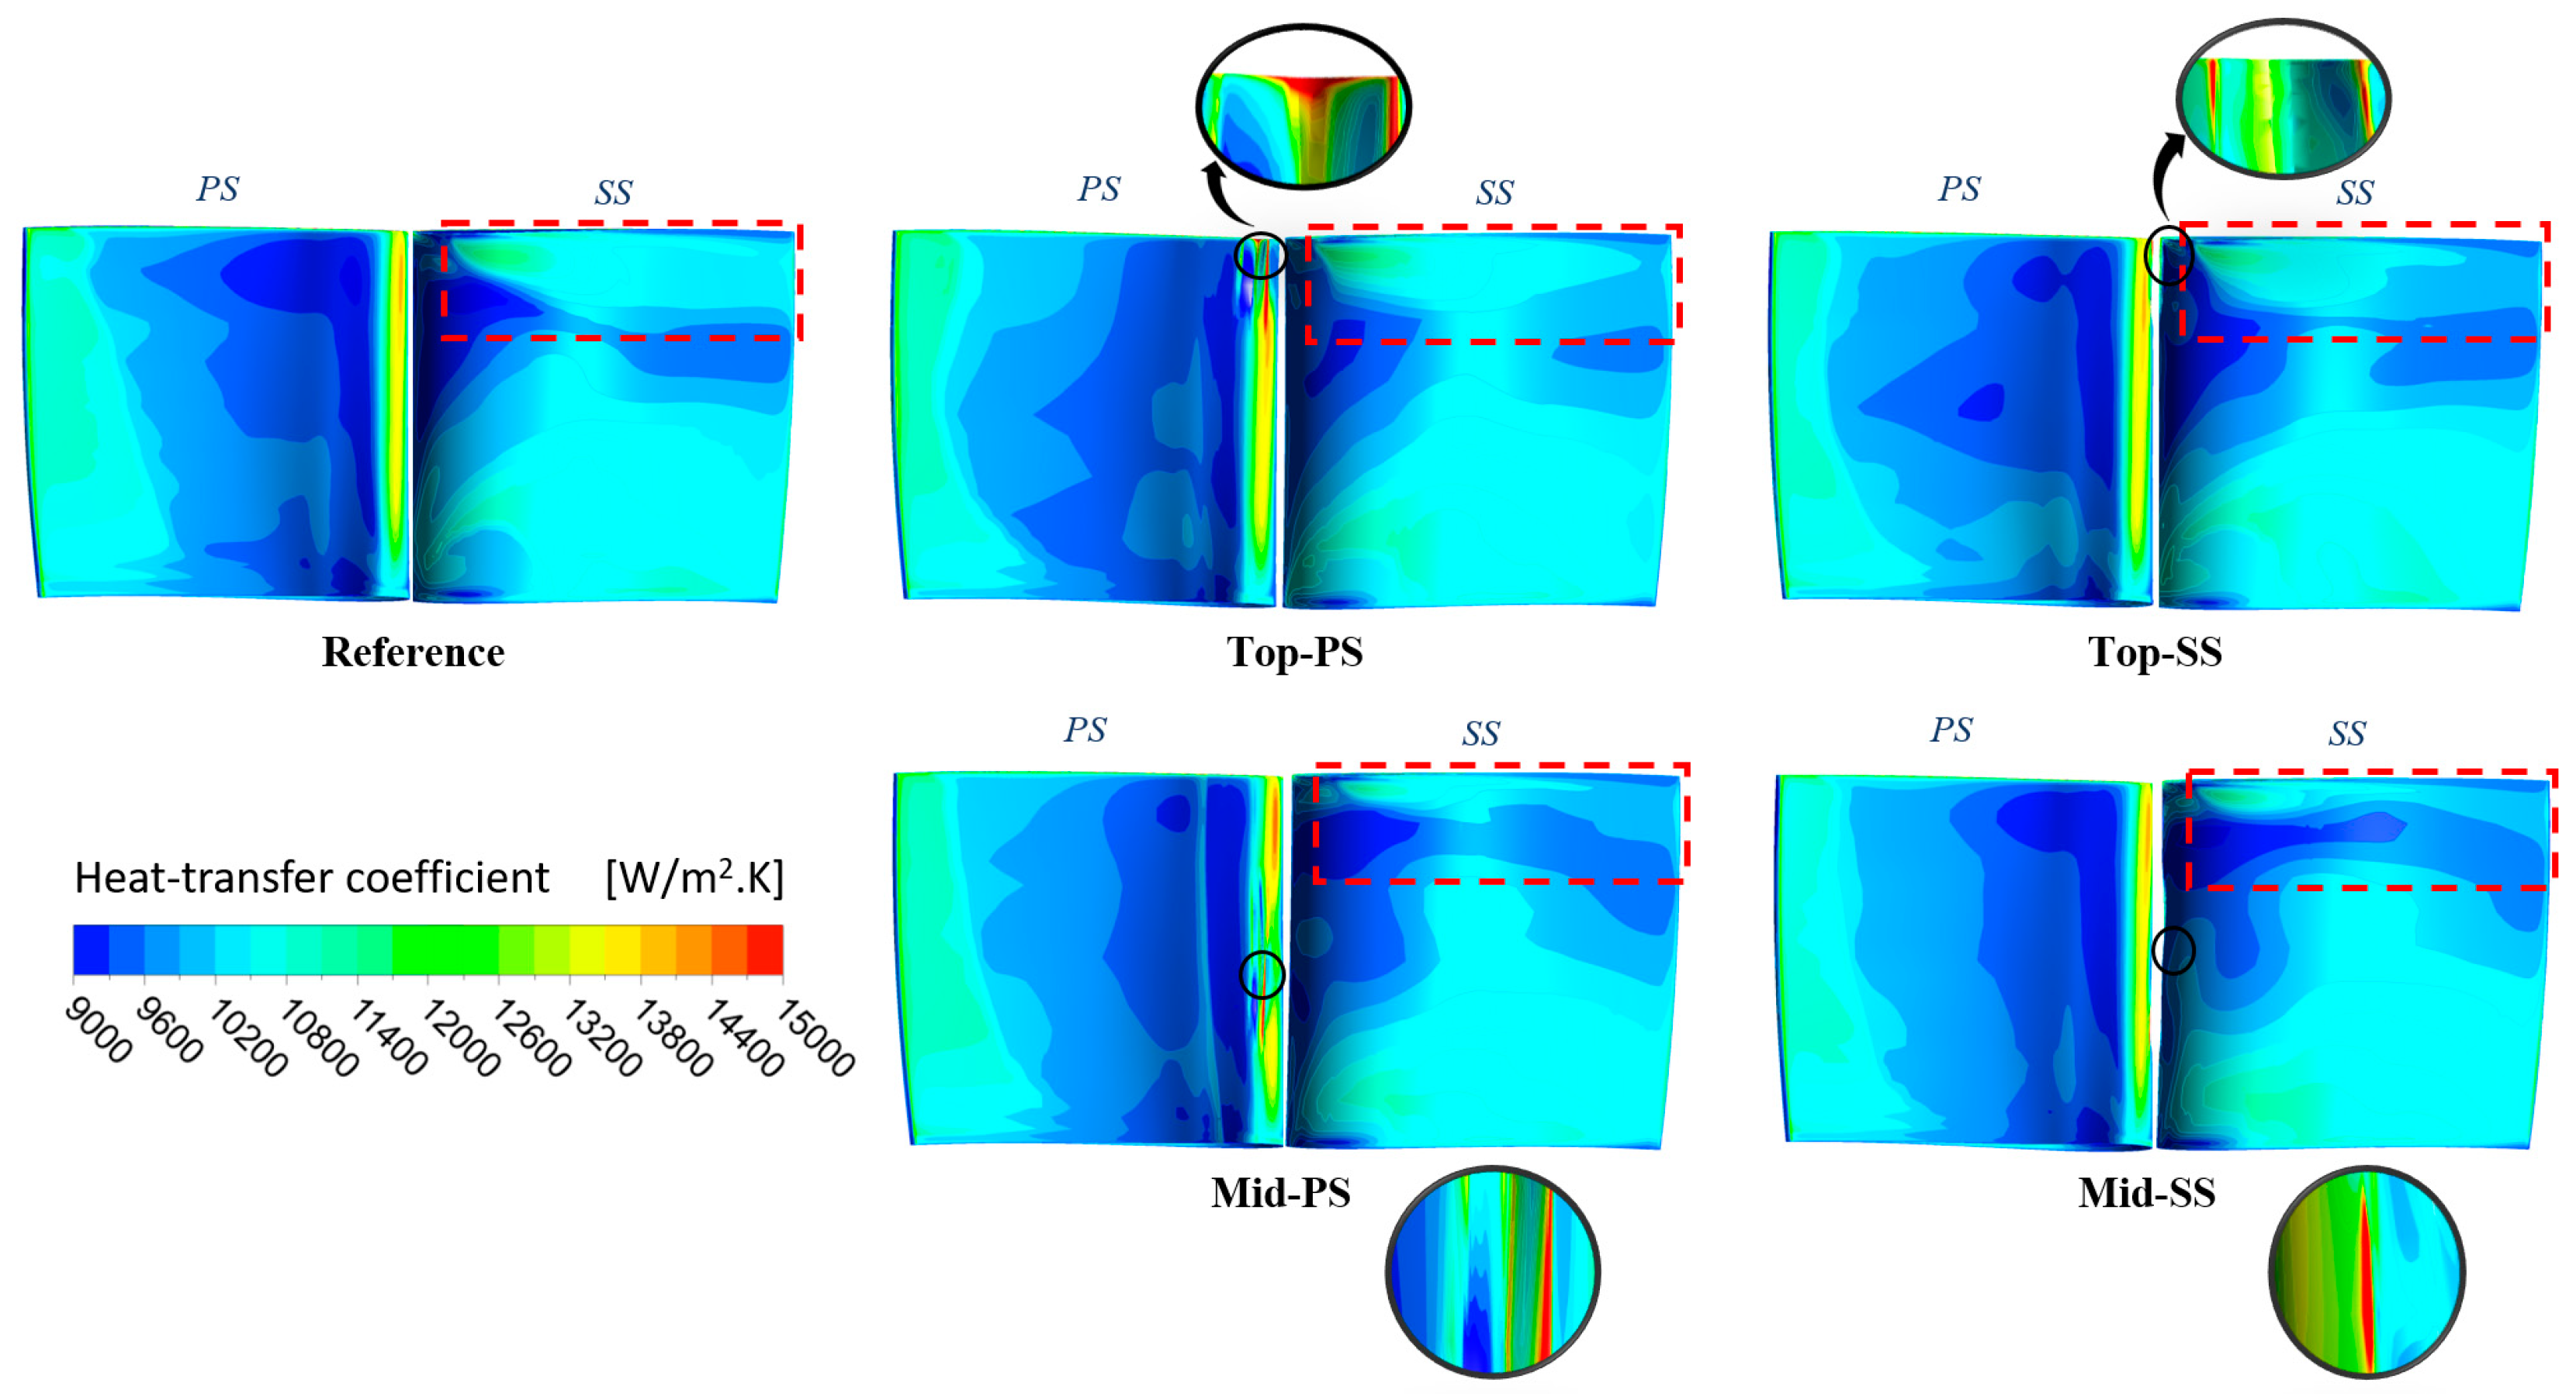
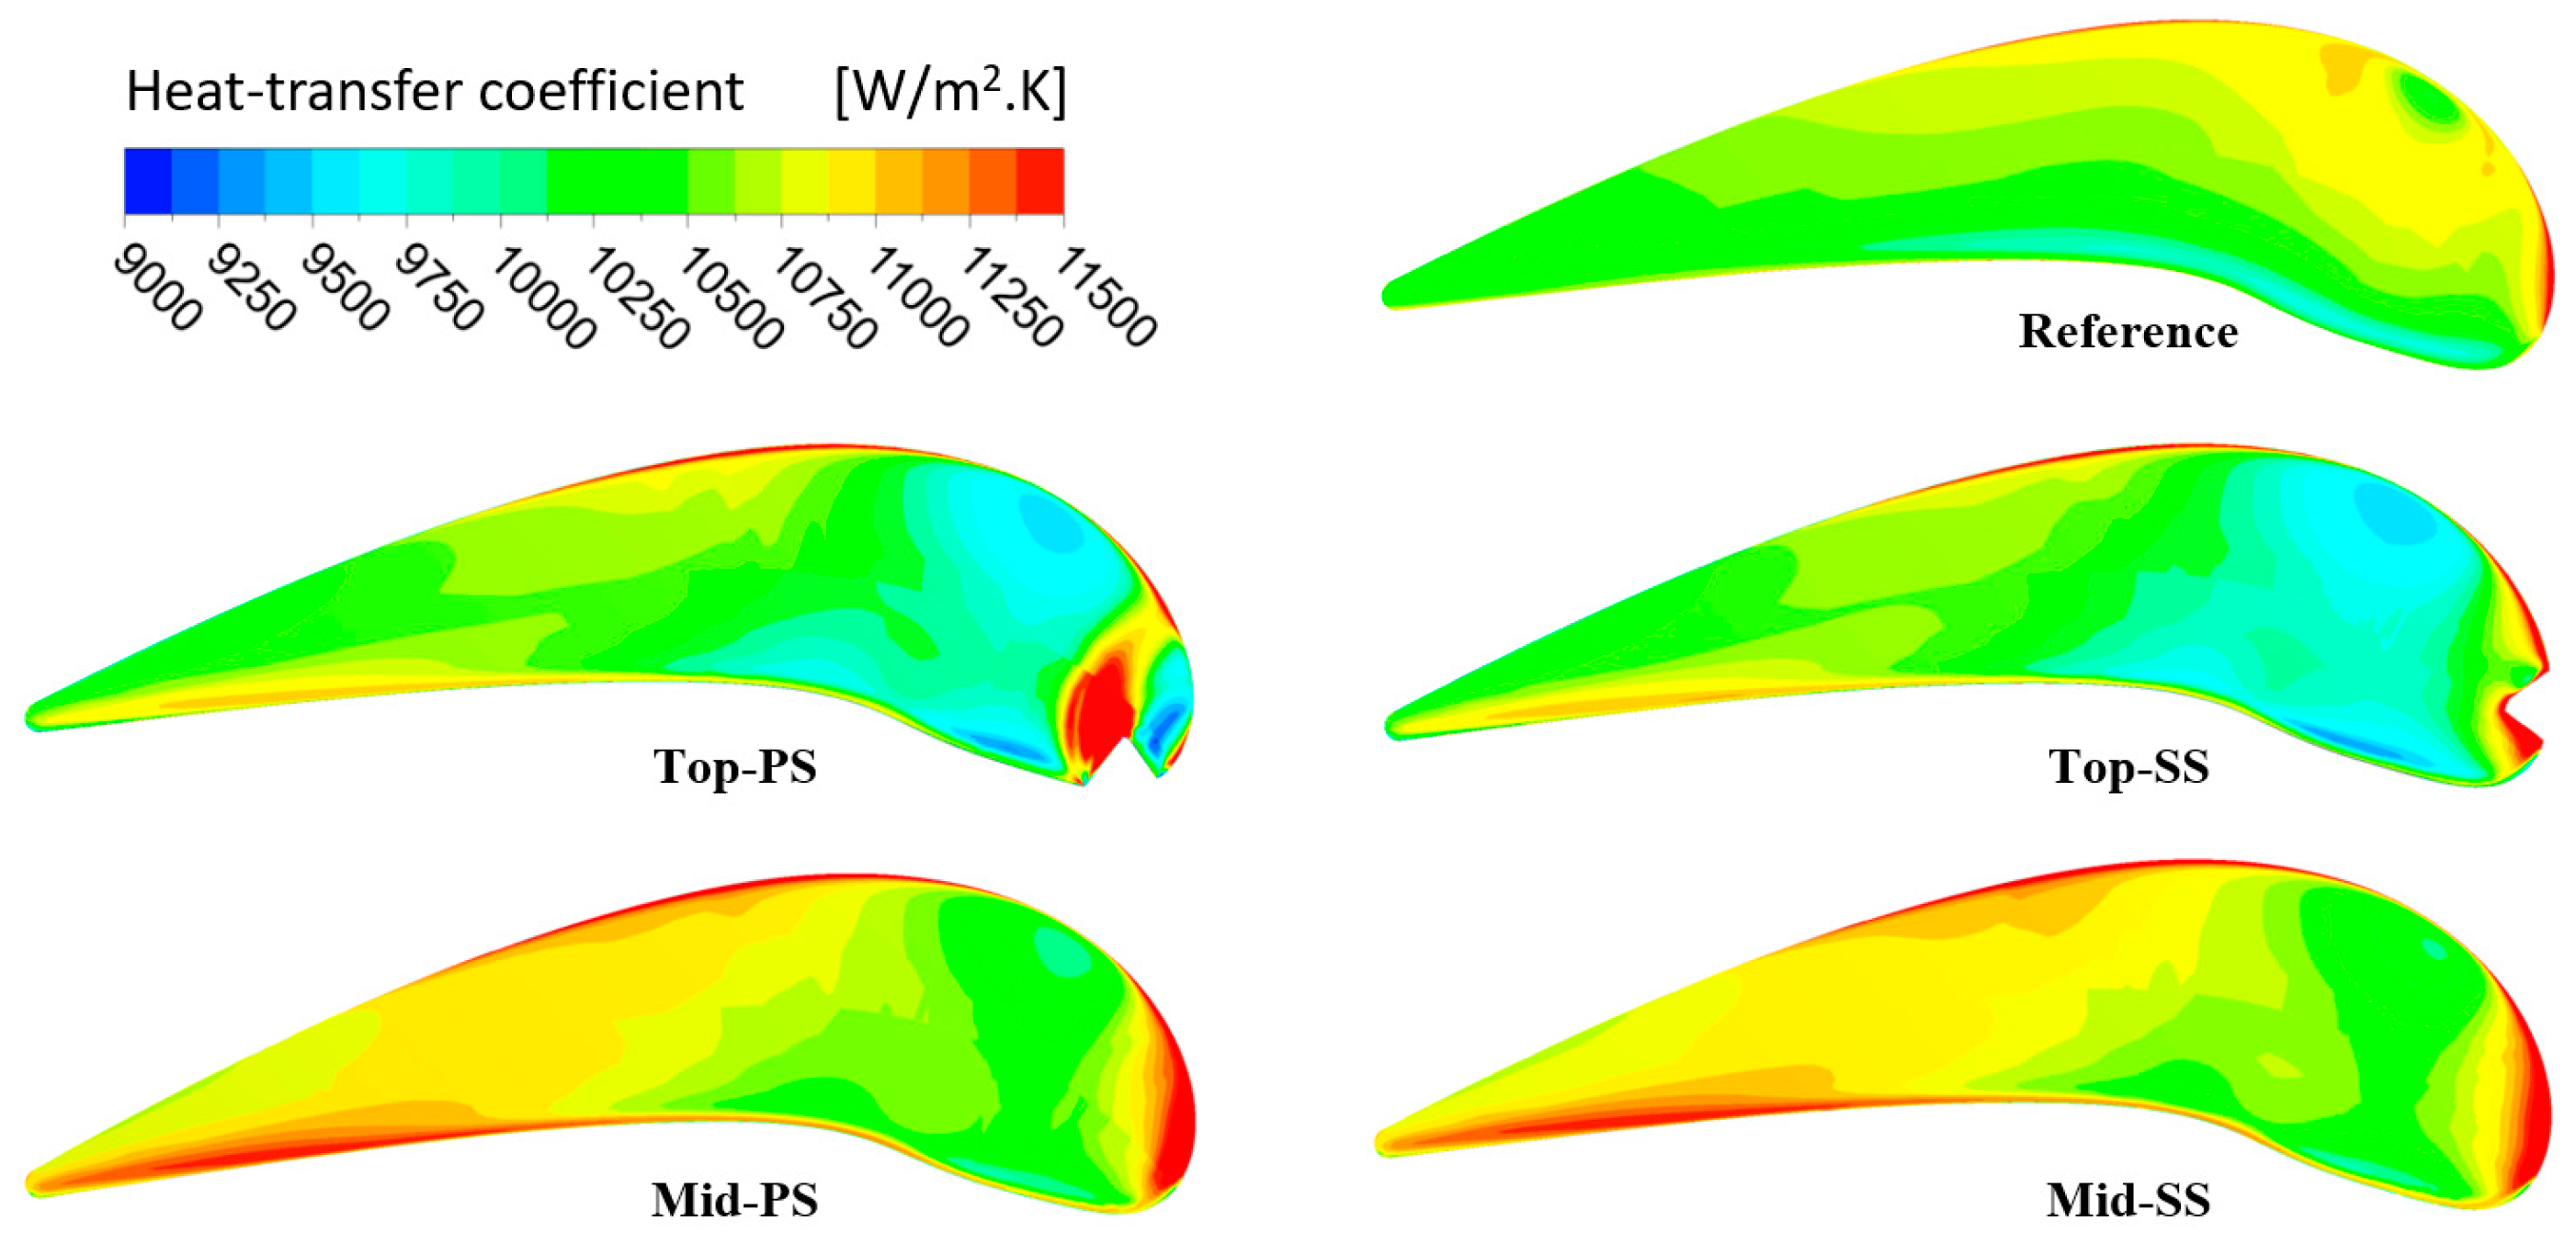
Figure 13 depicts the HTC contours on the rotor-blade surface under different rotor-damaged-blade conditions. The HTC is calculated by dividing the heat flux extracted from the isothermal condition for the difference of averaged temperature between the adiabatic condition and the temperature applied for isothermal condition on the blades/vanes surface, as produced in Equation (26). Our study does not include the solid part for the turbine’s blades and vanes. Therefore, we used this kind of calculation to compute the HTC. As can be observed, the low-heat-transfer regions on the pressure side widen toward the trailing edge under the damaged-blade conditions. By contrast, the corresponding regions on the suction side expand along the radial and spanwise directions near the blade shroud. Although the regions of high HTCs appear narrowed, all the damaged-rotor-blade cases yield an increased overall HTC compared to the reference case. Moreover, the significantly high HTC values exist near the locations of blade damage, represented by black circles in Figure 13. In addition, the aforementioned tip-leakage effects cause an increase in the blade-tip HTC.
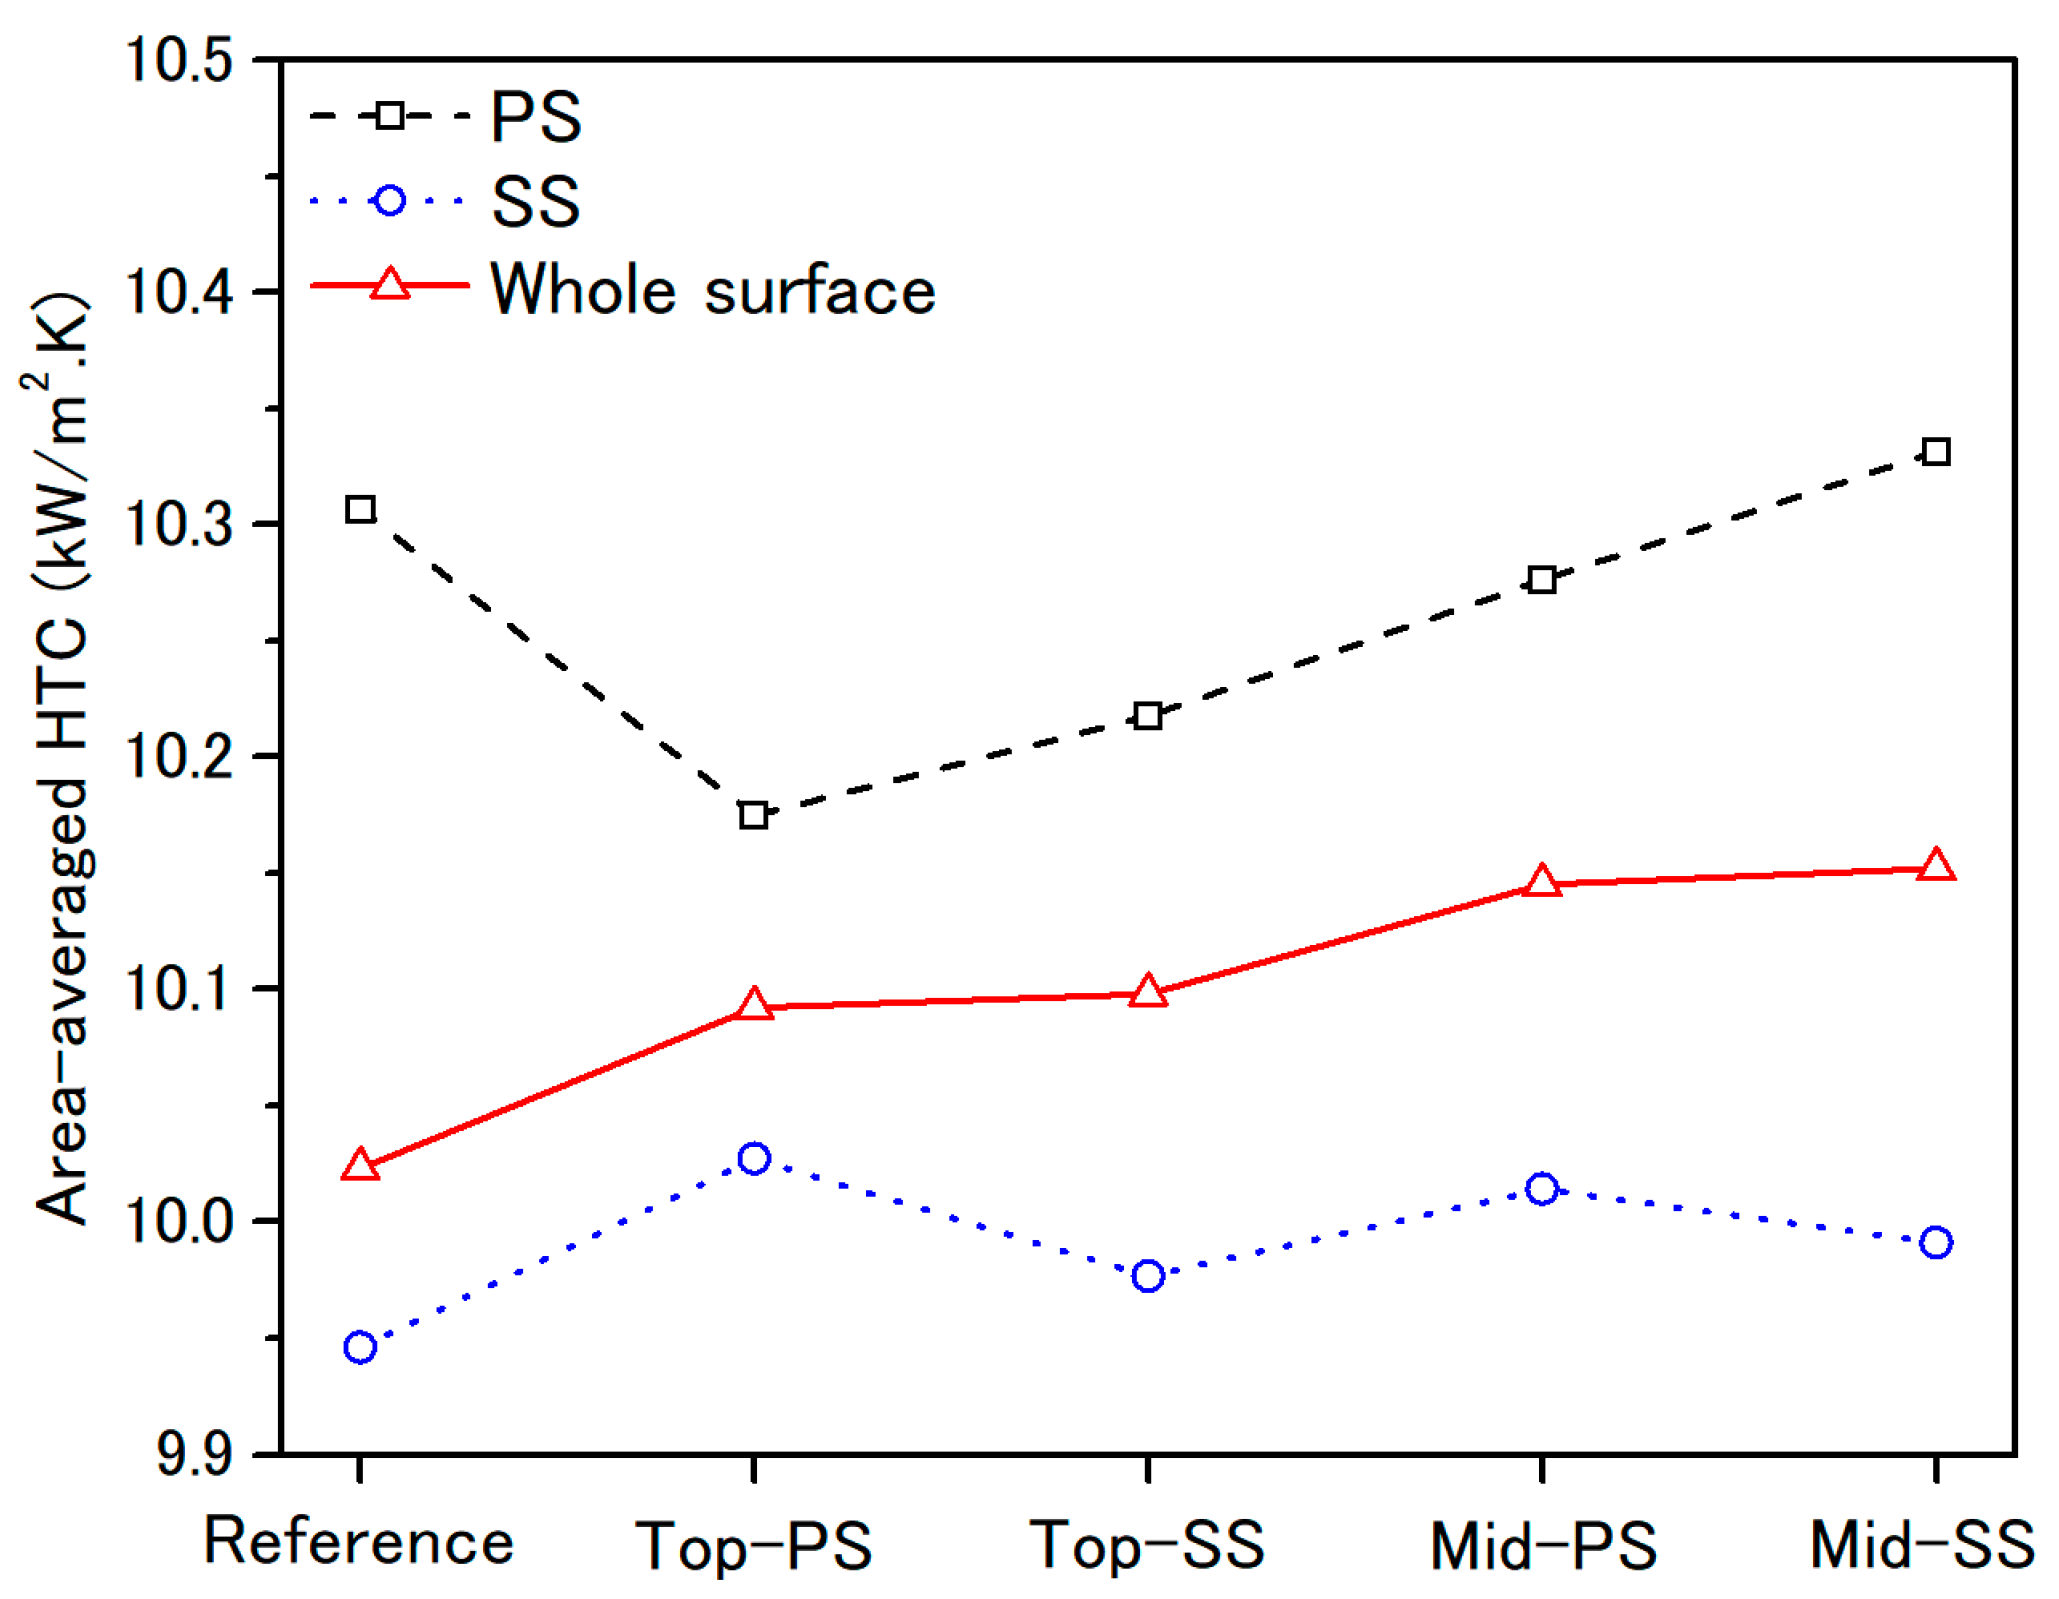
Figure 14 depicts the area-averaged HTC values on the R1-blade surface under different rotor-damage conditions. As can be observed, the HTCs on the blade pressure side in the damaged-blade cases remain below the corresponding reference-case values. The case involving blade damage on the midspan suction surface is an exception to this finding. Conversely, the HTC on the blade suction side in the damaged cases exceeds the corresponding reference-case value. Considering the HTC increase in the blade-tip region and around the damage locations, the HTC of the entire blade increases by 1% and 1.3% when it is damaged in the near-tip and near-midspan regions, respectively. This causes a corresponding increase in the blade surface’s thermal stress and reduces the fatigue life of the damaged blade.
Figure 15 depicts the HTC distribution in the blade-tip region under different rotor damaged-blade conditions. Compared to the reference case, the damage cases exhibit increased heat transfer, especially around the damage locations. The HTCs observed in the near-midspan damage cases remarkably exceed those observed in the near-tip damage cases. In the near-tip damage cases, the HTCs demonstrate a significant increase around the damage locations owing to the effects of the leakage flow passing around the damage locations. In the near-midspan damage cases, the HTCs increase over the entire blade-tip surface owing to the increased tip-leakage flow. These findings are consistent with those inferred from Figure 4 and reported in [5].
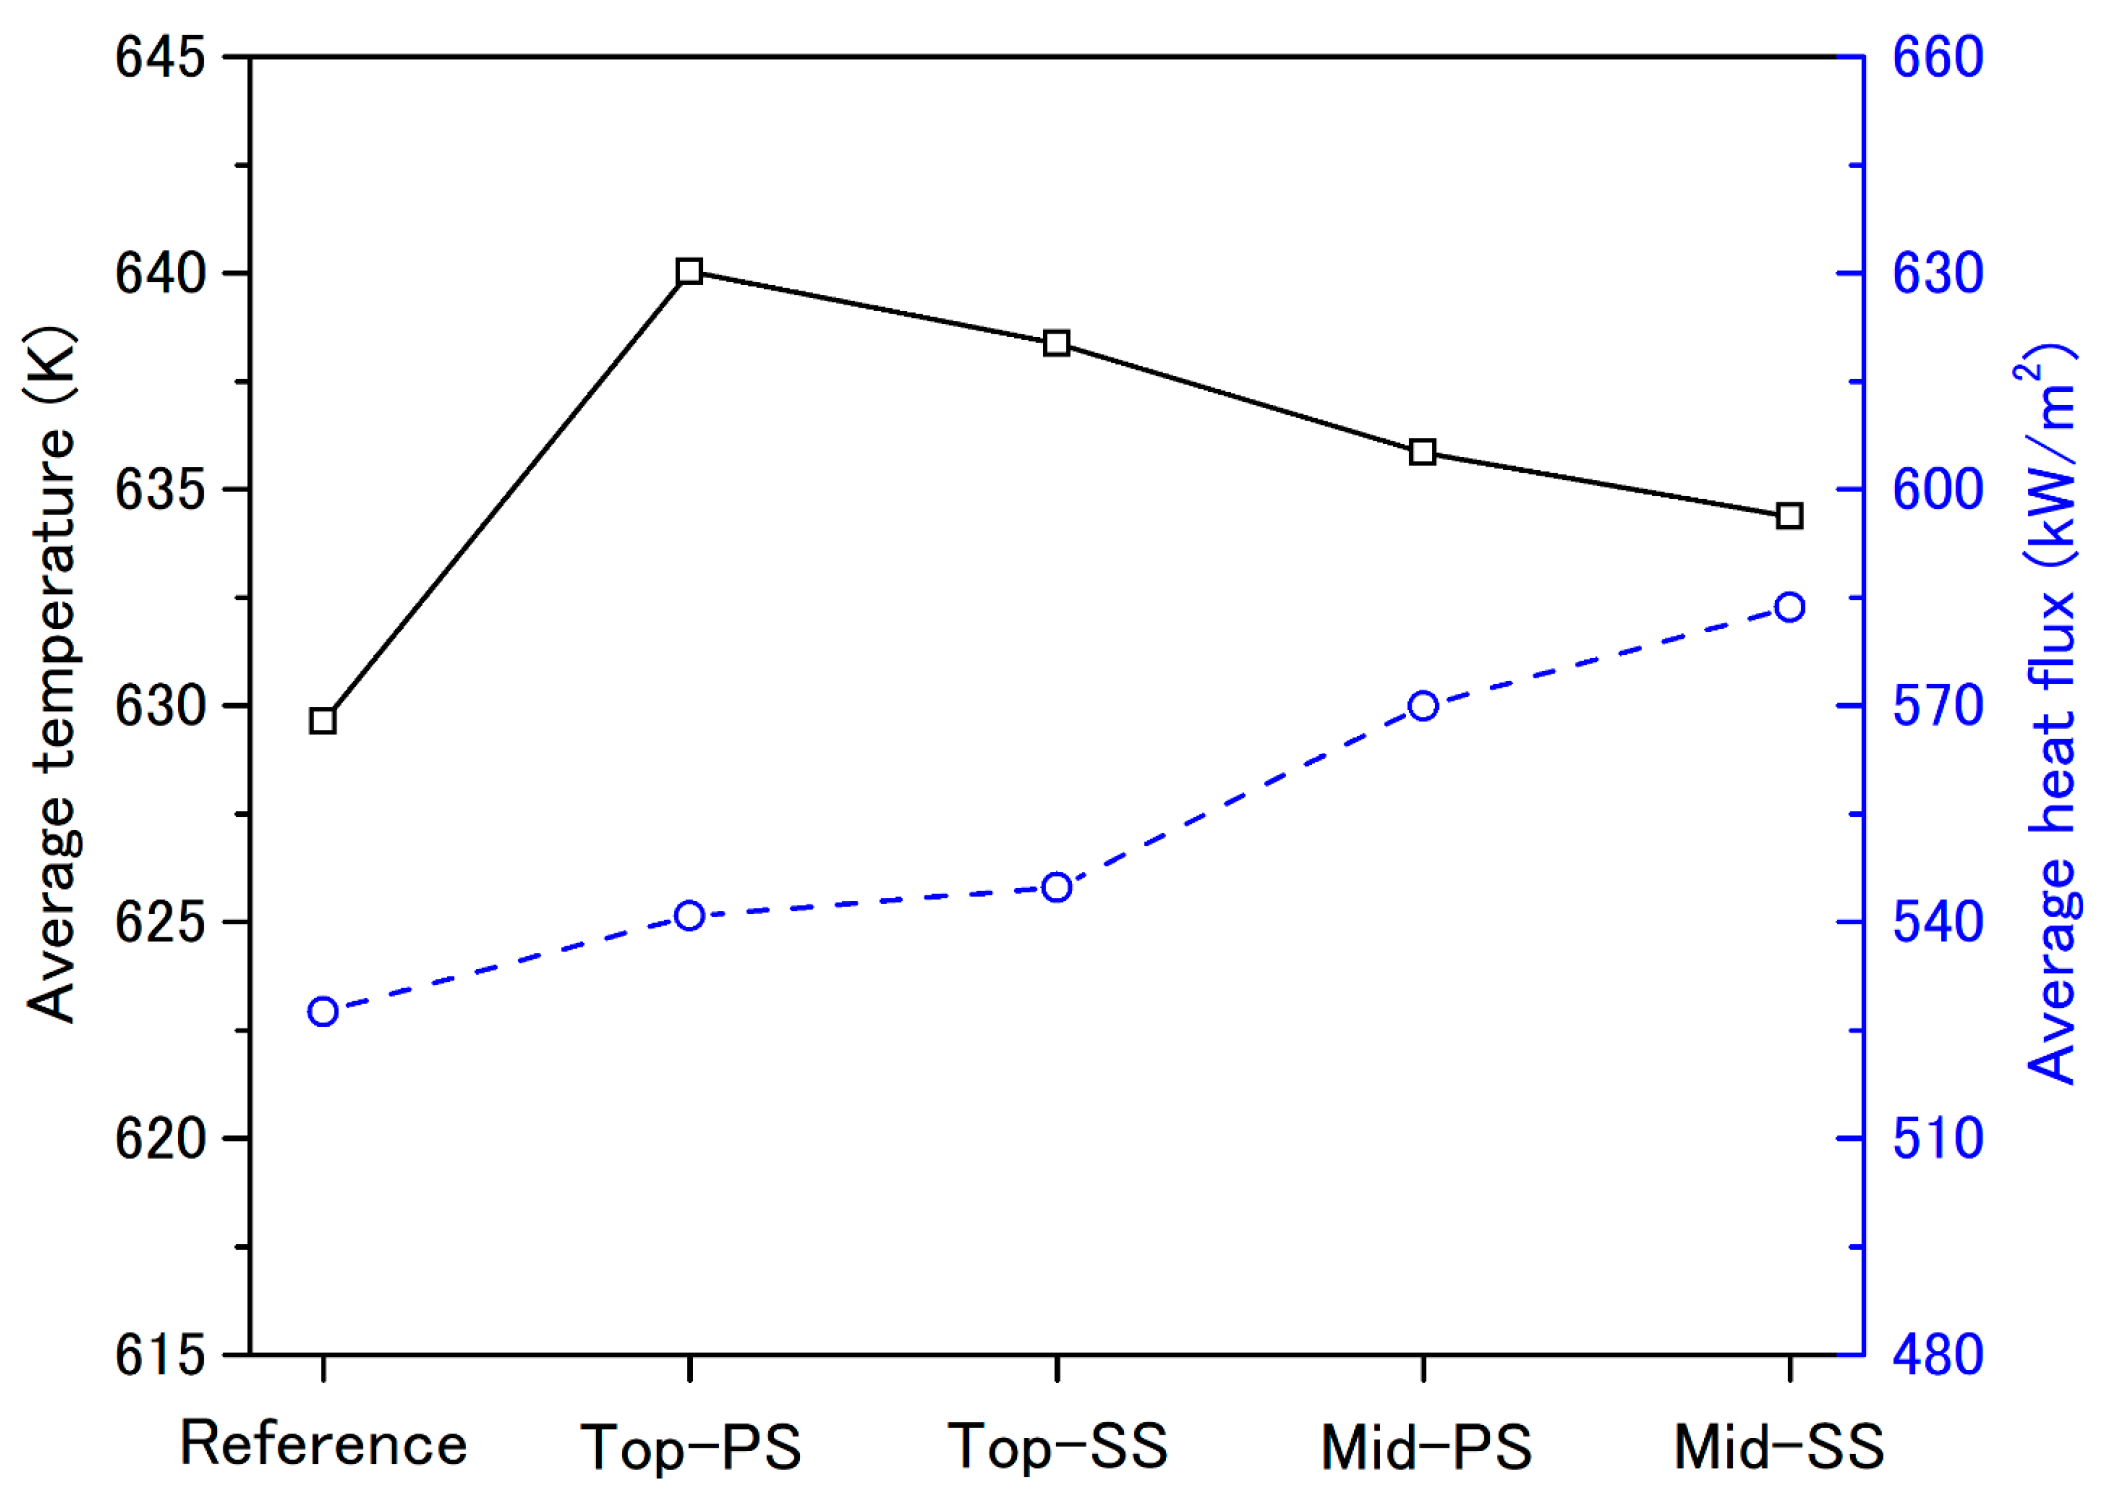
Figure 16 depicts the average blade-tip-surface temperatures and heat fluxes under different damaged-blade conditions to explain the complex heat-transfer phenomenon that is manifested in this region. The figure reveals that the heat flux demonstrates a more noticeable increase compared to the temperature. The most significant increase in the average temperature equals 1.6% (compared to the reference case) in the case involving near-tip damage on the pressure side owing to the effects of tip-leakage flow around the damage location. The maximum increase in the average heat flux equals 11.4% (compared to the reference case) and is observed in the case involving near-midspan damage on the suction side. Overall, the damaged rotor blade tends to significantly increase the heat-transfer characteristics on the blade surface, especially in regions close to the damage locations and the blade tip.
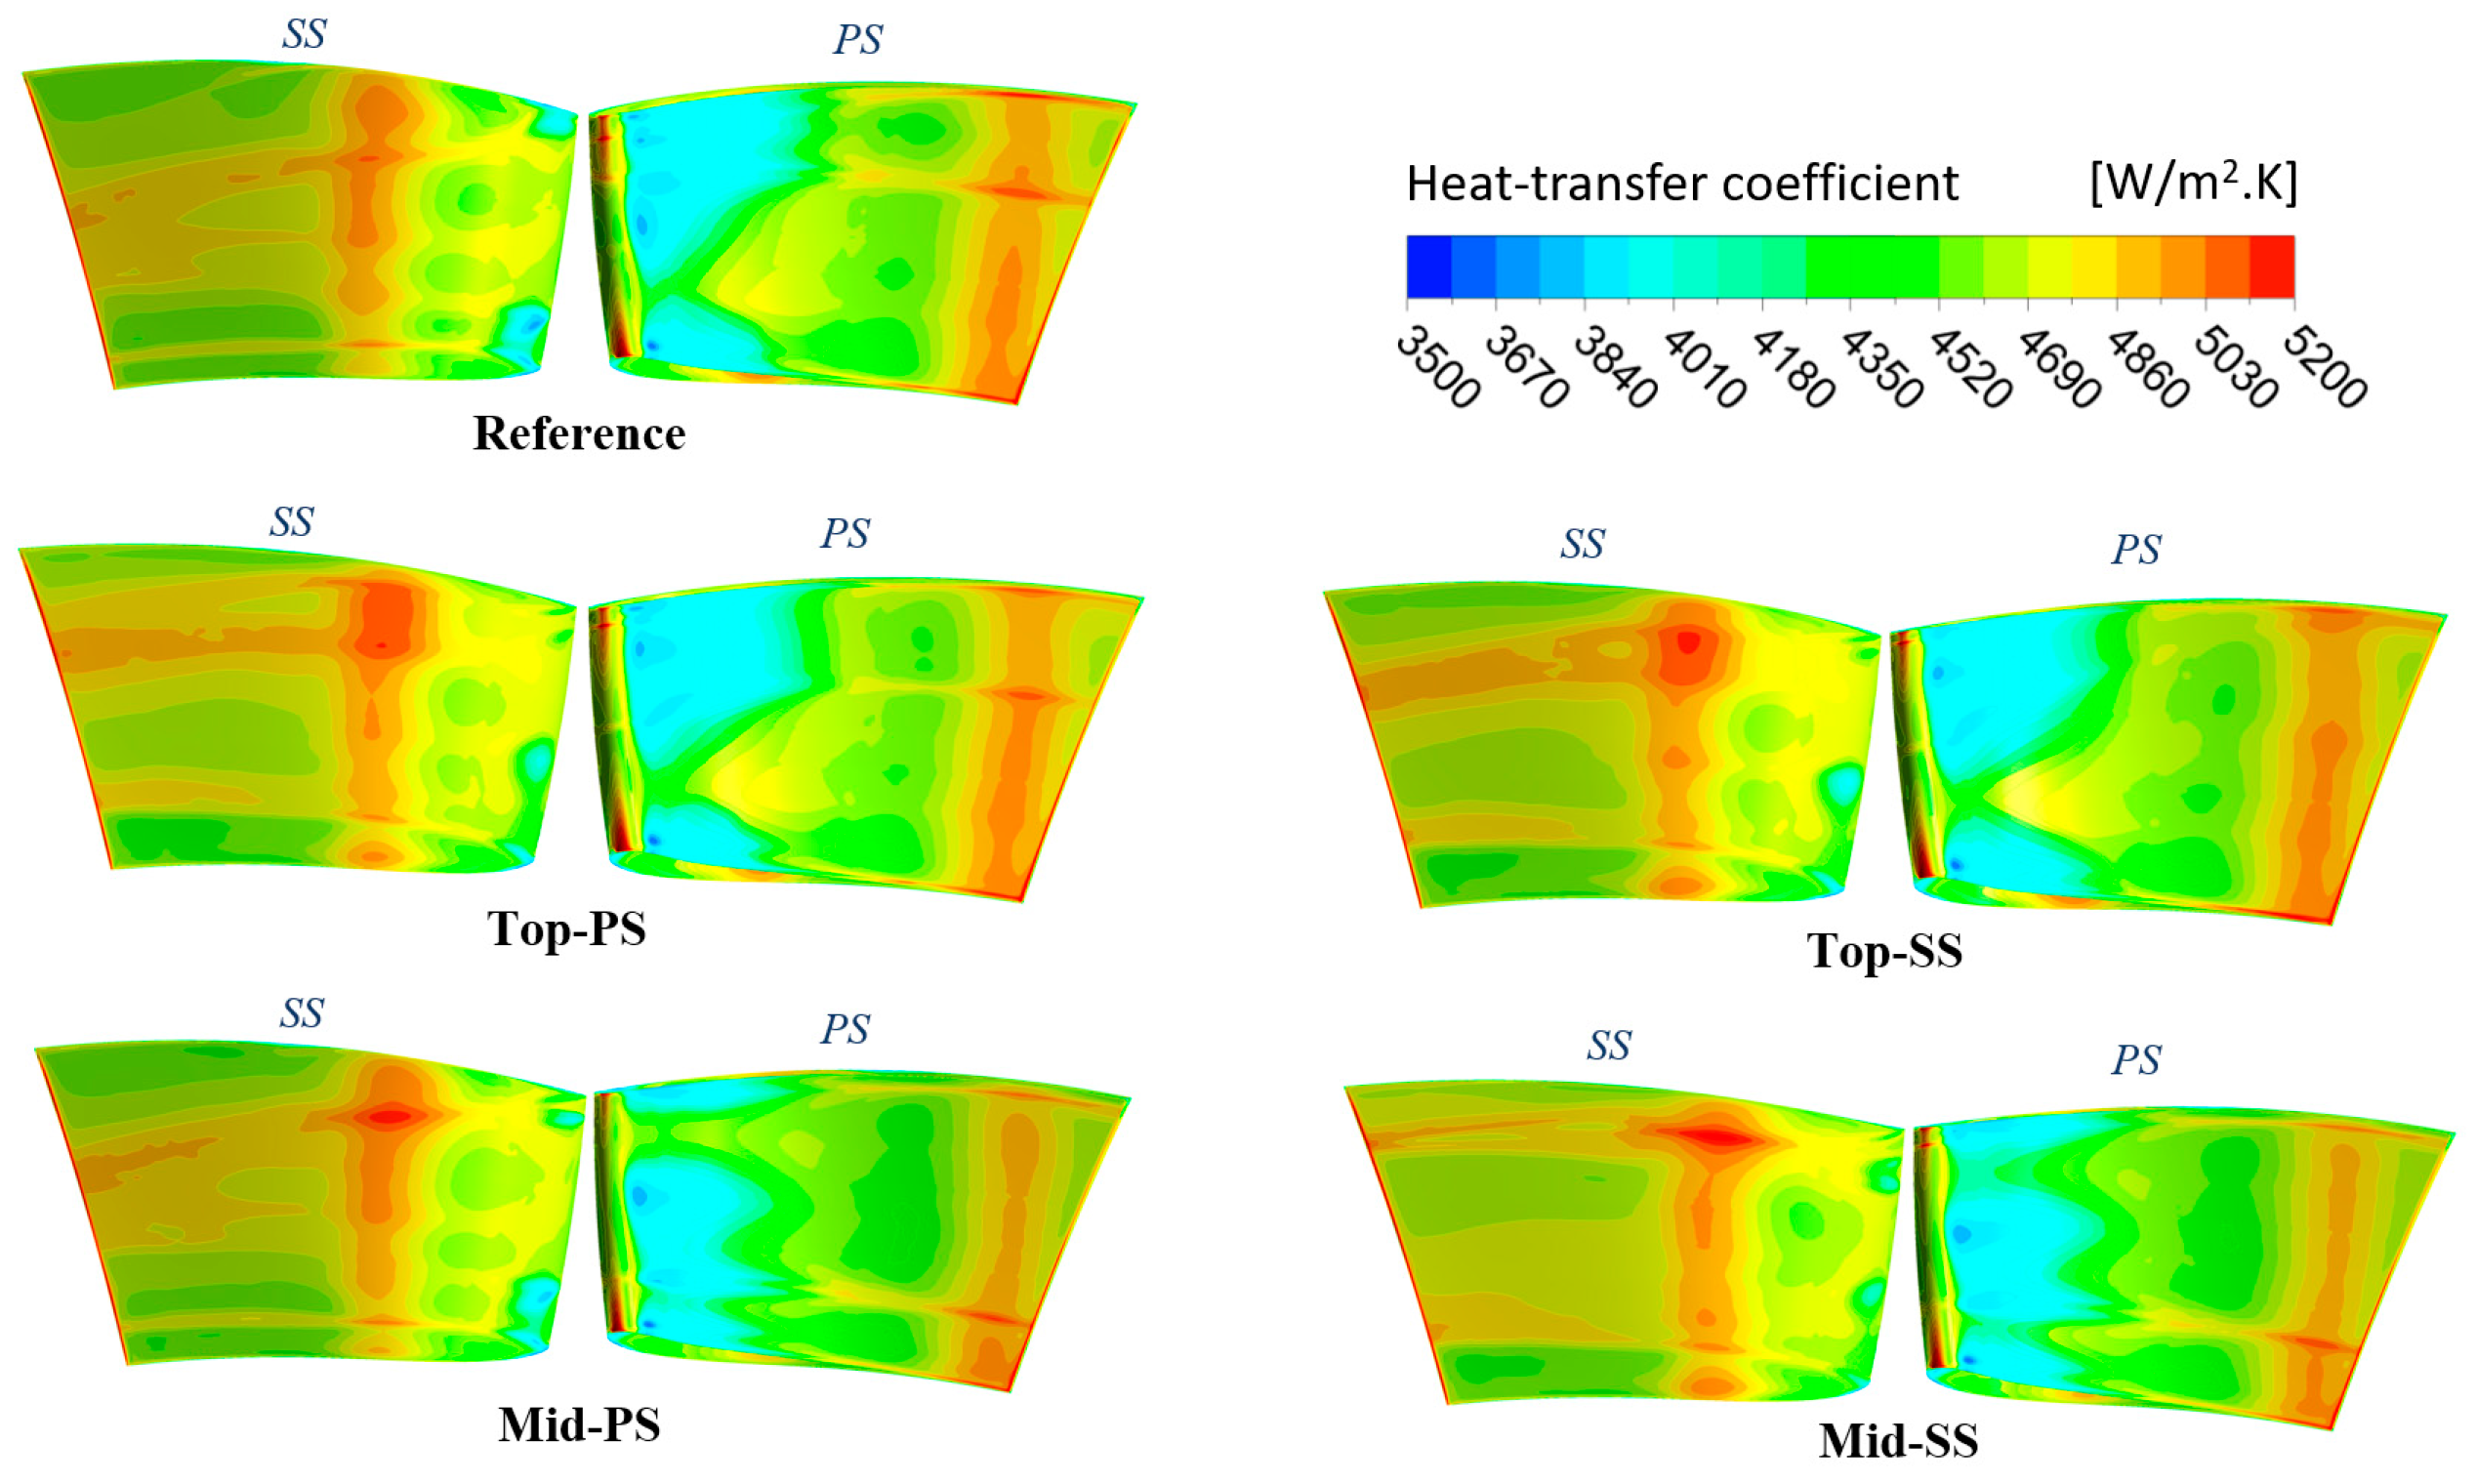
It is necessary to examine the effects of the different damaged-blade conditions on the heat-transfer characteristics of the downstream vane surface. To this end, Figure 17 depicts the HTC contours on the S2-vane surface under different damaged-blade conditions. As can be observed, the HTCs on the S2-vane suction and pressure sides increase and decrease, respectively, when the blade is damaged. This can be attributed to the effects of the damaged rotor blade on the downstream flow characteristics. The Mach number contours in Figure 6 reveal a noticeable increase in the flow on the suction side of the S2 vane compared to the pressure side. Moreover, the flow on the pressure side becomes remarkably weak in cases involving near-midspan rotor-blade damage. Accordingly, the pressure-side HTC in the near-midspan blade damage cases is lower than that observed in other cases. Correspondingly, the suction-side HTC assumes significantly higher values in these cases.
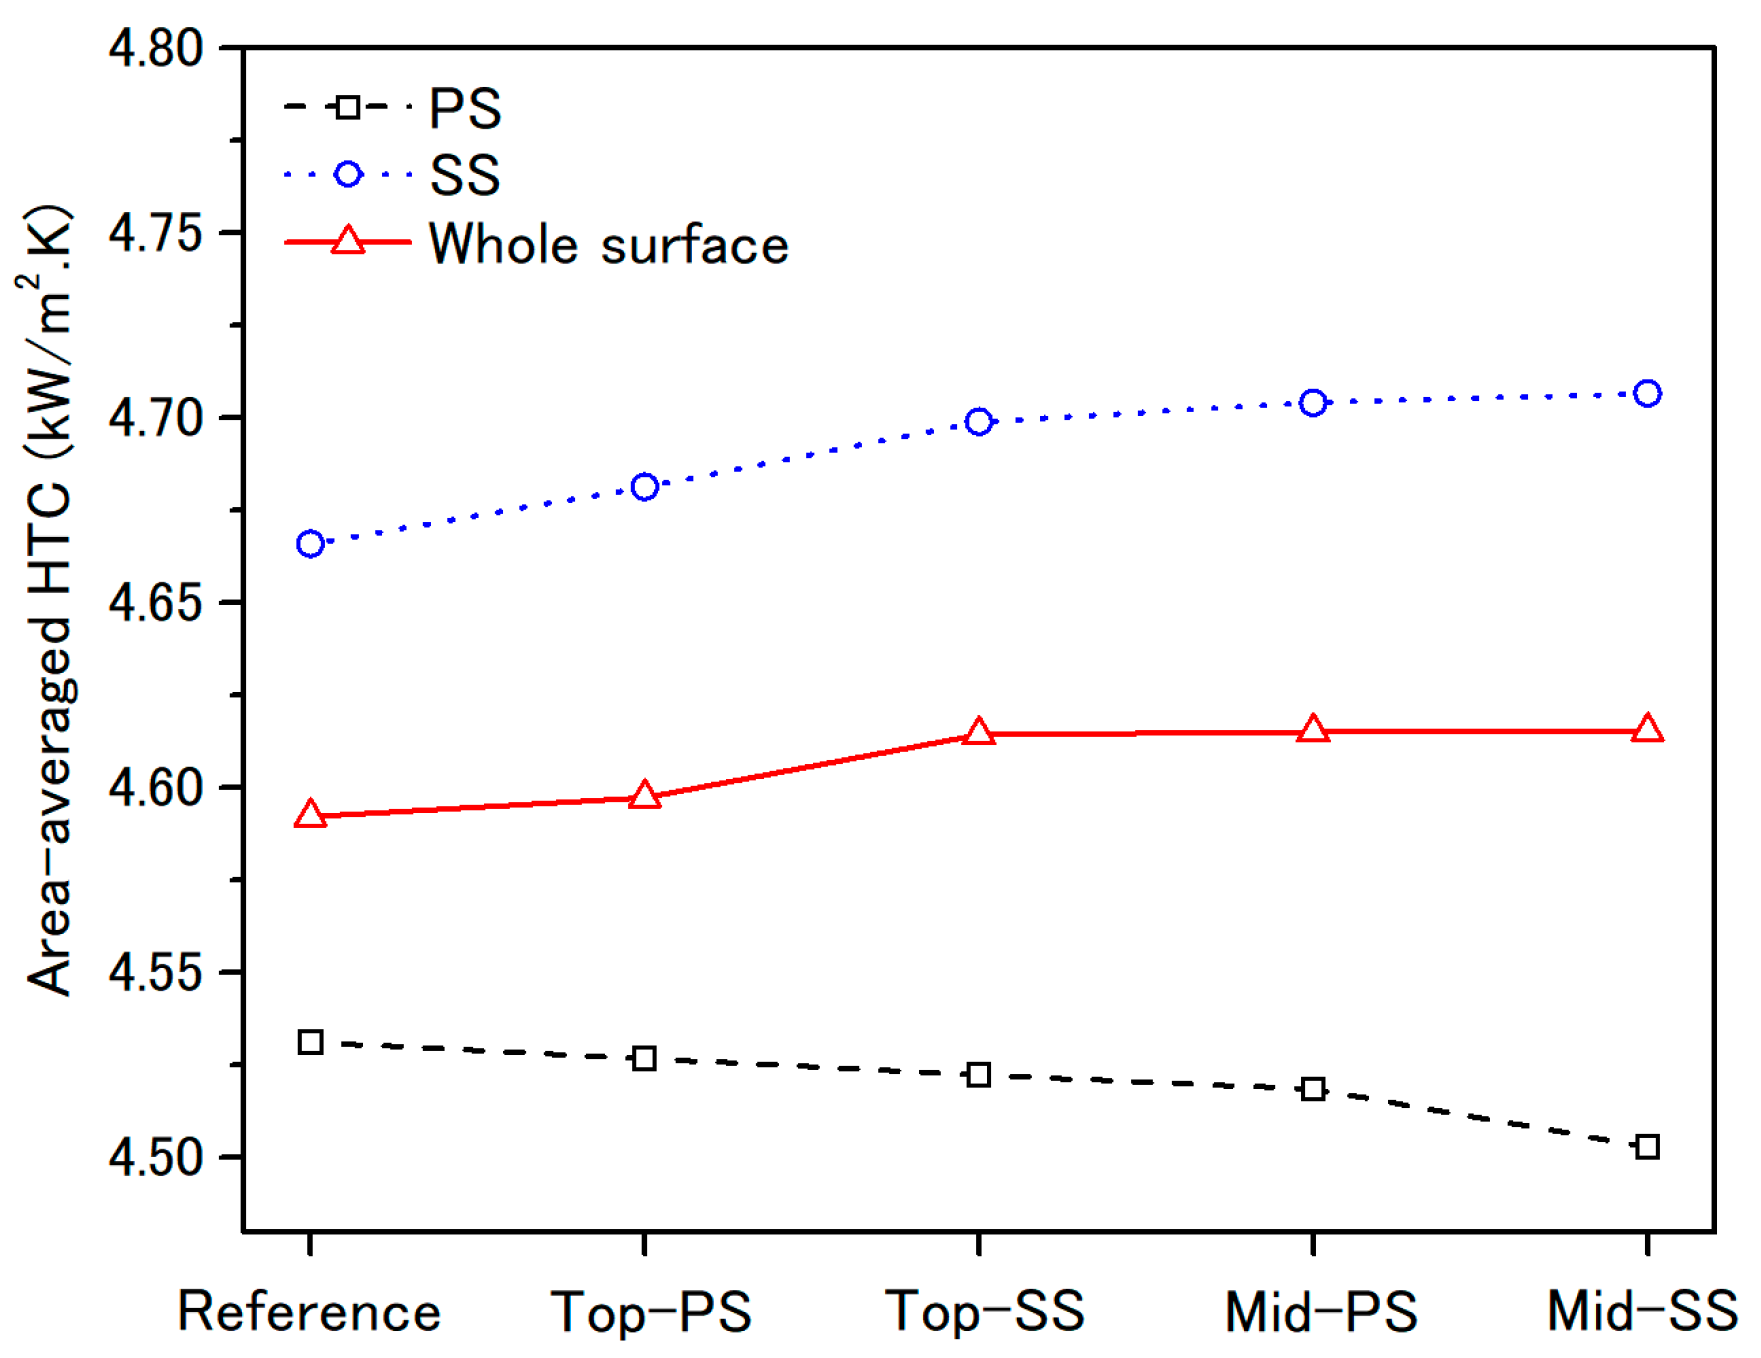
Figure 18 depicts the area-averaged HTC distribution on the S2-vane surface under different rotor-blade-damage conditions. It yields observations similar to those obtained from Figure 16. In other words, the pressure-side HTC decreases, whereas its suction-side counterpart increases in cases involving blade damage. Moreover, the HTC increase on the suction side is more significant than its decrease on the pressure side. Therefore, the average HTC over the entire vane surface increases by up to 0.5% (compared to the reference case) in the case involving near-midspan damage on the blade suction side.
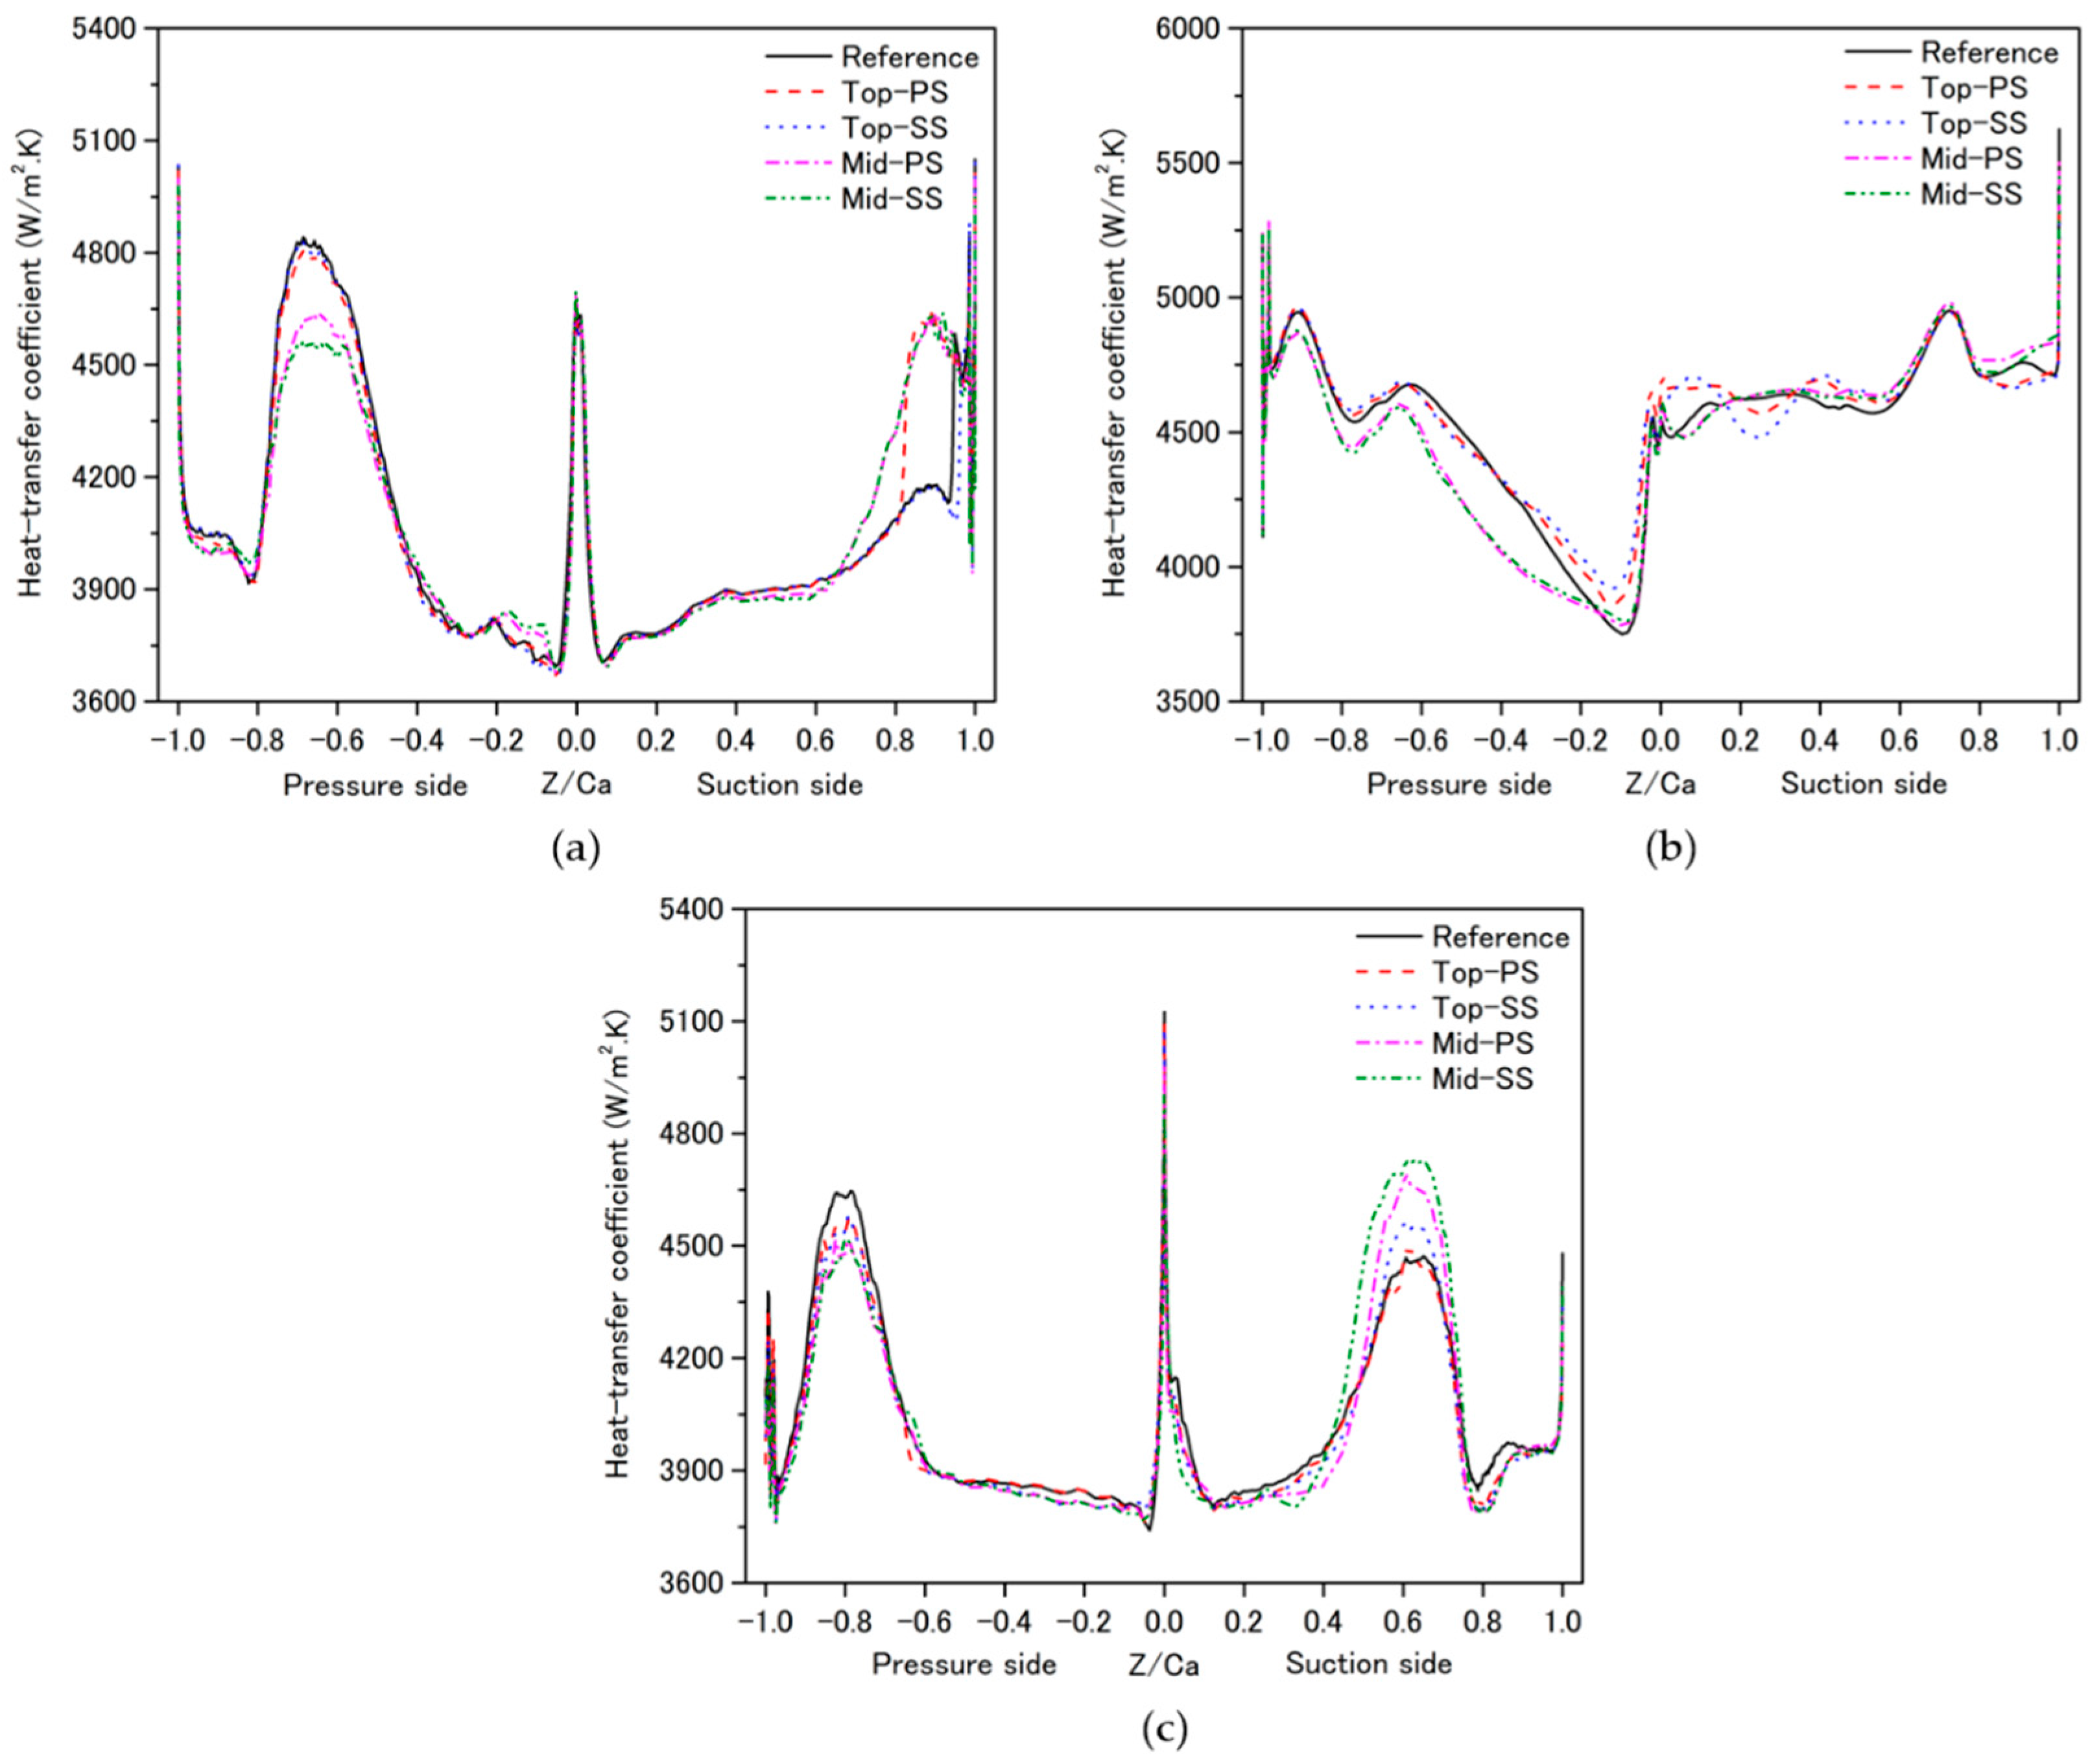
Figure 19 plots the HTC values at different spanwise locations of the S2 vane under the damaged-blade conditions considered in this study. At the hub in pressure side, the HTCs in the near-midspan damage cases demonstrate a significant decrease of 6.1% (relative to the reference case) between 50% and 70% of the axial chord, whereas they increase by 12.3% (relative to the reference case) in regions near the trailing edge. At the midspan, the suction-side HTCs exhibit no significant changes, whereas they decrease by 2.5 to 4.5% (relative to the reference case) at the pressure side in the near-midspan damage cases. The HTC values in the shroud region demonstrate a trend similar to that observed in the hub region. In the damaged-rotor cases, the shroud HTC decreases by 3.2% in regions around 80% of the axial chord on the pressure side. Meanwhile, the HTC value increases by 6.7% in regions around 60% of the axial chord on the suction side. Overall, the damaged rotor blade significantly alters the heat-transfer characteristics of the downstream vane surface, especially in the hub and shroud regions.

4. Conclusions

Previous studies [6,7] investigated the failure of gas turbine blades with respect to various locations and different kinds of damage occurring on the blade surface. Furthermore, the influence of boundary conditions such as turbulence intensity, axial gap, hot streak on the flow, and heat transfer characteristics in gas turbines were fully analyzed in [13,14,15]. However, there are limited studies about the effects of minor damage on the flow and heat transfer characteristics. This paper presents a numerical analysis of the effects of rotor-blade damage along its leading edge on the aerodynamic behavior and heat-transfer characteristics of a 1.5-stage high-pressure gas-turbine model—GE-E3. This is the first study to investigate the effects of different damage locations on the resulting blade/vane aerodynamic forces and provides a detailed analysis of the heat-transfer characteristics of the blade and vane surfaces. The results obtained in this study reveal a noticeable increase in the S2-vane hub and shroud temperatures in all damage-blade cases compared to the reference case. This can be attributed to the effects of the rotor-blade damage on the downstream flow field. Moreover, the aerodynamic force acting on the rotor blade is significantly increased owing to the imbalance caused by the blade damage. This, in turn, causes a significant increase in the mechanical stresses acting on the blade surface, thereby resulting in fatigue-life reduction. The corresponding effects on the S2 vane surface are negligible. In addition, compared to the reference case, the damaged-blade cases demonstrate a significant increase in the blade and vane temperatures and heat fluxes. The average HTCs of the blade and vane surfaces are increased by approximately 1% and 0.5%, respectively. Furthermore, the rotor-blade damage results in amplified heat-transfer characteristics around the damage locations, rotor-blade tip, and S2-vane hub and shroud regions. These modified heat-transfer characteristics induce a sudden increase in the thermal stresses, which, in turn, reduce the fatigue life of the turbine-blade rows, thereby increasing their maintenance and replacement costs. These results are highly coherent with that of our previous study [5].
As a limitation, the proposed study focuses exclusively on the effects of rotor blade damage occurring near its leading edge. Therefore, further studies should consider damages occurring at other locations, especially critical ones, such as the blade hub, shroud, and trailing edge. This would help researchers gain comprehensive insights into the effects of damaged rotor blades on the resulting flow field as well as the aerodynamic and heat-transfer characteristics of the turbine stages. In addition, this would help future turbine-blade designers to develop effective means to prevent the fatigue-life reduction of gas-turbine blades and vanes. This might even to develop sensors capable of early failure detection by monitoring abrupt changes in the flow parameters, such as the pressure, temperature, velocity, and mass flow rate.

Author Contributions

Conceptualization, T.D.M. and J.R.; methodology, T.D.M. and J.R.; investigation, T.D.M. and J.R.; validation, T.D.M.; formal analysis, T.D.M.; writing (original draft preparation), T.D.M.; result post-processing, T.D.M.; writing (manuscript review and editing), J.R.; supervision, J.R.; project administration, J.R.; funding acquisition, J.R. All authors have read and agreed to the published version of the manuscript.

Funding

This work was supported by the Korea Institute of Energy Technology Evaluation and Planning (KETEP) grant funded by the Korea government (MOTIE) (20193310100060, Evaluation of the performance for F-class or more gas turbine blade prototype). Moreover, this research was supported by Korea Electric Power Corporation (Grant number: R21XO01-26).

Institutional Review Board Statement

Not applicable.

Informed Consent Statement

Not applicable.

Data Availability Statement

Not applicable.

Conflicts of Interest

The authors declare no conflict of interest.

Nomenclature

ρ Fluid density (kg/ m 3 )
uFluid velocity (m/s)
PFluid pressure (Pa)
μ Fluid viscosity (Pa·s)
ESpecific internal energy (J)
k e f f Effective thermal conductivity (W/m·K)
μ e f f Effective dynamic viscosity (Pa·s)
μ t Turbulence viscosity (Pa·s)
F 1 ,   F 2 Blending functions
k Turbulence kinetic energy (J/kg)
ω Eddy dissipation/Angular velocity (rad/s)
σ k Turbulent Prandtl number for k
σ ω Turbulent Prandtl number for ω
γ Intermittency
SStrain rate magnitude ( s 1 )
F l e n g t h Empirical correlation
Ω Vorticity magnitude
R e θ c Critical Reynolds number
q Heat flux (W/ m 2 )
T a Temperature of the wall surface [K]
T i Temperature in isothermal condition [K]
C p Specific heat of ideal air [J/kg·K]
κRatio of specific heat
σ ω Turbulent Prandtl number for ω
γ Intermittency
SStrain rate magnitude ( s 1 )

References

  1. Ramireddy, V. An Overview of Combined Cycle Power Plant. 2012. Available online: https://electrical-engineering-portal.com/an-overview-of-combined-cycle-power-plant (accessed on 18 January 2021).
  2. An, B.-T.; Liu, J.-J.; Jiang, H.-D. Numerical Investigation on Unsteady Effects of Hot Streak on Flow and Heat Transfer in a Turbine Stage. J. Turbomach. 2009, 131, 031015. [Google Scholar] [CrossRef]
  3. Povey, T.; Qureshi, I. Developments in hot-streak simulators for turbine testing. J. Turbomach. 2009, 131, 031009. [Google Scholar] [CrossRef]
  4. Kaewbumrung, M.; Tangsopa, W.; Thongsri, J. Investigation of the trailing edge modification effect on compressor blade aerodynamics using SST k-ω turbulence model. Aerospace 2019, 6, 48. [Google Scholar] [CrossRef] [Green Version]
  5. Mai, T.D.; Ryu, J. Effects of Leading-Edge Modification in Damaged Rotor Blades on Aerodynamic Characteristics of High-Pressure Gas Turbine. Mathematics 2020, 8, 2191. [Google Scholar] [CrossRef]
  6. Gallardo, J.; Rodríguez, J.; Herrera, E. Failure of gas turbine blades. Wear 2002, 252, 264–268. [Google Scholar] [CrossRef]
  7. Mishra, R.; Thomas, J.; Srinivasan, K.; Nandi, V.; Bhatt, R.R. Failure analysis of an un-cooled turbine blade in an aero gas turbine engine. Eng. Fail. Anal. 2017, 79, 836–844. [Google Scholar] [CrossRef]
  8. Poursaeidi, E.; Aieneravaie, M.; Mohammadi, M. Failure analysis of a second stage blade in a gas turbine engine. Eng. Fail. Anal. 2008, 15, 1111–1129. [Google Scholar] [CrossRef]
  9. Yu, Z.-Y.; Zhu, S.-P.; Liu, Q.; Liu, Y. A New Energy-Critical Plane Damage Parameter for Multiaxial Fatigue Life Prediction of Turbine Blades. Materials 2017, 10, 513. [Google Scholar] [CrossRef] [Green Version]
  10. Liu, Z.; Karimi, I.A. Gas turbine performance prediction via machine learning. Energy 2020, 192, 116627. [Google Scholar] [CrossRef]
  11. Zhou, D.; Yao, Q.; Wu, H.; Ma, S.; Zhang, H. Fault diagnosis of gas turbine based on partly interpretable convolutional neural networks. Energy 2020, 200, 117467. [Google Scholar] [CrossRef]
  12. Bazilevs, Y.; Takizawa, K.; Wu, M.C.; Kuraishi, T.; Avsar, R.; Xu, Z.; Tezduyar, T.E. Gas turbine computational flow and structure analysis with isogeometric discretization and a complex-geometry mesh generation method. Comput. Mech. 2021, 67, 57–84. [Google Scholar] [CrossRef]
  13. Simone, S.; Montomoli, F.; Martelli, F.; Chana, K.S.; Qureshi, I.; Povey, T. Analysis on the Effect of a Nonuniform Inlet Profile on Heat Transfer and Fluid Flow in Turbine Stages. J. Turbomach. 2011, 134, 011012. [Google Scholar] [CrossRef]
  14. Choi, M.G.; Ryu, J. Numerical study of the axial gap and hot streak effects on thermal and flow characteristics in two-stage high pressure gas turbine. Energies 2018, 11, 2654. [Google Scholar] [CrossRef] [Green Version]
  15. Wang, Z.; Liu, Z.; Feng, Z. Influence of mainstream turbulence intensity on heat transfer characteristics of a high pressure turbine stage with inlet hot streak. J. Turbomach. 2016, 138, 041005. [Google Scholar] [CrossRef]
  16. Yang, D.; Yu, X.; Feng, Z. Investigation of Leakage Flow and Heat Transfer in a Gas Turbine Blade Tip with Emphasis on the Effect of Rotation. J. Turbomach. 2010, 132, 041010. [Google Scholar] [CrossRef]
  17. Asgarshamsi, A.; Benisi, A.H.; Assempour, A.; Pourfarzaneh, H. Multi-objective optimization of lean and sweep angles for stator and rotor blades of an axial turbine. Proc. Inst. Mech. Eng. Part G J. Aerosp. Eng. 2015, 229, 906–916. [Google Scholar] [CrossRef]
  18. Pogorelov, A.; Meinke, M.; Schröder, W. Large-eddy simulation of the unsteady full 3D rim seal flow in a one-stage axial-flow turbine. Flow Turbul. Combust. 2019, 102, 189–220. [Google Scholar] [CrossRef]
  19. Zhang, B.; Qiang, X. Aerothermal and aerodynamic performance of turbine blade squealer tip under the influence of guide vane passing wake. Proc. Inst. Mech. Eng. Part A J. Power Energy 2020. [Google Scholar] [CrossRef]
  20. Timko, L. Energy Efficient Engine High Pressure Turbine Component Test Performance Report; Technical Report; National Aeronautics and Space Administration (NASA): Cincinnati, OH, USA, 1984. [Google Scholar]
  21. Arnone, A.; Benvenuti, E. Three-Dimensional Navier-Stokes Analysis of a Two-Stage Gas Turbine; American Society of Mechanical Engineers: New York, NY, USA, 1994. [Google Scholar]
  22. ANSYS. ANSYS TurboGrid Tutorials, Release 15.0; ANSYS: Canonsburg, PA, USA, 2013. [Google Scholar]
  23. ANSYS. ANSYS CFX, 12.1 Ansys Cfx-Solver Theory Guide; ANSYS: Canonsburg, PA, USA, 2009. [Google Scholar]
  24. Celik, I.; Yavuz, I.; Smirnov, A. Large eddy simulations of in-cylinder turbulence for internal combustion engines: A review. Int. J. Engine Res. 2001, 2, 119–148. [Google Scholar] [CrossRef]
  25. Ryu, J.; Lele, S.; Viswanathan, K. Study of supersonic wave components in high-speed turbulent jets using an LES database. J. Sound Vib. 2014, 333, 6900–6923. [Google Scholar] [CrossRef]
  26. Ryu, J.; Livescu, D. Turbulence structure behind the shock in canonical shock–vortical turbulence interaction. J. Fluid Mech. 2014, 756, R1-1–R1-13. [Google Scholar] [CrossRef] [Green Version]
  27. Lee, J.; Lee, H.J.; Ryu, J.; Lee, S.H. Three-dimensional turbulent flow and heat transfer characteristics of longitudinal vortices embedded in turbulent boundary layer in bent channels. Int. J. Heat Mass Transf. 2018, 117, 958–965. [Google Scholar] [CrossRef]
  28. Ngo, T.T.; Phu, N.M. Computational fluid dynamics analysis of the heat transfer and pressure drop of solar air heater with conic-curve profile ribs. J. Therm. Anal. Calorim. 2020, 139, 3235–3246. [Google Scholar] [CrossRef]
  29. Nguyen, M.P.; Ngo, T.T.; Le, T.D. Experimental and numerical investigation of transport phenomena and kinetics for convective shrimp drying. Case Stud. Therm. Eng. 2019, 14, 100465. [Google Scholar] [CrossRef]
  30. Phu, N.M.; Tuyen, V.; Ngo, T.T. Augmented heat transfer and friction investigations in solar air heater artificially roughened with metal shavings. J. Mech. Sci. Technol. 2019, 33, 3521–3529. [Google Scholar] [CrossRef]
  31. Kim, J.; Bak, J.; Kang, Y.; Cho, L.; Cho, J. A study on the numerical analysis methodology for thermal and flow characteristics of high pressure turbine in aircraft gas turbine engine. KSFM J. Fluid Mach. 2014, 17, 46–51. [Google Scholar] [CrossRef]
  32. Le, T.T.G.; Jang, K.S.; Lee, K.-S.; Ryu, J. Numerical Investigation of Aerodynamic Drag and Pressure Waves in Hyperloop Systems. Mathematics 2020, 8, 1973. [Google Scholar] [CrossRef]
  33. Oh, J.-S.; Kang, T.; Ham, S.; Lee, K.-S.; Jang, Y.-J.; Ryou, H.-S.; Ryu, J. Numerical analysis of aerodynamic characteristics of hyperloop system. Energies 2019, 12, 518. [Google Scholar] [CrossRef] [Green Version]
  34. Hylton, L.; Mihelc, M.; Turner, E.; Nealy, D.; York, R. Analytical and Experimental Evaluation of the Heat Transfer Distribution over the Surfaces of Turbine Vanes; Final Report Detroit Diesel Allison: Indianapolis, IN, USA, 1983. [Google Scholar]
  35. Menter, F.R. Two-equation eddy-viscosity turbulence models for engineering applications. AIAA J. 1994, 32, 1598–1605. [Google Scholar] [CrossRef] [Green Version]
  36. ANSYS. ANSYS Fluent Theory Guide; ANSYS: Canonsburg, PA, USA, 2013. [Google Scholar]
  37. Wang, Z.; Wang, D.; Liu, Z.; Feng, Z. Numerical analysis on effects of inlet pressure and temperature non-uniformities on aero-thermal performance of a HP turbine. Int. J. Heat Mass Transf. 2017, 104, 83–97. [Google Scholar] [CrossRef]
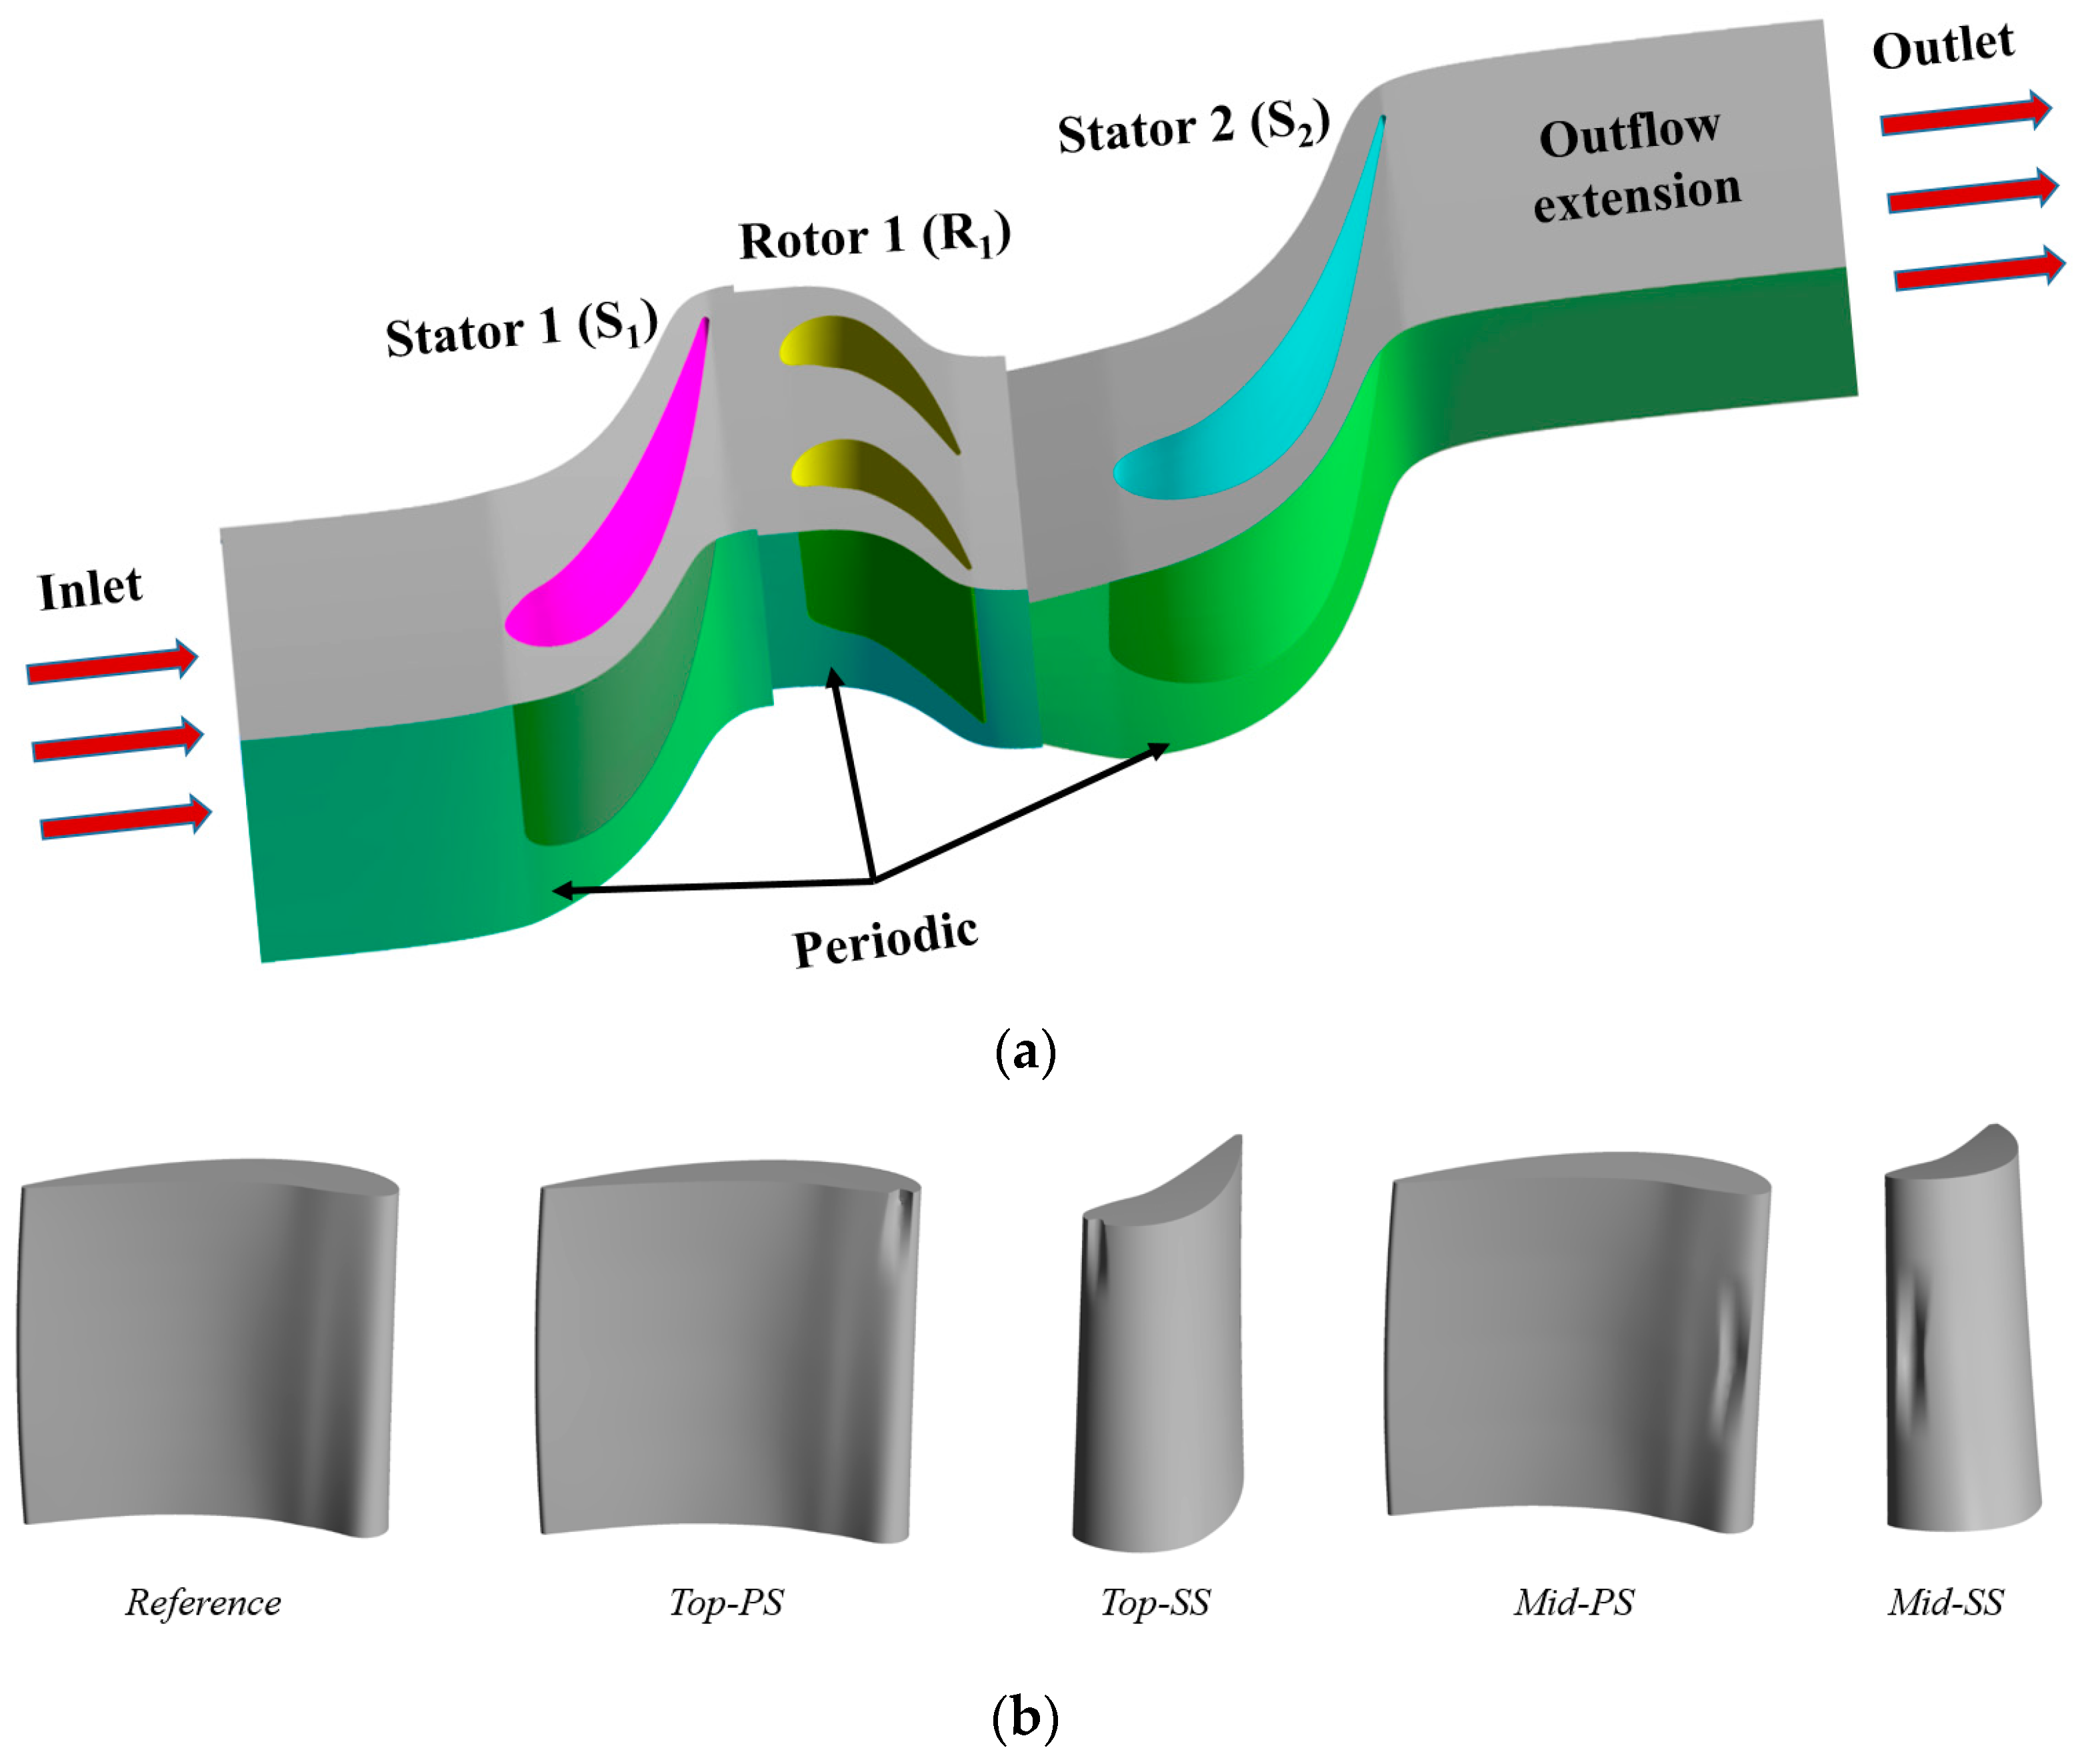
Figure 1. (a) Computational model used in this study; (b) Different types of damaged rotor blades (top and mid denote near-tip and near-midspan regions of rotor blade, respectively, whereas PS and SS denote the pressure and suction sides, respectively). Similar figure can be found in [5].
Mathematics 09 00627 g001
Figure 2. Contour of y+ on blades and vanes surface.
Mathematics 09 00627 g002
Figure 3. Contour of the temperature distribution at the turbine inlets with streamlines. The contour level is defined as the ratio of the actual temperature and the average temperature.
Mathematics 09 00627 g003
Figure 4. Velocity streamline of the tip-leakage flow passing through the R1 blade tip under various types of rotor blades. The contour level is defined as the velocity passing though the blade tip.
Mathematics 09 00627 g004
Figure 5. Contour of the turbulence intensity of the flow at the R1 outlet under various rotor blade conditions.
Mathematics 09 00627 g005
Figure 6. Mach number contours at entrance of S2 vane under different damaged-blade conditions.
Mathematics 09 00627 g006
Figure 7. Temperature distribution on the S2 vane at the (a) hub and (b) shroud under different damaged-blade conditions.
Mathematics 09 00627 g007
Figure 8. Wall-shear stress distribution on the rotor blade surface.
Mathematics 09 00627 g008
Figure 9. Wall-shear stress plots at different spanwise locations of rotor blades under different damaged-blade conditions: (a) near-hub (hub +5%); (b) midspan; (c) near-shroud (shroud −5%).
Mathematics 09 00627 g009
Figure 10. Wall-shear stress distribution on the S2 vane surface under different damaged-blade conditions.
Mathematics 09 00627 g010
Figure 11. Surface-force distribution on the rotor blade under different damaged-blade conditions.
Mathematics 09 00627 g011
Figure 12. Force distribution on the S2 vane surface under different damaged-blade conditions.
Mathematics 09 00627 g012
Figure 13. Heat-transfer coefficient distribution on the R1 surface under different damaged-blade conditions.
Mathematics 09 00627 g013
Figure 14. Area-averaged heat-transfer coefficient on the R1 blade surface under different damaged-blade conditions.
Mathematics 09 00627 g014
Figure 15. Heat-transfer coefficient distribution on the R1 blade tip under different damaged-blade conditions.
Mathematics 09 00627 g015
Figure 16. Average temperature and heat flux on the R1 blade tip under different damaged-blade conditions.
Mathematics 09 00627 g016
Figure 17. Heat-transfer coefficient distribution on the S2 vane surface under different damaged-blade conditions.
Mathematics 09 00627 g017
Figure 18. Area-averaged heat-transfer coefficient on the S2 vane surface under different damaged-blade conditions.
Mathematics 09 00627 g018
Figure 19. Heat-transfer coefficient at different spanwise locations of the S2 vane under different damaged-blade conditions: (a) hub; (b) midspan; (c) shroud.
Mathematics 09 00627 g019
Table 1. Independent test mesh for the computational domain [5,14].
Domain Node Number (×106)Area-Averaged Heat Flux [kW/m2K]
S1R1S2S1Relative
Error
R1
(Relative Error)
S2
(Relative Error)
Mesh-10.992.481.34277,226Relative errors are less than 0.01%382.85
(0.75%)
276.97
(1.06%)
Mesh-21.324.421.8277,022385.73
(0.41%)
279.91
(0.82%)
Mesh-31.825.922.4276,993387.29282.21
(0.43%)
Mesh-4--3.2--283.41
Table 2. Boundary conditions and detailed simulation setup.
Boundary Conditions
InletTotal pressure: 344,740 Pa
Total temperature: Hot streak (maximum: 839 K, average: 728 K)
Turbulence intensity: 5%
OutletStatic pressure: 104,470 Pa
Detailed Settings for Simulation
Rotor speed3600 RPM
Rotor blades conditionUndamaged or damaged at PS and SS in middle and top of blade
Wall surfaceAdiabatic or isothermal
Stator–rotor interfaceSteady simulation: Frozen rotor
Unsteady simulation: Transient rotor-stator
Publisher’s Note: MDPI stays neutral with regard to jurisdictional claims in published maps and institutional affiliations.