Article

Multi-Attribute Online Decision-Making Driven by Opinion Mining

1
Department of Information Technology, College of Computing and Information Technology at Khulais, University of Jeddah, Jeddah 23218, Saudi Arabia
2
Faculty of Computer Science and Information Technology, University of Malaya, Kuala Lumpur 50603, Malaysia
3
Department of Computer Science, COMSATS University Islamabad, Islamabad 44000, Pakistan
4
School of Computer Science and Engineering, Taylor’s University, Subang Jaya 47500, Malaysia
5
Centre for Data Science and Analytics (C4DSA), Taylor’s University, Subang Jaya 47500, Malaysia
6
Department of Electronics, Keimyung University, Daegu 42601, Korea
7
Department of Software, Sejong University, Seoul 05006, Korea
*
Authors to whom correspondence should be addressed.
Mathematics 2021, 9(8), 833; https://doi.org/10.3390/math9080833
Submission received: 11 March 2021 / Revised: 7 April 2021 / Accepted: 8 April 2021 / Published: 11 April 2021

Abstract

:
With the evolution of data mining systems, the acquisition of timely insights from unstructured text is an organizational demand which is gradually increasing. The existing opinion mining systems have a variety of properties, such as the ranking of products’ features and feature level visualizations; however, organizations require decision-making based upon customer feedback. Therefore, an opinion mining system is proposed in this work that ranks reviews and features based on novel ranking schemes with innovative opinion-strength-based feature-level visualization, which are tightly coupled to empower users to spot imperative product features and their ranking from enormous reviews. Enhancements are made at different phases of the opinion mining pipeline, such as innovative ways to evaluate review quality, rank product features and visualize opinion-strength-based feature-level summary. The target user groups of the proposed system are business analysts and customers who want to explore customer comments to gauge business strategies and purchase decisions. Finally, the proposed system is evaluated on a real dataset, and a usability study is conducted for the proposed visualization. The results demonstrate that the incorporation of review and feature ranking can improve the decision-making process.

1. Introduction

Improvements in information and communication technologies break down geographical boundaries, allowing for faster connection and communication worldwide [1]. Further, the proliferation of social networks due to the ubiquity of Web 2.0 revolutionizes the way people present their opinions by providing social interactions [2,3]. As a result, consumers from all over the world are sharing their emotions, opinions, evaluations and judgments to a wide ranging audience by connecting themselves to online platforms such as blogs, newsgroups, discussion boards, and social networking sites [4,5,6]. Consequently, the Web consists of huge volumes of publicly available opinion data about different objects, for instance, individuals, government, products, events, organizations, services, education, news [7,8]. The volume of opinion data about different entities (individuals, products, events, organizations, services) is growing rapidly on these platforms due to the accessibility, scalability, and enhanced user participation of Web 2.0. The fast-growing opinion data are unstructured, freely available, and decision-oriented to fulfil the need of diverse stakeholders such as corporates and consumers [9,10,11]. Though there are various platforms of electronic word of mouth (e-WOM), the most highly focused are online reviews platforms. Enterprises are now focusing on customer online reviews to support their decision-making process, such as risk management, sale prediction, market intelligence, new product design, trend prediction, advertisement placement, threats from competitors and benchmarking [12,13,14,15,16]. From the customer point of view, e-WOM considerably impacts customers’ product choice and adoption, purchase intentions, and use of products [17,18]. Moreover, social networks have increased the sophistication of customers, and so customers compare competing products before buying a product [19,20]. As a result, positive e-WOM improves the trust, satisfaction and loyalty of customers [2]. In contrast, negative e-WOM decrease customers’ patronage and loyalty [3].
The volume of e-WOM has been growing at a remarkable pace as the universality of the Web offers easy users’ participation through different online platforms [21]. These platforms provide valuable insights into different features of a target product, for instance, a digital camera. Consumers consult these platforms to compare features of different cameras (picture quality, battery life, zoom, flash) from competing brands before making a purchase [22]. The features of a product play a crucial role in the purchase decision. However, online reviews do not highlight the critical features of a product to facilitate consumers in their decision-making process. Moreover, users need to gravitate through a host of reviews to learn about features that need to be considered before making a purchase due to the varying quality, enormous availability, distributed nature, voluminosity, heterogeneity, and multi-dimensionality of online reviews. As a result, it is a time-consuming and tedious task to analyze and summarize online reviews to get information about competing features between products of different brands [23,24]. Further, the nature of the online reviews poses many challenges to the text mining community, such as filtering low-quality reviews from high-quality reviews (information overloading problem), ranking of products’ prominent features and integrated visual views of consumers’ opinions (consumers-to-consumers communication problem) [25,26,27]. The information overload problem has been resolved in literature by a variety of review ranking schemes. To overcome the consumer-consumers communication problem, opinion mining systems have been available in the literature aiming at providing automatic analysis and summarization of online reviews to pinpoint decision-oriented features of a target product [28].
Due to the characteristics of online reviews, it becomes difficult to identify high-quality reviews which cover a diverse set of opinions. The quality of a review is described by its embedded polarity or opinions [29] or how helpful a review is [30]. For example, the Amazon online reputation system in Ref. [31] asks users to vote for customer reviews they found “helpful” in the form of helpfulness votes and star rating. The helpfulness votes and 5-star rating represent the quality of the product that signifies customers’ endorsement and impact other customers’ shopping intentions [32,33,34]. Currently, high-quality reviews are identified when users explicitly filter reviews based on the star rating and/or their level of helpfulness [32,35]. Different review quality evaluation methods have been proposed in the literature that utilize combinations of metadata, textual, and social features [36,37,38]. In contrast to classical rating systems [39] in which users rate a product, community-driven review systems allow the customers to rate prominent features of a product. The customers rating may vary based on the different features of the product. Consequently, it emphasizes the need to develop mechanisms to identify prominent features of a product in Ref. [40] about which the customers are concerned and rank products based on identified features by excavating a large number of customer reviews. Commonly, feature frequency, semantic polarities and ratings are used for feature ranking to enhance consumers to consumer communication [41,42,43,44,45,46]. However, these methods overlook important factors that can improve feature ranking by focusing on (i) opinion strength, such as how positive or negative an opinion word is, (ii) quality of reviews, and (iii) consideration of user preferences. Further, the visualization of the opinion summary has the same importance as the assessment of review quality and feature ranking. A feature-based opinion summary with ample visualization may be more valuable than a summary showing only an average rating for features of a target product [41]. However, existing review quality evaluation methods are not integrated with feature ranking, opinion visualizations, and user preferences and they overlook a few parameters, such as visitor count and title information. Therefore, there is a need for an integrated system that ranks, analyzes, summarizes and visualizes these online reviews to fulfil the requirements of consumers and enterprises.
In the light of above discussion, the motivation of the work is to (i) remove low-quality reviews from feature ranking as suggested by Ref. [47], (ii) enhancing the feature ranking by incorporating missing parameters, and (iii) improving existing opinion visualization to provide opinion-strength-based summary. Therefore, this study aims to propose and develop a reputation system to provides users a multi-level analysis and summarization of consumer opinions. Specifically, the objectives of this paper are to propose (i) a review ranking method incorporating vital parameters and user preferences, (ii) a feature ranking method based on indispensable parameters, and (iii) opinion strength-based visualization.
The main contributions include:
(a)
Scheme for the selection of high-quality reviews by incorporating users’ preferences.
(b)
Feature ranking scheme based on multiple parameters for a deeper understanding of consumers’ opinions.
(c)
Opinion-strength-based visualization based on high-quality reviews to provide high-quality information for decision-making. The proposed visualization provides a multi-level detail of consumers’ opinions (ranging from −3 to +3) on critical products features at a glance, which allows entrepreneurs and consumers to highlight decisive product features having a key impact on the sale, product choice and adoption.
(d)
Reputation system is evaluated on a real dataset
(e)
Usability study for the evaluation of the proposed visualization
The rest of the paper is organized as follows. Section 2 presents existing work on review quality evaluation, feature ranking and opinion visualizations. Section 3 presents the proposed system. Section 4 presents the results and discussion, and finally, Section 5 concludes the paper.

2. Related Work

Existing studies on review quality evaluation, feature ranking, and opinion visualizations are presented in this section.

2.1. Review Quality Evaluation and Review Ranking

It is difficult for customers and enterprises to identify high-quality reviews projecting the true quality of a target product due to the massive volume of reviews. Existing studies of review quality evaluation have focused on a number of features such as helpfulness votes, rating, review length and term frequency [20,48,49]. In Ref. [30], five feature classes: Lexical (uni-gram and bi-gram), Structural (i.e. length, number of sentences), Syntactic (nouns, adjectives, verbs), Meta-data (rating) and Semantic (features and opinion words) of a review were explored to predict the quality of a review. Review length, user ratings, and term frequency were found to be significant in review quality prediction. Similarly, the experimental results performed by Ref. [29] highlighted the shallow syntactic features such as verbs, nouns, and interjections as the strongest predictor of review quality prediction [29]. The authors in Ref. [50] utilized three more feature sets reviewer history features, reviewer profile features, and readability features to identify the helpfulness of a review. Their results demonstrated a correlation between these feature sets and the perceived helpfulness of reviews. Ref. [38] pinpointed the helpfulness of a review from three different perspectives: the writing style of the review, the reviewer’s expertise, and the timeliness of the review. The experimental results of Ref. [26] found two main features review length and the number of product features to be significant while ranking reviews [26]. Ref. [51] proposed a review ranking scheme for book reviews based on the number of features. A score is assigned to each review on the basis of the number of features that appeared in the review. Then reviews were ranked according to the assigned score. The review ranking scheme outclassed the helpfulness votes-based ranking scheme. Ref. [42] extended the previous scheme by incorporating the number of opinion words with the number of features for review ranking. The extended scheme outperformed the term frequency-based scheme.
In Ref. [20], more weightage is given to the title of the review as compared to the body while computing review ranking. According to the authors, the title of the review conveys the overall mood of the reviewer and an effective summary of the review. However, this work only considers opinion words from the title and ignores product features. The pioneer work that included integration review quality evaluation, feature ranking, and user preferences were presented by Shamim et al. [32], wherein a review quality evaluation scheme based on user preferences and four other parameters including helpfulness ratio, review rating, number of features and opinion words were proposed. In terms of user preferences, the users are allowed to perform the following: (i) adjust the weight of each parameter and (ii) select reviews for features ranking.
However, Ref. [52] ignored the title of the review in ranking reviews and features, and Ref. [26] ignored product features in the review title for ranking reviews. To address these limitations, the method proposed in the current study to rank the reviews calculates separate weights for title and body of the based on both the number of features and opinion words expressed in the title and body of a review along with metadata feature (review rating and helpfulness ratio). We enhanced the previous review ranking scheme in Ref. [52] by including the title score. Further, in contrast to Ref. [26] in which authors considered rating for review raking, our work does consider multiple parameters: (i) feature frequency, (ii) number of opinion words, (iii) accumulated strength of associated opinion words, and (iv) title information of a review. The reason to include the title information of a review in ranking is that the title highly summarizes a review and presents the overall opinion of the reviewer [42]. Considering the significance of the title, the title score is included in the review ranking and is associated with the weight coefficient α.

2.2. Feature Ranking

The pioneer work on feature-based opinion mining was done by Hu and Liu, [53] to mine and summarize customers’ reviews by developing a system called feature-based summarization (FBS). This work aimed to identify product features, and opinion orientation for each feature and present a summary of the identified features and corresponding opinions in a textual form. In this work, the authors' utilized the classification based on associations (CBA) system using an Apriori algorithm to extract frequent explicit features. The adjective synonyms and antonyms of Wordnet are utilized in FBS to identify the opinion orientation of opinion words. An average accuracy of 84 % was achieved by FBS for opinion orientation.
In the literature, a variety of feature ranking schemes are available that rank features on the basis of feature frequency, opinion words, star rating, and semantic polarities. The most popular feature ranking approach ranks features based on the frequency of a feature [44,45]. For instance, Ref. [44] utilized feature frequency for feature ranking. Likewise, the feature frequency-based PageRank algorithm was revised for product ranking [45], and the findings of this approach showed promising results. In Ref. [42], the authors utilized the number of associated opinion words with each feature to rank features. The experimental results of this ranking outperformed ranking based on feature frequency. The previous ranking approach was enhanced by Ref. [43] by integrating guidelines defined by the review website with the number of associated opinion words. The outcomes of this integration exhibited significant improvement in the accuracy of the existing system [53]. The ranking approach of Ref. [42] was also extended by Ref. [54] such that the authors incorporated review rating with opinion words for feature ranking. The results of the extended approach outclassed the frequency-based method. Correspondingly, the amalgamation of review rating and opinion polarity resulted in higher precision than the frequency based method [41]. Semantic polarity with feature frequency was also deployed in ranking features, and this method achieved 92% precision [55]. Ref. [52] provided two types of feature ranking, positive and negative, based on the semantic orientation and intensity (strength).
In the context of feature ranking, Refs. [44,45] utilized only feature frequency, Ref. [43] targeted feature frequency and opinion words, Ref. [52] ignored opinion and feature frequency, Ref. [55] overlooked opinion strength and opinion frequency. Therefore, the current work proposed new methods for feature ranking based on imperative parameters (i) title count, (ii) review count, (iii) accumulated opinion strength, (iv) feature frequency, and (iv) opinion orientation count. These parameters are described in detail in Section 3. The current work contributes to the literature of feature ranking by providing four types of ranking, ranking by weight, feature by positive credence, ranking by negative credence, and overall ranking based on novel ranking methods.

2.3. Opinion Visualizations

The existing literature highlights a variety of visualizations that have been utilized to show consumer opinions, including bar charts, radials, pie charts, graphs and maps. Radial visualization was deployed in the opinion wheel and rose plot to present hotel customer feedback and sentiment contents from a large number of documents, respectively [24,56,57]. Graphs are used for opinion visualization and include coordinated graphs [57], line graphs and pie charts [58], positioning maps [59], comparative relation maps [16] and bar charts [52]. The contradictory comments on the ‘Da Vinci Code’ (bestseller and controversial novel) was visualized using a coordinated graph [57]. The positioning map [59], comparative relation map [16], and bar chart [60] provide competitive intelligence by comparing competitive product based on key features.
A scalable method ‘visual summary report’ for comparing several products and features at a glance was proposed in Ref. [61]. The glowing bars [62] and bars with different shapes [31] present a visual analysis of the really simple syndication RSS news feed. The treemap in Ref. [39] presents a summary of car reviews in which prominent keywords are rendered as boxes. The size of the boxes indicates the number of sentences in which a specific keyword has appeared. The color of the boxes specifies the average opinion of a keyword ranging from red to green to encode the opinion tendency (red for negative opinion and green for positive opinion). The treemap provides multi-dimensional information, such as the most common keywords, the average semantic associated with keywords, and the most positive and negative keywords.
The treemap [39] and bar chart [52] are unable to present opinion strength (that ranges from −3 to +3) on each feature of a target product. Therefore, the treemap is enhanced in this work to present opinion strength (that ranges from −3 to +3) on each feature of a target product. We selected the treemap visualization based on the finding of a usability study with 146 participants performed in our previous work to identify a suitable opinion visualization [63]. This work contributed to opinion visualization literature by proposing opinion-strength-based visualization to provide a multi-dimensional view of consumers’ opinions by displaying the comparison of positive and negative opinions at various levels of (+3 to −3) of opinion strength and significance of a feature.

3. Proposed System

3.1. Theoretical Framework

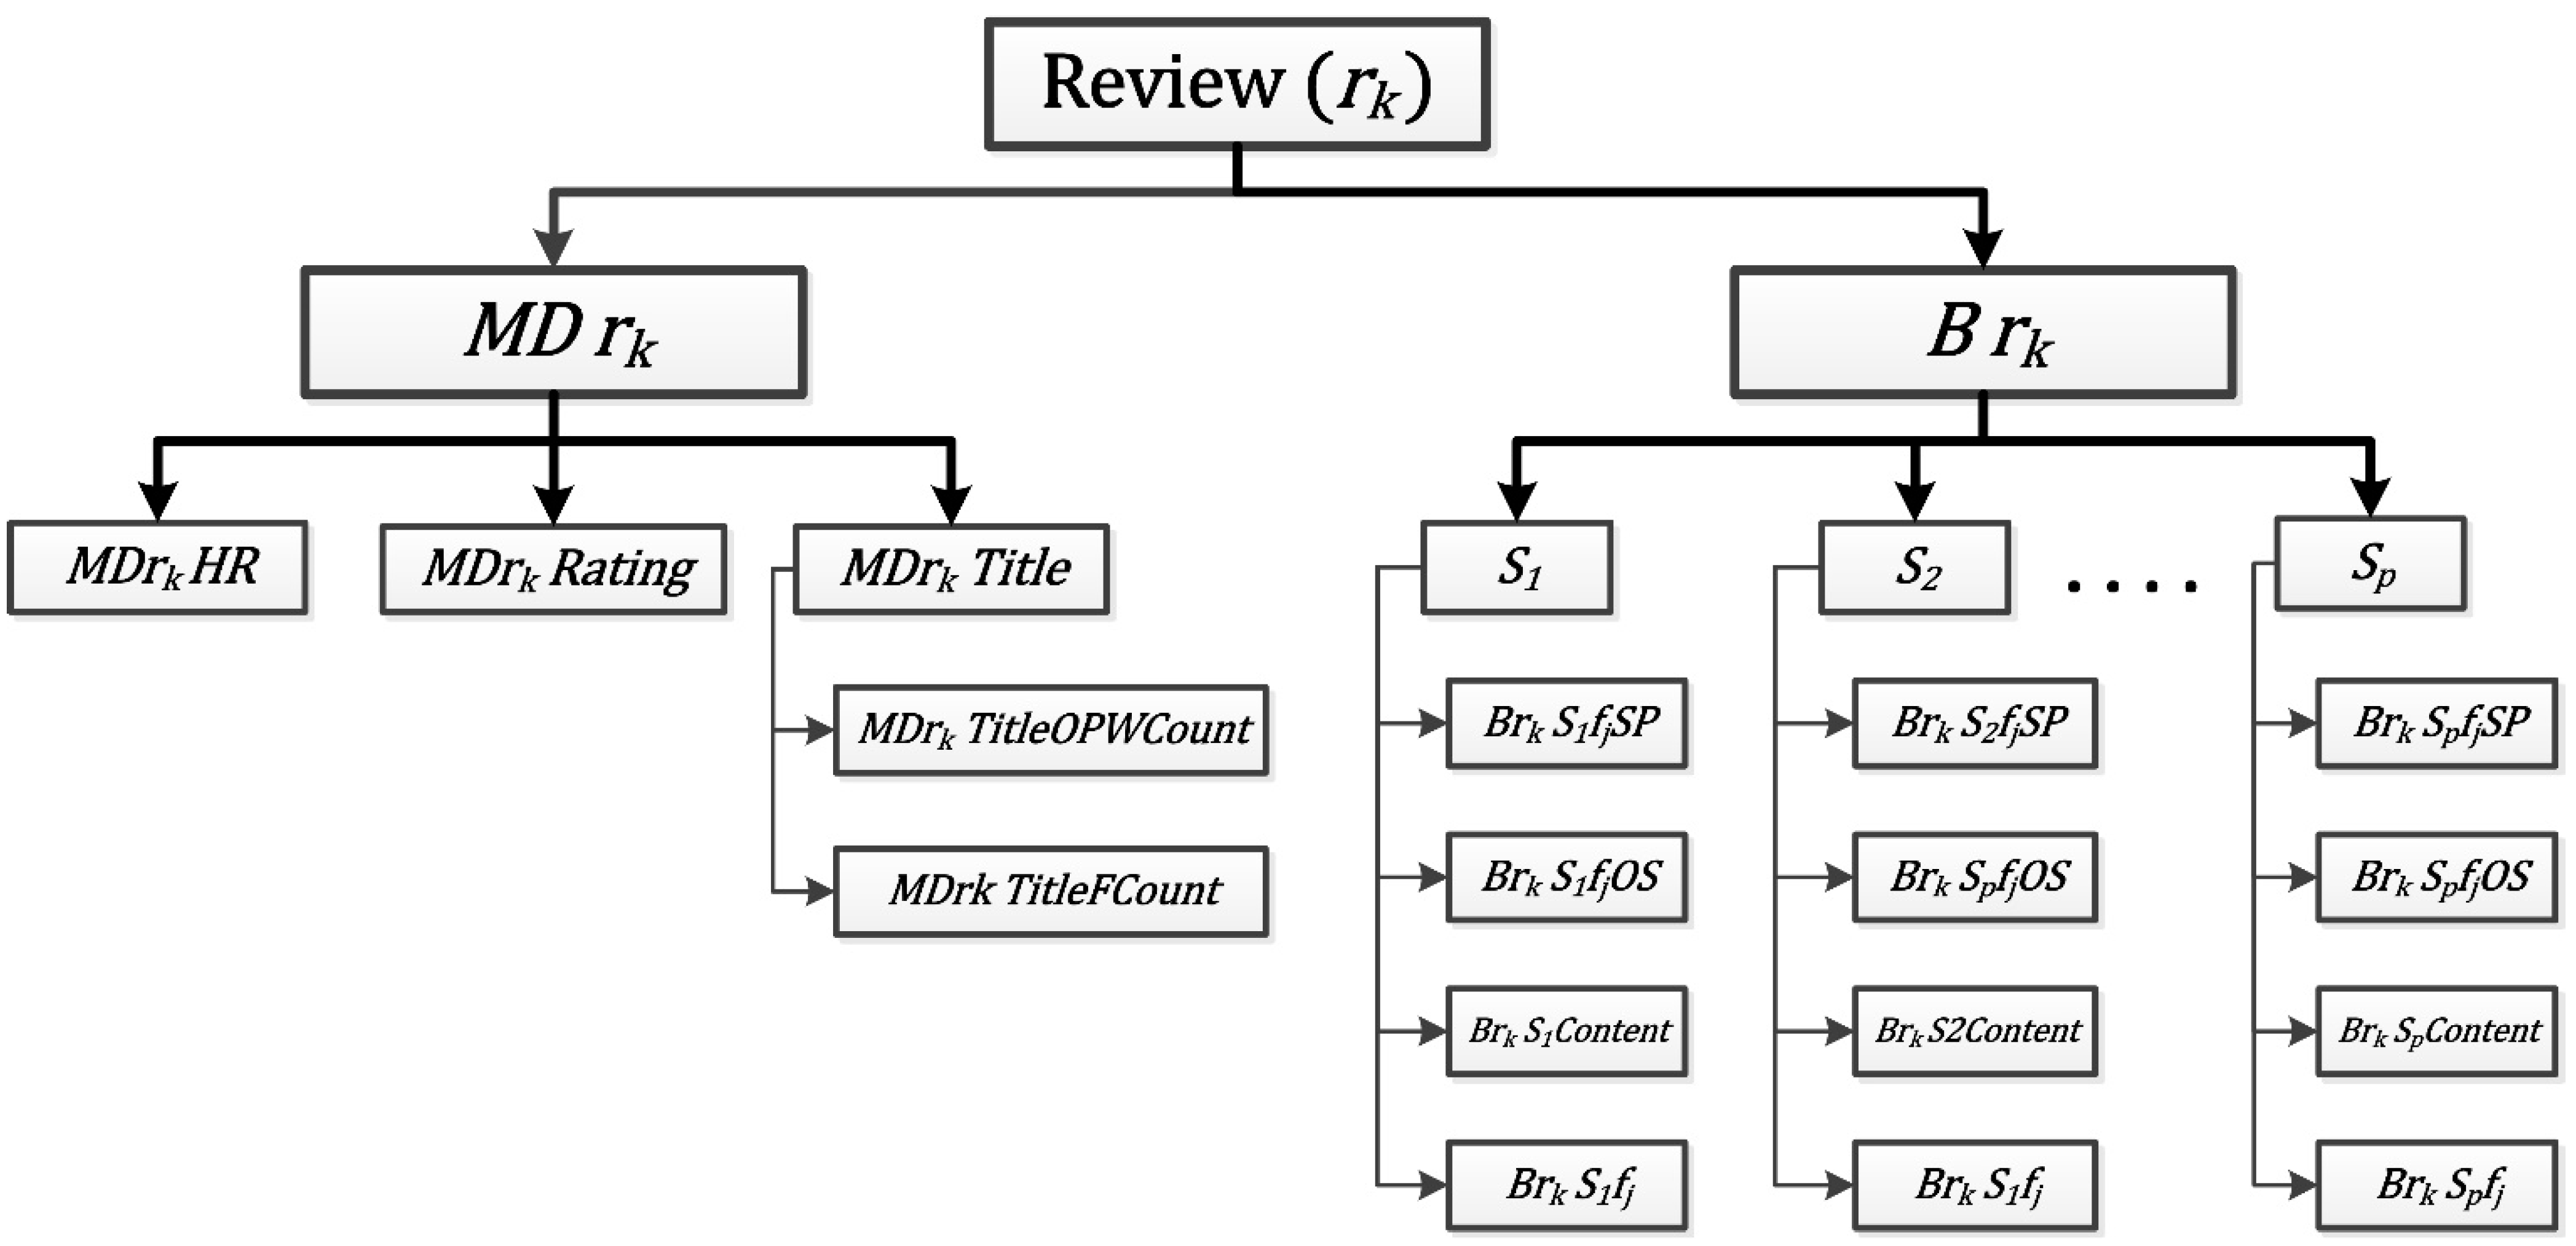
Let document D with product reviews contain n reviews R= [ r 1 , r 2 , r 3 ,   . , r n ] . Every review ( r k ) is comprised of a set of feature-opinion pair, which consists of a feature f j and an opinion word O P W o . Each feature f j may pair with more than one opinion words in a single review or over the set of n reviews. In our proposed system, each review r k is represented by a tuple (termed as review tuple) of two elements [ M D r k ,   B r k ] . The review tuple is as follows:
R e v i e w   r k = [ M D r k ,   B r k ] where M D r k = [ M D r k H R , , M D r k R a t i n g , M D r k T i t l e ] ,   M D r k T i t l e = [ M D r k T i t l e F , M D r k T i t l e O P W ] , B r k = [ s 1 , s 2 , s 3 ,   . , s p ]     s i B r k ,   s i = [ B r k s i f j   , B r k s i f j S P , B r k s i f j O S ,   B r k s i C ontent ]
The M D represents the metadata of a review, and B represents a set of sentences in the body of reviews. Table 1 depicts the description of the abbreviation used. Each sentence s i in B r k is represented by a proposed tuple. The proposed tuple is an extension of tuples presented in Refs. [40,58]. As shown in Figure 1, each sentence s i contains single feature f j . The opinion related to the feature f j s i in a sentence can be positive ( O S P P O S ) or negative ( O S P N E G ) ). Opinion polarity is estimated in the range of −3 to −1 for negative and +1 to +3 for positive (three for strongest and one for weakest). The opinion with positive semantic polarity can have opinion strength strong positive ( O S P O S _ S ), mildly positive ( O S P O S _ M ) or weak positive ( O S P O S _ W ) [52,64,65]. Similarly, the opinion with negative semantic polarity can have opinion strength strong negative ( O S N E G _ S ), mildly negative ( O S N E G _ M ) or weak negative ( O S N E G _ W ) [52,64,65]. A feature tuple is also proposed in work, as shown below.
The mathematical model of the feature tuple that is part of the review tuple is shown below:
B r k s i f j     = [ s i f j freq ,   s i OSP POS ,     s i OSP NEG ] where
      s i OSP POS = [   O S P O S _ S ,     O S P O S _ M ,     O S P O S _ W ]
      s i OSP NEG = [   O S N E G _ S ,     O S N E G _ M ,     O S N E G _ W ]
Consider the following review shown in Figure 2.
The helpfulness ratio ( M D r k H R ,) of the above-mentioned review is 75 (3/4*100) with a 5-star rating. The title of the review indicates a positive opinion with ‘great’ opinion word in the title having an opinion strength strong positive ( O S P O S _ S ) associated with the weight of +3 ( W _ O S P O S _ S ) . The review presents opinions on battery, picture quality, and viewfinder features of a camera. The ‘battery’, ‘picture quality’, and ‘viewfinder’ features are described by the opinion word good, poor, and very good, respectively. The opinion word good is a positive word with the weak positive ( O S P O S _ W ) opinion strength, which is associated with the weight +1 ( W _ O S P O S _ W ). However, the opinion word poor is a negative word with the O S N E G _ W strength (associated with the weight −1). The semantic orientation of the opinion word very good is positive with the opinion strength of O S P O S _ S (where W _ O S P O S _ S = 3 ) . The tuple of the review presented in Figure 2 is demonstrated in Figure 3.
Consider the following reviews shown in Figure 4.
Figure 4 shows three reviews containing opinions on three different features (picture quality, battery, viewfinder) of a digital camera. The resultant feature tuple of the battery feature is presented in Figure 5. The battery feature was mentioned in all of the reviews three times; therefore, its weight is three. Three opinion words (good, poor, disappointing) are associated with the battery feature. These opinion words are Weakly Positive, Weakly Negative and Mildly Negative with corresponding values of +1, −1, and −2, respectively. One positive opinion word having an opinion strength of +1 is associated with the battery feature, and hence the O S P P O S value of the battery is +1, while two negative words with −1 and −2 opinion strengths are connected with the feature battery, resulting in the value of O S P N E G of the feature equals to −3 (−2 + −1).

3.2. Architecture of the System

The proposed system consists of five components: pre-processor, feature and opinion extractor, review ranker, feature ranker, and opinion visualizer (see Figure 6). This architecture is based on a previous study [52].

3.2.1. Pre-Processor

A pre-processor prepares a document containing reviews for review and feature ranking. A variety of processes, including conversion of review text to lower case, removal of non-alphabetic characters, tokenization, stop word filter, spell checker, word stemming, and part of speech (POS) tagging, are performed by the component. Firstly, the text of the document is transformed into lower case. Secondly, stop words are eliminated from the document by applying a stop word filter using a defined list of stop words. Thirdly, word-stemming is performed to convert derivationally and inflectional forms of words into a base form. After that, noise is removed from the document by spell checking. Then POS tagging is employed to assign a POS category to each word in the document. In the end, the tokenization returns a list of words.

3.2.2. Feature and Opinion Extractor

Feature and opinion extractor extracts candidate features along with opinion words to generate a list of potential features. An existing study revealed that 60%–70% of the product features are represented by frequent explicit nouns [55]. The current study considered frequent nouns or noun phrases as candidate features based on the findings of existing studies [42,52,53,58]. Let us suppose there are q nouns (i.e., features) ( n 1 ,   n 2 , n 3 . , n q ) extracted from all the review tuples and stored in the list. A window based approach [41] is then utilized to extract opinion words associated with a particular feature in which opinion words discussed within K words of a particular feature are selected as associated opinion words. In contrast to existing studies [42,43,44,52] which extract nouns based only on feature frequency, we utilized three parameters to extract prominent features from a review document.
The noun j weight ( n j w e i g h t ) is calculated based on the assumption that frequently discussed nouns in a large number of high-quality reviews associated with several opinion words discussed in considerable review titles are significant product features. To identify potential features and associated opinion words from the list of nouns, an algorithm called feature and opinion extractor is proposed and presented in Figure 7. The inputs to the algorithm are the list of nouns (NounsList[]) extracted from reviews tuples (stored in the list Reviews[]) and review document. NounsList[] is an adjacency list [10] that can store the associated opinion words with a noun. Associated opinion words for feature n j is searched in all reviews, and opinion words that are on a distance of K words from the selected noun are populated in the NounsList[]. The following five equations are used to calculate n j weight . In Equation (1), the frequency of noun n j ( n j f r e q ) is calculated based on its occurrence in the review document consisting of m reivews. In other words, n j f r e q in Equation (1) represents count of n j occurrence in reviews.
n j f r e q =     k = 1 m c o u n t n j O c c u r e n c e ( r k ) .  
The number of opinion words associated with noun n j in the whole review document is calculated in Equation (2). n j O P W C o u n t (depicted in Equation (2) is the number of opinion words associated with the noun n j .
n j O P W C o u n t =     k = 1 m c o u n t D i s t i n c t O P W w i t h n j ( r k ) .
The numbers of times noun n j appeared in the titles of reviews is described by Equation (3) where T i t l e C o u n t w i t h n j is the number of titles in which the noun n j discussed. In Equation (3), the bracket value is 1 (using the inversion notation [10]), if the condition holds otherwise, it is 0 [10]. The condition [ n j E x i s t i n R e v i e w T i t l e ( r k ) = T r u e ] in Equation (3), returns 1, if n j exists in the review r k title.
T i t l e C o u n t w i t h n j =     k = 1 m [ n j E x i s t i n R e v i e w T i t l e ( r k ) = T r u e ] .  
Equation (4) computes the numbers of times noun n j appeared in reviews.
R e v i e w C o u n t w i t h n j =   k = 1 m [ n j E x i s t i n R e v i e w ( r k ) = T r u e ] .
Equation (5) shows the calculation of feature weight. The values of n j f r e q , n j O P W C o u n t , T i t l e C o u n t w i t h n j , and R e v i e w C o u n t w i t h n j calculated in Equations (1)–(4) are utilized in the Equation (4) to calculated the weight of a feature. Therefore, our proposed method to calculated weight of a noun is based on four paramters: (i) frequency of noun n j , (ii) the number of associated opinion words with noun n j , and (iii) the number of times noun n j appreared in reviews’ title, and number of reviews in which n j appeared ( R e v i e w C o u n t w i t h n j ) . These parametera are calculated for each noun from (Lines 8–17) of the algorithm.
n j w e i g h t = n j f r e q + n j O P W C o u n t + T i t l e C o u n t w i t h n j + R e v i e w C o u n t w i t h n j
The noun frequency n j f r e q , n j O P W C o u n t , and T i t l e C o u n t n j are then summed up to compute the weight of a review called n j F i n a l S c o r e in the algorithm (Line 20–21). This n j F i n a l S c o r e is used to filter the nouns. Nouns having a FinalScore n j above a threshold β are selected as potential features. After this, FeatureOpinionList[] containing the selected (most frequent) features with associated opinion words is built.

3.2.3. Review Ranker

The job of the review ranker is to calculate the rank of reviews stored in the review document. To calculate the rank of a review, first, the weight of each review is calculated based on five parameters. A user can define the contribution of these parameters by assigning them a weight. After assigning the weight to the reviews, the reviews are classified into five classes: (a) excellent, (b) good, (c) average, (d) fair, and (e) poor according to their weights.
To compute the class of each review stored in the review document, a ReviewRanking algorithm is proposed and presented in Figure 8. The core of the algorithm is to assign weights to reviews. The parameters used to compute the weight of a review tuple are: (i) title score (TitleScore), (ii) number of features in the review body ( B r k F c o u n t ), (iii) number of opinion words in the review body ( B r k O P W c o u n t ), (iv) helpfulness ratio ( M D r k H R ), and (v) users’ rating M D r k r a t i n g . The Title score depicts the sum of the number of feature and opinion words in the review title. Firstly, for each review tuple, the algorithm computes the number of features ( M D r k T i t l e F c o u n t ) and opinion words ( M D r k T i t l e O P W c o u n t ) appearing in the review title and then these computations are used to calculated title score (TitleScore) (Line 4–12). In other words, the Title score represents the sum of M D r k T i t l e F c o u n t , and M D r k T i t l e O P W c o u n t Moreover, for each review tuple the number of opinion words ( B r k O P W c o u n t ) and features ( B r k F c o u n t ) appearing in the body are calculated (Line 14-21). Weight of each review ( r k W e i g h t ) is computed based on the values of the parameters ( B r k F c o u n t , M D r k r a t i n g , M D r k H R , B r k O P W c o u n t , T i t l e S c o r e ). Users’ preferences are incorporated in review ranking by defining the weight of each parameter ( W _ UP 1 , W _ UP 2 , W _ UP 3 , W _ UP 4 , and W _ UP 5 ) by users. User preferences weights ( W _ U P 1 , W _ U P 2 , W U P 3 ,   W _ U P 4 , and W _ U P 5 ) and the weights assigned to T i t l e S c o r e (α) are presented in (Line 23-25). Title weight coefficient (α) can be adjusted depending on the size and nature of experimental data. We set the value of α to 10 based on the conclusion of Ref. [42]. Maximum weight ( Max W e i g h t R e v i e w ) among the m reviews is computed in Line 27. After calculating the weights of reviews, class of each review is calculated (based on review own weight and maximum weight ( Max W e i g h t R e v i e w ) among all reviews weights). Based on r k W e i g h t   and   Max W e i g h t R e v i e w ;   r k can be classified as one of the following review classes: (i) Excellent, (ii) Good, (iii) Average, (iv) Fair, and (v) Poor. We utilized these five review classes of Ref. [52] to depict the quality of each review in the review document and to distinguish high-quality reviews (HQ_reviews) from low-quality reviews to improve feature ranking. The presented scheme requires the user to decide which of the classes to be selected. The reviews that belong to selected classes (termed as high-quality reviews) are considered for feature ranking and opinion summary. For example, if the user selects classes Excellent, and Good; then all the reviews with r k C l a s s equals Excellent, and Good are declared as high-quality reviews.
Consider the review shown in Figure 9 as an example. In this review, features are highlighted in red while opinion words are highlighted in green. The T i t l e S c o r e of the review is two as the title of the review comprises of one feature (Picture) and one opinion word (Brilliant). There are four features in the body of the review (picture quality, viewfinder, zoom, battery), and as a result, the B r k F C o u n t score of the review is four. Four opinion words (excellent, poor, good and fantastic) are expressed in the review, so the B r k O P W C o u n t of the review is four. Putting the values of the r k W e i g h t computation equation results in 25.4. In the calculation of the r k W e i g h t of the review r k shown in Figure 9, assuming the value of 0.20 for all preferences ( W _ U P 1 , W _ U P 2 , W _ U P 3 ,   W _ U P 4 , and W _ U P 5 ).

3.2.4. Feature Ranker

After discarding low-quality reviews (with C l a s s r k below a certain threshold θ   specified   by   user ) among n reviews, we are left with m high-quality reviews (HQ-Reviews[]). The feature ranker ranks the extracted features (FeatureOpinionList[]) by utilizing high-quality reviews provided by the review ranker. In contrast to Ref. [52], we are enhancing the feature ranking by incorporating opinion and feature frequency along with opinion strength and orientation. The proposed feature ranker computes four rankings for every feature f j based on the information presented in high-quality reviews: (i) feature f j weight ( f j w e i g h t ) , (depicted in Equation (10)); (ii) positive credence of f j ( f j P O S C r e d ) , (depicted in Equation (12)); (iii) negative credence ( f j N E G C r e d ) , (depicted in Equation (14)); and (iv) overall credence ( f j R a n k ) , (depicted in Equation (15)). An algorithm is proposed and presented in Figure 10 to calculate these ranking of a feature.
The f j w e i g h t is calculated based on the idea that frequently discussed features in a large number of high-quality reviews associated with many opinion words that appeared in substantial reviews’ titles are decisive product features. Therefore, the value of f j w e i g h t is calculated using four parameters; (i) count of f j occurrence in high-quality reviews ( f j f r e q ), (ii) the number of opinion words associated with the f j ( f j O P W C o u n t ), (iii) number of reviews which discussed the feature in title or body ( R e v i e w C o u n t w i t h f j ), and (iv) the number of reviews’ titles that contains the feature ( T i t l e C o u n t w i t h f j ). These parameters are computed using Equations (6)–(9), respectively as shown (Lines 3–10) of the algorithm. Moreover, T i t l e C o u n t w i t h f j and R e v C o u n t w i t h f j are exploited in calculating the weight of a feature f j on the ground that if a feature f j is discussed in many reviews and titles, then it is significant. The calculation of f j w e i g h t is depicted in Equation (10).
f j f r e q =     k = 1 m c o u n t f j O c c u r e n c e ( r k ) ,  
f j O P W C o u n t =     k = 1 m c o u n t D i s t i n c t O P W w i t h f j ( r k ) ,
R e v i e w C o u n t w i t h f j =     k = 1 m [ f j E x i s t i n R e v i e w ( r k ) = T r u e ] ,
T i t l e C o u n t w i t h f j =     k = 1 m [ f j E x i s t i n R e v i e w T i t l e ( r k ) = T r u e ] ,  
f j w e i g h t = f j f r e q + f j O P W C o u n t + R e v i e w C o u n t w i t h f j       + T i t l e C o u n t w i t h f j .
C o u n t f j O S P P O S in Equation (11) represents the count of positive opinions for the feature f j in all sentences of m reviews. In Equation (11), the condition [   s k f j O S P = O S P P O S ] returns to 1 if s k f j O S P is p o s i t i v e , otherwise it would return zero. In Equation (12), the condition [ s k f j O S =   O S P O S _ M ] returns to 1 if the feature opinion strength in sent s k is O S P O S _ M , otherwise it would return zero. Moreover, r = 1 m k = 1 s e n t e n c e s ( r )   O S P O S _ M [ s k f j O S =   O S P O S _ M ] sums the opinion strength O S P O S _ M the number of times it appears in the sentences of all m reviews. Positive credence ( f j P O S C r e d ) of a feature f j in Equation (12), denotes the number of positive opinion words used to describe a feature f j and the accumulated strength of associated positive opinion words. The larger the value of f j P O S C r e d denotes that the feature f j was discussed more positively and many times.
C o u n t f j O S P P O S =     r = 1 m k = 1 s e n t e n c e s ( r ) [ s k f j O S P = O S P P O S ] ,
f j P O S C r e d   = C o u n t f j O S P P O S + r = 1 m k = 1 ,   s e n t e n c e s ( r ) W _   O S P O S _ S [ s k f j O S =   O S P O S _ S ] +     r = 1 m k = 1 s e n t e n c e s ( r )   W _ O S P O S _ M [ s k f j O S =   O S P O S _ M ] +   r = 1 m k = 1 s e n t e n c e s ( r ) W _   O S P O S _ W   [ s k f j O S =   O S P O S _ W ] .
Equation (13) depicts the total number of occurrences of negative opinions of a feature f j in the body of m high-quality reviews. f j N E G C r e d in Equation (14) reflects the number of negative opinion words used to describe a feature and the total strength of these negative opinion words. The idea behind f j N E G C r e d is that the rank of a feature f j should be higher than other features if f j is associated with more negative words. The high value of f j N E G C r e d indicates that the features are discussed negatively by a large number of users.
C o u n t f j O S P N E G =     r = 1 m k = 1 s e n t e n c e s ( r ) [ s k f j O S P = O S P N E G ] ,
f j N E G C r e d = C o u n t f j O S P N E G   +   r = 1 m k = 1 ,   s e n t e n c e s ( r )   W O S N E G S [ s k f j O S =   O S N E G S ]     +   r = 1 m k = 1 s e n t e n c e s ( r )   W _ O S N E G _ M [ s k f j O S =   O S N E G _ M ]   +   r = 1 m k = 1 s e n t e n c e s ( r )   w _ O S N E G _ W   [ s k f j O S =   O S N E G _ W ] .
C o u n t f j O S P N E G is subtracted from f j P O S C r e d of a feature f j to obtain an overall rank ( f j R a n k ) as shown in Equation (15).
f j R a n k =   f j P O S C r e d   f j N E G C r e d .  
The count of O S P O S _ S , O S P O S _ M , O S P O S _ W ,   O S N E G _ S , O S N E G _ M , O S N E G _ W in each review is computed (Lines 12–25). f j W e i g h t is computed in Line 38 and f j R a n k is computed in Line 47.

3.2.5. Opinion Visualizer

An extensive literature review followed by a usability study with 146 participants was performed by the authors in their previous work to identify a suitable opinion visualization [63]. In Ref. [63], a questionnaire survey was performed to get feedback from users about existing opinion visualizations. Users’ preferred visualization (tree map [39]) is adapted for the current study based on the findings of a previous study. The proposed visualization provides a multi-dimensional view of consumer opinions. The proposed visualization is discussed in the result section.

4. Evaluation of Proposed System

4.1. Dataset

Python 2.7 using a natural language toolkit (NLTK) was used to implement the proposed system. For the evaluation of the proposed system, experiments were performed on a real dataset (from amazon.com) utilized by Refs. [52,53,64,66,67]. The dataset contains user reviews of five digital devices, as shown in Table 2.
The evaluation of the proposed system was performed by computing the accuracy of review quality evaluation, f j P O S C r e d , f j N E G C r e d   , and f j R a n k .
Manually calculated class (actual class) is compared with a system generated class (extracted class) to calculate the accuracy of reviews, as shown in the formula below:
A c c u r a c y =   E x t r a c t e d   V a l u e A c t u a l   V a l u e 100
The accuracy reveals how accurate the proposed review ranking scheme is in calculating the review quality class. Correspondingly, the actual values of f j P O S C r e d , f j N E G C r e d and f j R a n k are compared with extracted values to find the accuracy of the proposed feature ranking scheme. An example of accuracy calculation of f j P O S C r e d , f j N E G C r e d , and f j R a n k is given in Table 3.

4.2. Results and Discussion

4.2.1. Review Quality Classification

The classification of the review quality of ‘digital camera 1’ shows mixed quality reviews (Table 4). The majority of the reviews are classified as good, presenting sufficient opinions on digital camera 1. It is interesting to note that only a few reviews are labelled as excellent. Furthermore, 64% of the reviews belong to ‘good’ and ‘average’ reviews, delivering ample opinions on different features of digital camera 1. Only 14 reviews out of 45 (31%) were found to be ‘fair’ and ‘poor’. The review quality classes of ‘DVD Player’ are illustrated in Table 4. Forty-four percent of the reviews were collectively classified as ‘Excellent’ and ‘Good’. However, many reviews belong to the poor class, showing the low quality of these reviews. Notably in Table 4, 58% of reviews are categorized as the top three classes (Excellent, Good, Average) of review quality.
The average accuracy of the review classification of all five products is presented in Figure 11. The system accomplished greater than 80% accuracy for all products. Further, the system achieved an average accuracy of 85% for all products.

4.2.2. Feature Ranking

This section reports the f j P O S C r e d ,   f j N E G C r e d ,   and   f j R a n k of the data files along with the accuracy achieved by the System in Table 5. The f j P O S C r e d ,   f j N E G C r e d and f j R a n k of each feature f j were computed using Equations (12), (14), and (15), respectively, given in Section 3.2.4. The accuracy of the feature ranking scheme was calculated using Equation (16) given in Section 4.1. Due to word limits, only the results of DVD Player are presented here.
The top ten features of ‘DVD Player’ are highlighted in Table 5 according to the positive credence ( f j P O S C r e d ) . The ‘Player’ received the highest f j P O S C r e d , indicating its appreciation by many users. The next three features (Play, Price, Feature) show users’ endorsement with positive ranks of 31, 28, and 23, respectively. The features Apex, Picture, Work, ‘Product’, and ‘Unit’ are also acknowledged positively by some users. The accuracy of the top 10 features of DVD Player according to the f j P O S C r e d are shown in Table 5. The accuracy of features ‘Product’, ‘Unit’, ‘Service’, and ‘Feature’ was found to be 100%. Moreover, another four features, Player’, ‘Play’, ‘Apex’, and ‘Work’, achieved accuracy of 86%, 90%, 92%, and 87.5%, respectively. Further, the accuracy of only 60% belongs to the feature ‘Feature’, resulting in an average accuracy of 90%.
The top ten features of DVD Player are shown in Table 5 according to the f j N E G C r e d (negative credence). DVD Player received f j N E G C r e d of 196, indicating its inadequacy. Users also disapproved the ‘Play’, ‘Picture’, ‘Apex’ and ‘Quality’ features of DVD Player, as indicated by their larger f j N E G C r e d . The features, namely ‘Video’, ‘Unit’, ‘Disc’, ‘Button’, and ‘Product’, also were negatively discussed by some users. The accuracy of the top 10 features of DVD Player is shown in Table 5, according to the f j N E G C r e d . Three features (apex, button, unit) achieved 100% accuracy. ‘Player’, ‘Play’, and ‘Product’ features showed more than 80% accuracy resulting in overall accuracy of 81%. However, the accuracy of one feature ‘Quality’ is only 58%.
The top ten features of DVD Player are highlighted in Table 5, according to the f j R a n k . The top four features, namely ‘Feature’, ‘Price’, ‘Work’, ‘Product’, have positive f j R a n k , describing users’ satisfaction about these features. Conversely, the negative f j R a n k score of features Unit’, ‘Service’, ‘Play’, ‘Button’, ‘Disc’, and ‘Apex’ illustrate users’ dissatisfaction. The accuracy of DVD Player’s top ten features, according to the Orank, is shown in Table 5, illustrating four features achieved 100% accuracy (feature, unit, service, button). However, the average accuracy of the system was found to be 81%.

4.3. Comparison of Proposed System with FBS System and Opinion Analyzer

We compared the results of the proposed system with two state-of-the-art systems, namely, the opinion analyzer (our previous work that is enhanced in the current study) [52] and the FBS system [53]. These systems are selected for the comparison, as the dataset utilized is same. In addition, the objectives of these systems are feature ranking based on consumers’ opinions. It is notable that the top ten features of Digital Camera 1 of the proposed system and opinion analyzer are different as the methods used to extract features in both systems are different. To compare these systems, firstly, we extracted the common features from top ten features of these systems according to positive and negative ranks. There are eight and nine common features in positive and negative rank, respectively. Secondly, we compared the accuracy of these common features for positive and negative ranks separately, as shown in Figure 12 and Figure 13. The average accuracy of the proposed system (95%) is slightly better than opinion analyzer (92%) for positive rank (Table 6). However, the proposed system showed a little degradation on average accuracy for negative rank (Table 6). This is might due to the fact that we utilized more parameters for feature extraction as compared to opinion analyzer.
Similarly, we compared the average accuracy of the top ten features of five products based on the positive and negative credence’s with the accuracy of the FBS system [53]. The proposed system outclassed FBS system on the accuracy of four products (cellular phone, Digital Camera 1, MP3 Player, DVD Player), as shown in Figure 14. In the case of Digital Camera 2, the proposed exhibited a little accuracy deprivation; however, the proposed system surpassed FBS based on average accuracy. Table 6 shows the average accuracy achieved by the proposed system and opinion analyzer for positive and negative ranks. It can be seen that the average accuracy for positive and negative ranks are same for both systems.

4.4. Opinion Visualizer

In this work, due to space constraints, we are presenting the opinion summary of Digital Camera 1 only. The proposed tree map visualization is shown in Figure 15. The tree map consists of ten rectangles. Each rectangle represents one feature. The weight of a feature is depicted by the size of the rectangle. Each rectangle is further divided into various sections according to opinion orientation and strength. Positive and negative opinions on a feature are expressed by the rectangle at 6 levels: three for positive (weakly positive, mildly positive, strongly positive) and three for negative (weakly negative, mildly negative, and strongly negative), using different shades of red and green colors. Figure 16 shows the color scheme used in the tree map. The proposed tree map presents the comparison of opinions at six levels of opinion strength as compared to the tree map of Reference [39].
A large number of users discussed about the camera as shown by the size of camera rectangle in Figure 15. Two types of negative opinions (strongly negative and mildly negative) expressed on the camera. However, users appreciated the camera by stating strongly, mildly, and weakly positive opinions. The second feature is picture according to the size of rectangle (weight). It received only three types of opinions: strongly positive, mildly positive, and strongly negative. The features ‘Battery’ and ‘Use’ acknowledged by only positive opinions. On the other hand, ‘Viewfinder’ of the camera is discussed negatively with mildly negative or weakly negative comments. Only mildly positive opinions were expressed by users on the features ‘LCD’ and ‘Lens’. The features ‘Software’ and ‘Flash’ of Digital Camera 1 were considered both positively and negatively by the users. The overall opinion of users on Digital Camera 1 found to be positive.

Case Study

The proposed opinion-strength-based visualization was evaluated by conducting a usability study. The aim of the usability study is to identify the effectiveness and usefulness of the visualization. A total of ten participants (6 Male, 4 Female) was participated in the study. At first, the concepts of the proposed visualization were presented to the participants. After that the participants were asked to provide their feed back about user-friendliness, visual appeal, informativeness, understandability, and intuitiveness of the visualization. A 5-point Likert scale (Strongly Disagree to Strongly Agree) was ultilized to get the feedback. Figure 17 demonstrates the result of the usability study.
None of the participants strongly disagreed with the visual appeal, understandability, intuitiveness, and informativeness. Figure 17 shows that most of the participants reported strong agreement or agreement on the usability of the proposed visualization. The use of a color scale to increase the understanding of the visualization was suggested by two participants. The suggestion was incorporated. Another suggestion provided by many participants is to increase the width of borders and this suggestion is amalgamated. Last modification was done is the increase of font size based on the results of the usability study.

5. Conclusion, Limitation and Future work

In this paper, authors proposed novel ranking schemes for users’ reviews and product features along with an opinion-strength-based visualization to present users high quality information from massive reviews. The focus is to improve existing ranking schemes of reviews and features by incorporating users’ preferences with enhanced parameters set that are not considered in previous studies. In contrast to existing opinion mining system, the proposed system integrates review ranking and feature ranking by utilized only high-quality reviews based on users’ preferences for feature ranking that result in enhanced product feature ranking. First, the information overload problem (selecting high quality reviews) was addressed by proposing a new review ranking scheme. Second, a new scheme for feature ranking based on an enhanced parameter set was proposed. Third, binary classification-based visualization was improved by the introduction of opinion-strength-based visualization that present users’ opinions on critical product features at multiple levels according to opinion intensity. Four, the accuracy of the system is accessed using a real dataset of 332 reviews of five products from amazon.com. Finally, a usability study is performed to evaluate the quality of the proposed visualization. Our results show an average accuracy of 85% for review quality classification. Moreover, the results of Digital Camera 1 and DVD Player show five classes of reviews, presenting the insight about the quality of reviews. Player, play, and feature are found to be the top three features of the DVD Player according to positive credence, whereas player, play, and pictures are the top three features according to negative credence. The proposed system achieved promising results over existing systems. The study has some limitations as the system is evaluated on 332 reviews of one domain (electronic product). Future research should target more products having a large number reviews from different domains.

Author Contributions

Conceptualization, A.S., M.A.Q. and M.L.; Data curation, F.J. and M.B.; Formal analysis, M.L. and Y.Z.J.; Funding acquisition, M.A.; Investigation, Y.Z.J.; Resources, M.A.; Software, M.B.; Supervision, M.A.Q. and M.A.; Visualization, M.B. and Y.Z.J.; Writing—original draft, A.S., M.A.Q., F.J. and M.L.; Writing—review & editing, M.B. and M.A. All authors have read and agreed to the published version of the manuscript.

Funding

This research was supported by the National Research Foundation of Korea grant funded by the Korean Government (2020R1G1A1013221).

Institutional Review Board Statement

Not applicable.

Informed Consent Statement

Not applicable.

Data Availability Statement

The online customer reviews used in this study are taken from the publicly available Amazon.com dataset.

Conflicts of Interest

The authors declare no conflict of interest.

References

  1. Li, G.; Wang, H.; Hardjawana, W. New advancement in information technologies for industry 4.0. Enterp. Inf. Syst. 2020, 402–405. [Google Scholar] [CrossRef] [Green Version]
  2. Khan, S.S.; Khan, M.; Ran, Q.; Naseem, R. Challenges in Opinion Mining, Comprehensive Review. Sci. Technol. J. 2018, 33, 123–135. [Google Scholar]
  3. Reyes-Menendez, A.; Saura, J.R.; Thomas, S.B. Exploring key indicators of social identity in the# MeToo era: Using discourse analysis in UGC. Int. J. Inf. Manag. 2020, 54, 102129. [Google Scholar]
  4. Na, J.-C.; Thet, T.T.; Khoo, C.S.G. Comparing sentiment expression in movie reviews from four online genres. Online Inf. Rev. 2010, 34, 317–338. [Google Scholar] [CrossRef]
  5. Al-Natour, S.; Turetken, O. A comparative assessment of sentiment analysis and star ratings for consumer reviews. Int. J. Inf. Manag. 2020, 54, 102132. [Google Scholar] [CrossRef]
  6. Lo, Y.W.; Potdar, V. A review of opinion mining and sentiment classification framework in social networks. In Proceedings of the 3rd IEEE International Conference on Digital Ecosystems and Technologies, Istanbul, Turkey, 1–3 June 2009; pp. 396–401. [Google Scholar]
  7. Hassani, H.; Beneki, C.; Unger, S.; Mazinani, M.T.; Yeganegi, M.R. Text mining in big data analytics. Big Data Cogn. Comput. 2020, 4, 1. [Google Scholar] [CrossRef] [Green Version]
  8. Singh, R.K.; Sachan, M.K.; Patel, R.B. 360 degree view of cross-domain opinion classification: A survey. Artif. Intell. Rev. 2021, 54, 1385–1506. [Google Scholar] [CrossRef]
  9. Hao, M.C.; Rohrdantz, C.; Janetzko, H.; Keim, D.A.; Dayal, U.; Haug, L.E.; Hsu, M.; Stoffel, F. Visual sentiment analysis of customer feedback streams using geo-temporal term associations. Inf. Vis. 2013, 12, 273–290. [Google Scholar] [CrossRef] [Green Version]
  10. Rohrdantz, C.; Hao, M.C.; Dayal, U.; Haug, L.-E.; Keim, D.A. Feature-Based Visual Sentiment Analysis of Text Document Streams. ACM Trans. Intell. Syst. Technol. 2012, 3, 1–25. [Google Scholar] [CrossRef]
  11. Bilal, M.; Gani, A.; Lali, M.I.U.; Marjani, M.; Malik, N. Social profiling: A review, taxonomy, and challenges. Cyberpsychol. Behav. Soc. Netw. 2019, 22, 433–450. [Google Scholar]
  12. Chevalier, J.A.; Mayzlin, D. The Effect of Word of Mouth on Sales: Online Book Reviews. J. Mark. Res. 2006, 43, 345–354. [Google Scholar] [CrossRef] [Green Version]
  13. Moghaddam, S.; Ester, M. ILDA: Interdependent LDA Model for Learning Latent Aspects and their Ratings from Online Product Reviews Categories and Subject Descriptors. In Proceedings of the 34th International ACM SIGIR Conference on Research and Development in Information Retrieval-SIGIR ’11, Beijing, China, 24–28 July 2011; pp. 665–674. [Google Scholar]
  14. Lu, Y.; Tsaparas, P.; Ntoulas, A.; Polanyi, L. Exploiting social context for review quality prediction. In Proceedings of the 19th International Conference on World Wide Web-WWW ’10, Raleigh, NC, USA, 26–30 April 2010. [Google Scholar]
  15. Shamim, A.; Balakrishnan, V.; Tahir, M. Opinion Mining and Sentiment Analysis Systems: A Comparison of Design Considerations. In Proceedings of the 20th IBIMA Conference, Kuala Lumpur, Malaysia, 25–26 March 2013; pp. 1–7. [Google Scholar]
  16. Xu, K.; Liao, S.S.; Li, J.; Song, Y. Mining comparative opinions from customer reviews for Competitive Intelligence. Decis. Support Syst. 2011, 50, 743–754. [Google Scholar] [CrossRef]
  17. Jalilvand, M.R.; Samiei, N. The effect of electronic word of mouth on brand image and purchase intention: An empirical study in the automobile industry in Iran. Mark. Intell. Plan. 2012, 30, 460–476. [Google Scholar] [CrossRef]
  18. Bilal, M.; Marjani, M.; Lali, M.I.; Malik, N.; Gani, A.; Hashem, I.A.T. Profiling Users’ Behavior, and Identifying Important Features of Review “Helpfulness”. IEEE Access. 2020, 8, 77227–77244. [Google Scholar] [CrossRef]
  19. Dalal, M.K.; Zaveri, M.A. Opinion Mining from Online User Reviews Using Fuzzy Linguistic Hedges. Appl. Comput. Intell. Soft Comput. 2014, 2014, 735942. [Google Scholar] [CrossRef] [Green Version]
  20. Bilal, M.; Marjani, M.; Hashem, I.A.T.; Gani, A.; Liaqat, M.; Ko, K. Profiling and predicting the cumulative helpfulness (Quality) of crowd-sourced reviews. Information 2019, 10, 295. [Google Scholar] [CrossRef] [Green Version]
  21. Benlahbib, A. Aggregating customer review attributes for online reputation generation. IEEE Access. 2020, 8, 96550–96564. [Google Scholar] [CrossRef]
  22. Xu, X. How do consumers in the sharing economy value sharing? Evidence from online reviews. Decis. Support Syst. 2020, 128, 113162. [Google Scholar] [CrossRef]
  23. Wang, R.; Zhou, D.; Jiang, M.; Si, J.; Yang, Y. A survey on opinion mining: From stance to product aspect. IEEE Access 2019, 7, 41101–41124. [Google Scholar] [CrossRef]
  24. Shamim, A.; Balakrishnan, V.; Tahir, M. Evaluation of Opinion Visualization Techniques. Inf. Vis. 2015, 14, 339–358. [Google Scholar] [CrossRef]
  25. Ding, X.; Liu, B.; Yu, P.S.; Street, S.M. A holistic lexicon-based approach to opinion mining. In Proceedings of the International Conference on Web Search and Web Data Mining, Palo Alto, CA, USA, 11–12 February 2008; pp. 231–240. [Google Scholar]
  26. Binali, H.; Potdar, V.; Wu, C. A State Of The Art Opinion Mining and Its Application Domains. In Proceedings of the IEEE International Conference on Industrial Technology (ICIT ’09), Churchill, Australia, 10–13 February 2009. [Google Scholar]
  27. Wu, Y.; Wei, F.; Liu, S.; Au, N. OpinionSeer: Interactive Visualization of Hotel Customer Feedback. IEEE Trans. Vis. Comput. Graph. 2010, 16, 1109–1118. [Google Scholar]
  28. Moghaddam, S.; Jamali, M. ETF: Extended Tensor Factorization Model for Personalizing Prediction of Review Helpfulness Categories and Subject Descriptors. In Proceedings of the Fifth ACM International Conference on Web Search and Data Mining, Seattle, WA, USA, 8–12 February 2012; pp. 163–172. [Google Scholar]
  29. Liu, J.; Cao, Y.; Lin, C.; Huang, Y.; Zhou, M. Low-Quality Product Review Detection in Opinion Summarization. In Proceedings of the 2007 Joint Conference on Empirical Methods in Natural Language Processing and Computational Natural Language Learning (EMNLP-CoNLL), Prague, Czech Republic, 28–30 June 2007; pp. 334–342. [Google Scholar]
  30. Ngo-Ye, T.L.; Sinha, A.P. Analyzing Online Review Helpfulness Using a Regressional ReliefF-Enhanced Text Mining Method. ACM Trans. Manag. Inf. Syst. 2012, 3. [Google Scholar] [CrossRef]
  31. Balaji, P.; Haritha, D.; Nagaraju, O. An Overview on Opinion Mining Techniques and Sentiment Analysis. Int. J. Pure Appl. Math. 2018, 118, 61–69. [Google Scholar]
  32. Zhang, Z.; Varadarajan, B. Utility scoring of product reviews. In Proceedings of the 15th ACM International Conference on Information and Knowledge Management-CIKM ’06, Arlington, VA, USA, 6–11 November 2006. [Google Scholar]
  33. Kim, S.; Pantel, P.; Chklovski, T.; Pennacchiotti, M. Automatically Assessing Review Helpfulness. In Proceedings of the 2006 Conference on Empirical Methods in Natural Language Processing-EMNLP ’06, Sydney, Australia, 22–23 July 2006; pp. 423–430. [Google Scholar]
  34. Mudambi, S.M.; Schuff, D. What Makes a Helpful Online Review? A Study of Customer Reviews on Amazon.com. MIS Q. 2010, 34, 185–200. [Google Scholar] [CrossRef] [Green Version]
  35. Korfiatis, N.; García-Bariocanal, E.; Sánchez-Alonso, S. Evaluating content quality and helpfulness of online product reviews: The interplay of review helpfulness vs. review content. Electron. Commer. Res. Appl. 2012, 11, 205–217. [Google Scholar] [CrossRef]
  36. Walther, J.B.; Liang, Y.J.; Ganster, T.; Wohn, D.Y.; Emington, J. Online Reviews, Helpfulness Ratings, and Consumer Attitudes: An Extension of Congruity Theory to Multiple Sources in Web 2.0. J. Comput. Commun. 2012, 18, 97–112. [Google Scholar] [CrossRef] [Green Version]
  37. Tsaparas, P.; Ntoulas, A.; Terzi, E. Selecting a comprehensive set of reviews. In Proceedings of the 17th ACM SIGKDD International Conference on Knowledge Discovery and Data Mining-KDD ’11, San Diego, CA, USA, 21–24 August 2011; p. 168. [Google Scholar]
  38. O’Mahony, M.P.; Smyth, B. Learning to recommend helpful hotel reviews. In Proceedings of the Third ACM Conference on Recommender Systems-RecSys ’09, New York, NY, USA, 23–25 October 2009. [Google Scholar]
  39. Kard, S.T.; Mackinlay, J.D.; Scheiderman, B. Reading in Information Visualization, Using Vision to Think; Morgan Kaufmann Publishers Inc.: Burlington, MA, USA, 1999. [Google Scholar]
  40. Liu, Y.; Huang, X.; An, A.; Yu, X. Modeling and Predicting the Helpfulness of Online Reviews. In Proceedings of the 2008 Eighth IEEE International Conference on Data Mining, Pisa, Italy, 15–19 December 2008; pp. 443–452. [Google Scholar]
  41. Yang, J.-Y.; Kim, H.-J.; Lee, S.-G. Feature-based Product Review Summarization Utilizing User Score. J. Inf. Sci. Eng. 2010, 26, 1973–1990. [Google Scholar]
  42. Eirinaki, M.; Pisal, S.; Singh, J. Feature-based opinion mining and ranking. J. Comput. Syst. Sci. 2012, 78, 1175–1184. [Google Scholar] [CrossRef]
  43. Moghaddam, S.; Ester, M. Opinion Digger: An Unsupervised Opinion Miner from Unstructured Product Reviews. In Proceedings of the 19th ACM International Conference on Information and Knowledge Management-CIKM ’10, Toronto, ON, Canada, 26–30 October 2010; pp. 1825–1828. [Google Scholar]
  44. Lei, Z.; Liu, B.; Lim, S.H.; Eamonn, O.-S. Extracting and Ranking Product Features in Opinion Documents. In Proceedings of the 23rd International Conference on Computational Linguistics: Posters, Beijing, China, 23–27 August 2010; pp. 1462–1470. [Google Scholar]
  45. Kunpeng, Z.; Narayanan, R.; Choudhary, A. Voice of the Customers: Mining Online Customer Reviews for Product Feature-based Ranking. In Proceedings of the 3rd Conference on Online Social Networks, Boston, MA, USA, 22 June 2010. [Google Scholar]
  46. Kauffmann, E.; Peral, J.; Gil, D.; Ferrández, A.; Sellers, R.; Mora, H. Managing marketing decision-making with sentiment analysis: An evaluation of the main product features using text data mining. Sustainability 2019, 11, 4235. [Google Scholar] [CrossRef] [Green Version]
  47. Hao, M.; Rohrdantz, C.; Janetzko, H.; Dayal, U.; Keim, D.A.; Haug, L.; Hsu, M. Visual Sentiment Analysis on Twitter Data Streams. In Proceedings of the 2011 IEEE Conference on Visual Analytics Science and Technology (VAST), Providence, RI, USA, 23–28 October 2011; pp. 275–276. [Google Scholar]
  48. Bilal, M.; Marjani, M.; Hashem, I.A.T.; Abdullahi, A.M.; Tayyab, M.; Gani, A. Predicting helpfulness of crowd-sourced reviews: A survey. In Proceedings of the 2019 13th International Conference on Mathematics, Actuarial Science, Computer Science and Statistics (MACS), Karachi, Pakistan, 14–15 December 2019; pp. 1–8. [Google Scholar] [CrossRef]
  49. Bilal, M.; Marjani, M.; Hashem, I.A.T.; Malik, N.; Lali, M.I.U.; Gani, A. Profiling reviewers’ social network strength and predicting the ‘Helpfulness’ of online customer reviews. Electron. Commer. Res. Appl. 2021, 45, 101026. [Google Scholar] [CrossRef]
  50. Ghose, A.; Ipeirotis, P.G. Estimating the Helpfulness and Economic Impact of Product Reviews: Mining Text and Reviewer Characteristics. IEEE Trans. Knowl. Data Eng. 2011, 23, 1498–1512. [Google Scholar] [CrossRef] [Green Version]
  51. Tsur, O.; Rappoport, A. R EV R ANK: A Fully Unsupervised Algorithm for Selecting the Most Helpful Book Reviews. In Proceedings of the Third International Conference on Weblogs and Social Media, ICWSM 2009, San Jose, CA, USA, 17–20 May 2009. [Google Scholar]
  52. Shamim, A.; Balakrishnan, V.; Tahir, M.; Shiraz, M. Critical Product Features ’ Identification Using an Opinion Analyzer. Sci. World J. 2014, 2014, 1–9. [Google Scholar] [CrossRef] [PubMed]
  53. Hu, M.; Liu, B. Mining and summarizing customer reviews. In Proceedings of the 19th National Conference on Artificial Intelligence, San Jose, CA, USA, 25–29 July 2004; pp. 168–177. [Google Scholar]
  54. Li, S.; Chen, Z.; Tang, L. Exploiting Consumer Reviews for Product Feature Ranking Ranking Categories and Subject Descriptors. In Proceedings of the 3rd Workshop on Social Web Search and Mining (SWSM’11), Beijing, China, 28 July 2011. [Google Scholar]
  55. Ahmad, T.; Doja, M.N. Ranking System for Opinion Mining of Features from Review Documents. IJCSI Int. J. Comput. Sci. Issues 2012, 9, 440–447. [Google Scholar]
  56. Gregory, M.L.; Chinchor, N.; Whitney, P.; Carter, R.; Hetzler, E.; Turner, A. User-directed Sentiment Analysis: Visualizing the Affective Content of Documents. In Proceedings of the Workshop on Sentiment and Subjectivity in Text, Sydney, Australia, 22 July 2006; pp. 23–30. [Google Scholar]
  57. Chen, C.; Ibekwe-sanjuan, F.; Sanjuan, E.; Weaver, C. Visual Analysis of Conflicting Opinions. In Proceedings of the IEEE Symposium on Visual Analytics and Technology (2006), Baltimore, MD, USA, 31 October–2 November 2006; pp. 59–66. [Google Scholar]
  58. Miao, Q.; Li, Q.; Dai, R. AMAZING: A sentiment mining and retrieval system. Expert Syst. Appl. 2009, 36, 7192–7198. [Google Scholar] [CrossRef]
  59. Morinaga, S.; Yamanishi, K.; Tateishi, K.; Fukushima, T. Mining product reputations on the Web. In Proceedings of the Eighth ACM SIGKDD International Conference on Knowledge Discovery and Data Mining, Edmonton, AB, Canada, 23–26 July 2002; pp. 341–349. [Google Scholar]
  60. Liu, B.; Hu, M.; Cheng, J. Opinion observer: Analyzing and comparing opinions on the Web. In Proceedings of the 14th International Conference on World Wide Web, Chiba, Japan, 10–14 May 2005; pp. 342–351. [Google Scholar]
  61. Oelke, D.; Hao, M.; Rohrdantz, C.; Keim, D.A.; Dayal, U.; Haug, L.; Janetzko, H. Visual Opinion Analysis of Customer Feedback Data. In Proceedings of the IEEE Symposium on Visual Analytics Science and Technology, Atlantic City, NJ, USA, 12–13 October 2009; pp. 187–194. [Google Scholar]
  62. Gamon, M.; Basu, S.; Belenko, D.; Fisher, D.; Hurst, M.; König, A.C. BLEWS: Using Blogs to Provide Context for News Articles. In Proceedings of the International Conference on Weblogs and Social Media, Seattle, WA, USA, 30 March–2 April 2008. [Google Scholar]
  63. Wanner, F.; Rohrdantz, C.; Mansmann, F.; Oelke, D.; Keim, D.A. Visual Sentiment Analysis of RSS News Feeds Featuring the US Presidential Election in 2008. In Proceedings of the Workshop on Visual Interfaces to the Social and the Semantic Web (VISSW2009), Sanibel Island, FL, USA, 8 February 2009. [Google Scholar]
  64. Gamon, M.; Aue, A.; Corston-Oliver, S.; Ringger, E. Pulse: Mining customer opinions from free text. In Proceedings of the International Symposium on Intelligent Data Analysis, Madrid, Spain, 8–10 September 2005; pp. 121–132. [Google Scholar]
  65. Liu, B. Web Data Mining: Exploring Hyperlinks, Contents, and Usage Data; Springer: Berlin/Heidelberg, Germany, 2006. [Google Scholar]
  66. Pan, S.J.; Ni, X.; Sun, J.-T.; Yang, Q.; Chen, Z. Cross-domain sentiment classification via spectral feature alignment. In Proceedings of the 19th International Conference on World Wide Web-WWW ’10, Raleigh, NC, USA, 26–30 April 2010. [Google Scholar]
  67. Qiu, G.; Liu, B.; Bu, J.; Chen, C. Expanding Domain Sentiment Lexicon through Double Propagation. In Proceedings of the 21st International Joint Conference on Artificial Intelligence, Pasadena, CA, USA, 11–17 July 2009. [Google Scholar]
Figure 1. Hierarchy of the review tuple.
Mathematics 09 00833 g001
Figure 2. Example review.
Mathematics 09 00833 g002
Figure 3. Review tuple based on the example review in Figure 2.
Mathematics 09 00833 g003
Figure 4. Example reviews.
Mathematics 09 00833 g004
Figure 5. Feature tuple.
Mathematics 09 00833 g005
Figure 6. Architecture of proposed system.
Mathematics 09 00833 g006
Figure 7. Algorithm for identifying potential features with associated opinion words.
Mathematics 09 00833 g007
Figure 8. Algorithm for identifying high-quality reviews.
Mathematics 09 00833 g008
Figure 9. An example of review weight calculation.
Mathematics 09 00833 g009
Figure 10. An algorithm for feature ranking.
Mathematics 09 00833 g010
Figure 11. Accuracy of Reviews Quality Classification.
Mathematics 09 00833 g011
Figure 12. Comparison of proposed system with opinion analyzer on positive ranking.
Mathematics 09 00833 g012
Figure 13. Comparison of proposed system with opinion analyzer on negative ranking.
Mathematics 09 00833 g013
Figure 14. Comparison of average accuracy FBS and proposed system.
Mathematics 09 00833 g014
Figure 15. Proposed Tree Map Visualization of Digital Camera 1.
Mathematics 09 00833 g015
Figure 16. Color scale.
Mathematics 09 00833 g016
Figure 17. Result of usability study.
Mathematics 09 00833 g017
Table 1. Notations used in Review Tuple.
Notation Description
DDocument with n product reviews
r k Review k
M D r k Metadata of review k
B r k Body of review k
M D r k H R Helpfulness Ratio of review k (HR is MD element)
M D r k T i t l e Title of review k
M D r k R a t i n g Rating of review k (Rating is MD element)
M D r k   T i t l e F c o u n t represents the number of features in the review title
M D r k   T i t l e O P W c o u n t depicts the number of opinion words in the review title
B r k F C o u n t number of the features in the body of the review
B r k s i f j represents a product feature ( f j ) in sentence s i
B r k s i f j S P reflects the semantic polarity (SP) of the feature f j in sentence s i in B r k
B r k s i f j O S reflects the opinion strength (OS) of the feature f j in sentence s i
f j f r e q Frequency of the feature
B r k s i   C ontentreflects the content of the sentence s i
O S P P O S reflects that the semantic polarity of the opinion is positive
O S P N E G reflects that the opinion semantic polarity is negative
  O S P O S _ S reflects that the opinion strength is strong positive
  O S P O S _ M reflects that the opinion strength is mild positive
  O S P O S _ W reflects that the opinion strength is weak positive
  O S N E G _ S reflects that the opinion strength is strong negative
O S N E G _ M reflects that the opinion strength is mild negative
O S N E G _ W reflects that the opinion strength is weak negative
  W _ O S P O S _ S reflects the weight of   O S P O S _ S (i.e., +3)
  W _ O S P O S _ M reflects the weight of   O S P O S _ M (i.e., +2)
  W _ O S P O S _ W reflects the weight of   O S P O S _ W (i.e., +1)
  W _ O S N E G _ S reflects the weight of   O S N E G _ S (i.e., −3)
  W _ O S N E G _ M reflects the weight of   O S N E G _ M (i.e., −2)
  W _ O S N E G _ W reflects the weight of   O S N E G _ W (i.e., −1)
Table 2. Detailed information of dataset.
Product Type Product NameNumber of ReviewsNumber of SentencesLength in WordsLength in Characters
1.Digital Camera 1Canon G3 4559711,28048,714
2.Digital Camera 2Nikon Coolpix 430034346674929,763
3.Cellular PhoneNokia 661044546968142,795
4.MP3 PlayerCreative Labs Nomad Jukebox Zen Xtra 40 GB95171612,71954,872
5.DVD PlayerApex AD2600 Progressive-scan DVD player10074032,553138,301
Total 31848972,982314,445
Table 3. Calculation of accuracy.
MetricsPicture Quality
Actual   f j P O S C r e d 15
Extracted   f j P O S C r e d 12
Accuracy   of   f j P O S C r e d 12/15 * 100 = 80%
Actual   f j N E G C r e d 10
Extracted   f j N E G C r e d 9
Accuracy   of   f j N E G C r e d 9/10 * 100=90%
Actual   f j R a n k 5
Extracted   f j R a n k 3
Accuracy   of   f j R a n k 3/5 * 100 = 60%
Table 4. Review quality evaluation of Digital Camera 1 and DVD Player.
Review ClassesDigital Camera 1DVD Player
Excellent36
Good 1737
Average1114
Fair56
Poor936
Table 5. POSCred, NEGCred, and OverallCred of top ten features of DVD Player.
P O S C r e d N E G C r e d Overall   C r e d
FeaturesWeight AccuracyFeaturesWeightAccuracyFeatures WeightAccuracy
Player 14487Player 19691Feature 23100
Play3190Play3581Price1761
Price 2861Picture2769Work771
Feature23100Apex22100Product367
Apex1493Quality1158Unit −3100
Picture 1377Video964Service−4100
Work888Disc867Play−758
Product7100Button7100Button−7100
Unit4100Unit7100Disc−867
Service0100Product480Apex−989
Table 6. Comparison of average accuracy of positive and negative ranks.
Proposed SystemOpinion Analyzer
Average Accuracy for Positive Rank9593
Average Accuracy for Negative Rank9496
Average Accuracy for Negative and Positive Rankings9595
Publisher’s Note: MDPI stays neutral with regard to jurisdictional claims in published maps and institutional affiliations.

