1. Introduction
Traditionally, finance theory has relied upon the risk-return relationship, i.e., the higher the risk (usually measured through the standard deviation of returns), the higher the return. This concept is at the core of the Capital Asset Pricing Model (CAPM) (see Sharpe [
1], Lintner [
2], Mossin [
3]), where the expected profitability of the
i-th stock,
, is represented as follows:
where
is the risk-free rate,
is the Market Risk Premium, and
the sensitivity of expected excess asset’s return associated with the
i-th asset.
However, several authors have reported some breaches in this theory. For example, less volatile stocks seem to have higher returns (see Frazzini and Pedersen [
4]), while Lintner [
2] and Miller and Scholes [
5] obtained certain inconsistencies when testing the model with NYSE stocks. Academia has pointed to the existence of several other factors that, beyond volatility, affect the returns of assets (basically, investors obtain a reward for bearing risks different from volatility). Some of these factors, relying on financial measures, are already considered as classical and have been tested in different Markets; see Fama and French [
6]. Other factors, that incorporate macro or industry-related measures, such as Interest Rates levels (Viale et al. [
7]), or Oil price (Ramos et al. [
8]), have been less studied or remain undiscovered. Some researchers, like Elyasiani et al. [
9], Lemperiere et al. [
10], have focused on higher order statistical moments of returns and, recently, more sophisticated models are built by combining such measures with others involving psychological factors, like Momentum; see Carhart [
11]. Momentum, specifically, has won a place by itself among the main factors to be considered in the asset pricing literature and has been tested even in Emerging Markets (see, for example, Misra and Mohapatra [
12]). What appears to be clear is that multifactor models should explain the behavior of assets’ returns better than CAPM. However, the number of proposed factors has increased dramatically in recent years. For example, Harvey et al. [
13] catalogue 316 factors and note that there are additional ones that do not make it to their final list. Typically, these models take the form of the following equation:
The expected return for the
i-th portfolio is linearly related to a set of factors
. Usually this set includes CAPM’s Market factor and other additional factors as independent variables. New debates arise today regarding which factors should be included in asset pricing models (see Fama and French [
14] and Barillas and Shanken [
15] on the methodology to choose among different models and factors and Fama and French [
16] regarding the redundancy of the value factor), whether certain factors are not working anymore and what are the main characteristics of extreme performers, equities that experienced extreme return levels during a specific period (for instance, see the work of Heerden and Rensburg [
17], where they first choose among different factors and then apply a logistic regression to select shares and build portfolios).
When studying these multifactor models, two main difficulties may appear. First, the procedures to test the significance of the factors rely on the construction of portfolios. We use portfolios instead of stocks since the former have more stable characteristics and are less prone to missing data than the latter and because the errors of
and
are higher for individual stocks as their volatility is higher. However, the question on which factors to select in order to build the portfolios remains unanswered. Firstly, there is an issue of dimensionality: on one hand, as we increase the number of portfolios to account for the various factors, the number of companies per portfolio decreases and this could be relevant for analysis of Markets not as developed as the U.S. or the Euro-Zone; on the other hand, there might also be a loss in efficiency in using too few portfolios as the model could fail to explain the cross-section of individual assets. Secondly, as Feng et al. [
18] suggest, selecting a few portfolios based on some characteristics could bias the results in favor of these factors. In this paper, we propose to build the portfolios using Common Principal Components (CPC), a multivariate technique developed by Flury [
19]. Unlike other dimensionality reduction techniques, specifically the classical principal components that it extends, CPC was designed to be applied when the available information is organized in more than one dataset. In our case, we have several factors measured along a time period for a large group of companies. The idea is to search for a common set of orthogonal axes that capture a high percentage of the variability of the factors observed in all the companies. Using CPC, we respect the individual behavior of each company, which constitutes a group on its own, while keeping a reasonably small number of factors that explain a large part of the variability of the stocks. At the same time, we have made an effort in interpreting each of the CPC factors in terms of the traditional ones.
Second, traditional inferential procedures about multifactor models, like Fama and French [
20] and Fama and MacBeth [
21], strongly rely on assumptions regarding the data: uncorrelated factors over time, i.i.d. normally distributed errors over time and independent of the factors, etc. When these hypothesis are not fulfilled, classical estimators may be biased. The Bootstrap methodology was developed by Efron [
22] as a resampling technique to approximate the distribution of test statistics. In the Asset Pricing literature, Cueto et al. [
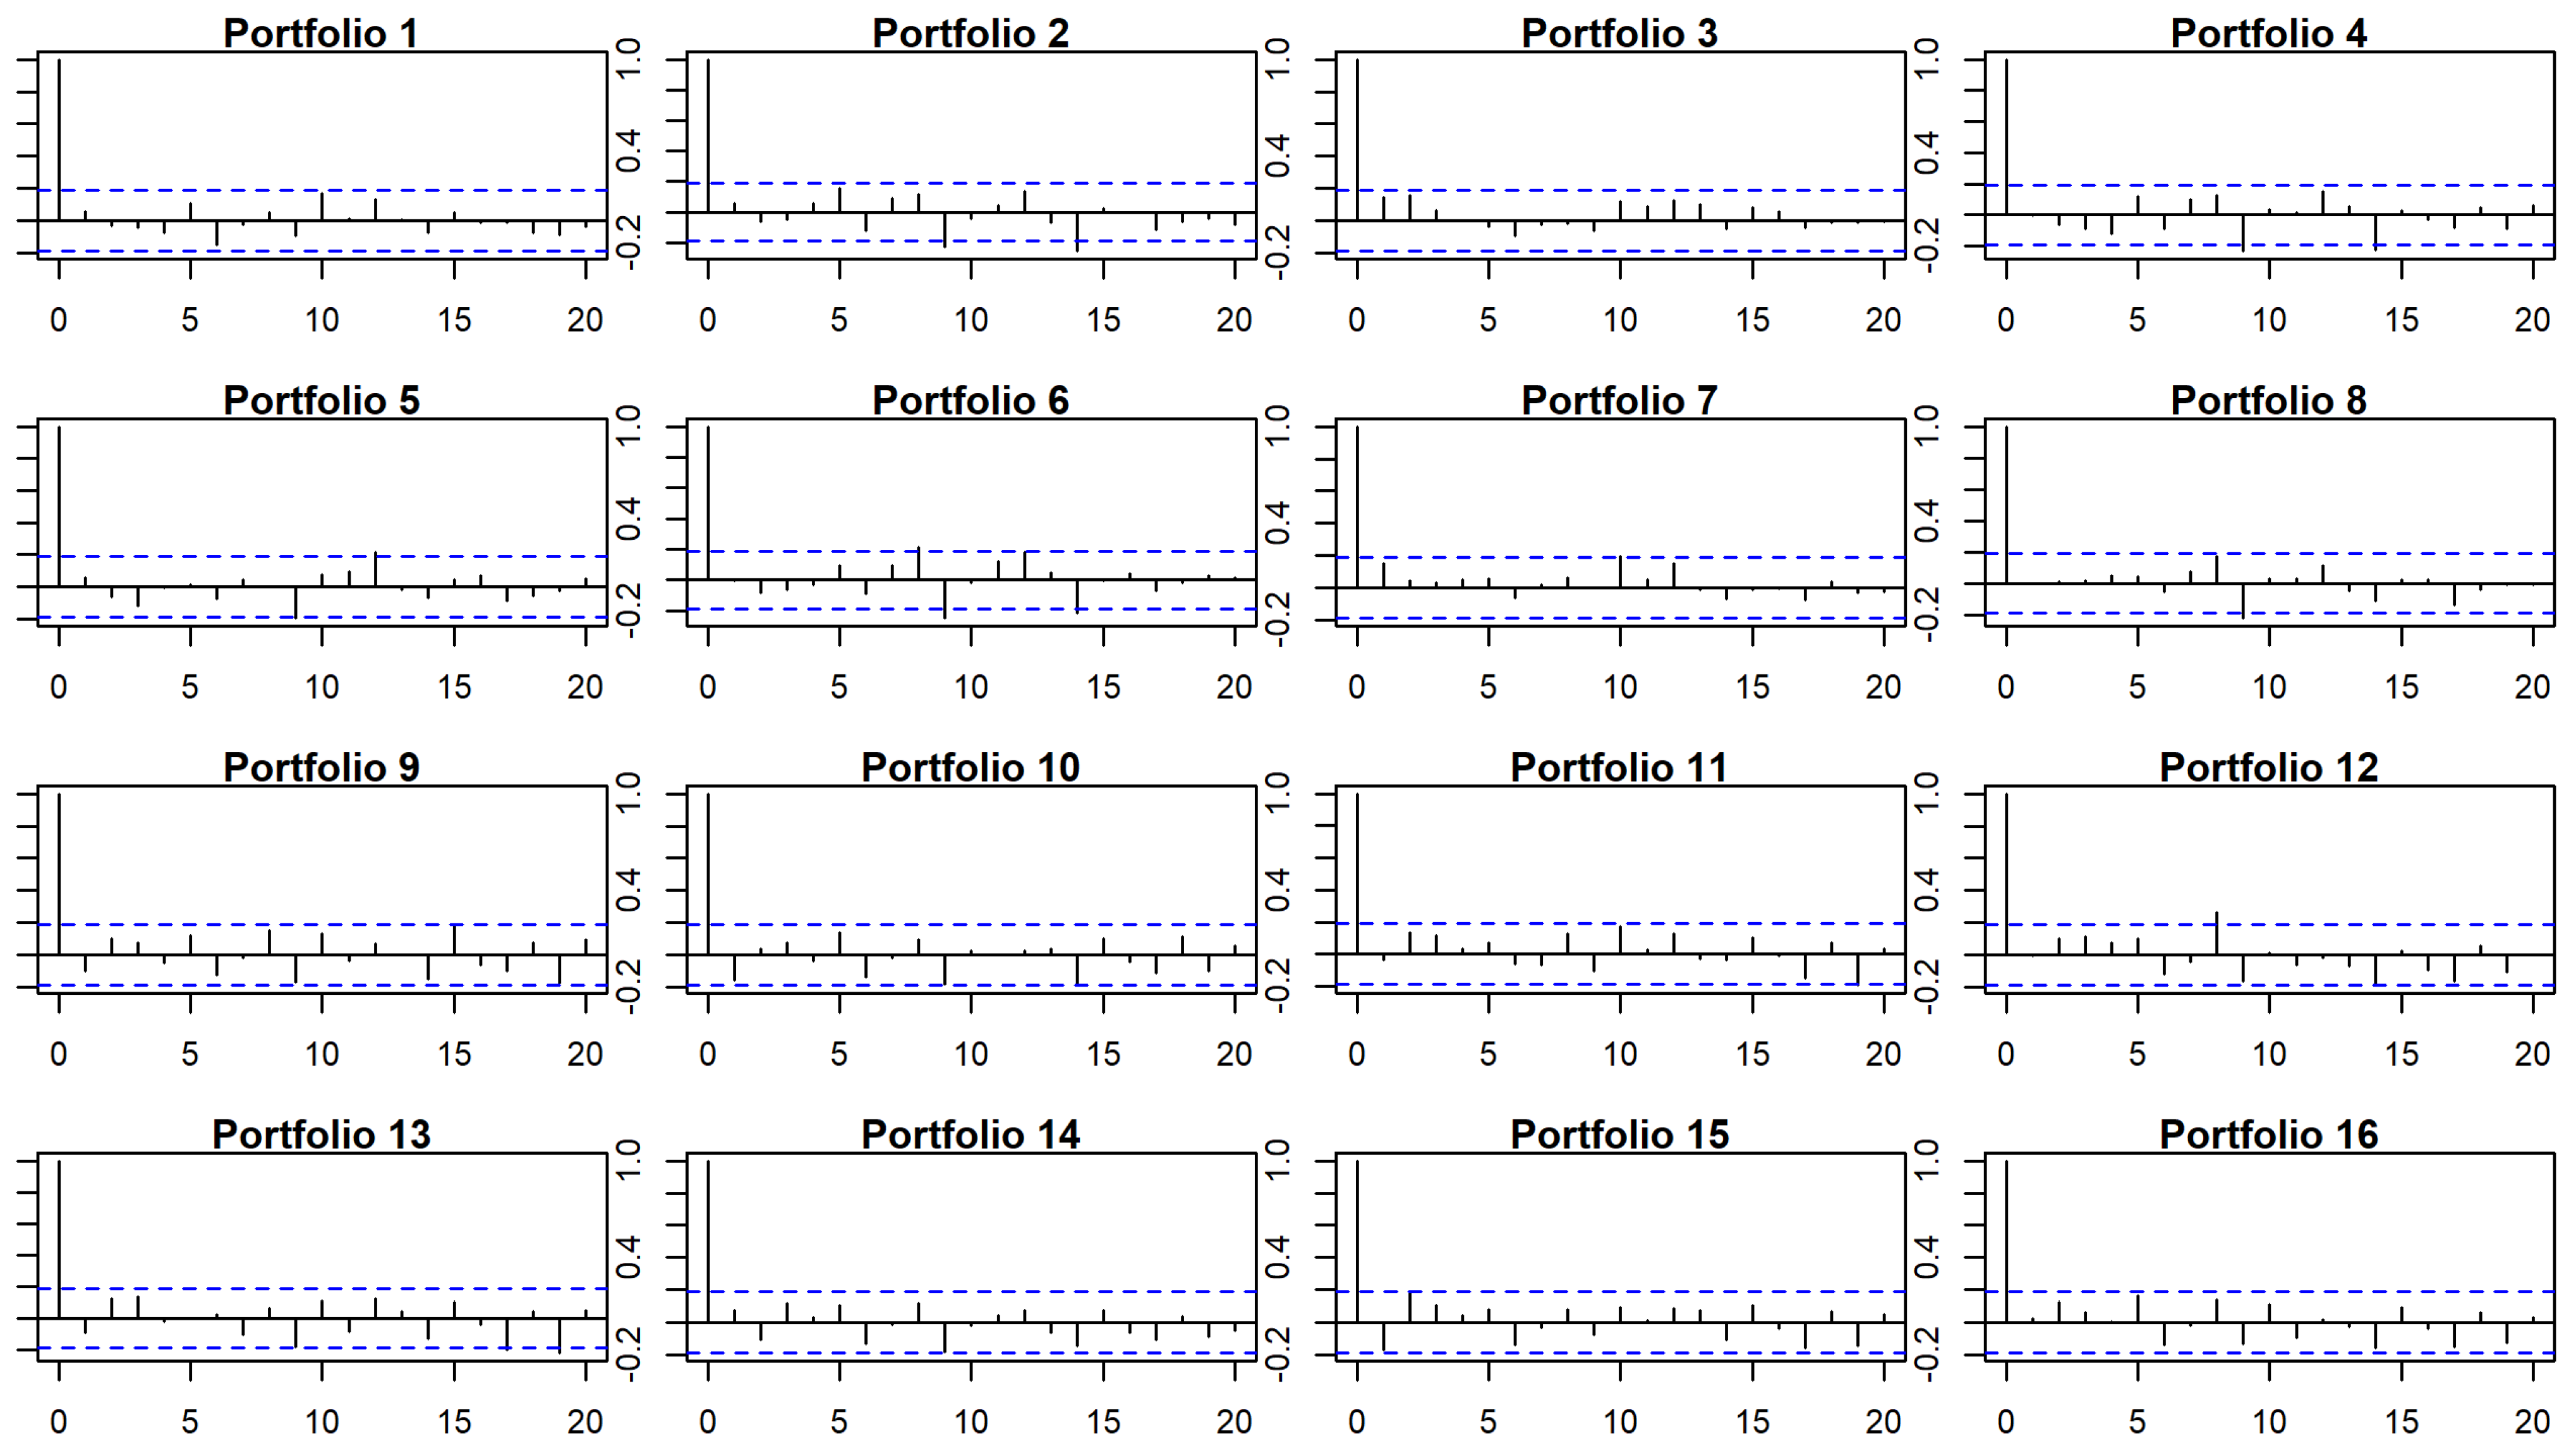
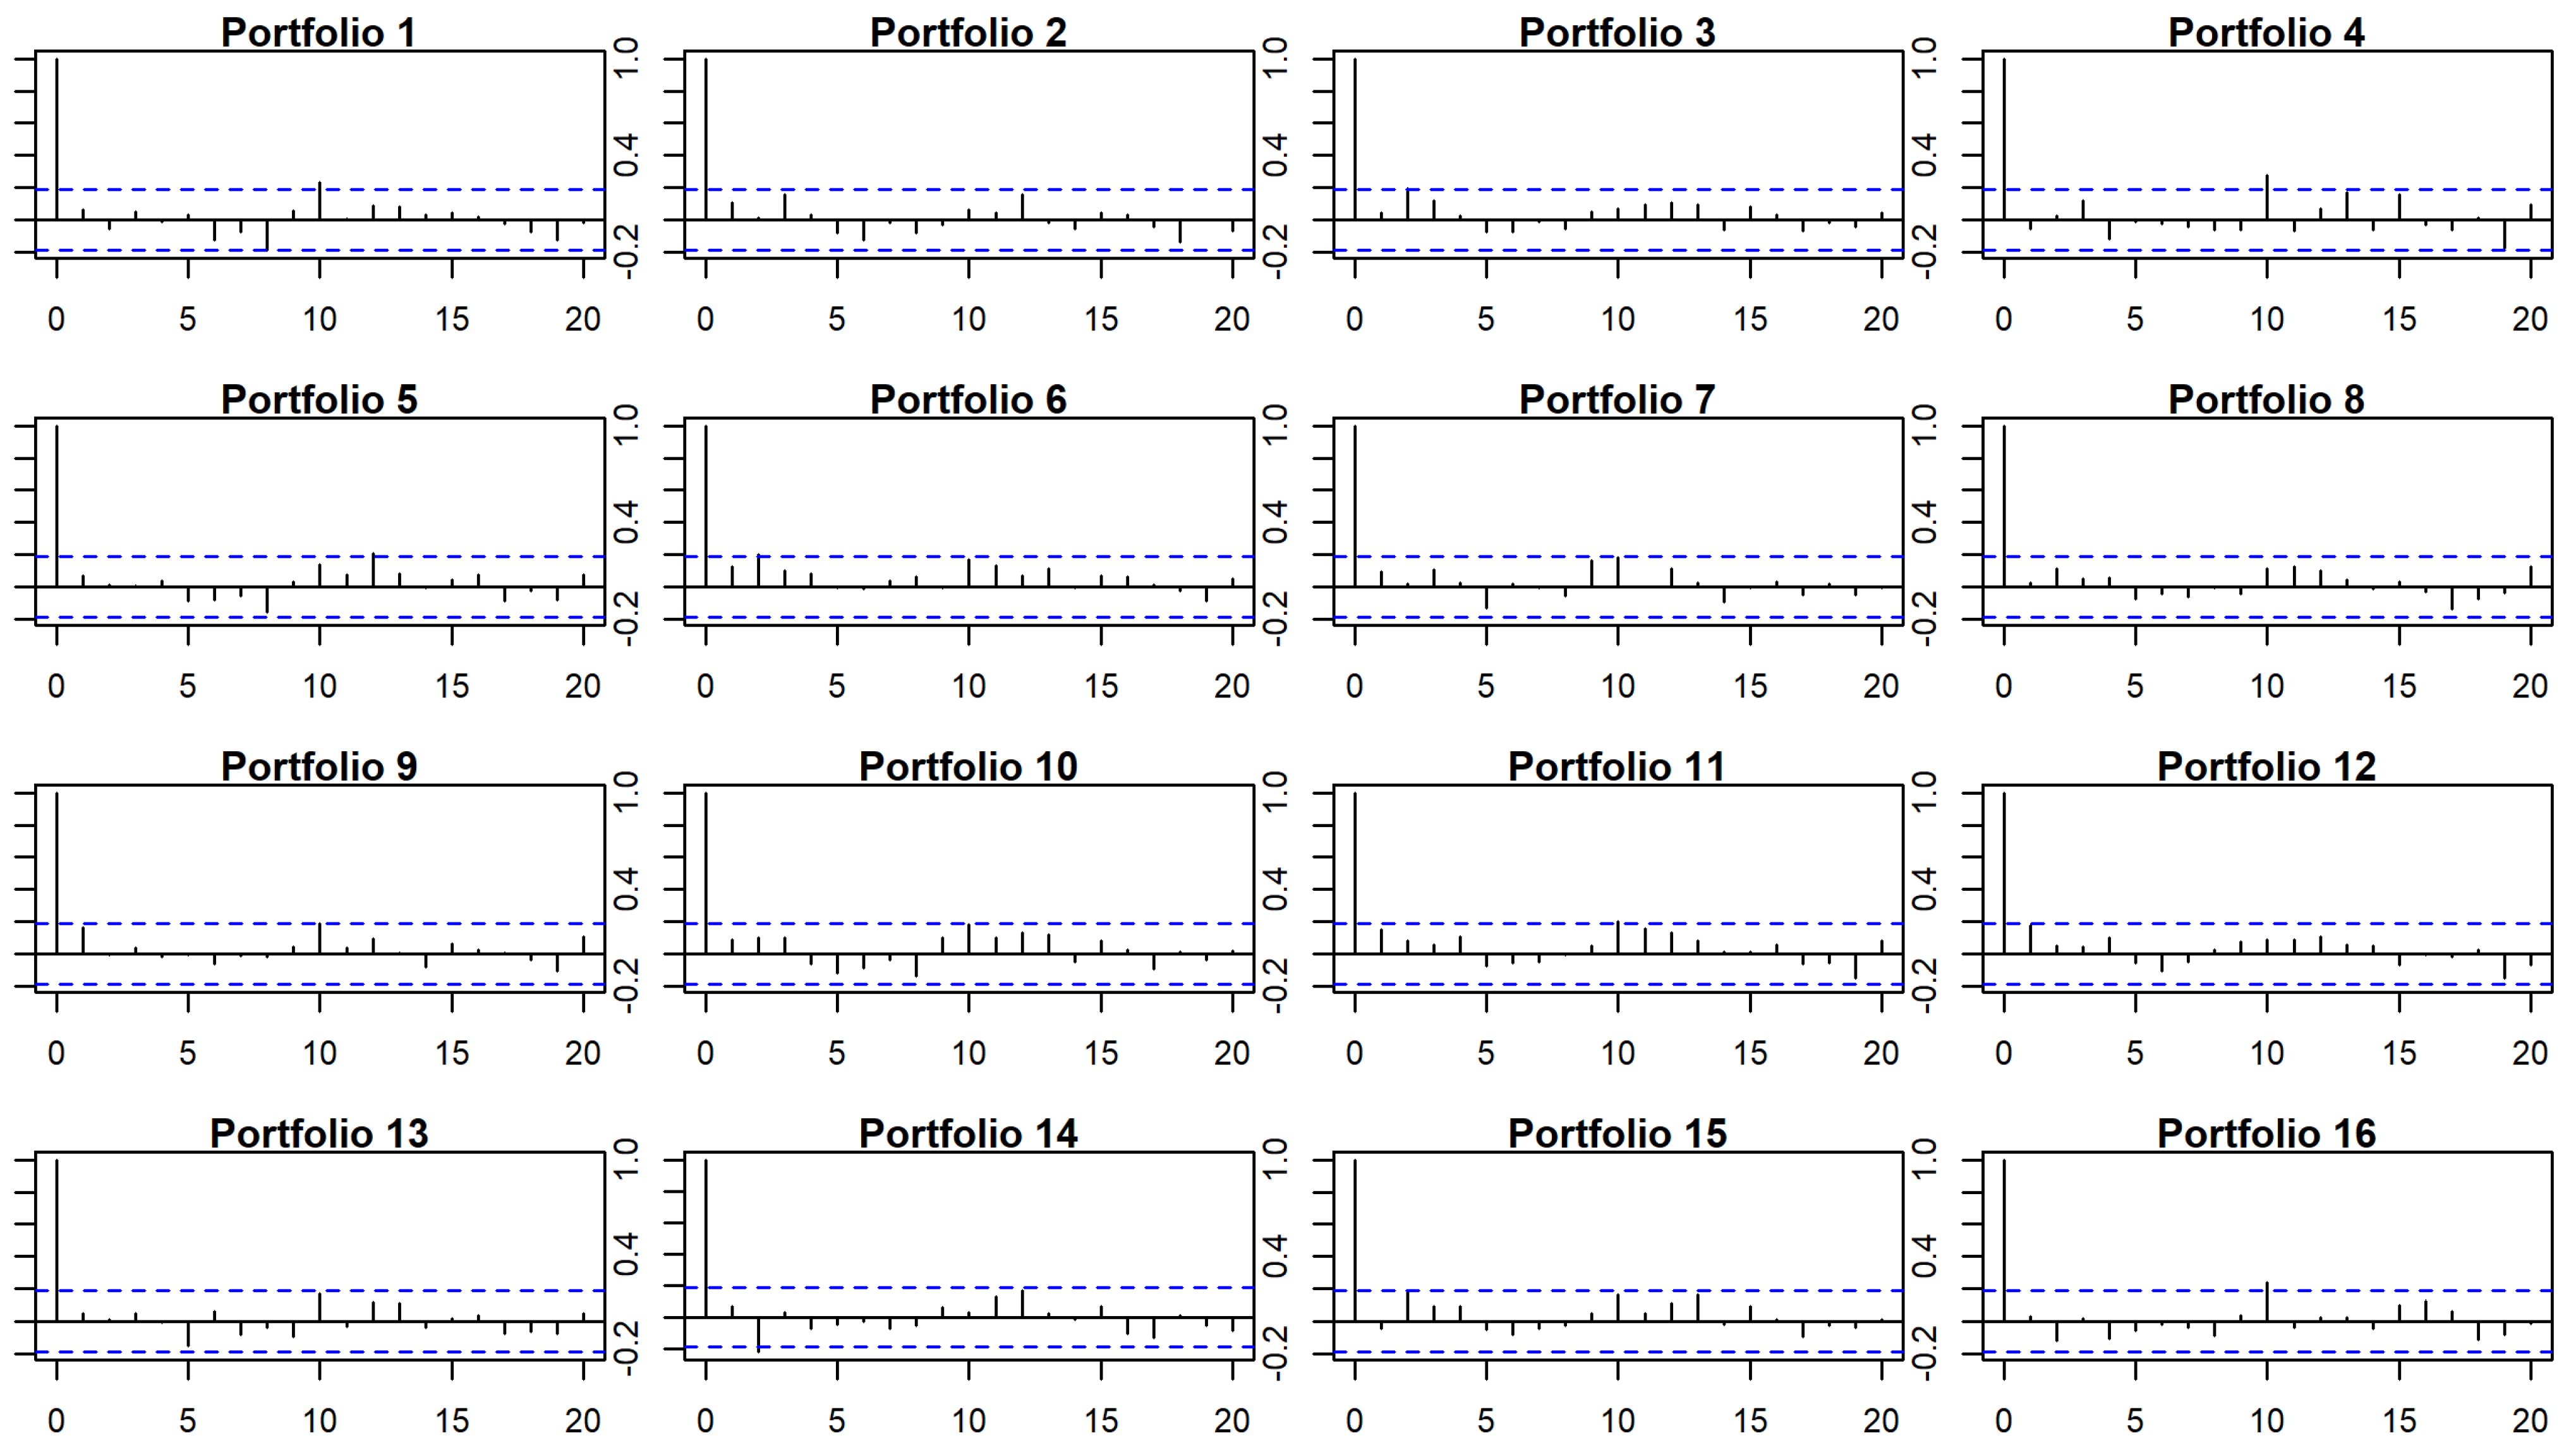
23] proposed to test test the validity of the model and the significance of the parameters involved through a block-bootstrap procedure that accounts for time dependency. Specifically, we use bootstrap techniques to assess our time-series and cross-sectional regression models by testing, in first place, the hypothesis that the independent terms of the time-series models that explain each of the portfolios returns are jointly zero; thus, the models are able to explain the excess returns. In a second and third stage, significance of the factors for each portfolio are tested, as well as that of the risk premia in the cross-sectional model. The methodological developments in the manuscript end here, since the purpose of these multifactor models in finance is to explain past assets’ behaviors, rather than forecasting.
The resampling procedure described here grows, among others, on that of Chou and Zhou [
24], who bootstrap a Wald test for the case where residuals and asset returns are jointly i.i.d and use a block-bootstrap for a Wald-type GMM test in the non-i.i.d case. The block bootstrap was explored by Grané and Veiga [
25] in the computation of returns’ unconditional distribution, and huge differences in the estimates of minimum capital risk requirement were reported when using conditional approaches (such as GARCH-type models and stochastic volatility models), particularly for long positions and larger investment horizons.
The objectives of this paper are: (1) to propose a multifactor model based on statistical and financial factors using CPC to reduce its number of dimensions, (2) to develop non-parametric resampling procedures that account for time dependency in order to test model validity and involved parameter significance, and (3) to compare the results obtained via bootstrap-based inferential procedures with those of the classical proposals.
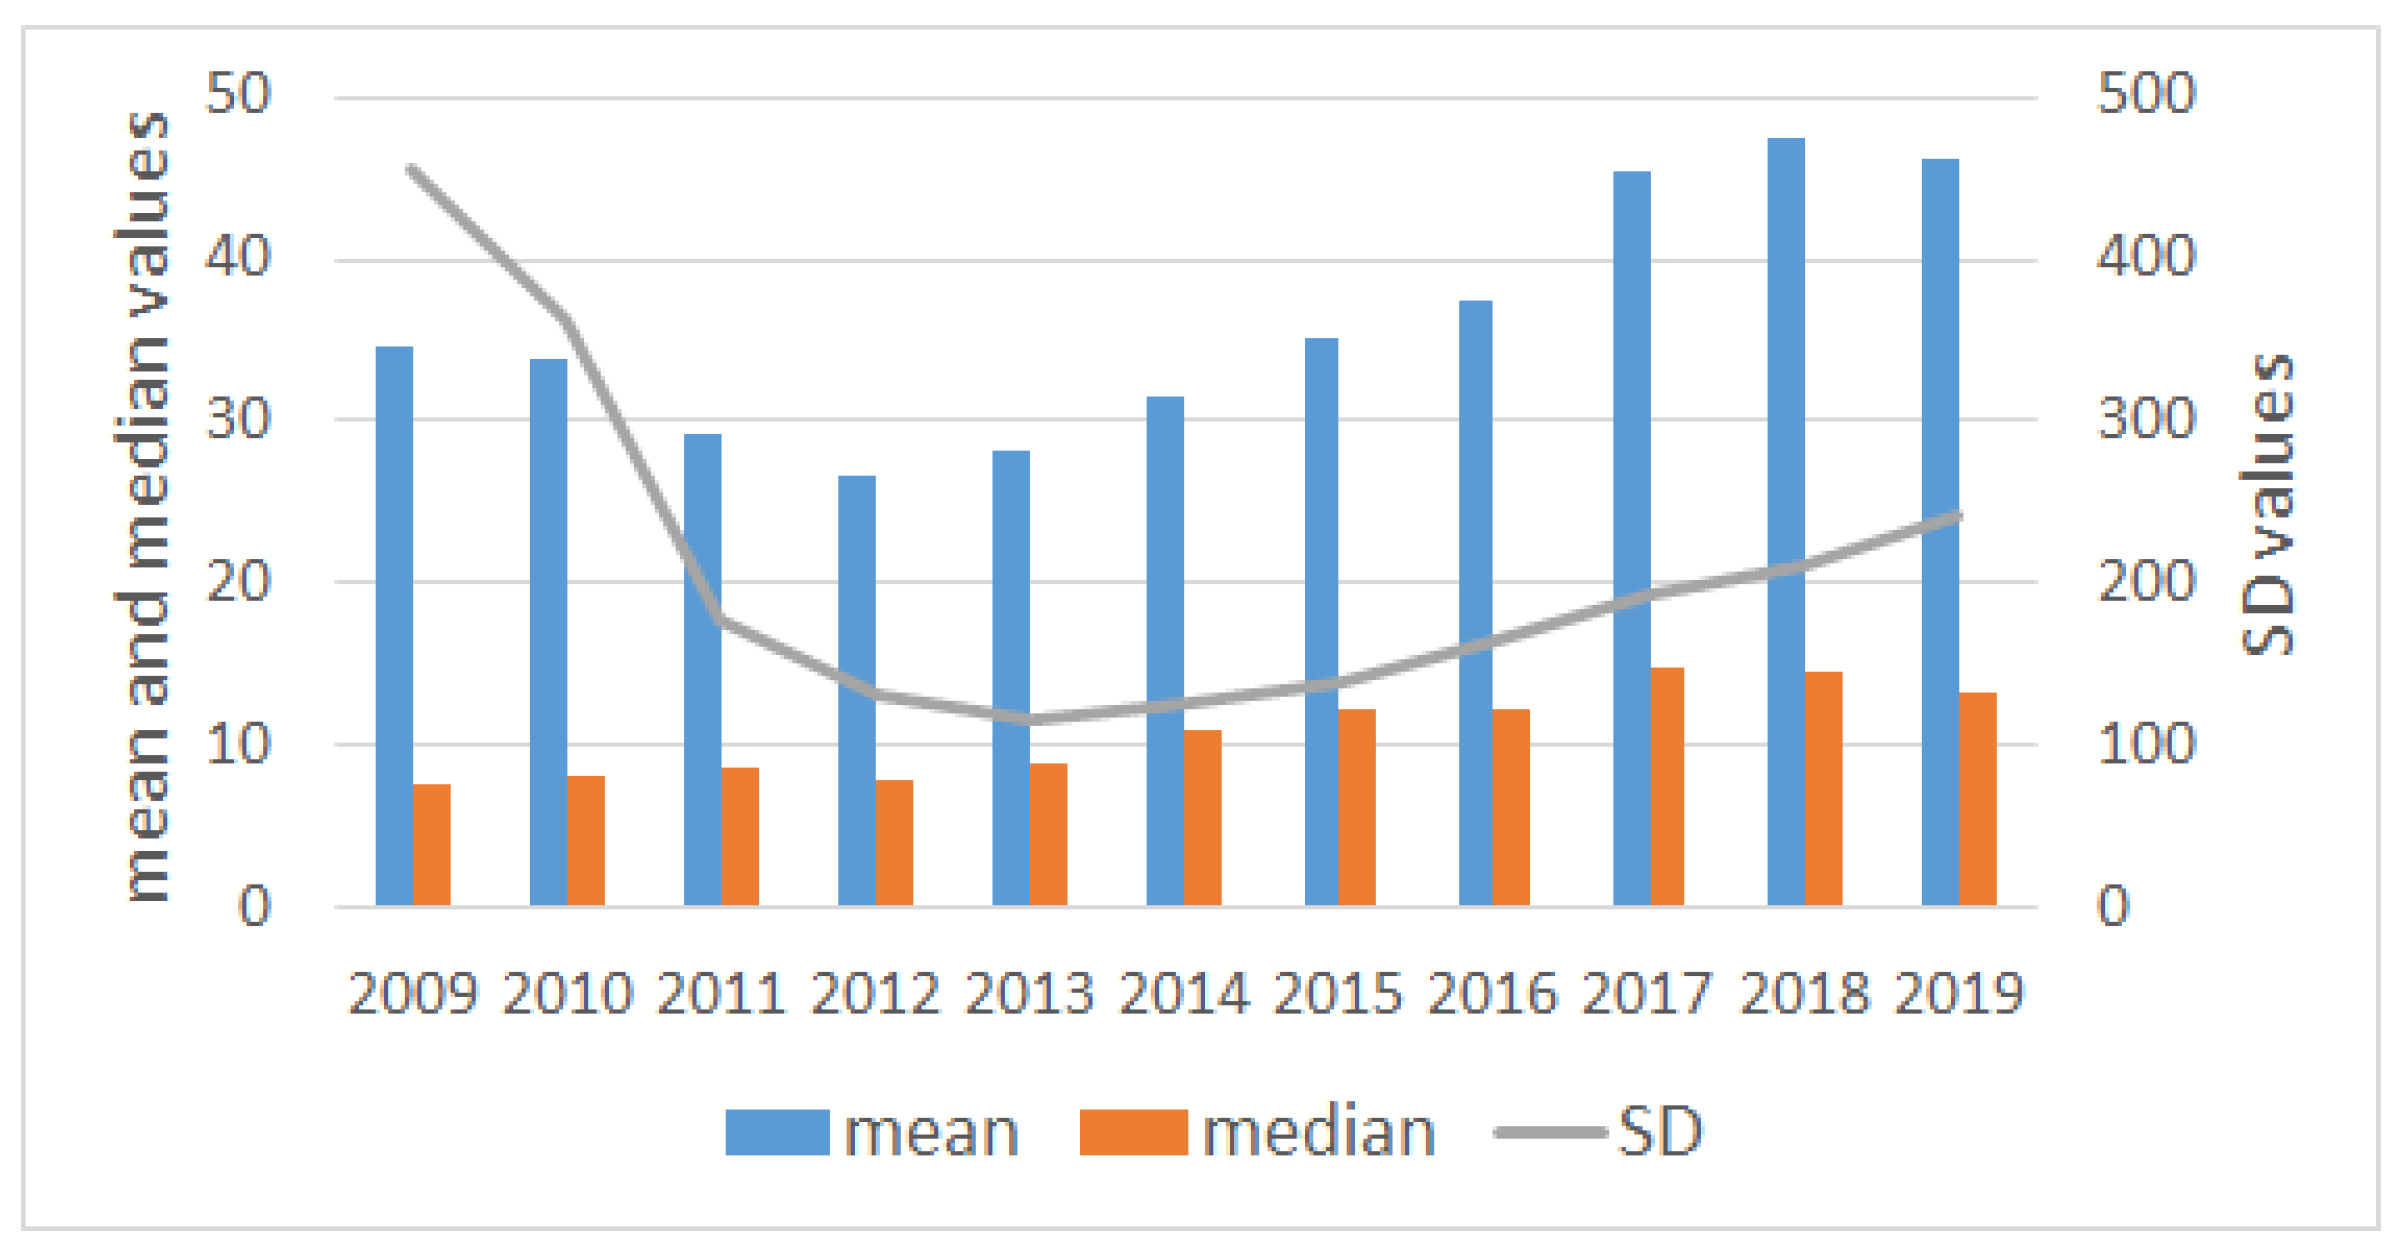
In particular, the financial and statistical factors considered are: Market Capitalization and Total Assets (measures of size), Price to Book ratio (measure of cheapness), Return on Assets and Return on Equity (measures of profitability), Momentum, and four statistical measures (mean, standard deviation, kurtosis, and skewness). The multifactor model with four CPC-factors is able to explain of the variability of the data. The first CPC-factor is a linear combination of mean and Momentum returns; the second and third CPC-factors are linear combinations of skewness and kurtosis returns and finally, the fourth CPC-factor is the standard deviation of the return. Interestingly, none of them include the financial ratios. A possible explanation is that these ratios do not add enough variability compared to statistical factors.
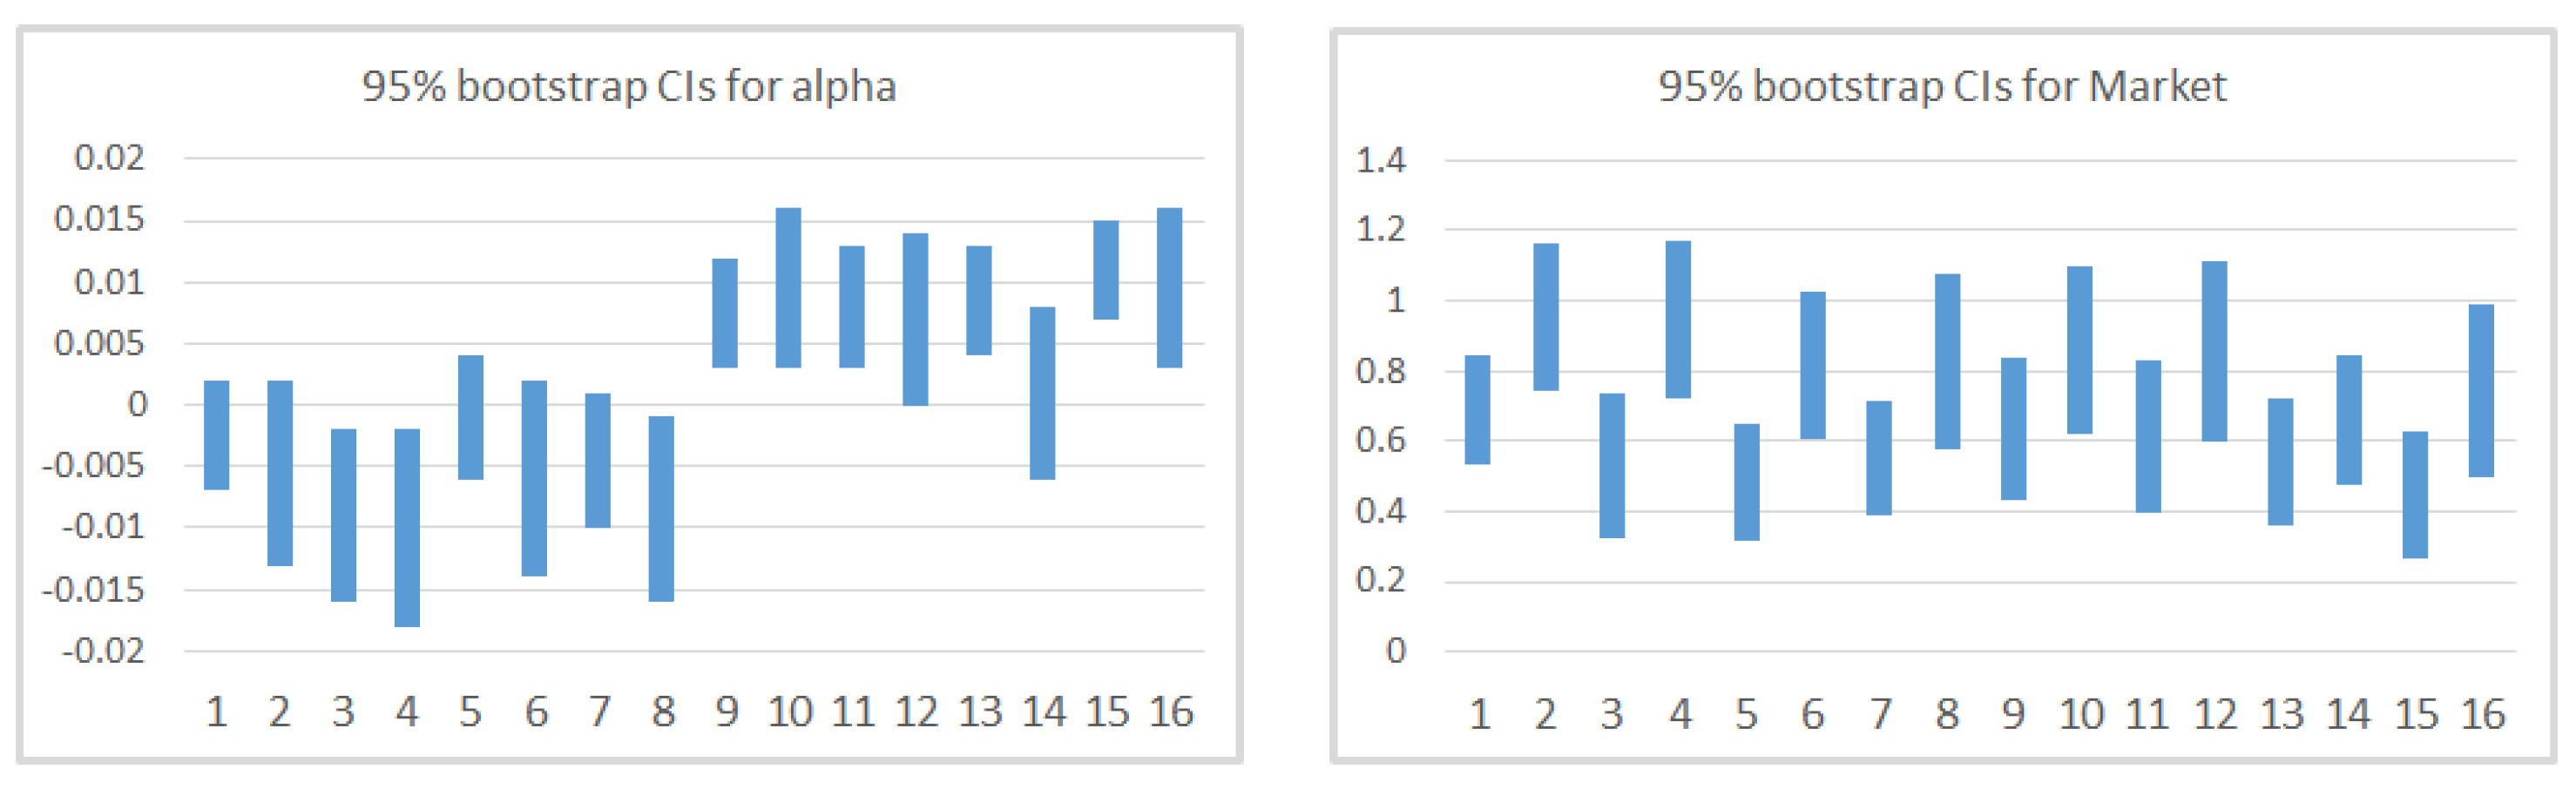
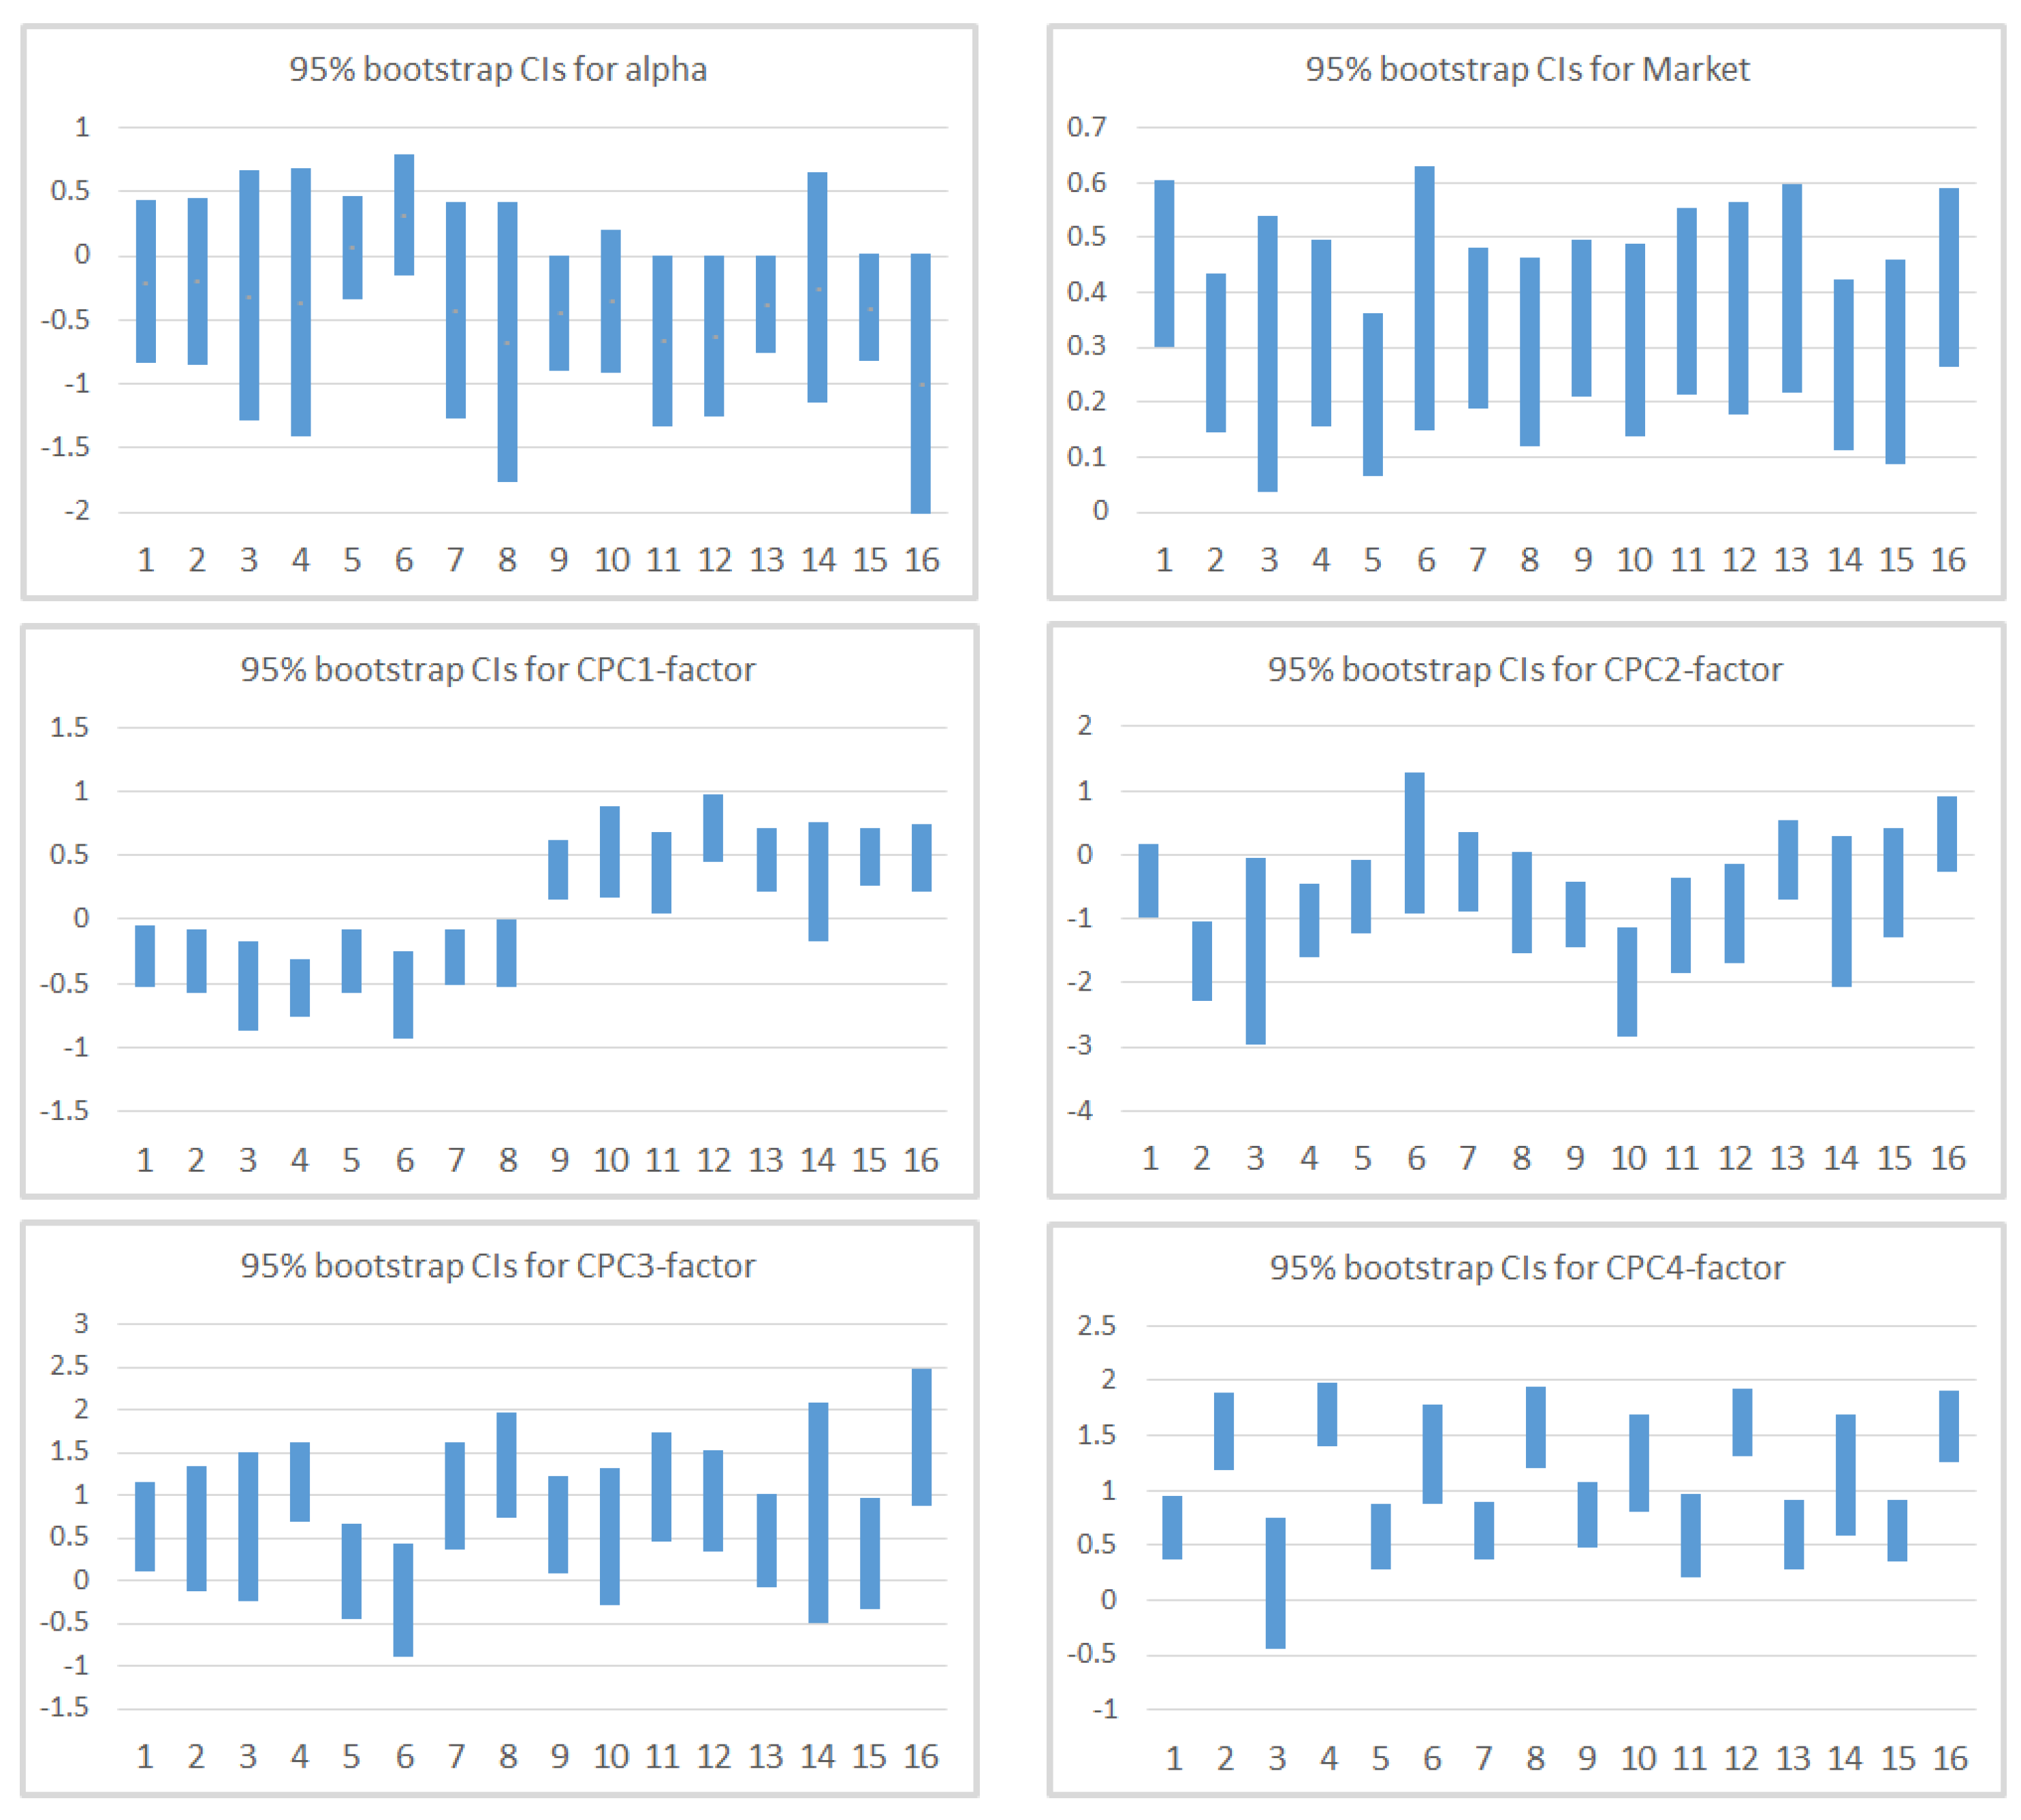
The main findings are that CAPM cannot explain by itself the return of the portfolios as for Market is higher for portfolios with high standard deviation (CPC4) and is higher (and positive) for portfolios with high Momentum and mean (CPC1). For these time-series models, shows values not greater than 0.55, while despite the wide confirmation of the Market factor in the financial literature, it is not significant in our CAPM cross-section regression analysis, which leads us to conclude the need to control for other factors. When we incorporate additional factors, we notice that Momentum and mean (CPC1-factor), despite being correlated with the Market factor, and standard deviation (CPC4-factor) help explaining the cross-section of European stocks during the period considered. Now, Market stabilize around , and CPC1 and CPC4 mainly capture the variability that the Market factor could not explain by itself in CAPM. For these models, we observed a substantial improvement in adjusted-, with a median value of 0.671. Apart from the calculation of s and s, which seem to be quite robust despite the relaxation of the assumptions of the model, GRS p-value is much higher for the bootstrap (which also occurs in CAPM). Finally, in the cross-section regression, two factors present risk premia different from zero, which are Market and the factor based on mean and Momentum (CPC1-factor). These findings lead us to conclude that the multifactor model based on CPC-factors is a good model with regard to the adjusted-, able to explain excess returns, although in the analyzed time period only one of the CPC-factors presents positive risk premia.
The remainder of this paper is organized as follows.
Section 2 contains a description of the data and methodology; specifically, in
Section 2.1, we present and describe our data, while, in
Section 2.2, we explain the methodology used to construct the portfolios and to test the validity the multifactor model, that is, time-series and cross-sectional classical methodologies and the block-bootstrap procedure.
Section 3 contains the results of the analysis and the comparison of the application of classical and bootstrap inferential procedures to the data, while the final conclusions are discussed in
Section 4.
4. Conclusions
We propose a procedure to obtain and test multifactor models based on statistical and financial factors and illustrate it on a large dataset corresponding to nearly 1250 EU companies and spanning from October 2009 to October 2019. However, the procedure is general enough to be extended to other factors, companies or time period.
The first methodological contribution relies on using Common Principal Components to build the portfolios and summarize factors’ information by capturing a high percentage of the variability of the datasets. In this paper, we considered factors like Market Capitalization and Total Assets (measures of size), Price to Book ratio (measure of cheapness), Return on Assets and Return on Equity (measures of profitability), Momentum, and four statistical measures, such as mean, standard deviation, kurtosis, and skewness. The second methodological contribution is the development of a block-bootstrap procedure to assess the validity of the model and the significance of the parameters involved.
The main findings indicate that the multifactor model proposed improves the Capital Asset Pricing Model with regard to the adjusted- in the time-series regressions. Cross-section regression results reveal that Market and a factor related to Momentum and mean of stocks’ returns have positive risk premia for the analyzed period. Finally, we also observe that tests based on block-bootstrap statistics are less prone to reject the validity of the model than classical procedures.
In this paper, we proposed Common Principal Components to obtain multifactor models for equity returns, mainly because it can deal with several datasets and can be applied to non-normal data. Direct extensions of this work are to explore the efficency of these multifactor models in other equity markets, as well as in other time periods. A further research line is to explore and adapt other multivariate dimensionality reduction techniques, like MANOVA, although this technique requires additional hypothesis that are hardly fulfilled in real datasets. To explore and adapt MANOVA to be used in large datasets is beyond the scope of this paper, and we leave it for further research.


