Article

Programmable, Universal DNAzyme Amplifier Supporting Pancreatic Cancer-Related miRNAs Detection

1
Key Laboratory of Luminescence Analysis and Molecular Sensing (Southwest University), Ministry of Education, College of Pharmaceutical Sciences, Southwest University, Chongqing 400715, China
2
Department of Pharmacy, The Second Affiliated Hospital of Chongqing Medical University, Chongqing 400010, China
*
Author to whom correspondence should be addressed.
These authors contributed equally to this work.
Chemosensors 2022, 10(7), 276; https://doi.org/10.3390/chemosensors10070276
Submission received: 8 June 2022 / Revised: 8 July 2022 / Accepted: 11 July 2022 / Published: 13 July 2022
(This article belongs to the Special Issue Feature Papers on Luminescent Sensing)

Abstract

:
The abnormal expression of miRNA is closely related to the occurrence of pancreatic cancer. Herein, a programmable DNAzyme amplifier for the universal detection of pancreatic cancer-related miRNAs was proposed based on its programmability through the rational design of sequences. The fluorescence signal recovery of the DNAzyme amplifier showed a good linear relationship with the concentration of miR-10b in the range of 10–60 nM, with a detection limit of 893 pM. At the same time, this method displayed a high selectivity for miR-10b, with a remarkable discrimination of a single nucleotide difference. Furthermore, this method was also successfully used to detect miR-21 in the range of 10–60 nM based on the programmability of the DNA amplifier, exhibiting the universal application feasibility of this design. Overall, the proposed programmable DNAzyme cycle amplifier strategy shows promising potential for the simple, rapid, and universal detection of pancreatic cancer-related miRNAs, which is significant for improving the accuracy of pancreatic cancer diagnosis.

Graphical Abstract

1. Introduction

Pancreatic cancer, a common cancer of the digestive tract, is one of the malignant cancers with the worst prognosis. The vast majority of pancreatic cancer patients are accompanied by numerous complications in the late stage, and cancer resection is hard to perform [1,2]. Therefore, the rapid and sensitive detection of pancreatic-specific biomarkers is helpful for its early diagnosis. As a disease biomarker, microRNAs (miRNAs) are short RNA molecules with 19 to 25 nucleotides in size that can influence the expression of many genes and are involved in several functional interacting pathways [3]. The abnormal expression of miRNAs is related to the occurrence and development of various cancers in humans. For example, previous studies have shown that several miRNAs overexpressed in pancreatic cancer, especially miRNA-10b (miR-10b) and miRNA-21 (miR-21), are associated with a reduction in cancer metastasis time and a decrease in survival rate [4,5]. Moreover, it is worth noting that the simultaneous detection of multiple miRNAs is significant for the accurate diagnosis of diseases. So, it is urgent to develop a universal detection platform for the detection of various miRNAs in pancreatic cancer.
Conventional miRNA detection methods include quantitative real-time polymerase chain reaction (qRT-PCR), Northern blotting, in situ hybridization, and RNA sequencing [6,7,8,9], and so on. For instance, Mikael et al. [10] proposed a highly specific, sensitive, and cost-effective system based on two-step RT-qPCR and SYBR Green detection chemistry, called “two-tailed RT-qPCR”, for quantitative miRNA expression. Even though these methods show advantages of a high sensitivity and specificity, they are limited by the complex procedures and requirements of specialized techniques in laboratory. In addition, false-positives signal may also be generated during the amplification process. At present, more and more current methods are used to detect miRNAs, such as electrochemical biosensors [11,12], surface enhanced Raman scattering (SERS) [13], localized surface plasmon resonance sensors (LSPRs) [14], electrochemiluminescence (ECL) [15], chemiluminescence (CL) [16], and fluorescence (FL) assayx [17]. Most of these assays are subject to expensive equipment, sophisticated operations, and low repeatability. Comparatively, with the significant advantages of a simple operation, high sensitivity, and low cost, FL plays an important role in the detection of miRNA and other biomarkers [18]. In previous work, our group [19] proposed a turn-on FL assay for the specific detection of miR-141 based on a Förster resonance energy transfer (FRET) soft nanoball (fretSNB) strategy, which used fluorescent carbon dots (CDs) as energy donors and black hole quencher 2 (BHQ-2) dyes as energy receptors.
In order to achieve sensitive detection of miRNA, a number of strategies have been introduced into the FL assay in order to improve the analytical performance. For example, Kanaras et al. [20] reported the nanomaterial-based biosensors for targeted detection of mRNA in the freshwater polyp Hydra vulgaris. Huang et al. [21] demonstrated a protease-assisted DNA walker for signal amplification and imaging of miRNA. In the meantime, Lu et al. [22] presented a self-assembly-based technology of nucleic acid molecules for miRNA detection in living cells. Generally, nanomaterial-based biosensors usually involve complex synthesis and modification steps, as well as poor sensitivity [23,24]. Protease-assisted signal amplification is susceptible to external conditions, resulting in a poor stability, which may even increase the risk of false positive or false negative signals [25]. In contrast, amplification techniques based on the self-assembly of nucleic acid molecules are attractive because of its flexible, simple, and convenient design and good stability [26].
Nowadays, various DNA-based artificial amplification strategies have been developed to further improve detection sensitivity, including hybridization chain reaction (HCR) [27], rolling circle amplification (RCA) [28], loop-mediated isothermal amplification (LAMP) [29], catalytic hairpin assembly (CHA) [30], and strand displacement amplification (SDA) [31]. These nucleic acid amplification strategies show great potential, owing to their excellent information encoding ability and accurate base complementary pairing. However, the synthesis of RCA and LAMP is time-consuming, while CHA and HCR usually require specific hairpin DNA sequence design. In comparison, SDA is convenient and rapid, and does not require complex operations and instruments. Furthermore, the combination of SDA and DNAzyme is an attractive strategy for improving detection sensitivity through cyclic amplification.
DNAzyme exhibits an excellent catalytic activity for specific substrate chains containing an RNA strand (rA) as an embedded cleavage site [32]. Additionally, DNAzyme-mediated cleavage reactions can take place at room temperature with the assistance of different metal ions, such as Na+, Mg2+, Zn2+, Mn2+, and Cu2+ [33,34]. Because of its cofactor specificity and cycling catalytic ability, metal ion-assisted DNAzyme amplifiers have been successfully applied for the detection and analysis of metal ions, nucleic acids, proteins, and small molecules. For example, Lu et al. [35] developed a signal amplification strategy based on DNAzyme catalytic cutting and the utilization of CHA to detect low concentrations of endogenous metal ions in cells. Furthermore, they also took advantage of DNAzyme to establish an aptamer sensing platform based on the combination of magnetic beads and DNAzyme for the highly sensitive detection of small molecules such as toxins [36,37]. Based on this, there is the potential to construct a universal DNAzyme amplifier through integration of the programmable nature of DNA nanodevices and the catalytic capability of DNAzyme, which can be conveniently applied for the detection of a wide range of pancreatic cancer-related miRNAs through reasonable sequence design.
Herein, we propose a programmable DNAzyme amplifier based on the DNAzyme cycle amplification strategy for sensitive detection of pancreatic-related miRNAs. The fluorescence of FAM was initially quenched effectively by BHQ1 based on fluorescence resonance energy transfer (FRET). In addition, the activity of DNAzyme is inhibited owing to hybridization with a blocker. In the presence of the target miRNA, DNAzyme could be released to recognize the active site of the substrate strand and cleave it assisted by Mn2+, resulting in the fluorescence recovery of FAM. After cutting the substrate chain, the DNAzyme is released for combining with more substrate strands, resulting in a “one-to-more” fluorescence recovery model. This design idea can improve the sensitivity of miRNA detection and reduce the generation of false positive signals. Compared with other complex amplification cycles, DNAzyme-assisted amplification, which reacts at near room temperature, is easier to be synthesized without complex operating instruments and the detection is fast. More importantly, by taking advantage of the programmable nature of the DNAzyme amplifier, this design can be universally used for the detection of other nucleic acid biomarkers through the rational design of sequences. Therefore, the proposed DNAzyme amplifier is simple and low cost, providing a good idea for the development of a portable detection platform.

2. Materials and Methods

2.1. Apparatus

All of the fluorescence spectra were obtained using a Hitachi F-2500 fluorescence spectrophotometer (Tokyo, Japan). Gel electrophoresis images were performed with a BG-gdsAUTO520 (Baygene, Beijing, China) under UV light. The temperature control during the incubation of the samples was accomplished by an Eppende Thermal Mixer (Eppende, Germany).

2.2. Materials

All of the oligonucleotide sequences—(list in Table S1), diethypyrocarbonate (DEPC) water, Tris boric acid (TBE), 4S Red Plus Nucleic Acid Stain, N,N,N′,N′-Tetramethylethylenediamine (TEMED), 40% acrylamide solution, and Tris-HCl buffer—were provided by Sangon Biotechnology Co., Ltd. (Shanghai, China). Ammonium persulfate (APS) was purchased by the Kelong Chemical Reagent Company (Chengdu, China). MnCl2 reagent was purchased from the Aladdin Reagent Company (Shanghai, China). NaCl was purchased from Chuandong Chemical Co., Ltd. (Chongqing, China). The ultrapure water (18.2 MΩ) used in the experiment was prepared using the Milli-Q Ultrapure Water System (Millipore, Bedford, MA, USA).

2.3. Polypropylene Gel Electrophoresis Analysis

The DNAzyme and blocker (Dzm/blocker) hybrid was heated to 95 °C for 5 min and allowed to cool to room temperature for 2 h before use. Then, the mixture of substrate (2 μM), Dzm/blocker hybrid (2.2 μM), Mn2+ (25 mM), and the same mixture solution with target DNA (2 μM) added were separately and incubated in a reaction buffer at 37 °C for 1 h. After that, 12% native polyacrylamide gel was prepared by mixing ultrapure water (4 mL), TEMED (8 μL), APS (56 μL), 40% acrylamide solution (1.6 mL, 19:1), and 2.4 mL of 5× TBE buffer (89 mM Boric Acid, 89 mM Tris, 2.0 mM EDTA, pH 8.3). The samples with buffer were loaded into the gel and were electrophoresed for about 40 min under 120 V voltage, then stained with 4S Red Plus Nucleic Acid Stain and imaged using a gel imager from BG-gdsAUTO520.

2.4. Reaction Kinetics of the Substrate-Cleaving Performance of the DNAzyme Amplifier

To investigate the reaction kinetics of the DNAzyme amplifier on miR-10b detection, the fluorescence recovery intensity of the DNAzyme amplifier in the absence and presence of miR-10b was recorded at different intervals. Experiments were carried out with the following four groups: (a) substrate + Mn2+; (b) substrate + DNAzyme + Mn2+; (c) substrate + Dzm/blocker + Mn2+; (d) substrate + Dzm/blocker + Mn2+ + miR-10b. The substrate chain was 25 nM and the Dzm/blocker was 25 nM, while Mn2+ was 750 μM. A multi-Mode Microplate Reader (BioTek Instruments, Inc., Synergy H1, Winooski, VT, USA) was used to detect the fluorescence emission spectra of all of the assays. The excitation wavelength was set at 480 nm and the fluorescence emission intensity at 530 nm was recorded at 37 °C. The fluorescence intensities ratio (F/F0) of the DNAzyme amplifier cutting the substrate chain with (F) or without (F0) 50 nM of miR-10b were compared.

2.5. Investigation of Influencing Factors on the Performance of DNAzyme Amplifier

To evaluate the analytical performance of the DNAzyme amplifier, the fluorescence intensities ratio (F/F0) was calculated using a fluorescence intensity of 530 nm in the absence (F0) and presence (F) of the target miR-10b under an excitation of 480 nm. Firstly, the effect of the ratio between the DNAzyme and blocker at 1:0.8, 1:1, 1:1.2, 1:1.4, and 1:1.6 was investigated on the change of F/F0 value by regulating the inhibition degree of the DNAzyme activity. Then, the investigation on the ratio of the substrate strand to DNAzyme was carried out at a ratio of 1:0.1, 1:0.5, 1:1, 1:1.5, and 1:2 for studying the influence of the cleavage ability with different DNAzymes. In addition, Mn2+ also played an important role in the cleavage of DNAzyme, and so we studied the concentration of Mn2+ at 450 μM, 600 μM, 750 μM, and 1050 μM on the performance of the DNAzyme amplifier. Finally, the incubation time under 15 min, 30 min, 45 min, 60 min, and 75 min and temperatures with 25 °C and 37 °C for the detection of miR-10b were investigated while keeping other conditions consistent. The optimal experimental conditions were selected for the subsequent detection of miR-10b.

2.6. Fluorescence Assay of miR-10b

The DNAzyme (25 nM) and blocker (30 nM) were mixed and then annealed in a 95 °C for 5 min of incubation. After cooling to room temperature for 2 h, the Dzm/blocker hybrid was formed. Then, substrate (25 nM) and Dzm/blocker hybrid were added to the solution, which contained 750 μM Mn2+ and a 5 U ribonuclease inhibitor under ice bath conditions in order to prevent miRNA degradation. After that, different concentrations of miR-10b were added to the above solution with a reaction buffer of 25 mM Tris-HCl buffer (containing 137 mM NaCl, pH 7.0), followed by incubation at 37 °C. Finally, the fluorescence measurements were recorded in the range of 500–700 nm under an excitation of 480 nm with a F-2500 fluorescence spectrophotometer (slit 5 nm, voltage 700 V).

2.7. Selective Detection of miR-10b

The ability of this design to selectively detect miR-10b was investigated by comparing the response of the target miR-10b and miRNAs with different mismatching numbers, including single-base mismatch (mis-1), two-base mismatch (mis-2), there-base mismatch (mis-3), and four-base mismatch (mis-4). After the preparation of the solutions as above, 50 nM of target miR-10b and other miRNAs were incubated with the above solutions at 37 °C under the experimental condition of 25 mM Tris HCl buffer (containing 137 mM NaCl, pH 7.0). Subsequently, the fluorescence signal intensity of the solution was detected directly with a F-2500 fluorescence spectrophotometer according to the above procedure.

2.8. Detection of miR-10b in Human Serum Samples

All of the experiments were conducted in accordance with the relevant laws and the institutional guidelines of the Southwest University Institutional Committee ethical standards, and abided by the ethical standards of the institutional committee of Southwest University (yxy2021120). Human serum samples were obtained from the Southwest University Hospital. The obtained serum samples were centrifuged at 3000 rpm for 10 min to collect the condensed samples. According to the standard addition recovery method, low, medium, and high concentrations of miR-10b were added to the serum, respectively, followed by diluting 200 times with 25 mM Tris-HCl buffer (containing 137 mM NaCl, pH 7.0). The final miRNA concentrations were 20, 40, and 60 nM, respectively. Subsequently, the reaction was carried out in the incubator at 37 °C for 1 h, and the fluorescence emission intensity at 530 nm was detected under an excitation of 480 nm according to the above method.

3. Results and Discussion

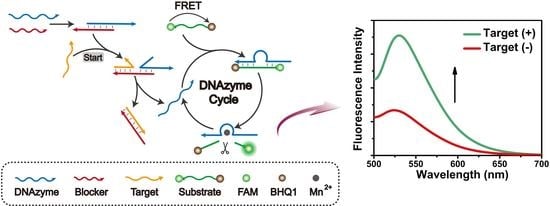
3.1. Mechanism of the DNAzyme Amplifier

In this work, a programmable DNAzyme amplifier for detecting pancreatic cancer-related miRNAs is constructed based on the principle of FRET and the DNAzyme cyclic amplification strategy (Scheme 1). The two ends of substrate are modified with fluorescence dye (FAM) and quencher (BHQ1), respectively. As the distance between FAM and BHQ1 is less than 10 nm, FRET occurs, resulting in the fluorescence quenching (“FL off”). In the absence of a target, the active site of DNAzyme is inhibited by hybridizing with the blocker to form a Dzm/blocker hybrid; thus, it is unable to cleave the substrate chain. In the presence of the target, DNAzyme can be released through the chain substitution reaction, resulting in the formation of double chain hybridization between the target and blocker (target/blocker). In this case, the DNAzyme can recognize the active site and cleave the substrate chain into short chains with the help of Mn2+, resulting in the recycling of DNAzyme for the generation of the “one-to-more” fluorescence recovery model (“FL on”). Therefore, the high-sensitivity detection of the target miRNA can be achieved by taking advantage of signal amplification through enzyme cleavage. Furthermore, according to the sequences of other nucleic acid biomarkers, DNAzyme amplifier can be used to detect other biomarkers by replacing the corresponding blocker and DNAzyme sequences, which enables the DNAzyme amplifier to be programmable for more applications in clinic diagnosis.

3.2. Feasibility of the DNAzyme Amplifier

To verify the amplification feasibility of the programmable DNAzyme amplifier system for miRNA detection, the fluorescence emission spectra were first recorded under different conditions. As depicted in Figure 1A, compared with the single substrate chain (a) or the substrate chain added with DNAzyme (b), the fluorescence of substrate in the presence of both DNAzyme and Mn2+ was the highest (c), indicating that the addition of Mn2+ can assist DNAzyme in successfully cleaving the substrate chain. In addition, the fluorescence was significantly decreased with the addition of the blocker (d), demonstrating that the blocker sequence can inhibit the cleavage activity of DNAzyme, which proved the rational design of the sequence for the DNAzyme cleavage reaction. Then, we used miR-10b as the detection target to verify the occurrence of DNAzyme circulation. In the presence of miR-10b, DNAzyme cycle amplification was successfully activated, resulting in the cleavage of the substrate and in the fluorescence recovery of FAM by interpreting the FRET process (Figure 1B).
Then, polypropylene gel electrophoresis was applied to further verify the target activated DNAzyme cycle (Figure 1C). As miR-10b is unstable and easy to degrade at room temperature, we used DNA-10b instead of miR-10b for polypropylene gel electrophoresis verification. Compared with the free DNAzyme (lane 3) or blocker (lane 4), a band with slower mobility was observed for the Dzm/blocker hybrid (lane 5), demonstrating the high binding affinity between the DNAzyme and blocker. Then, the addition of a substrate did not cause an obvious change of the band (lane 7), because the activity of DNAzyme was inhibited by the blocker in the absence of DNA-10b. Comparatively, in the presence of DNA-10b, the band of DNAzyme was restored with the appearance of a new product band of the DNA-10b/blocker hybrid and cleaved short substrate sequence (FAM-DNA) with a higher electrophoretic mobility (lane 8). This revealed that DNAzyme amplification was accomplished by the target mediated target/blocker hybridization and the subsequent release of DNAzyme for substrate cleavage. Therefore, the sensitive detection of miR-10b is feasible with a DNAzyme amplifier through simple biocatalysis for interruption of the FRET process.

3.3. Reaction Kinetics of the Substrate-Cleaving Performance of the DNAzyme Amplifier

To further demonstrate how the presence of miR-10b can successfully activate DNAzyme cycle amplification, the fluorescence recovery intensity of the DNAzyme amplifier cycle was compared with that of single DNAzyme catalysis. Changes in the time-dependent fluorescence signal of the developed DNAzyme amplifier were monitored using a time interval of 5 min. The fluorescence signal of the substrate changed negligibly in 120 min in the absence of the DNAzyme, demonstrating that it was stable in the buffer (Figure 2A, curve a). The presence of DNAzyme can indeed cleave the substrate chain into short chains with the help of Mn2+, resulting in slight fluorescence recovery (Figure 2A, curve b). This cleavage reaction could not happen once the DNAzyme activity was inhibited in the presence of the blocker sequence (Figure 2A, curve c). Only in the presence of miR-10b could the DNAzyme cycle amplification be activated by releasing the DNAzyme for recycling; thus, it achieved the highest fluorescence recovery signal in a short time (15 min) and remained stable for 120 min (Figure 2A, curve d). This result showed that the DNAzyme amplifer with miR-10b can perform a faster and more efficient cleaving cycle reaction than the single DNAzyme catalysis substrate. Moreover, the comparison of the fluorescence signal ratio (F/F0) in Figure 2B further demonstrates that DNAzyme cycle amplifier had a higher substrate-cleaving efficiency than the single DNAzyme cleaving.

3.4. Effects on the Performance of DNAzyme Amplifier

The performance of the cyclic amplification of the DNAzyme amplifier was determined through various factors, including the ratio of DNAzyme to blocker, ratio of substrate chain to DNAzyme, Mn2+ concentration, and temperature. Hence, we investigated the effects of these different experimental conditions on the performance of this DNAzyme amplifier. The F/F0 was adapted to evaluate the analytical performance of DNAzyme amplifier, where F0 and F represent the fluorescence intensity in the absence and presence of target miR-10b, respectively. First, the ratio of the DNAzyme and blocker was investigated because the efficient analyte regeneration required an appropriate proportion of the DNAzyme and blocker. On the one hand, when the DNAzyme was in excess in the solution, the free DNAzyme could cleave the substrate chain even when in the absence of a target, resulting in a high background signal. On the other hand, the excess blocker in the solution would give priority to hybridize with the target miR-10b, resulting in a lower detection sensitivity.
As shown in Figure 3A, F/F0 was increased gradually when the ratio of DNAzyme and blocker changed from 1:0.8 to 1:1.2. Hence, the ratio of 1:1.2 for the DNAzyme and blocker was applied in the subsequent experiments. Then, the ratio of the substrate and DNAzyme was investigated because the DNAzyme acted as the “pioneer” of the cutting substrate chain to generate the fluorescence signal. Clearly, F/F0 gradually increased and then decreased with the increasing ratio of substrate and DNAzyme from 1:0.1 to 1:2, which gave the maximum F/F0 readout when the ratio reached 1:1 (Figure 3B). Therefore, the ratio of the substrate and DNAzyme at 1:1 was best for the performance of the DNAzyme amplifier. Next, as the whole cleavage process depended on the assistance of Mn2+, the concentration of Mn2+ was also investigated. The F/F0 value gradually increased and reached a maximum when the concentration of Mn2+ was 750 μM. Thus, this concentration was used for the subsequent experiments (Figure 3C). Similarly, the enzymatic temperature was also explored, and the optimized temperature was chosen as 37 °C (Figure 3D). Thus, through the exploration of the experimental conditions, a remarkably powerful DNAzyme amplifier was successfully constructed for the miR-10b assay.

3.5. Detection Capability of MiR-10b by the DNAzyme Amplifier

To further evaluate the detection capability of the DNAzyme amplifier, the fluorescence response of the amplifier was acquired through incubation with varied concentrations of miR-10b, from 10 nM to 60 nM, under optimal experimental conditions (Figure 4A). The fluorescence was enhanced gradually with the increasing miR-10b concentration, confirming that miR-10b activated the Mn2+ assisted DNAzyme circle for cleaving the labeled substrate chain. The fluorescence recovery displayed a linear relationship with an miR-10b concentration ranging from 10 to 60 nM, and the regression equation was found to be F/F0 = 0.00848 cmiR-10b + 1.07 with a correlation coefficient of R2 = 0.998 (Figure 4B). In addition, the detection limit (3σ/K) was found to be 893 pM with the DNAzyme amplifier, demonstrating the powerful DNAzyme biocatalytic circular reaction.
Furthermore, the selectivity of the DNAzyme amplifier was also estimated by comparing the fluorescence recovery in the presence of miR-10b and other four different oligonucleotides with a high homology (Figure 4C). Specifically, different mismatched bases, including mis-1, mis-2, mis-3, and mis-4, were detected under the same optimal experiment conditions as miR-10b. Compared with these homologous sequences, miR-10b showed a remarkably distinguishable response of F/F0 (Figure 4D). This can be attributed to the fact that when mismatched bases were present in the miRNA sequence, it was difficult to trigger the strand displacement reaction, thus exhibiting an admirable specificity of the amplifier for miR-10b detection. The above results suggest that the proposed DNAzyme amplifier shows an admirable sensitivity and selectivity to detect miR-10b in vitro. Simultaneously, the results are comparable with the previous detection results (Table S2). More importantly, this DNAzyme amplifier is simple, economical, and with an obviously shorter detection time (15 min) for miR-10b detection, which provided the potential for the application of DNAzyme amplifier in clinic diagnosis.

3.6. Practical Detectability of the DNAzyme Amplifier

The sensitivity and selectivity of the proposed strategy implied that it may be capable of high-confidence miRNA detection in real samples. To investigate the feasibility of this platform, different concentrations of miR-10b were added to the serum according to the spike-recovery method. Measurements were carried out by adding 20, 40, and 60 nM of miR-10b to the serum, and the results are shown in Table 1. It could be noted that the recovery was from 94.12% to 106.73% and the relative standard deviation (RSD) was less than 3.3%. Therefore, the serum miRNA concentration measured by this method was very close to the added amount in the complicated sample, indicating that the DNAzyme amplifier had great potential to specifically detect the target miR-10b in real samples. The above results prove that this detection platform provides a new alternative method for the detection of tumor markers in clinical application.

3.7. Universal Detection of the DNAzyme Amplifier for miR-21

Because the sequence design of DNAzyme is flexible, the programmable DNAzyme amplification represents a general signal transduction module and thus can be easily replaced with other DNAzyme sequences to detect other miRNAs in pancreatic cancer. For instance, miR-21 is also a biomarker of pancreatic cancer, which is closely related to the low survival rate of patients. Therefore, its detection is also very important in order to prevent pancreatic cancer. The fluorescent DNAzyme amplifier could also be developed for detecting miR-21 by substituting the DNAzyme sequence with the specifically sequence of miR-21 detection (called DNAzyme-21 in Table S1). In the absence of miR-21, DNAzyme could not be released out to cleave the substrate chain (called substrate-21 in Table S1) as the cleavage activity was inhibited by the blocker (called blocker-21 in Table S1), resulting in a lower fluorescence intensity (Figure 5A). It is clear that the fluorescence intensity of the amplifier was significantly recovered in the presence of miR-21. Therefore, the proposed DNAzyme amplifier can also be used for the assay of miR-21.
The experimental conditions for the detection of miR-21 were also optimized in the same way as the assay of miR-10b (Figure S1). It was found that when the ratio between the DNAzyme and blocker was 1:1.2, the ratio between the substrate DNA and DNAzyme was 1:1, the Mn2+ concentration was 750 μM, and the F/F0 value achieved maximum for the detection of miR-21. Therefore, under the above optimized biocatalytic conditions for the DNAzyme amplifier, the detection of miR-21 was carried out. The fluorescence intensity was increased gradually as the concentrations of miR-21 increased from 10 nM to 60 nM (Figure 5B) and the corresponding linear regression equation was found to be F/F0 = 0.235 cmiR-21 + 1.27 with a correlation coefficient of 0.998 (Figure 5C). Similarly, under optimal conditions, the selectivity of miR-21 with the proposed DNAzyme amplifier was also acquired (Figure 5D). Compared with the other four mismatched bases, it showed good selectivity for miR-21, demonstrating the universal application of the programmable DNAzyme amplifier for miRNA detection with a high specificity.

4. Conclusions

In summary, a programmable, universal DNAzyme amplifier was constructed for pancreatic cancer-related miRNAs detection based on the rational design of sequences. The DNAzyme amplifier is simple to build, consisting of only the DNAzyme, metal ions, the blocker, and specific substrate chains. With the circular reaction of the DNAzyme amplifier, more substrate chains can be cleaved for the generation of “one-to-more” fluorescence recovery model, thus significantly improving the sensitivity of the detection. The DNAzyme amplifier was successfully used for the detection of miR-10b and miR-21 with a high specificity and rapid fluorescence response. Furthermore, through this simple design, more and more miRNA can be generally detected in vitro only by changing the bases matched with the programmable, universal DNAzyme amplifier, which provides a universal detection platform for future disease diagnosis. In future work, according to the programmable characteristics of the DNAzyme amplifier, it can be rationally designed to combine with nano materials or other signal amplification methods such as CHA, HCR, or RCA to further amplify the detection signal and achieve higher sensitive detection of biomarkers. Therefore, the proposed programmable, universal DNAzyme amplifier is significant for the application of clinic testing and point of care testing (POCT).

Supplementary Materials

The following supporting information can be downloaded at: https://www.mdpi.com/article/10.3390/chemosensors10070276/s1. Table S1: The DNA/RNA sequences information (Note: _represents mismatch bases). Table S2: Comparison of miR-10b detection between this work and other strategies. Figure S1: Optimization of experimental conditions for miR-21 detection. (A) Optimization of the ratio between DNAzyme and blocker. (B) Optimization of the ratio between substrate DNA and DNAzyme. (C) Optimization of Mn2+ concentration. (D) Optimization of temperature for miR-21 detection. Error bars represented the standard deviation of three determinations.

Author Contributions

Conceptualization, Y.J. and N.W.; data curation, K.N., N.W., and Y.W.; formal analysis, L.Z.; funding acquisition, C.H. and C.L.; investigation, K.N. and D.L.; methodology, N.W.; project administration, C.L.; software, Y.J.; supervision, C.L.; validation, K.N., N.W., and Y.W.; visualization, K.N. and Y.J.; writing—original draft, Y.J.; writing—review and editing, K.N. All authors have read and agreed to the published version of the manuscript.

Funding

This research was funded by the National Natural Science Foundation of China (NSFC, no. 22074124), the fund of Fundamental Research Funds for the Central Universities (XDJK2020TY001), Chongqing Talents Program for Outstanding Scientists (No. cstc2021ycjh-bgzxm0179), and the Chongqing Graduate Student Scientific Research Innovation Project (CYB21119).

Institutional Review Board Statement

Not applicable.

Informed Consent Statement

Not applicable.

Data Availability Statement

Not applicable.

Acknowledgments

The authors would like to thank the Luminescence Analysis and Molecular Sensing (Southwest University) at Chongqing for supporting this research and providing the appropriate research environment.

Conflicts of Interest

The authors declare no conflict of interest.

References

  1. Jun, I.; Hirochika, T.; Ippei, M.; Sadaki, A.; Tadahiro, G.; Sachio, T.; Yoshihide, N.; Azusa, Y.; Takuya, M.; Yuki, U.; et al. Second primary pancreatic ductal carcinoma in the remnant pancreas after pancreatectomy for pancreatic ductal carcinoma: High cumulative incidence rates at 5 years after pancreatectomy. Pancreatology 2016, 16, 615–620. [Google Scholar]
  2. Shinji, I.; Yasutsugu, S.; Tsunehiro, M.; Toshiji, T.; Takayuki, N.; Hiroyuki, T.; Satoru, T.; Masamichi, K.; Taichi, T.; Ayana, I.; et al. Two case reports of resectable cancer in the remnant pancreas after pancreatectomy for invasive ductal carcinoma of the pancreas. J. Clim. 2018, 103, 542–547. [Google Scholar]
  3. Lu, T.X.; Rothenberg, M.E. MicroRNA. J. Allergy Clin. Immunol. 2018, 141, 1202–1207. [Google Scholar] [CrossRef] [PubMed] [Green Version]
  4. Fathi, M.; Ghafouri-Fard, S.; Abak, A.; Taheri, M. Emerging roles of miRNAs in the development of pancreatic cancer. Biomed. Pharmacother. 2021, 141, 111914. [Google Scholar] [CrossRef]
  5. Nakata, K.; Ohuchida, K.; Mizumoto, K.; Kayashima, T.; Ikenaga, N.; Sakai, H.; Lin, C.; Fujita, H.; Otsuka, T.; Aishima, S.; et al. MicroRNA-10b is overexpressed in pancreatic cancer, promotes its invasiveness, and correlates with a poor prognosis. Surgery 2011, 150, 916–922. [Google Scholar] [CrossRef]
  6. Schwarzkopf, M.; Pierce, N.A. Multiplexed miRNA northern blots via hybridization chain reaction. Nucleic Acids Res. 2016, 44, 15. [Google Scholar] [CrossRef] [PubMed] [Green Version]
  7. Lucchinetti, E.; Zaugg, M. RNA sequencing. Anesthesiology 2020, 133, 976–978. [Google Scholar] [CrossRef]
  8. Babapoor, S.; Horwich, M.; Wu, R.; Levinson, S.; Gandhi, M.; Makkar, H.; Kristjansson, A.; Chang, M.; Dadras, S.S. MicroRNA in situ hybridization for miR-211 detection as an ancillary test in melanoma diagnosis. Mod. Pathol. 2016, 29, 461–475. [Google Scholar] [CrossRef] [Green Version]
  9. Pritchard, C.C.; Cheng, H.H.; Tewari, M. MicroRNA profiling: Approaches and considerations. Nat. Rev. Genet. 2012, 13, 358–369. [Google Scholar] [CrossRef]
  10. Androvic, P.; Valihrach, L.; Elling, J.; Sjoback, R.; Kubista, M. Two-tailed RT-qPCR: A novel method for highly accurate miRNA quantification. Nucleic Acids Res. 2017, 45, e144. [Google Scholar] [CrossRef]
  11. Balkourani, G.; Brouzgou, A.; Archonti, M.; Papandrianos, N.; Song, S.; Tsiakaras, P. Emerging materials for the electrochemical detection of COVID-19. J. Electroanal. Chem. 2021, 893, 115289. [Google Scholar] [CrossRef] [PubMed]
  12. Negahdary, M.; Angnes, L. Application of electrochemical biosensors for the detection of microRNAs (miRNAs) related to cancer. Coord. Chem. Rev. 2022, 464, 214565. [Google Scholar] [CrossRef]
  13. Su, J.; Wang, D.; Lena, N.; Shen, J.; Zhao, Z.; Dou, Y.; Peng, T.; Shi, J.; Sanjay, M.; Fan, C.; et al. Multicolor gold–silver nano-mushrooms as ready-to-use SERS probes for Ultrasensitive and multiplex DNA/miRNA detection. Anal. Chem. 2017, 89, 2531–2538. [Google Scholar] [CrossRef]
  14. Ki, J.; Lee, H.Y.; Son, H.Y.; Huh, Y.M.; Haam, S. Sensitive plasmonic detection of miR-10b in biological samples using enzyme-assisted target recycling and developed LSPR probe. ACS Appl. Mater. Interfaces 2019, 11, 18923–18929. [Google Scholar] [CrossRef] [PubMed]
  15. Cao, Y.; Ma, C.; Zhu, J.-J. DNA technology-assisted signal amplification strategies in electrochemiluminescence bioanalysis. J. Anal. Test. 2021, 5, 95–111. [Google Scholar] [CrossRef]
  16. Jiang, Y.J.; Yang, X.J.; Wang, J.; Li, Y.F.; Li, C.M.; Huang, C.Z. Soft nanoball-encapsulated carbon dots for reactive oxygen species scavenging and the highly sensitive chemiluminescent assay of nucleic acid biomarkers. Analyst 2021, 146, 7187–7193. [Google Scholar] [CrossRef]
  17. Ki, J.; Jang, E.; Han, S.; Shin, M.K.; Kang, B.; Huh, Y.M.; Haam, S. Instantaneous pH-boosted functionalization of stellate gold nanoparticles for intracellular imaging of miRNA. ACS Appl. Mater. Interfaces 2017, 9, 17702–17709. [Google Scholar] [CrossRef]
  18. Li, X.; Chen, S.; Liu, Q.; Luo, Y.; Sun, X. Hexagonal boron nitride nanosheet as an effective nanoquencher for the fluorescence detection of microRNA. Chem. Commun. 2021, 57, 8039–8042. [Google Scholar] [CrossRef]
  19. Cheng, Y.Y.; Xie, Y.F.; Li, C.M.; Li, Y.F.; Huang, C.Z. Förster resonance energy transfer-based soft nanoballs for specific and amplified detection of microRNAs. Anal. Chem. 2019, 91, 11023–11029. [Google Scholar] [CrossRef]
  20. Moros, M.; Kyriazi, M.-E.; El-Sagheer, A.H.; Brown, T.; Tortiglione, C.; Kanaras, A.G. DNA-coated gold nanoparticles for the detection of mRNA in live hydra vulgaris animals. ACS Appl. Mater. Interfaces 2019, 11, 13905–13911. [Google Scholar] [CrossRef]
  21. Chen, M.; Duan, R.; Xu, S.; Duan, Z.; Yuan, Q.; Xia, F.; Huang, F. Photoactivated DNA walker based on DNA nanoflares for signal-amplified microRNA Imaging in single living cells. Anal. Chem. 2021, 93, 16264–16272. [Google Scholar] [CrossRef] [PubMed]
  22. Xing, C.; Chen, S.; Lin, Q.; Lin, Y.; Wang, M.; Wang, J.; Lu, C. An aptamer-tethered DNA origami amplifier for sensitive and accurate imaging of intracellular microRNA. Nanoscale 2022, 14, 1327–1332. [Google Scholar] [CrossRef] [PubMed]
  23. Chen, X.; Guo, Z. Special topic: Novel sensing materials and their applications in analytical chemistry. J. Anal. Test. 2021, 5, 1–2. [Google Scholar] [CrossRef]
  24. Robertson, N.M.; Hizir, M.S.; Balcioglu, M.; Wang, R.; Yavuz, M.S.; Yumak, H.; Ozturk, B.; Sheng, J.; Yigit, M.V. Discriminating a single nucleotide difference for enhanced miRNA detection using tunable graphene and oligonucleotide nanodevices. Langmuir 2015, 31, 9943–9952. [Google Scholar] [CrossRef]
  25. Yoo, B.; Kavishwar, A.; Ghosh, S.K.; Barteneva, N.; Yigit, M.V.; Moore, A.; Medarova, Z. Detection of miRNA expression in intact cells using activatable sensor oligonucleotides. Chem. Biol. 2014, 21, 199–204. [Google Scholar] [CrossRef] [PubMed] [Green Version]
  26. Yu, K.X.; Qiao, Z.J.; Song, W.L.; Bi, S. DNA nanotechnology for multimodal synergistic theranostics. J. Anal. Test. 2021, 5, 112–129. [Google Scholar] [CrossRef]
  27. Quan, K.; Li, J.; Wang, J.; Xie, N.; Wei, Q.; Tang, J.; Yang, X.; Wang, K.; Huang, J. Dual-microRNA-controlled double-amplified cascaded logic DNA circuits for accurate discrimination of cell subtypes. Chem. Sci. 2019, 10, 1442–1449. [Google Scholar] [CrossRef] [Green Version]
  28. Deng, R.; Tang, L.; Tian, Q.; Wang, Y.; Lin, L.; Li, J. Toehold-initiated rolling circle amplification for visualizing individual microRNAs in situ in single cells. Angew. Chem. 2014, 126, 2421–2425. [Google Scholar] [CrossRef]
  29. Abdullah Al-Maskri, A.A.; Ye, J.; Talap, J.; Hu, H.; Sun, L.; Yu, L.; Cai, S.; Zeng, S. Reverse transcription-based loop-mediated isothermal amplification strategy for real-time miRNA detection with phosphorothioated probes. Anal. Chim. Acta 2020, 1126, 1–6. [Google Scholar] [CrossRef]
  30. Jin, F.; Xu, D. A fluorescent microarray platform based on catalytic hairpin assembly for MicroRNAs detection. Anal. Chim. Acta 2021, 1173, 338666. [Google Scholar] [CrossRef]
  31. Duan, R.; Zuo, X.; Wang, S.; Quan, X.; Chen, D.; Chen, Z.; Jiang, L.; Fan, C.; Xia, F. Lab in a tube: Ultrasensitive detection of microRNAs at the single-cell level and in breast cancer patients using quadratic isothermal amplification. J. Am. Chem. Soc. 2013, 135, 4604–4607. [Google Scholar] [CrossRef] [PubMed]
  32. Aihua, T.; Yu, L.; Jian, G. Sensitive SERS detection of lead ions via DNAzyme based quadratic signal amplification. Talanta 2017, 171, 185–189. [Google Scholar]
  33. Liu, S.; Wei, W.; Sun, X.; Wang, L. Ultrasensitive electrochemical DNAzyme sensor for lead ion based on cleavage-induced template-independent polymerization and alkaline phosphatase amplification. Biosens. Bioelectron. 2016, 83, 33–38. [Google Scholar] [CrossRef]
  34. Liu, H.; Yang, Q.; Peng, R.; Kuai, H.; Lyu, Y.; Pan, X.; Liu, Q.; Tan, W. Artificial signal feedback network mimicking cellular adaptivity. J. Am. Chem. Soc. 2019, 141, 6458–6461. [Google Scholar] [CrossRef]
  35. Wu, Z.; Fan, H.; Satyavolu, N.S.R.; Wang, W.; Lake, R.; Jiang, J.-H.; Lu, Y. Imaging endogenous metal ions in living cells using a DNAzyme—Catalytic hairpin assembly probe. Angew. Chem. Int. Ed. 2017, 56, 8721–8725. [Google Scholar] [CrossRef] [PubMed]
  36. Zhang, S.; Luan, Y.; Xiong, M.; Zhang, J.; Lake, R.; Lu, Y. DNAzyme amplified aptasensing platform for ochratoxin a detection using a personal glucose meter. ACS Appl. Mater. Interfaces 2021, 13, 9472–9481. [Google Scholar] [CrossRef] [PubMed]
  37. Xue, C.; Luo, M.; Wang, L.; Li, C.; Hu, S.; Yu, X.; Yuan, P.; Wu, Z.S. Stimuli-responsive autonomous-motion molecular machine for sensitive simultaneous fluorescence imaging of intracellular microRNAs. Anal. Chem. 2021, 93, 9869–9877. [Google Scholar] [CrossRef] [PubMed]
Scheme 1. Schematic diagram of the universal DNAzyme amplifier supporting pancreatic cancer-related miRNA detection.
Chemosensors 10 00276 sch001
Figure 1. The feasibility of the detection of miR-10b with the DNAzyme amplification strategy. (A) The relative fluorescence intensity of the solution under different conditions: (a) substrate; (b) substrate + DNAzyme; (c) substrate + DNAzyme + Mn2+; (d) substrate + Dzm/blocker + Mn2+. Error bars represent the standard deviation of three determinations. (B) The fluorescence emission spectra of the DNAzyme amplifier in the absence and presence of miR-10b. Experimental conditions: miR-10b concentration of 50 nM, substrate concentration of 25 nM, DNAzyme concentration of 25 nM, blocker concentration of 30 nM, Mn2+ concentration of 750 μM, 25 mM Tris-HCl buffer (containing 137 mM NaCl, pH 7.0). (C) Polypropylene gel electrophoresis, lane 1: DNA marker (25–500 bp); lane 2: substrate; lane 3: DNAzyme; lane 4: blocker; lane 5: Dzm/blocker; lane 6: DNA-10b; lane 7: substrate + Dzm/blocker + Mn2+; lane 8: substrate + Dzm/blocker + Mn2+ + DNA-10b.
Chemosensors 10 00276 g001
Figure 2. Reaction kinetics of the substrate-cleaving performance of DNAzyme amplifier. (A) Time-dependent fluorescence signal changes of different reaction systems: (a) substrate + Mn2+; (b) substrate + DNAzyme + Mn2+; (c) substrate + Dzm/blocker + Mn2+; (d) substrate + Dzm/blocker + Mn2+ + miR-10b. (B) F/F0 signal changes of different reaction systems. (a) Single DNAzyme catalysis cleaving performance with DNAzyme. (b) DNAzyme cycle amplifier cleaving performance with miR-10b. F0 and F represent the fluorescence intensity in the absence and presence of target miR-10b, respectively. Error bars represent the standard deviation of three determinations. Experimental conditions: substrate concentration of 25 nM, DNAzyme concentration of 25 nM, blocker concentration of 30 nM, Mn2+ concentration of 750 μM, miR-10b concentration of 50 nM, 25 mM Tris-HCl buffer (containing 137 mM NaCl, pH 7.0).
Chemosensors 10 00276 g002
Figure 3. Optimization of experimental conditions for DNAzyme amplifier performance. (A) Optimization of the ratio between the DNAzyme and blocker. (B) Optimization of the ratio between the substrate and DNAzyme. (C) Optimization of the Mn2+ concentration. (D) Optimization of temperature in miR-10b detection. Error bars represented the standard deviation of three determinations. Experimental conditions: substrate concentration of 25 nM, DNAzyme concentration of 25 nM, blocker concentration of 30 nM, Mn2+ concentration of 750 μM, 25 mM Tris-HCl buffer (containing 137 mM NaCl, pH 7.0).
Chemosensors 10 00276 g003
Figure 4. (A) Fluorescence emission spectra of the DNAzyme amplifier in the presence of different concentrations of miR-10b, from bottom to top: 0 nM, 10 nM, 20 nM, 30 nM, 40 nM, 50 nM, and 60 nM. (B) The linear relationship between F/F0 and the concentration of miR-10b. (C) Fluorescence emission spectra of the DNAzyme amplifier in the presence of miR-10b and homologous miRNAs sequences with different mismatch bases. (D) Selectivity for the detection of miR-10b. Error bars represented the standard deviation of three determinations. Experimental conditions: substrate concentration of 25 nM, DNAzyme concentration of 25 nM, blocker concentration of 30 nM, Mn2+ concentration of 750 μM, 25 mM Tris-HCl buffer (containing 137 mM NaCl, pH 7.0).
Chemosensors 10 00276 g004
Figure 5. (A) The feasibility for the detection of miR-21 with the DNAzyme amplification strategy. (B) Fluorescence emission spectra of DNAzyme amplifier in the presence of different concentrations of miR-21 (from bottom to top: 0 nM, 10 nM, 20 nM, 30 nM, 40 nM, 50 nM, and 60 nM). (C) The linear relationship between F/F0 and the concentration of miR-21. (D) Selectivity for the detection of miR-21. Error bars represented the standard deviation of three determinations. Experimental conditions: substrate concentration of 25 nM, DNAzyme concentration of 25 nM, blocker concentration of 30 nM, Mn2+ concentration of 750 μM, 25 mM Tris-HCl buffer (containing 137 mM NaCl, pH 7.0).
Chemosensors 10 00276 g005
Table 1. Human serum recovery test for miR-10b detection.
SampleAdd/nMFound/nM Mean a ± SD bRecovery/% (n = 3)RSD/% (n = 3)
12019 ± 0.4394.122.3
24043 ± 1.39106.733.3
36062 ± 0.86103.631.4
a The mean of three determinations. b SD = standard deviation. Experimental conditions: substrate concentration of 25 nM, DNAzyme concentration of 25 nM, blocker concentration of 30 nM, Mn2+ concentration of 750 μM, 25 mM Tris-HCl buffer (containing 137 mM NaCl, pH 7.0).
Publisher’s Note: MDPI stays neutral with regard to jurisdictional claims in published maps and institutional affiliations.

