
A Red-Emitting Fluorescence Probe for Rapid Detecting Exogenous and Endogenous Peroxynitrite in Living Cells with High Sensitivity and Selectivity


Abstract
:1. Introduction
2. Materials and Methods
2.1. Reagents and Instrumentation
2.2. Synthesis of Compound 1
2.3. Synthesis of BP613
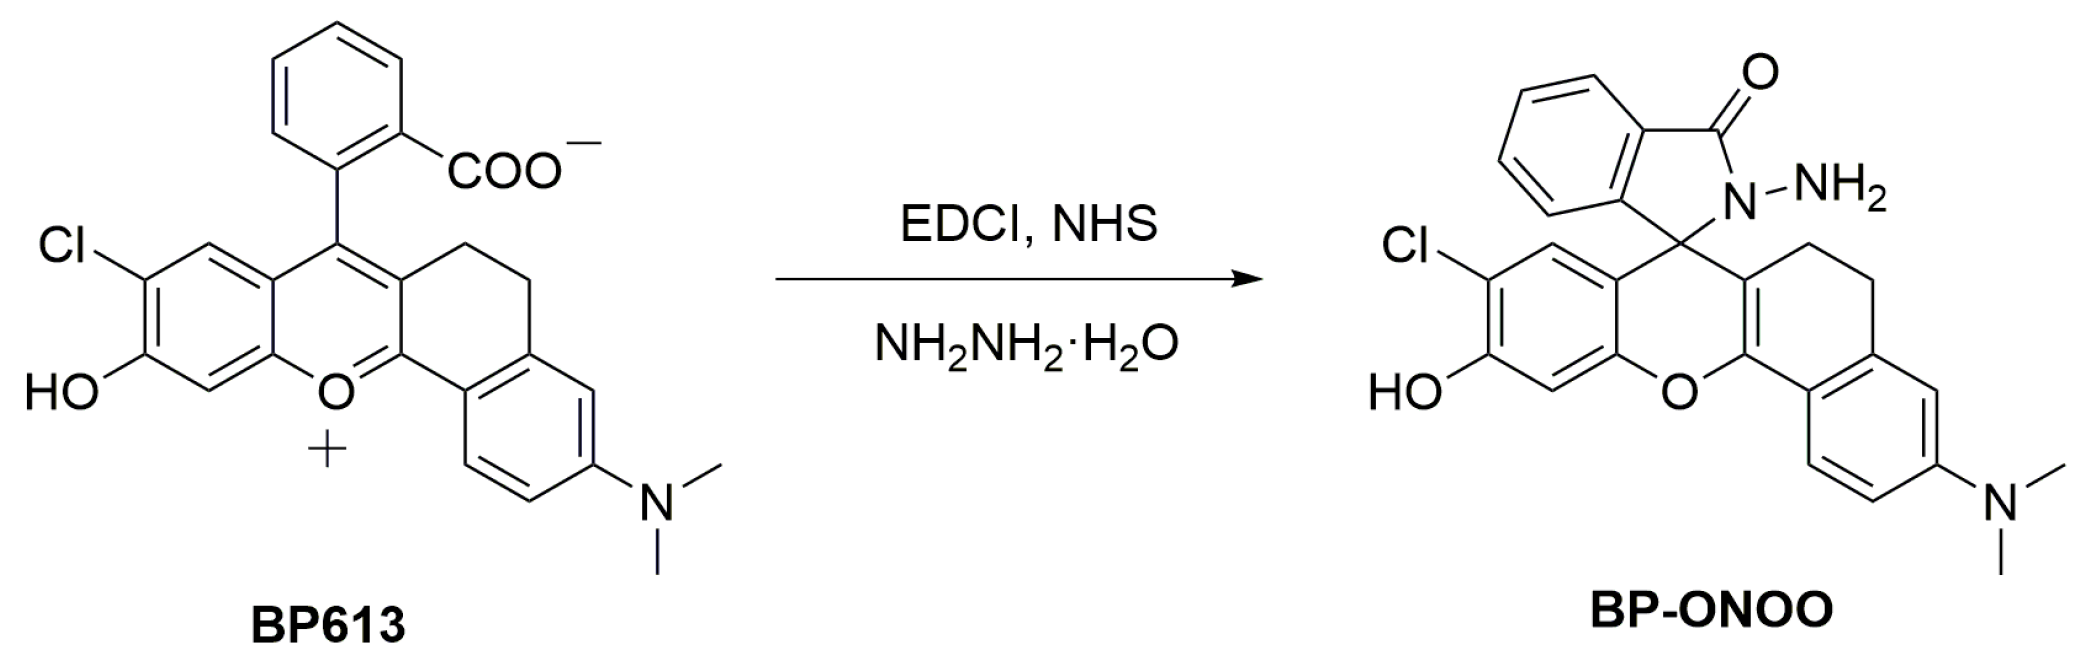
2.4. Synthesis of BP-ONOO
2.5. Optical Detection Procedure for ONOO−
2.6. Cytotoxicity Assay of Probe
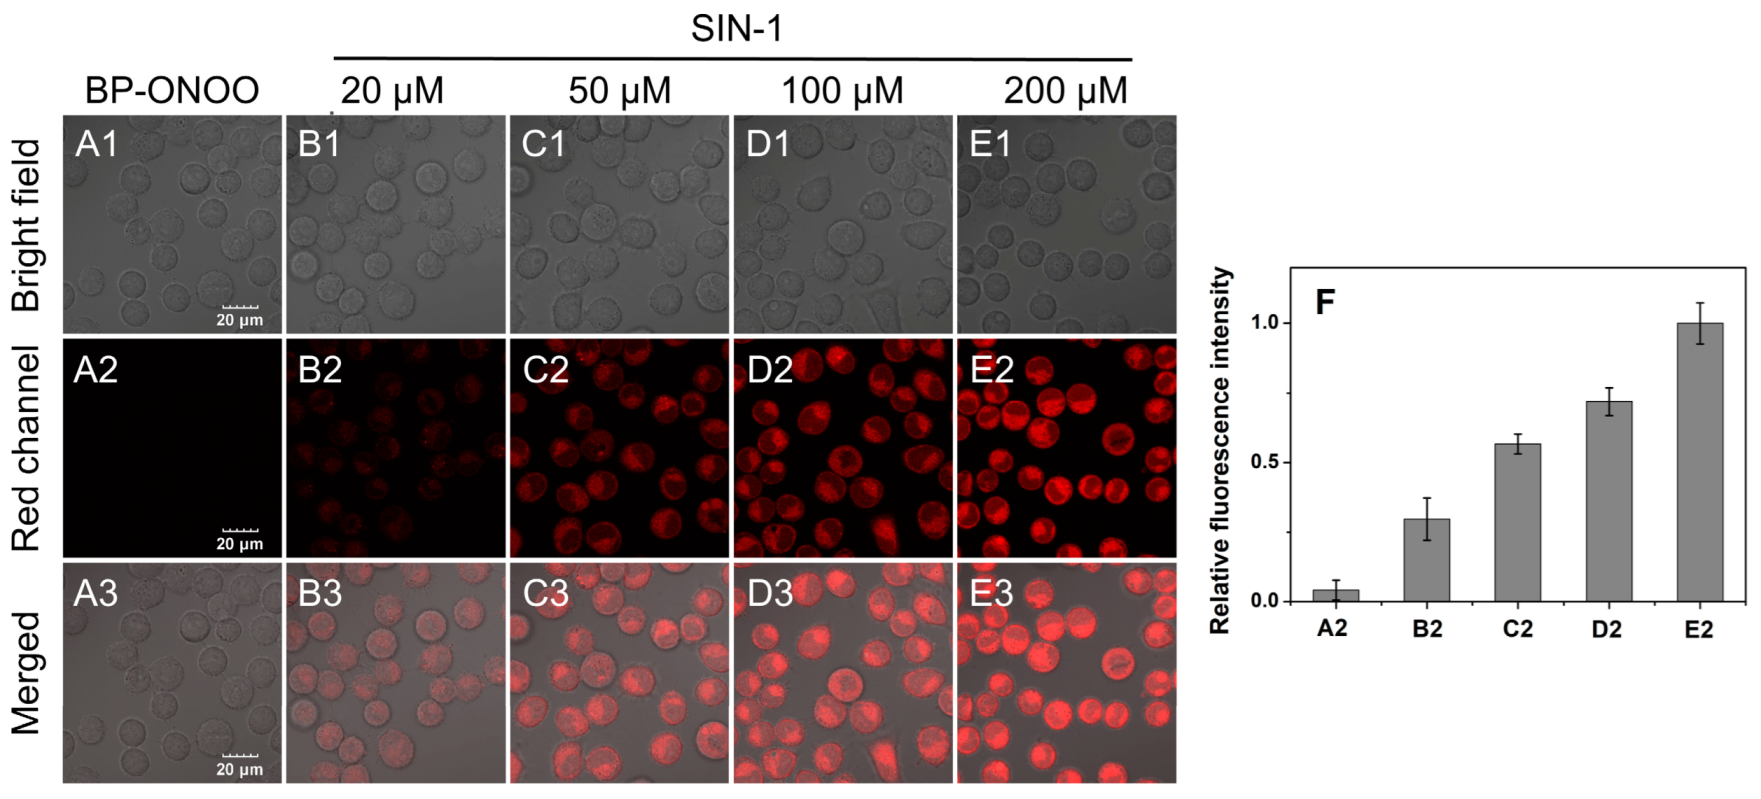
2.7. Fluorescence Imaging Study for Endogenous and Exogenous ONOO−
3. Results and Discussion
3.1. Synthesis of Probe
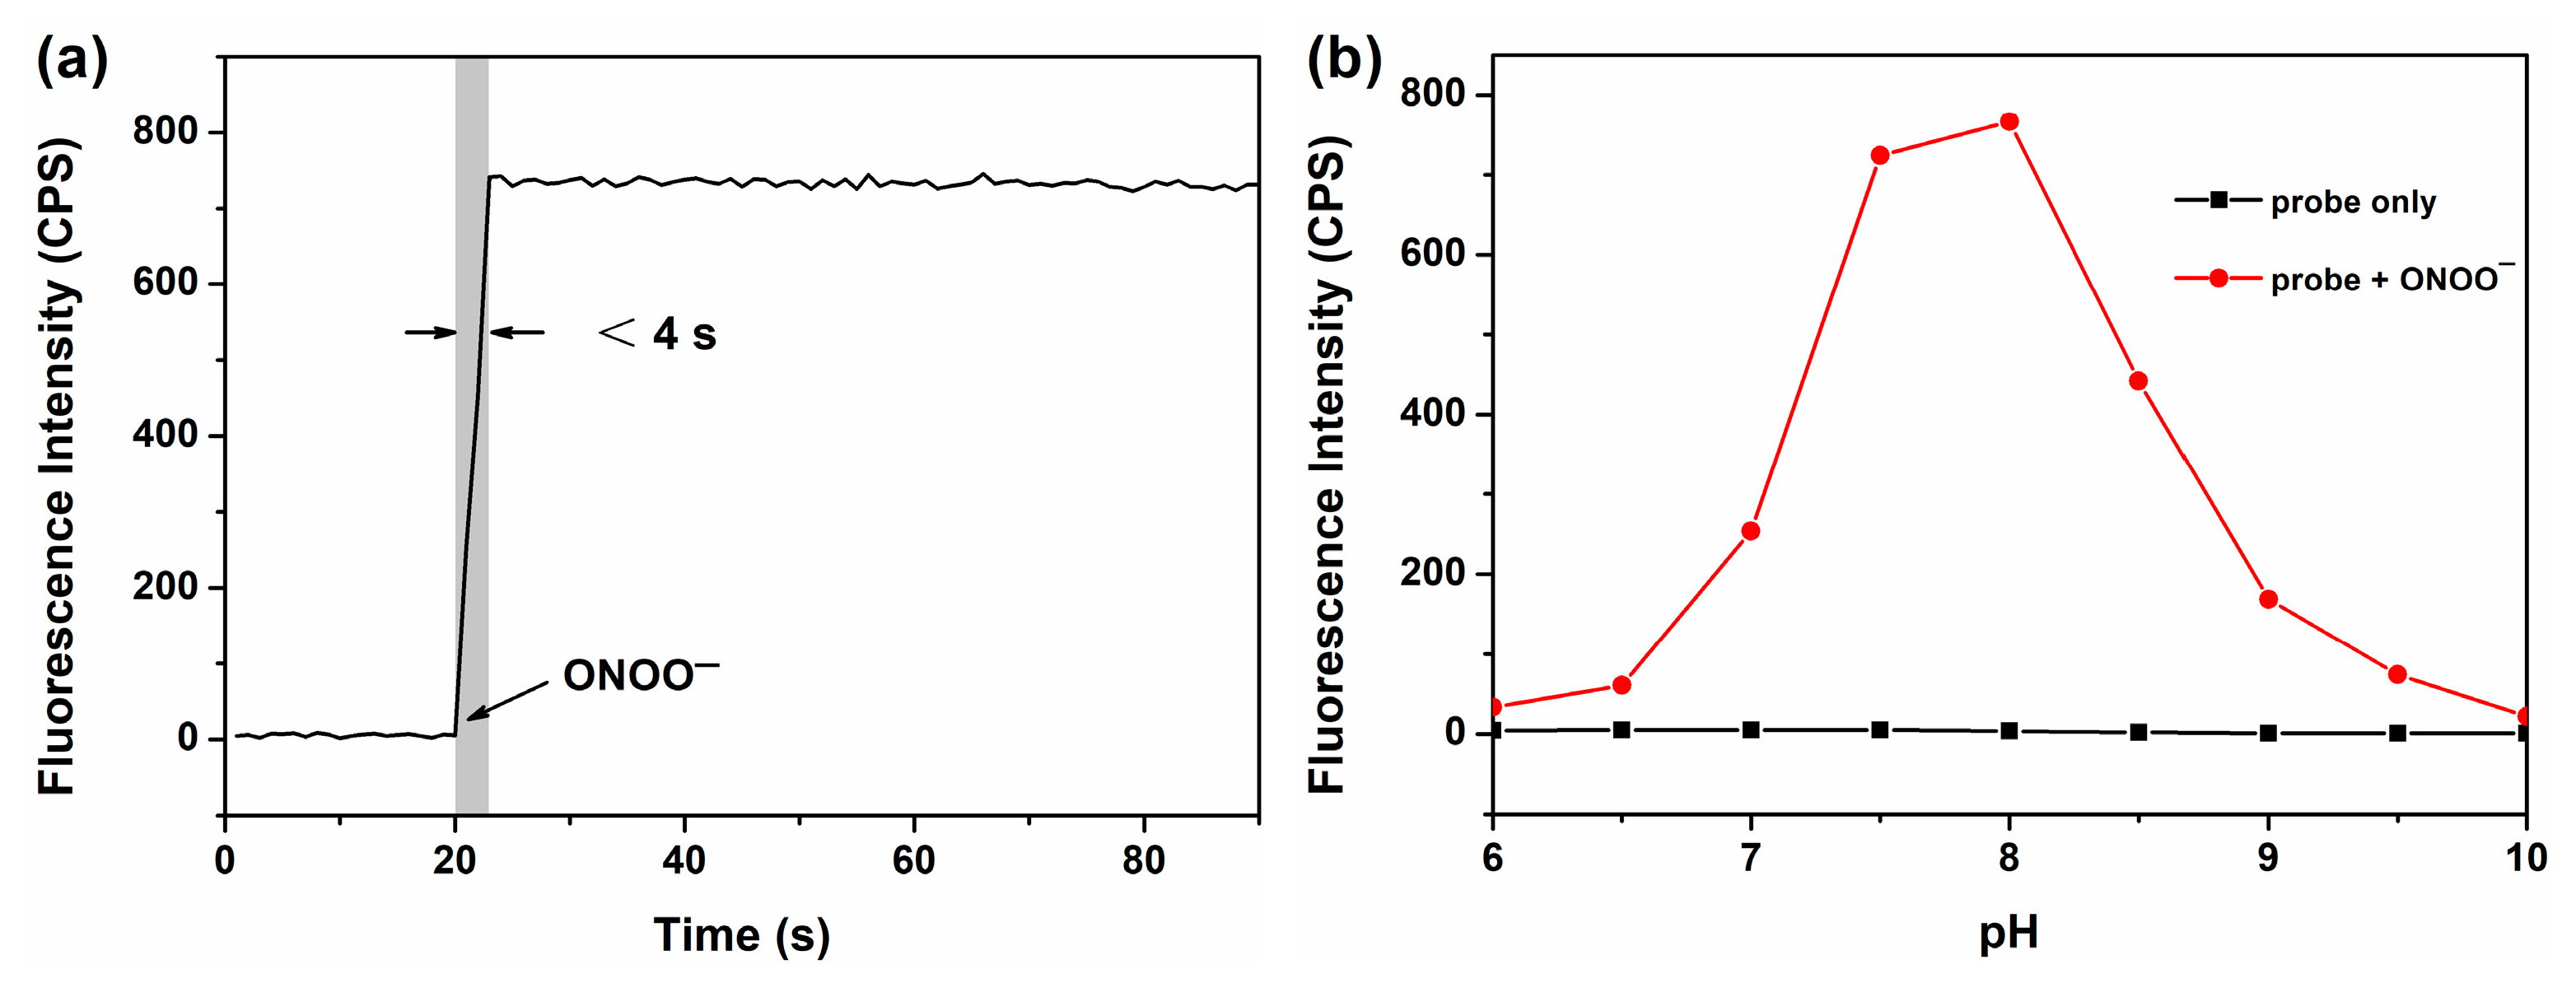
3.2. Spectral Responses of BP-ONOO for ONOO−
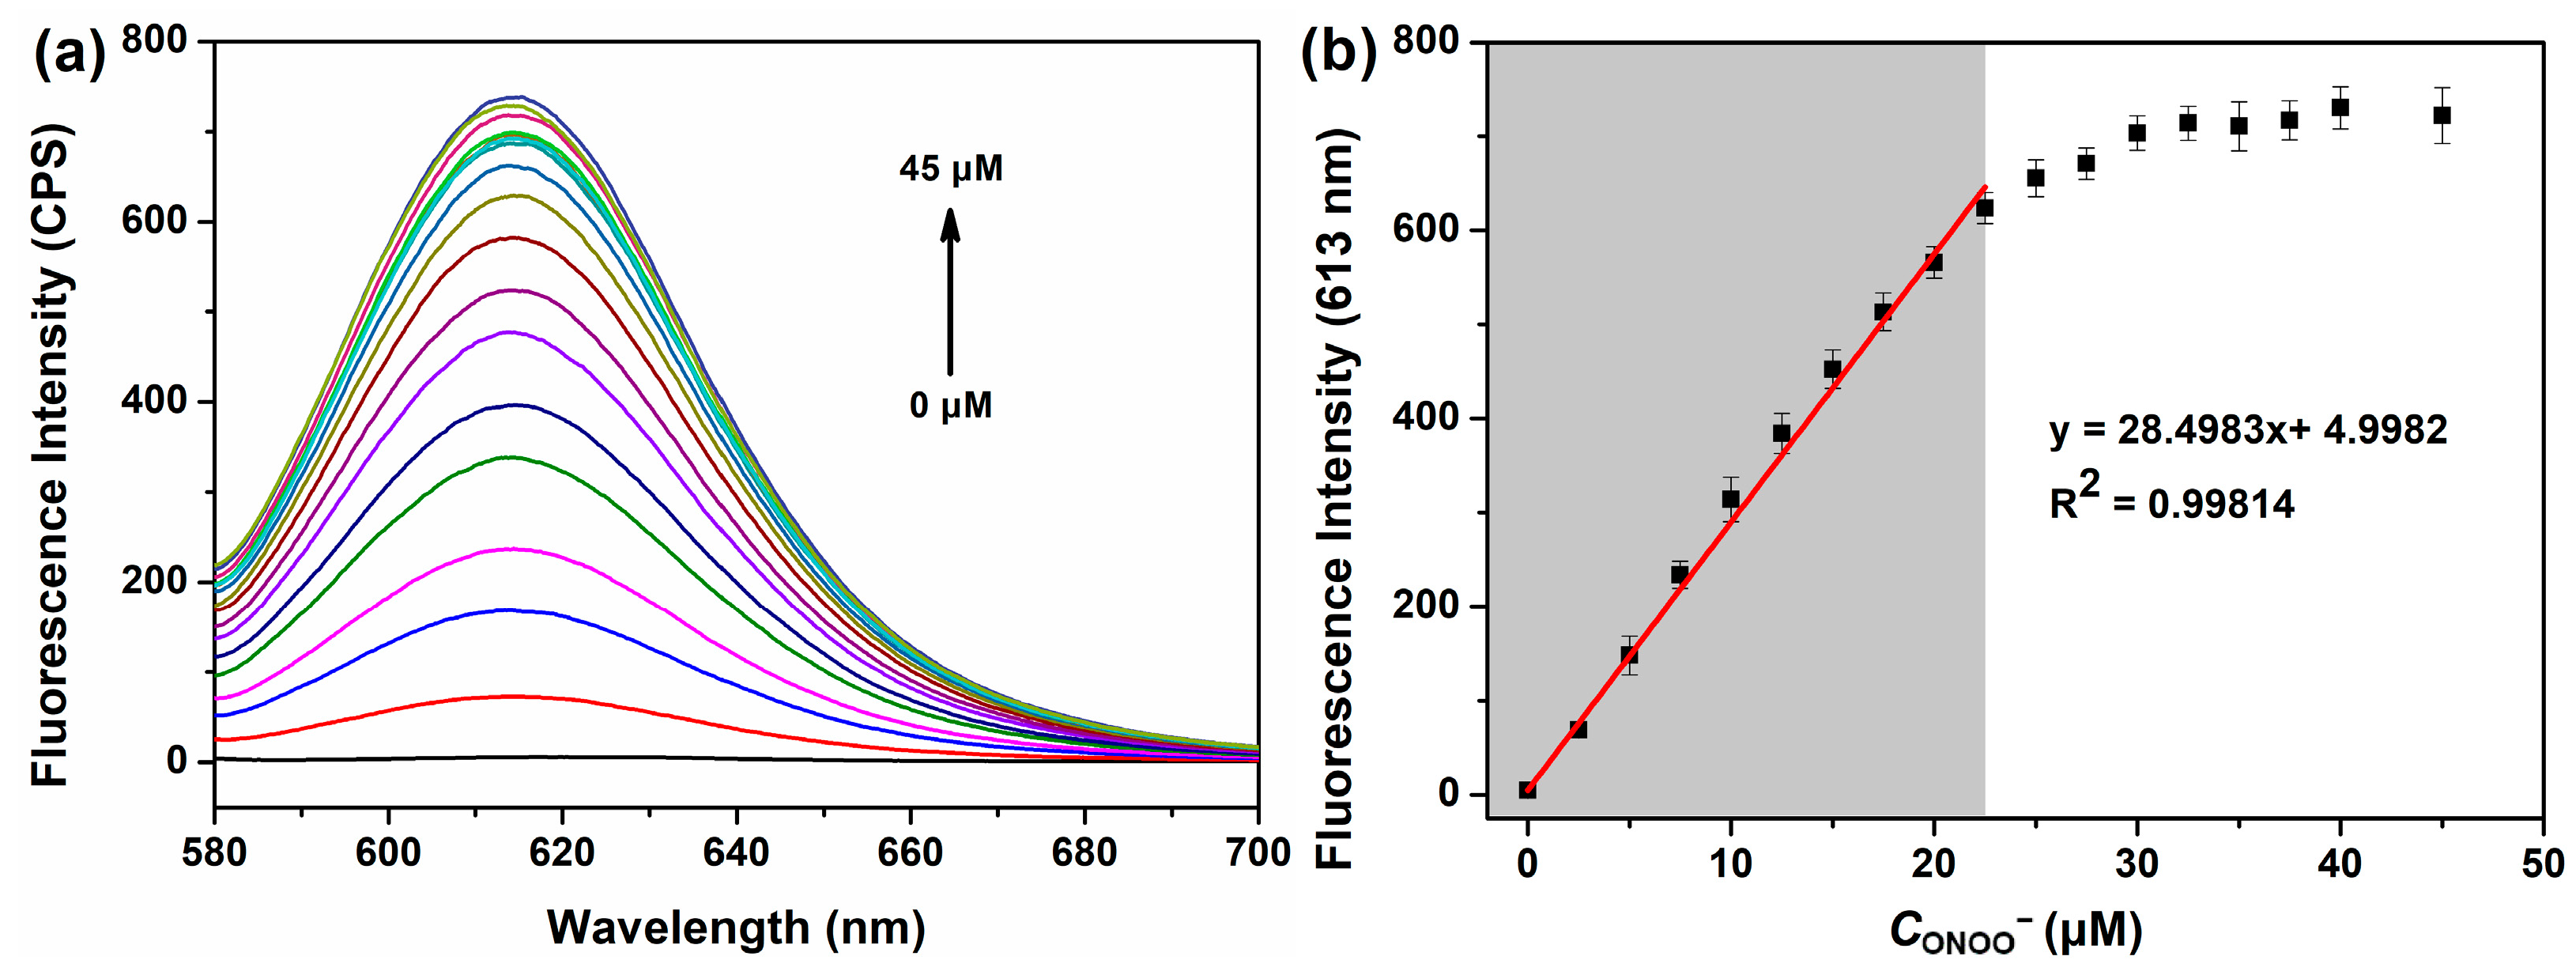
3.3. Quantitative Analysis of ONOO− Using BP-ONOO
3.4. Selectivity of BP-ONOO
3.5. Cytotoxicity and Cell Imaging of BP-ONOO
4. Conclusions
Supplementary Materials
Author Contributions
Funding
Institutional Review Board Statement
Informed Consent Statement
Data Availability Statement
Conflicts of Interest
References
- Goldstein, S.; Lind, J.; Merényi, G. Chemistry of Peroxynitrites as Compared to Peroxynitrates. Chem. Rev. 2005, 105, 2457–2470. [Google Scholar] [CrossRef] [PubMed]
- Pryor, W.A.; Squadrito, G.L. The chemistry of peroxynitrite: A product from the reaction of nitric oxide with superoxide. Am. J. Physiol.-Lung Cell. Mol. Physiol. 1995, 268, L699–L722. [Google Scholar] [CrossRef] [PubMed]
- Waris, G.; Ahsan, H. Reactive oxygen species: Role in the development of cancer and various chronic conditions. J. Carcinog. 2006, 5, 14. [Google Scholar] [CrossRef] [PubMed]
- Ahmad, R.; Rasheed, Z.; Ahsan, H. Biochemical and cellular toxicology of peroxynitrite: Implications in cell death and autoimmune phenomenon. Immunopharmacol. Immunotoxicol. 2009, 31, 388–396. [Google Scholar] [CrossRef] [PubMed]
- Szabo, C.; Ischiropoulos, H.; Radi, R. Peroxynitrite: Biochemistry, pathophysiology and development of therapeutics. Nat. Rev. Drug Discov. 2007, 6, 662–680. [Google Scholar] [CrossRef]
- Ferrer-Sueta, G.; Campolo, N.; Trujillo, M.; Bartesaghi, S.; Carballal, S.; Romero, N.; Alvarez, B.; Radi, R. Biochemistry of Peroxynitrite and Protein Tyrosine Nitration. Chem. Rev. 2018, 118, 1338–1408. [Google Scholar] [CrossRef]
- Finkel, T.; Serrano, M.; Blasco, M.A. The common biology of cancer and ageing. Nature 2007, 448, 767–774. [Google Scholar] [CrossRef]
- Pacher, P.; Beckman, J.S.; Liaudet, L. Nitric oxide and peroxynitrite in health and disease. Physiol. Rev. 2007, 87, 315–424. [Google Scholar] [CrossRef]
- Graham, P.M.; Li, J.Z.; Dou, X.; Zhu, H.; Misra, H.P.; Jia, Z.; Li, Y. Protection against peroxynitrite-induced DNA damage by mesalamine: Implications for anti-inflammation and anti-cancer activity. Mol. Cell. Biochem. 2013, 378, 291–298. [Google Scholar] [CrossRef]
- Papaharalambus, C.A.; Griendling, K.K. Basic mechanisms of oxidative stress and reactive oxygen species in cardiovascular injury. Trends Cardiovasc. Med. 2007, 17, 48–54. [Google Scholar] [CrossRef]
- Radi, R. Peroxynitrite, a stealthy biological oxidant. J. Biol. Chem. 2013, 288, 26464–26472. [Google Scholar] [CrossRef] [PubMed]
- Wang, S.; Chen, L.; Jangili, P.; Sharma, A.; Li, W.; Hou, J.-T.; Qin, C.; Yoon, J.; Kim, J.S. Design and applications of fluorescent detectors for peroxynitrite. Coord. Chem. Rev. 2018, 374, 36–54. [Google Scholar] [CrossRef]
- Sun, J.; Cao, X.; Lu, W.; Wei, Y.; Kong, L.; Chen, W.; Shao, X.; Wang, Y. Recent advances in fluorescent probes of peroxynitrite: Structural, strategies and biological applications. Theranostics 2023, 13, 1716–1744. [Google Scholar] [CrossRef]
- Li, M.; Han, H.; Zhang, H.; Song, S.; Shuang, S.; Dong, C. Boronate based sensitive fluorescent probe for the detection of endogenous peroxynitrite in living cells. Spectrochim. Acta A Mol. Biomol. Spectrosc. 2020, 243, 118683. [Google Scholar] [CrossRef]
- Xie, X.; Tang, F.; Liu, G.; Li, Y.; Su, X.; Jiao, X.; Wang, X.; Tang, B. Mitochondrial Peroxynitrite Mediation of Anthracycline-Induced Cardiotoxicity as Visualized by a Two-Photon Near-Infrared Fluorescent Probe. Anal. Chem. 2018, 90, 11629–11635. [Google Scholar] [CrossRef] [PubMed]
- Wu, D.; Ryu, J.C.; Chung, Y.W.; Lee, D.; Ryu, J.H.; Yoon, J.H.; Yoon, J. A Far-Red-Emitting Fluorescence Probe for Sensitive and Selective Detection of Peroxynitrite in Live Cells and Tissues. Anal. Chem. 2017, 89, 10924–10931. [Google Scholar] [CrossRef]
- Wu, Y.; Shi, A.; Li, Y.; Zeng, H.; Chen, X.; Wu, J.; Fan, X. A near-infrared xanthene fluorescence probe for monitoring peroxynitrite in living cells and mouse inflammation model. Analyst 2018, 143, 5512–5519. [Google Scholar] [CrossRef]
- Jia, X.; Chen, Q.; Yang, Y.; Tang, Y.; Wang, R.; Xu, Y.; Zhu, W.; Qian, X. FRET-Based Mito-Specific Fluorescent Probe for Ratiometric Detection and Imaging of Endogenous Peroxynitrite: Dyad of Cy3 and Cy5. J. Am. Chem. Soc. 2016, 138, 10778–10781. [Google Scholar] [CrossRef]
- Zhang, J.; Zhen, X.; Zeng, J.; Pu, K. A Dual-Modal Molecular Probe for Near-Infrared Fluorescence and Photoacoustic Imaging of Peroxynitrite. Anal. Chem. 2018, 90, 9301–9307. [Google Scholar] [CrossRef]
- Yu, F.; Li, P.; Li, G.; Zhao, G.; Chu, T.; Han, K. A near-IR reversible fluorescent probe modulated by selenium for monitoring peroxynitrite and imaging in living cells. J. Am. Chem. Soc. 2011, 133, 11030–11033. [Google Scholar] [CrossRef]
- Li, X.; Tao, R.R.; Hong, L.J.; Cheng, J.; Jiang, Q.; Lu, Y.M.; Liao, M.H.; Ye, W.F.; Lu, N.N.; Han, F.; et al. Visualizing peroxynitrite fluxes in endothelial cells reveals the dynamic progression of brain vascular injury. J. Am. Chem. Soc. 2015, 137, 12296–12303. [Google Scholar] [CrossRef]
- Peng, T.; Chen, X.; Gao, L.; Zhang, T.; Wang, W.; Shen, J.; Yang, D. A rationally designed rhodamine-based fluorescent probe for molecular imaging of peroxynitrite in live cells and tissues. Chem. Sci. 2016, 7, 5407–5413. [Google Scholar] [CrossRef] [PubMed]
- Sikora, A.; Zielonka, J.; Lopez, M.; Joseph, J.; Kalyanaraman, B. Direct oxidation of boronates by peroxynitrite: Mechanism and implications in fluorescence imaging of peroxynitrite. Free Radic. Biol. Med. 2009, 47, 1401–1407. [Google Scholar] [CrossRef] [PubMed]
- Miao, J.; Huo, Y.; Liu, Q.; Li, Z.; Shi, H.; Shi, Y.; Guo, W. A new class of fast-response and highly selective fluorescent probes for visualizing peroxynitrite in live cells, subcellular organelles, and kidney tissue of diabetic rats. Biomaterials 2016, 107, 33–43. [Google Scholar] [CrossRef] [PubMed]
- Cheng, D.; Peng, J.; Lv, Y.; Su, D.; Liu, D.; Chen, M.; Yuan, L.; Zhang, X. De Novo Design of Chemical Stability Near-Infrared Molecular Probes for High-Fidelity Hepatotoxicity Evaluation In Vivo. J. Am. Chem. Soc. 2019, 141, 6352–6361. [Google Scholar] [CrossRef]
- Liu, D.; Feng, S.; Feng, G. A rapid responsive colorimetric and near-infrared fluorescent turn-on probe for imaging exogenous and endogenous peroxynitrite in living cells. Sens. Actuators B Chem. 2018, 269, 15–21. [Google Scholar] [CrossRef]
- Zhu, B.; Zhang, M.; Wu, L.; Zhao, Z.; Liu, C.; Wang, Z.; Duan, Q.; Wang, Y.; Jia, P. A highly specific far-red fluorescent probe for imaging endogenous peroxynitrite in the mitochondria of living cells. Sens. Actuators B Chem. 2018, 257, 436–441. [Google Scholar] [CrossRef]
- Zhang, R.; Zhao, J.; Han, G.; Liu, Z.; Liu, C.; Zhang, C.; Liu, B.; Jiang, C.; Liu, R.; Zhao, T.; et al. Real-Time Discrimination and Versatile Profiling of Spontaneous Reactive Oxygen Species in Living Organisms with a Single Fluorescent Probe. J. Am. Chem. Soc. 2016, 138, 3769–3778. [Google Scholar] [CrossRef]
- Peng, R.; Yuan, J.; Cheng, D.; Ren, T.; Jin, F.; Yang, R.; Yuan, L.; Zhang, X. Evolving a Unique Red-Emitting Fluorophore with an Optically Tunable Hydroxy Group for Imaging Nitroreductase in Cells, in Tissues, and in Vivo. Anal. Chem. 2019, 91, 15974–15981. [Google Scholar] [CrossRef]
- Xiong, X.; Song, F.; Chen, G.; Sun, W.; Wang, J.; Gao, P.; Zhang, Y.; Qiao, B.; Li, W.; Sun, S.; et al. Construction of long-wavelength fluorescein analogues and their application as fluorescent probes. Chemistry 2013, 19, 6538–6545. [Google Scholar] [CrossRef]
- Kim, H.N.; Lee, M.H.; Kim, H.J.; Kim, J.S.; Yoon, J. A new trend in rhodamine-based chemosensors: Application of spirolactam ring-opening to sensing ions. Chem. Soc. Rev. 2008, 37, 1465–1472. [Google Scholar] [CrossRef] [PubMed]
- Jacobs, A.T.; Ignarro, L.J. Lipopolysaccharide-induced Expression of Interferon-β Mediates the Timing of Inducible Nitric-oxide Synthase Induction in RAW 264.7 Macrophages*. J. Biol. Chem. 2001, 276, 47950–47957. [Google Scholar] [CrossRef] [PubMed]
- Salonen, T.; Sareila, O.; Jalonen, U.; Kankaanranta, H.; Tuominen, R.; Moilanen, E. Inhibition of classical PKC isoenzymes downregulates STAT1 activation and iNOS expression in LPS-treated murine J774 macrophages. Br. J. Pharmacol. 2006, 147, 790–799. [Google Scholar] [CrossRef] [PubMed]
- Uppu, R.M. Synthesis of peroxynitrite using isoamyl nitrite and hydrogen peroxide in a homogeneous solvent system. Anal. Biochem. 2006, 354, 165–168. [Google Scholar] [CrossRef]
- Han, X.; Yang, X.; Zhang, Y.; Li, Z.; Cao, W.; Zhang, D.; Ye, Y. A novel activatable AIEgen fluorescent probe for peroxynitrite detection and its application in EC1 cells. Sens. Actuators B Chem. 2020, 321, 128510–128516. [Google Scholar] [CrossRef]
- Zhang, J.; Li, Y.; Zhao, J.; Guo, W. An arylboronate-based fluorescent probe for selective and sensitive detection of peroxynitrite and its applications for fluorescence imaging in living cells. Sens. Actuators B Chem. 2016, 237, 67–74. [Google Scholar] [CrossRef]
- Cheng, D.; Xu, W.; Yuan, L.; Zhang, X. Investigation of Drug-Induced Hepatotoxicity and Its Remediation Pathway with Reaction-Based Fluorescent Probes. Anal. Chem. 2017, 89, 7693–7700. [Google Scholar] [CrossRef]
- Yang, R.; Dou, Y.; Zhang, Y.; Qu, L.; Sun, Y.; Li, Z. A facile and highly efficient fluorescent turn-on switch strategy based on diketone isomerization and its application in peroxynitrite fluorescent imaging. Sens. Actuators B Chem. 2021, 337, 129805–129813. [Google Scholar] [CrossRef]
- Yu, F.; Li, P.; Wang, B.; Han, K. Reversible near-infrared fluorescent probe introducing tellurium to mimetic glutathione peroxidase for monitoring the redox cycles between peroxynitrite and glutathione in vivo. J Am Chem Soc 2013, 135, 7674–7680. [Google Scholar] [CrossRef]
- Peng, T.; Wong, N.K.; Chen, X.; Chan, Y.K.; Sun, Z.; Hu, J.J.; Shen, J.; El-Nezami, H.; Yang, D. Molecular imaging of peroxynitrite with HKGreen-4 in live cells and tissues. J. Am. Chem. Soc. 2014, 136, 11728–11734. [Google Scholar] [CrossRef]
- Li, H.; Li, X.; Wu, X.; Shi, W.; Ma, H. Observation of the Generation of ONOO– in Mitochondria under Various Stimuli with a Sensitive Fluorescence Probe. Anal. Chem. 2017, 89, 5519–5525. [Google Scholar] [CrossRef] [PubMed]
- Li, J.; Peng, S.; Li, Z.; Zhao, F.; Han, X.; Liu, J.; Cao, W.; Ye, Y. Visualization of peroxynitrite in cyclophosphamide-induced oxidative stress by an activatable probe. Talanta 2022, 238, 123007–123013. [Google Scholar] [CrossRef] [PubMed]


Disclaimer/Publisher’s Note: The statements, opinions and data contained in all publications are solely those of the individual author(s) and contributor(s) and not of MDPI and/or the editor(s). MDPI and/or the editor(s) disclaim responsibility for any injury to people or property resulting from any ideas, methods, instructions or products referred to in the content. |
© 2023 by the authors. Licensee MDPI, Basel, Switzerland. This article is an open access article distributed under the terms and conditions of the Creative Commons Attribution (CC BY) license (https://creativecommons.org/licenses/by/4.0/).
Share and Cite
Jin, B.; Liu, J.; Jin, L.; Liu, W.; Liu, X. A Red-Emitting Fluorescence Probe for Rapid Detecting Exogenous and Endogenous Peroxynitrite in Living Cells with High Sensitivity and Selectivity. Chemosensors 2023, 11, 555. https://doi.org/10.3390/chemosensors11110555
Jin B, Liu J, Jin L, Liu W, Liu X. A Red-Emitting Fluorescence Probe for Rapid Detecting Exogenous and Endogenous Peroxynitrite in Living Cells with High Sensitivity and Selectivity. Chemosensors. 2023; 11(11):555. https://doi.org/10.3390/chemosensors11110555
Chicago/Turabian StyleJin, Bing, Jing Liu, Longsheng Jin, Weishuai Liu, and Xiangjun Liu. 2023. "A Red-Emitting Fluorescence Probe for Rapid Detecting Exogenous and Endogenous Peroxynitrite in Living Cells with High Sensitivity and Selectivity" Chemosensors 11, no. 11: 555. https://doi.org/10.3390/chemosensors11110555
APA StyleJin, B., Liu, J., Jin, L., Liu, W., & Liu, X. (2023). A Red-Emitting Fluorescence Probe for Rapid Detecting Exogenous and Endogenous Peroxynitrite in Living Cells with High Sensitivity and Selectivity. Chemosensors, 11(11), 555. https://doi.org/10.3390/chemosensors11110555