1. Introduction
Starch is one of the major natural polysaccharides and is widely used in many areas of industry [
1,
2,
3,
4,
5,
6]. Annually, approximately 60 million tons of starch are extracted worldwide from various cereal, tuber, and root crops. It finds widespread use across industries, with 60 percent utilized in the food sector (including baked goods, sauces, soups, and confectionery) and the remaining 40 percent in pharmaceuticals and non-edible products like fertilizers, paper, cardboard, and packaging [
7].
The botanical origin of the starch used as a raw material is a pivotal determinant of the processing and overall quality of the final product [
7,
8,
9,
10], confirming the need for a rapid, inexpensive, and reliable method for its determination [
10,
11,
12].
Chemically, starch consists of two glucose polymers, amylose and amylopectin, both of which differ in structure and size. Amylose is a predominantly linear polymer with α- (1,4) glycosidic bonds and has a relatively small structure (up to 106 Da). On the other hand, amylopectin is a highly branched polymer formed by linear chains with different degrees of polymerization and has a much higher degree of α-(1,6) glycosidic bonds [
10,
12,
13]. The botanical origin determines the ratio and association of amylose and amylopectin as well as their morphological structure as granules with variable size (1–100 µm) and shape. Amylose and amylopectin molecules exhibit distinct structures, which are influenced by the botanical source of the starch. Factors such as the molecular size, inner chain length, and presence of side chains contribute to these characteristic differences. For instance, amylose derived from wheat is composed of a limited quantity of expansive, branched molecules. In contrast, sweet potato amylose consists of a small number of relatively large, unbranched molecules [
7,
8,
11].
There are several methodologies in the literature for starch analysis and its quantification [
10,
11,
12,
13,
14,
15,
16]. Most studies involve pretreatment of the sample by gelatinizing starch at elevated temperatures in the presence of a thermostable α-amylase enzyme to produce a series of linear and branched dextrins, which are subsequently hydrolyzed into glucose. In addition, there are two alternatives to the enzymatic conversion of starch to glucose: (i) the dissolution of starch with hydrochloric acid and (ii) the dissolution of starch with a boiling solution of calcium chloride.
The analytical methodologies commonly employed for ascertaining the botanical origin of starch typically encompass indirect techniques, including optical and electron microscopy, as well as analytical methods reliant on (i) enzymatic reactions, (ii) chromatography, (iii) X-ray diffraction, and various spectroscopic techniques [
10,
11,
12,
13,
14,
15,
16,
17,
18]. Nonetheless, these approaches are time-consuming and necessitate specific pretreatments of the sample, such as starch extraction and subsequent analysis.
In this context, UV-Vis spectroscopy can also be used due to the ability of amylose and amylopectin to form blue-colored helical inclusion complexes with the triiodide ion. Consequently, UV-Vis spectroscopy leverages the unique absorption spectrum of amylose and amylopectin–triiodide complexes, acting as a sample fingerprint [
11].
Among the fast and non-invasive analytical techniques, near-infrared (NIR) spectroscopy can be particularly suitable for determining the chemical composition of components in a variety of complex organic samples [
18,
19,
20,
21]. Recent advancements in instrumentation, miniaturization, wireless communication systems, and sophisticated algorithms dedicated to statistical data processing have facilitated the development of numerous applications in various research fields, enabling an at-line, on-line, and in-line non-destructive analysis of a wide array of food products.
NIR spectra can exhibit several bands, including those attributed to the O-H stretch first overtone, which is characterized by absorbance peaks at 1450 nm and 1540 nm, respectively [
19,
21]. Owing to the presence of these distinctive bands, NIR spectroscopy has been successfully employed as a rapid and non-destructive technique for quantifying the starch content in various types of flours [
19].
The aim of the present study was to assess the feasibility of NIR and UV-Vis spectroscopy in combination with chemometrics for distinguishing different botanical origins of starch. These methods proved to be particularly suitable for implementation in laboratories equipped with basic UV-Vis or NIR spectrophotometers. Additionally, the NIR-based method can be directly applied in situ by portable NIR devices, such as the one used in this study. Utilizing a portable NIR instrument at flour delivery would enable the analysis of all batches entering production in a more representative and efficient manner.
Among the flours chosen, corn starch accounts for 80% of the worldwide market [
1]. Barley, corn, potato and rice flour are considered conventional sources of starch. On the other hand, amaranth, buckwheat, chestnut, chickpea and millet are considered non-conventional and emerging sources of starch. In particular, chestnut starch presents a pasting profile similar to corn one, making it a potential alternative to corn starch [
1].
In pursuit of the objectives of this research, an untargeted approach was adopted, utilizing the entire acquired signals from the different used analytical techniques, namely spectroscopic techniques, as a fingerprint of the investigated samples. The advantage of this approach lies in its ability to provide a broad spectrum of information for data processing and mining without a predefined set of compounds. The obtained spectroscopic signals served as a comprehensive fingerprint of the investigated samples and coupled with chemometrics analysis could allow the identification of patterns among the investigated flours based on their starch origin. For UV-Vis spectroscopy, the complete recorded spectrum (190 to 800 nm) was considered, encompassing not only the signals associated with the triiodide–starch complex (bands between 400 and 800 nm). In the case of NIR, no pre-treatment was applied, resulting in a spectrum influenced not solely by starch but also by water, lipids, and proteins.
An exploratory analysis was performed on all the obtained signals using principal component analysis (PCA) [
22]. PCA was employed to process all acquired signals and provide insights into the presence of similarities and differences among the examined samples. Furthermore, UV-Vis and a selected region of NIR spectra were separately used as a unique fingerprint and elaborated by cluster analysis [
23] in order to verify if it is possible to distinguish starches of different botanical origin.
Additionally, a subset of flour samples, identified as similar by chemometric analysis, underwent surface analysis through scanning electron microscopy (SEM) using the Nova NanoSEM 450 microscope to identify potential distinctive morphological features. This choice was made to support the proposed methods when the objective is to be more selective in the identification of similar starches with different botanical origin.
The physical and chemical properties of starch have been discussed in detail in the literature [
13], but as far as the botanical origin of starch is concerned, only a few studies are present where were explored the use of spectrophotometric techniques, specifically UV-Vis. The present approach allows for a more thorough and complete characterization of flours, marking the first case where both UV-Vis and NIR spectroscopy have been employed on a diverse and large range of flour types. The incorporation of chemometric techniques improves the interpretability and depth of the analysis, allowing a thorough understanding of spectral information and its implications for flour characterization. Furthermore, the study integrates the developed models with data related to the morphology of certain flours, acquiring SEM images on raw flours that exhibited similarities in the chemometric analysis. This multidimensional integration of spectroscopic data and morphological information offers a more holistic and comprehensive perspective on flour characterization.
The ability to determine the botanical origin of starch is crucial for the food industry, especially in the quality verification of raw materials for baked goods. It ensures ingredient traceability and aids in preventing food adulteration and fraud.
2. Materials and Methods
2.1. Samples and Reagents
Eighteen flours samples, type 00 flour, rye, barley, soybean, chestnut, potato, spelt, buckwheat, oat, millet, rice, durum wheat, amaranth, chickpea, sesame, corn, hemp and sunflower flours, were purchased from the market and were stored inside sealed polyethylene containers to preserve them from possible contamination.
Potassium triiodide solution was prepared using iodine and potassium iodide, which were both purchased from Sigma–Aldrich, Merck, Darmstadt, Germany.
2.2. Starch Sample Preparation for UV Analysis
In order to acquire the starch fingerprint spectrum by the UV-Vis technique, a preliminary treatment of the flour sample was necessary to extract the starch. Based on the literature [
11], the following analytical procedure was developed and subsequently applied to all the investigated samples. A sample aliquot of 1.25 g of flour was dispersed in 50 mL of deionized water and heated to boiling for 15 min. Then, 10 mL of supernatant was taken with a sterilized syringe and transferred inside a 25 mL volumetric flask. Afterwards, 2 mL of a potassium triiodide solution 0.03 M was added under stirring, and the volumetric flask was filled to the mark with deionized water.
The blank sample, used as a reference for spectroscopic measurements, was obtained by diluting 2 mL of potassium triiodide solution inside a 25 mL volumetric flask with deionized water.
For each starch type, three independent solutions were prepared obtaining three UV-Vis spectra for each sample. Chickpea flour was selected as a control sample to monitor the reproducibility of the analytical method and was analyzed five times. The decision to include a control sample was driven by the intention to closely monitor the performance of the portable NIR device over the different experimental sessions. It is of utmost of importance to select a control sample that shares similar characteristics with the diverse range of samples under investigation and possesses the ability to maintain consistent chemical and physical properties over time. This ensures that any observed differences among control samples can be attributed solely to variations in measurements and not to inherent sample instability. In this case, the choice of any sample as a control would have been suitable given that all the samples in the present study exhibited stable chemical and physical properties. Therefore, the selection of chickpea flour as the control was influenced by the practical consideration of sample availability, since its quantity at our disposal exceeded that of other potential control samples.
2.3. Spectrophotometric Measurements
UV-Vis spectra were recorded with a JASCO V-750 UV/Vis/NIR spectrophotometer (JASCO, Tokyo, Japan) at 298 K in a 225–800 nm spectral range employing quartz cells (1 cm optical path) with a resolution of 1 nm.
2.4. Near-Infrared (NIR) Spectroscopy
Approximately 100 mg of flour was inserted into a sample holder (plastic vessel) with almost the same thickness (less than 4 mm) to avoid any scattering in the acquisition. Next, three NIR spectra were acquired for each vessel by placing the instrument at three different points: at the top, middle and bottom of the vessel.
While powder samples are generally assumed to be homogeneous, the decision to conduct measurements at multiple points within the vessel stems from the common practice of acquiring replicate measurements. This approach is employed not only to enhance the representativeness of the measurements but also to address specific challenges associated with the use of portable or miniaturized NIR instruments [
24]. In the context of our research, a portable NIR instrument has also been utilized, as it offers the advantage of developing an analytical method that can be directly applied in situ. This is particularly valuable, for example, in a commercial setting where monitoring different batches of flour deliveries is essential. It is well documented in the literature that while miniaturized instruments yield satisfactory results, they may exhibit lower performance compared to benchtop instruments [
24]. Factors such as lower representative transmission spectra and spectral resolution contribute to these differences [
24]. Furthermore, when dealing with powder samples, a container is often necessary for measurements. It is crucial to ensure that the chosen container does not introduce any artifacts or affect the sample spectra. Given these considerations and the use of plastic vessels in conjunction with a portable NIR instrument in our study, acquiring replicates at different points within the samples inside the holder was deemed necessary to ensure the representativeness of the sampling.
In order to investigate the reproducibility of the analytical method and check for any systematic errors, a sample of flour (chickpea flour) was selected as a control sample, and it was analyzed three times per measurement session (at the beginning, at the middle and at the end of the session) following the procedure previously described, obtaining 27 replicates.
The NIR spectra were collected using a portable NIR spectrometer, poliSPEC NIRe (ITPhotonics S.r.l., Fara Vicentino, Italy). Due to its diffraction grating and the double chip InGaAs 512 pixels sensor with a controlled cooling system, poliSPEC NIRe covers the spectral range of 930–1700 nm with an average numerical resolution of 3.2 nm and an average optical resolution HWHM of 3.25 nm.
2.5. Scanning Electron Microscopy
Small amounts of sample were sufficient to acquire images, which were attached to a circular holder (stub) using double-sided adhesive tape. Prior to SEM investigation, a metallization process was carried out, during which the sample surface was coated with a thin layer of gold (20 nm/min for 45 s) to improve the electrical conductivity of the sample and to preserve the sample morphology. Observation of the samples was performed using the Nova NanoSEM 450 (Fei Company-Bruker corporation) scanning electron microscope. The scanning electron microscope was operated at an accelerating voltage (high voltage, HV) of 20 kV, and images were obtained using the directional backscatter detector.
2.6. Data Analysis
UV-Vis and NIR spectral data were imported and processed under MATLAB 2020a (The MathWorks, Inc., Natick, MA, USA) environment. Signal preprocessing, PCA and cluster analysis were performed by PLS-Toolbox v. 8.9 (Eigenvector Inc., Manson, WA, USA).
The assignment of NIR flour signals involved a comparative analysis with existing literature [
19,
20,
25]. Prior to the development of chemometric models, UV-Vis spectra underwent mean centering, while NIR spectral data were pre-processed using a standard normal variate (SNV) [
26] to mitigate the baseline shift, noise, and the impact of light scatter. Initially, principal component analysis (PCA) [
22] was conducted on the pre-processed spectra to explore the data and identify potential similarities and differences among flour samples.
Subsequently, cluster analysis [
23] was employed to attempt the identification of groups without relying on pre-established class memberships. Most cluster analysis methods assume that samples close together in the measurement space are similar and likely belong to the same class. Various ways exist to define the distance between samples with the Euclidean distance being the most common. It is calculated as the square root of the sum of squared differences between the samples. In this paper, considering the multivariate nature of the data, the Euclidean distance was computed by taking into account the scores on all the principal components (PCs) of the model. Specifically, the distance (
dij) between samples
xi and
xj with scores
ti and
tj was defined as follows:
The use of PCA scores can provide collinearity and noise-reduction benefits, but it requires the specification of the appropriate number of principal components (PCs). In this paper, two and three principal components were used for the UV-Vis (explained variance, R2, equal to 97%) and NIR (R2: 94%) spectra cluster analysis, respectively.
Furthermore, the nearest neighbor method was used to define a cluster [
23]. Specifically, the distance between any two clusters was defined as the minimum of all pair-wise distances between object of each cluster; the two clusters with the minimum distance were then merged.
3. Results
3.1. Spectrophotometric Characterization of Starch–Triiodide Complex
Eighteen distinct flour samples were characterized through the measurement of absorption spectra of their starch–triiodide complex, and the obtained spectra are reported in
Figure 1. These spectra show several bands within the investigated UV-Vis region.
In the UV region, three bands are observed at about 240 nm, 270 nm (broad shoulder) and 320 nm. Amylose and amylopectin do not show any signal in this spectral region; therefore, the signals observed are due to impurities or degradation products. In particular, the observed bands could be attributed, at least partly, to the presence in the flour of proteins or hydrolyzed amino acids which give well-defined signals in the spectral regions 220–240 nm (backbone) and 260–280 nm (aromatic amino acid residues). Phenolic compounds and ferulic acid were observed, respectively, at 280 nm and 320 nm in flour extracts [
1] and might also be present in our samples. Specifically, the first peak at around 240 nm exhibits lower intensities in the corn and potato flours, while the second peak at approximately 320 nm is nearly absent in the amaranth flour.
Two additional peaks are observable in the range between 400 and 800 nm; they are evident for almost all flour samples except for amaranth, chestnut, sunflower, sesame, hemp and buckwheat flours. In particular, the first peak could be considered a shoulder peak of the second one with lower intensities between 400 and 500 nm. These two bands could be attributed to the absorption of amylopectin–iodide and amylose–iodide complexes [
2,
3]. The differences in their intensity may be due to the preliminary sample treatment, where starch is extracted in water, and amylose is indeed more soluble compared to amylopectin as well as to the botanical origin of the starch, which influences the ratio of amylose to amylopectin and their specific affinities for triiodide ion binding [
3,
4]. Upon visually inspecting the UV-Vis spectra obtained for various types of starch, differences are evident not only in the intensity of the bands but also in the wavelength values corresponding to the maximum absorbance of the amylose–iodide complex. Specifically, for 00 flour, the maximum peak occurs at 605 nm; for rye flour, it is at 595 nm; for rice flour, it is at 577 nm; for spelt flour, it is at 598 nm; for corn flour, it is at 609 nm; for potato flour, it is at 624 nm; for oat flour, it is at 599 nm; for millet flour, it is at 566 nm; for durum wheat flour, it is at 614 nm; and for barley flour, it is at 600 nm. As regards the intensity of the bands, potato, spelt and durum wheat samples show the highest absorbance, while amaranth, sunflower, chickpea and buckwheat have the lowest ones. These observed variations could be attributed to several factors, such as inherent starch concentration, matrix effects from proteins and lipids, and variations in amylose/amylopectin ratios. In particular, the higher absorbance in potato, for instance, may be linked to its substantial starch content. Potato flour is essentially composed of starch, and a higher starch concentration can result in increased absorbance in the spectral measurements. The presence of proteins and lipids in flours, such as those in sunflower with a significant lipid fraction, can influence the extraction process. Therefore, this matrix effect may lead to variations in absorbance as different components in the flour matrix interact with the analytical method. Finally, differences in the amylose/amylopectin ratios among flours can impact the quantity of starch available for extraction. Flours with varying ratios may exhibit different interactions with the extraction process, affecting the measured absorbance.
Considering the richness of information held in the whole signals, all the obtained UV-Vis spectra were analyzed by principal component analysis. The UV-Vis spectra were organized into a dataset of 55 × 576 dimensions (samples and replicates on the raw × UV-Vis variables on the column) and mean centered. In particular, 576 columns correspond to the data points in each UV signal. In detail, the UV spectra were acquired over a wavelength range from 200 to 800 nm with a resolution of 1 nm. Each point in the UV signal represents the absorbance value at a specific wavelength, and the entire UV signal is constituted by these 576 absorbance values. The PCA model was developed using two principal components, according to their explained variance (R2: 97%).
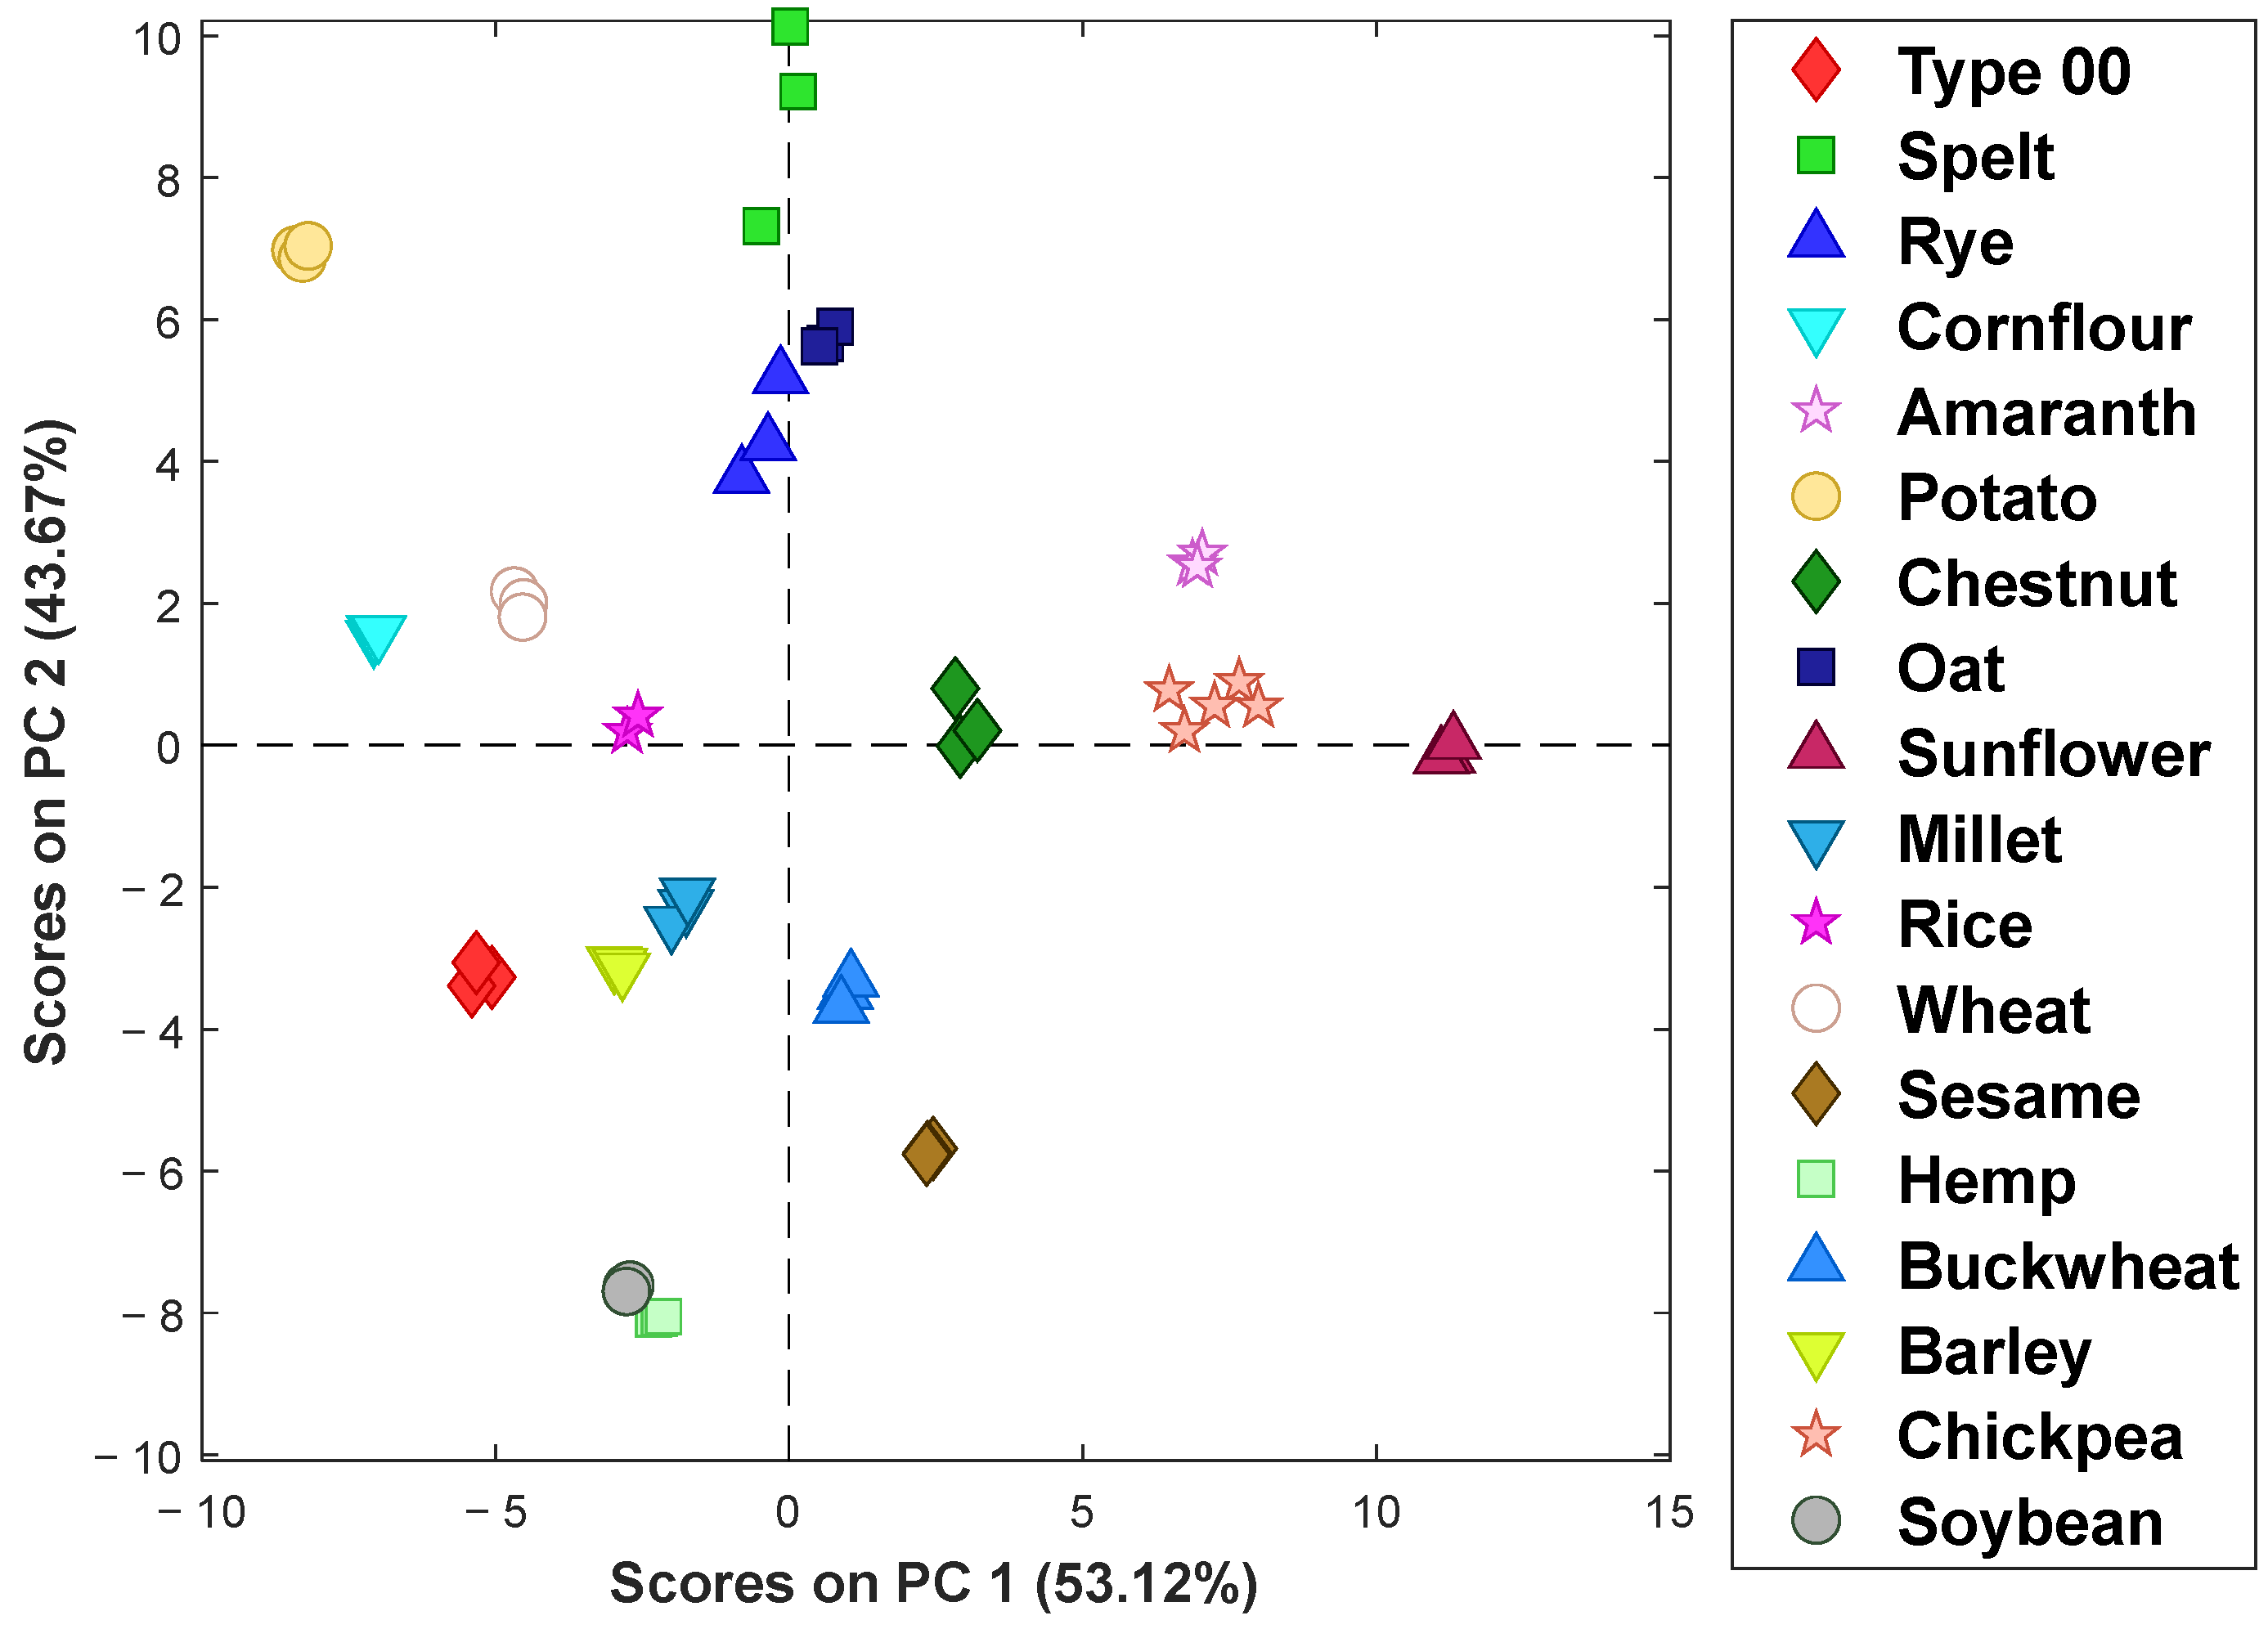
In
Figure 2, the PC1 vs. PC2 scores plot is reported, representing the different flour samples with different symbols and colors. In the first principal component (PC1), the most significant differences emerge between sunflower, chickpea, and amaranth flours, which have positive PC1 values, and potato flour, which displays negative PC1 values. On the other hand, along the second principal component (PC2), spelt and potato with positive PC2 values are opposed to soy and hemp with negative values. From a comprehensive analysis of the figure, similarities emerge among the following groups: (i) soy and hemp (with negative scores for both components), (ii) corn, durum wheat, and rice, (iii) oat and rye, (iv) barley, millet, buckwheat, and Type 00 flour, and (v) amaranth and chickpeas.
From the PC1 loadings figure (
Figure 3a), it can be possible to point out the following significant regions in differentiating the samples on PC1: the range between 250 and 400 nm with positive values and the region corresponding to the absorption of the starch-triiodide complex between 500 and 700 nm with negative values. Specifically, flour samples with positive PC1 values (sunflower, chickpea and amaranth) seem to present higher intensities in the first part of the spectrum and lower intensities in the latter part.
In the second principal component (
Figure 3b), the most influential area relates to the absorption of the starch–iodide complex (range from 400 to 700 nm) with positive values. Consequently, the samples of potatoes, spelt, oats, and rye exhibit higher intensities compared to soy and hemp.
In addition to the visual inspection of starch spectra and the rough differentiation from the scores plot of principal component analysis, all the UV-Vis spectra were examined by cluster analysis.
Figure 4 shows a dendrogram of hierarchical clustering of k-nearest neighbor distances (
Section 2.6). In particular, it was obtained considering the UV spectra coming from all 18 samples (Session 2.2). Each flour was analyzed in triplicate except for chickpea flour, which featured five replicates. It is worth noting the uniqueness of many samples, namely potato, chestnut, sunflower, durum wheat, sesame, buckwheat, rice, corn, spelt and Type 00, that cannot be associated at any clusters when the distance values are lower than two. These differences can be due to several reasons such as the different amylose–amylopectin ratios, degrees of polymerization, helical structures, granule sizes and other physical and chemical properties of starch.
On the other hand, it is possible to highlight a significant similarity among other samples, such as millet and barley, chickpea and amaranth, oat and rye, or soybean and hemp starches, which underscores the need to employ additional techniques, such as scanning electron microscopy, for a more selective differentiation among them.
3.2. Near Infrared Spectral Analysis
Although UV-Vis spectra have yielded valuable insights into assessing the similarities and differences between the samples, this method requires sample pre-treatment. To seek a simpler and faster alternative, the same flour samples were analyzed using NIR spectroscopy without any prior preparation.
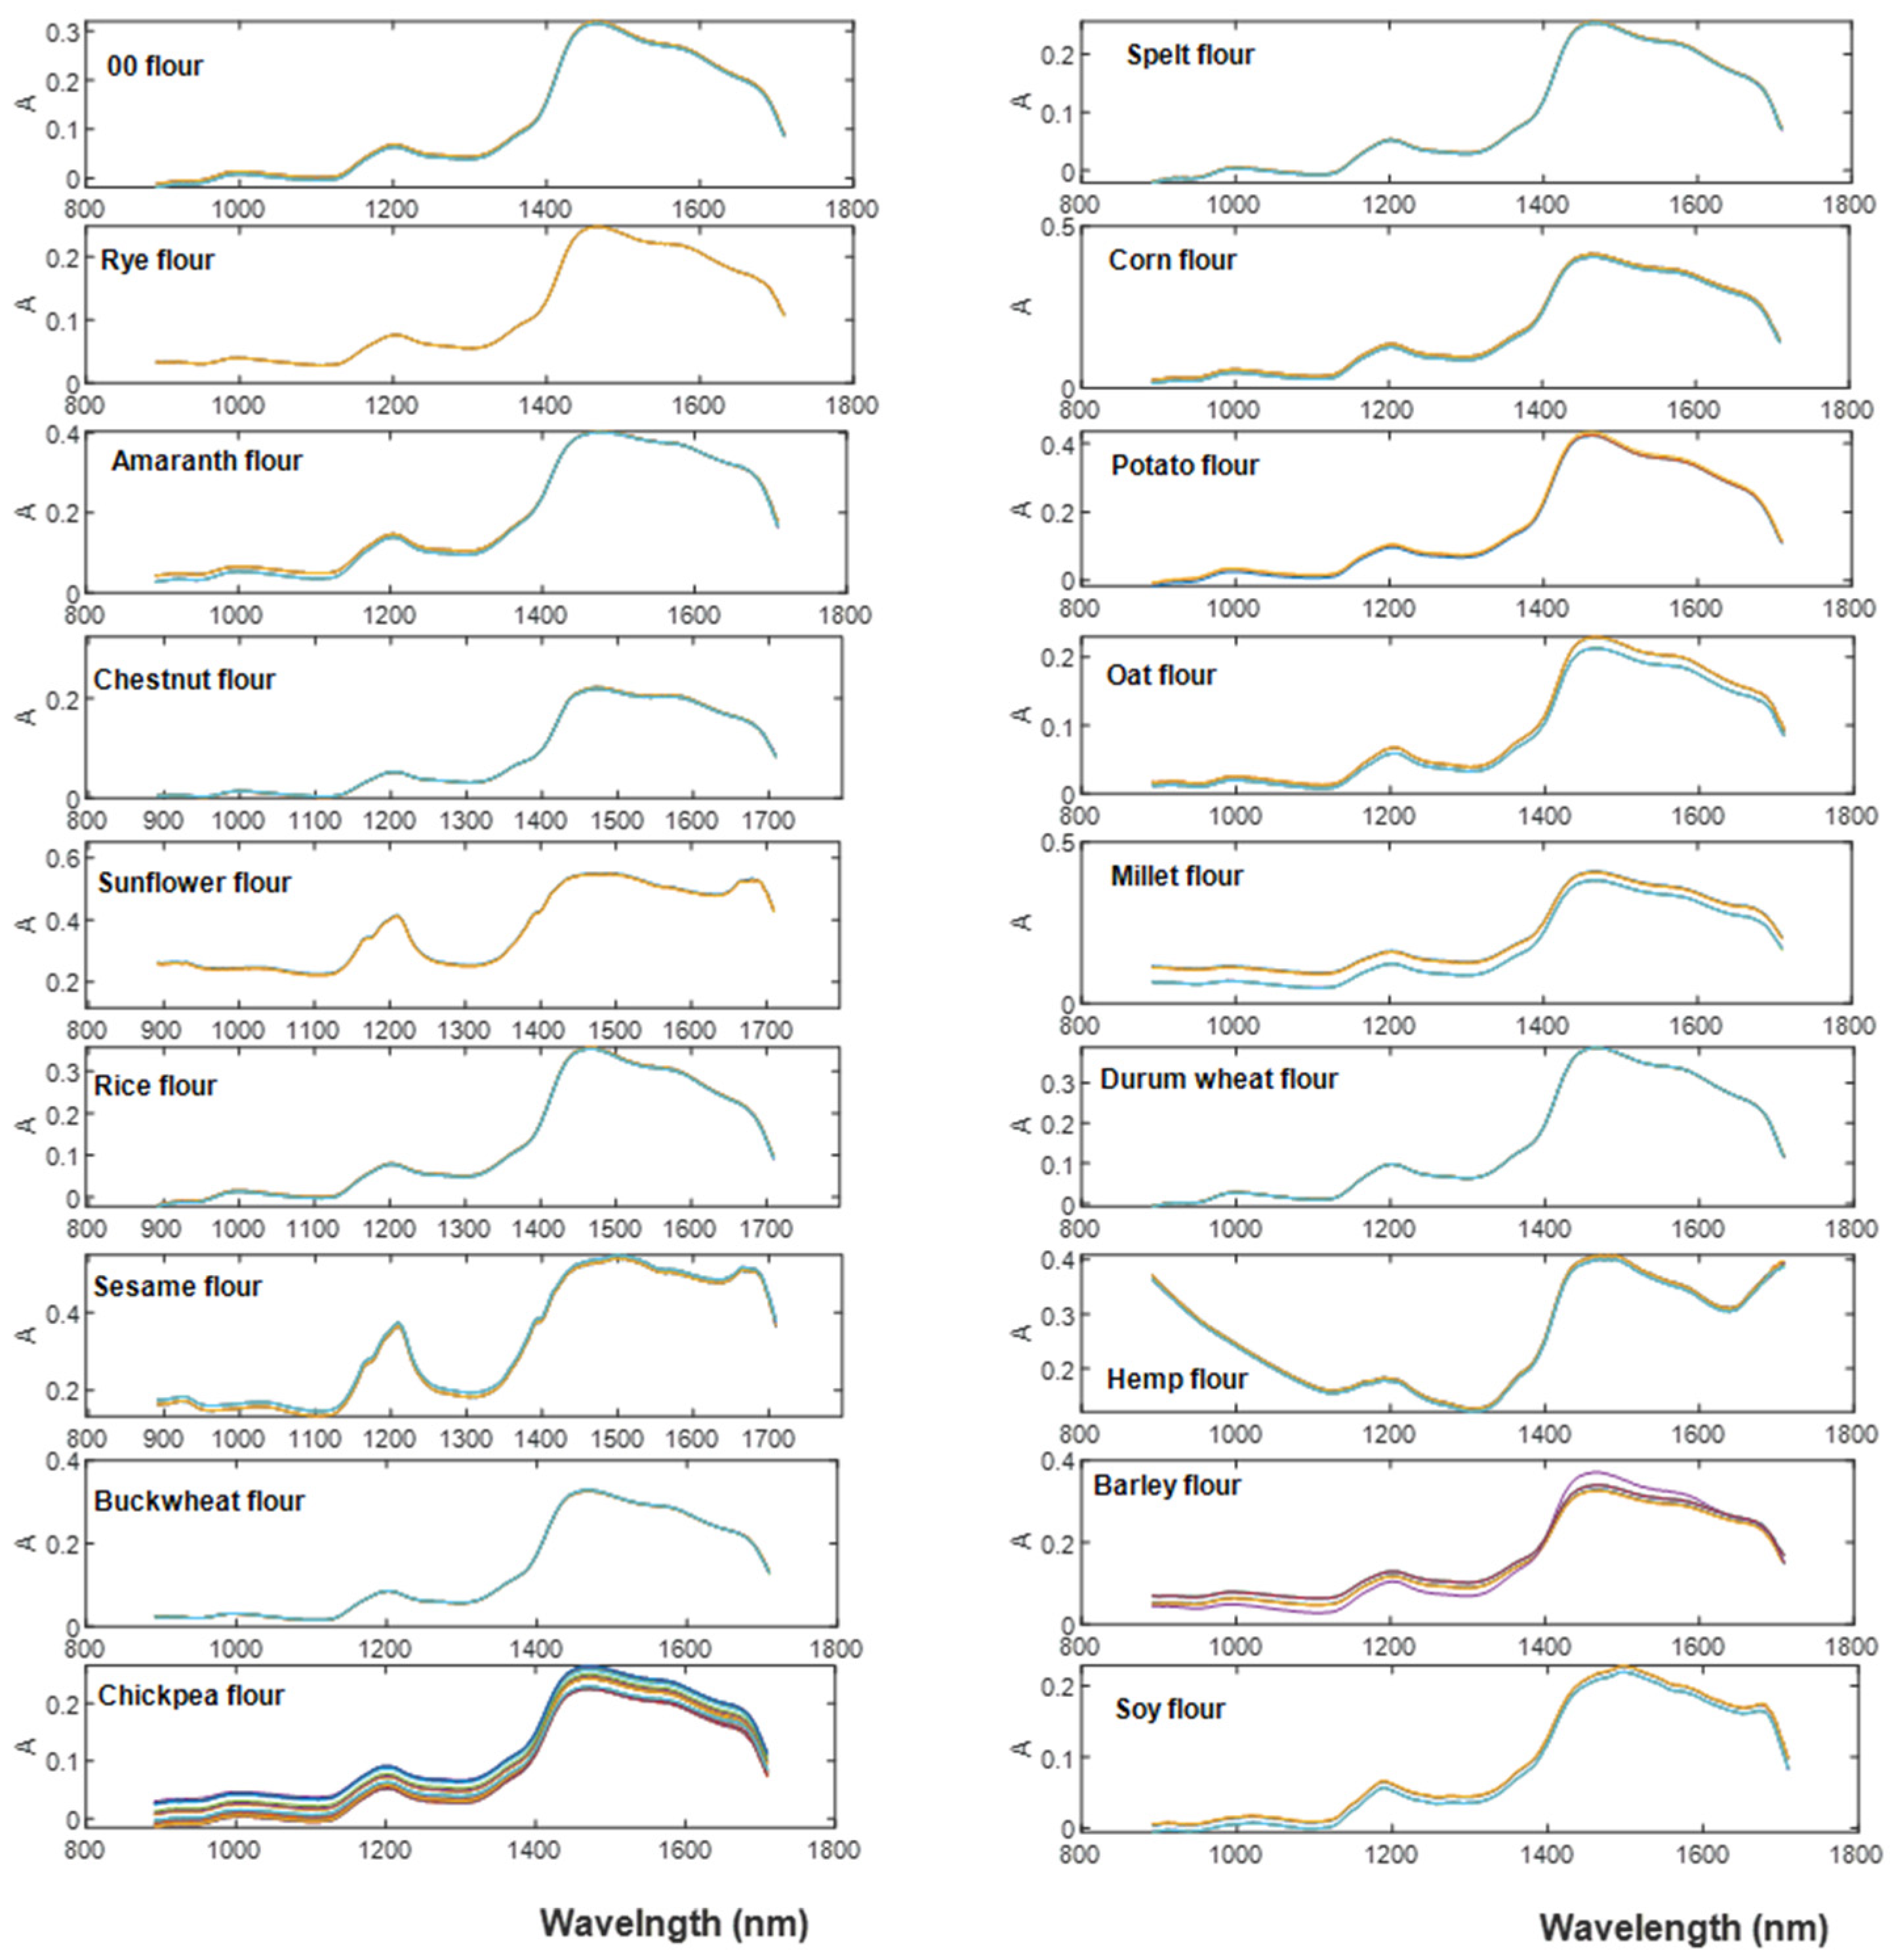
The overall raw NIR spectra are graphically shown in
Figure 5. All samples showed almost a similar trend in the shape of spectra except for hemp flour, presenting a different trend in the beginning and at the end of the respective baseline.
The spectra revealed prominent absorbance regions, particularly around 1200 nm, 1470 nm, 1580 nm, and 1665 nm. The absorption band at 1200 nm corresponded to the second overtone of C–H stretch associated with lipids. The substantial absorbance peaks at 1470 nm were linked to the first overtone of O–H stretching, which is indicative of the moisture content or starch [
19,
20,
25]. The absorbance at 1580 nm was attributed to the first overtone of O–H stretching and was associated with starches, while the peak around 1665 nm was associated with the first overtone of C–H stretching and aromatic compounds [
19]. These significant absorbance regions align with findings reported in the literature [
19,
20,
25]. Taking into consideration the aims of this research, it was decided to focus attention on spectral regions mainly influenced by the presence of water, since it could be potentially related to the different structures of starches of different botanical origin. In particular, the amount of water absorbed varies depending on the botanical species, genotype, and the degree of organization of the starch granules [
27]. Furthermore, the characteristics of starch granules are highly influenced by the moisture content of the medium [
27].
Consequently, to consider the range between 1275 and 1600 nm could be an attempt to obtain information about the presence of a pattern among the different investigated starches according to their botanical origin. Therefore, PCA analysis was carried out only on this region; in particular, the spectral data were pre-treated using SNV before PCA analysis to reduce the multiplicative interferences of scatter and particle size of raw spectra [
16] and mean centered. A PCA model was built considering three PCs explaining 98% of the total variance.
Separation between samples was clearly observed in the PCA scores plot of PC1 and PC2 (
Figure 6).
In particular, a distinct behavior is observed for sunflower and sesame flours (with positive values on PC1 and negative values on PC2), potato flours (with higher values on PC2) and chestnut flours (with more negative values on PC1). Furthermore, the second principal component distinguishes the samples of chickpea, amaranth, and soy, with negative values on PC2, from the other samples, which have positive values on PC2. These observations partially align with the results obtained from the UV-Vis analysis, especially concerning the differences observed between hemp and potato flours with soybean flour.
The PC1 and PC2 loadings plot gives information about the wavelengths that contributed to sample separation (
Figure 7a and
Figure 7b, respectively).
The highest loadings observed at around 1400 and 1450 nm for PC1 and PC2 were related to water or starch as the first O-H stretching overtone. Upon a comprehensive analysis of both
Figure 6 and
Figure 7, it is evident that sunflower and sesame flour, with positive PC1 and negative PC2 scores (fourth quadrant in
Figure 6), are characterized by a notable increase in the intensity of the 1400 nm peak and a corresponding decrease in the intensity of the 1450 nm peak. Notably, the band around 1450 nm, as indicated in the literature, is associated with water or starch as the first O–H stretching overtone, while the peak at 1400 nm corresponds to the CH
2 stretching of lipids. Moreover, the positioning of potato flour, characterized by the highest PC2 score values, appears to be significantly influenced by elevated absorbance around 1450 nm. In contrast, chestnut flour, with negative PC2 scores, exhibits the opposite trend.
The third principal component mainly distinguishes hemp and soybean flour mainly due to the contribution of the NIR band around 1500–1550 nm. The respective score and loading figures are reported as
Figures S1 and S2 in Supplementary Materials.
The result of cluster analysis on NIR spectra in the region between 1275 and 1600 nm is reported in
Figure 8. In this case, four replicates were acquired for each sample except for the control sample, chickpea flour, which presented 27 replicates (Session 2.4). The results display a significant consistency with what was found in the UV-Vis analysis.
In fact, a substantial similarity is observed between amaranth and chickpea flour, as well as between rye flour and oat flour, and between barley and millet flour. Furthermore, it can be observed that according to UV-Vis results, there are samples that are different from the others, such as sunflower, sesame, chestnut and potato flours.
3.3. Starch Morphology
Both UV-Vis and NIR spectroscopic analysis coupled with chemometrics show similarities among some investigated samples, such as barley and millet, rye and oats, and chickpeas and amaranth. This similarity complicates their differentiation based on botanic origin. Consequently, in these cases, the support of commonly used analytical techniques such as scanning electron microscopy is essential to obtain additional information.
Starch granules are microscopic in size, and their morphology varies between different shapes such as oval, ellipsoidal, spherical, smooth, angular, and lenticular, depending on their botanical origin. In amyloplasts, starch granules are present singly or in groups. Common cereals such as wheat, barley and rye contain two types of starch granules: type A, with lenticular shape and large size; type B with spherical shape and small size [
28,
29].
For obtaining a clear visualization of starch granules, their isolation from flour is essential due to the presence of fiber and starch protein cluster. However, in the present work, the aim was to investigate the possibility of obtaining information reducing as much as possible any pretreatment of sample. Therefore, the SEM images were directly acquired on raw flour after the coating of the sample surface with a thin layer of gold (
Section 2.5) with the aim of characterizing the morphology of certain flours that appeared to be similar to others in statistical analysis.
For instance, in
Figure 9a,b, SEM images obtained on the samples of rye and oat flour were reported. The starch granules of rye flour (
Figure 9a) have a lenticular shape (white circles in the figure) with a wrinkled surface and medium size (about 30 μm). On the surface of the starch granules, it can be also possible to see other smaller granules, which is probably due to the presence of associated proteins. In the case of oat flour (
Figure 9b), a different structure is observed than in the previous samples. In this case, there are granules (white circles in the figure) with irregular shapes and sizes and rough surfaces, agglomerates consisting of small granules and irregular shapes, as well as the presence of proteins and cell walls.
The previous statistical analysis revealed that among the various flours, potato, rice, Type 00, and corn flours were found to be distinctive. These differences can be found in the structure of starch, as can be seen in
Figure 10,
Figure 11,
Figure 12 and
Figure 13, respectively.
The starch granules of potato flour (
Figure 10) have smooth, polished surfaces with an oval shape. The smallest granules have a diameter of about 25 μm; larger granules reach up to about 60 μm. The starch granules of rice flour (
Figure 11) are in the form of agglomerates consisting of granules of irregular shapes and sizes and smooth surfaces.
Examining the SEM image for Type 00 flour (
Figure 12), an agglomerate consisting of starch granules with a lenticular shape of varying size and smooth surface is observed as well as protein. The starch granules of corn flour (
Figure 13) are characterized by an angular shape, smooth surface and regular size of about 14 μm, and they associate to form agglomerates.
4. Conclusions
In this research, eighteen commercial flours, intended for food use, were chemically characterized by an untargeted approach, evaluating the possibility of developing rapid and alternative methods for identifying the botanical origin of starch. In particular, the used approach allowed exploring and analyzing a multitude of signals simultaneously, providing a more holistic and informative perspective on the characteristics of the examined samples. Specifically, all investigated samples were analyzed by two spectroscopic techniques, UV-Visible and near-infrared (NIR) spectroscopy; the signals obtained were considered as fingerprints of the investigated samples and analyzed by chemometric techniques. Considering the limited number of examined samples for each type of flour, it was not possible to develop classification models (which would have required a representative sampling in terms of the number for each type of investigated flours). However, an initial exploratory investigation was carried out using principal component analysis and cluster analysis, which provided interesting preliminary information on the similarities and/or differences between starches of different botanical origins based on both UV-Vis and NIR acquired spectra.
In particular, the UV-Vis obtained model shows an interesting pattern among samples according to their botanical origin, distinguishing samples such as potato, chestnut, sunflower, durum wheat, sesame, buckwheat, rice, corn, spelt and Type 00 flours. However, some similarities were found for other flours, barley and millet, rye and oats, and chickpeas and amaranth, highlighting the need to use other techniques such as Scanning Electron Microscopy (SEM) to obtain
supporting information.
Although this study is still a preliminary investigation and far from leading to the development of a classification model, the results obtained provide a solid premise for the development of an analytical approach based on the use of UV-Vis spectroscopy as a fingerprint technique for the identification of the botanical origin of starches. Regarding NIR spectroscopy, promising outcomes have emerged from the analysis of NIR regions, which are predominantly attributed to the presence of water and starch, suggesting its potential as an alternative methodology for distinguishing starches from various botanical sources without any sample pre-treatment.
Some remarks can be highlighted from the results obtained. The choice between NIR and UV-Vis spectroscopy for characterizing different flours depends on the challenges and goals of the research, as each technique offers distinct advantages and disadvantages. UV-Vis spectroscopy is particularly effective for starch analysis, as it provides specificity to differentiate starches from different botanical sources. However, one limitation is that UV-Vis often requires pretreatment of the sample, making it unusable after analysis. On the other hand, NIR spectroscopy has the advantage of not requiring pretreatment of the sample, allowing it to be recovered. However, NIR spectra can be affected by various compounds, such as the presence of water, which can overlap with the starch signal, leading to a non-selective technique. In future practical applications, the combination of both techniques could offer a powerful approach for characterizing flour. Leveraging the strengths of UV-Vis in starch specificity and NIR in non-destructive analysis will certainly provide a more complete and comprehensive characterization of flour. In fact, future research could be addressed in the use of mathematical–statistical models based on a data fusion approach [
30] as well as in the increasing the number of investigated samples for each type of studied starch. However, investigation by scanning electron microscopy is certainly useful in supplementing the model results in case of overlapping information.


 ,
, 


