Article

Two-Dimensional Tellurium Nanosheets for the Efficient Nonenzymatic Electrochemical Detection of H2O2

1
Department of Chemistry and Biochemistry, North Carolina Central University, Durham, NC 27707, USA
2
School of Medicine, Yale University, New Haven, CT 06510, USA
*
Author to whom correspondence should be addressed.
These authors contributed equally to this work.
Chemosensors 2024, 12(2), 17; https://doi.org/10.3390/chemosensors12020017
Submission received: 18 December 2023 / Revised: 19 January 2024 / Accepted: 21 January 2024 / Published: 23 January 2024

Abstract

:
This study reports, for the first time, the utilization of two-dimensional (2D) tellurium (Te) nanosheets for the efficient nonenzymatic detection of hydrogen peroxide (H2O2). H2O2 acts as a pivotal biomarker with widespread applications across environmental, biological, industrial, and food processing domains. However, an excessive accumulation of H2O2 in the body poses a severe threat to human life. Consequently, the imperative need for a selective, sensitive, and cost-effective sensing platform for H2O2 detection has gained paramount significance. Employing a low-cost and straightforward hydrothermal method, Te nanosheets were synthesized to address the escalating demand for a reliable detection platform. The as-synthesized Te nanosheets are characterized through Raman spectroscopy and atomic force microscopy techniques. The electrochemical performance of the Te nanosheets integrated onto a glassy carbon (Te-GC) electrode was thoroughly investigated using cyclic voltammetry, differential pulse voltammetry, and chronoamperometry. The experiments were designed to evaluate the response of the Te-GC electrode in the presence and absence of H2O2, alongside its performance in the detection of other pertinent interfering analytes. The sensor shows a limit of detection of 0.47 µM and a sensitivity of 27.2 µA µM−1 cm−2 towards H2O2. The outcomes of this study demonstrate the efficacy of Te nanosheets as a promising material for nonenzymatic H2O2 detection in urine samples. The simplicity and cost-effectiveness of the hydrothermal synthesis process, coupled with the notable electrochemical performance of the Te/GC electrode, highlight the potential of Te nanosheets in the development of a robust sensing platform. This research contributes to the ongoing efforts to enhance our capabilities in monitoring and detecting H2O2, fostering advancements in environmental, biomedical, and industrial applications.

1. Introduction

Hydrogen peroxide (H2O2) is a strong oxidizer and a volatile inorganic compound of biological, clinical, and industrial importance [1,2,3,4]. For industrial uses, it is used for bleaching, chemical synthesis, and water treatment [5,6,7]. Due to wide applications and the natural formation of H2O2, it can be present in the environment, water surfaces, body fluids, and food [8,9]. The amount of H2O2 present in the environment defines the quality of air and water. In biological systems, it plays an important role in metabolism, signaling, biosynthetic reactions, and oxidative stress [10,11]. H2O2 is involved in cellular signaling processes at lower concentrations. However, excess levels can disrupt normal cellular signaling pathways, leading to the dysregulation of various physiological functions. Excess H2O2 in the body can lead to various adverse effects due to its potent oxidizing properties. While H2O2 is produced as a byproduct of normal cellular metabolism and is involved in certain physiological processes, an imbalance or excessive accumulation can be harmful. H2O2 is a member of reactive oxygen species (ROS), and in excess, it can cause oxidative stress. This stress arises from an imbalance between the production of ROS and the body’s ability to eliminate them. It is important to note that the body has defense mechanisms, including antioxidant enzymes and molecules, to counteract the effects of reactive oxygen species. Nonetheless, when the balance between oxidants and antioxidants is disrupted, the risk of oxidative damage and associated health issues increases. Conditions that promote the accumulation of excess H2O2 include certain diseases, environmental factors, and exposure to certain chemicals.
According to the Occupational Safety and Health Administration (OSHA), the permissible limit of H2O2 in the air is about 1 ppm and inhalation beyond 75 ppm can immediately endanger health and life [12]. Oxidative stress can damage cellular components, including proteins, lipids, and DNA, which may lead to impaired cell function and contribute to various diseases. Elevated levels of H2O2 can trigger an inflammatory response in the body. Recent studies suggest that the level of H2O2 present in human blood plasma can be in the low range of 0.25 µM to a probable normal range of 1–5 µM, and a high range of 30–50 µM in certain disease states (e.g., diabetes) or during chronic inflammation [13]. Intracellular H2O2 content under normal circumstances is usually ≤10 nM [14,15]. Chronic inflammation is associated with numerous health conditions, including cardiovascular diseases, neurodegenerative disorders (such as Alzheimer’s and Parkinson’s), and autoimmune diseases. The concentration of H2O2 in body fluids and exhaled breath can determine health conditions, particularly pulmonary diseases and diabetes [16,17,18,19]. The brain is particularly vulnerable to oxidative damage due to its high oxygen consumption and lipid content. Excess H2O2 can contribute to the oxidation of low-density lipoprotein (LDL), promoting atherosclerosis. H2O2 can interact with DNA, causing modifications and mutations. This DNA damage can lead to the development of cancer and contribute to aging-related symptoms. In addition, excessive H2O2 can affect the functioning of immune cells, which may lead to a compromised immune system, making the body more susceptible to infections and illnesses.
Furthermore, H2O2 can be found in processed and packaged food products. The consumption of processed food with high concentrations of H2O2 can lead to serious gastrointestinal diseases [7]. Food products containing folic acid can form H2O2 during their decomposition and its high concentrations can affect the nutritional values [20]. Hence, an additional process is required to decompose the excess H2O2 [21]. In this regard, many countries have already established food safety regulations for the safe limit of H2O2 in the final products [22,23,24]. The ingestion and inhalation of H2O2 above the safe limits can cause severe health issues for human beings [25,26]. Therefore, the detection and determination of H2O2 concentration in the environment, human body fluids, and food products to ensure that the levels remain below the safe limit have great importance.
To ensure the accurate detection of H2O2 levels, a variety of analytical techniques such as chromatography, titrimetry, spectrophotometry, colorimetry, fluorescence, and phosphorescence have been developed and tested [27,28,29,30,31]. However, these analytical techniques have their technical drawbacks, like their poor selectivity and sensitivity, complexity, time-consuming nature, and expensive instrumentation. In recent years, electrochemical sensors have been proven as a suitable choice due to their low cost, high sensitivity, excellent selectivity, and fast response, and offer a portable and convenient operation for the accurate and selective sensing of H2O2 [10]. In comparison with conventional and commercially used analytical techniques like chromatography, the use of electrochemical sensors is more favorable because of their compact size, cost-effectiveness, and fast response, along with easy remote monitoring. The enzymatic electrochemical sensing approach shows excellent sensing performance with good sensitivity and selectivity, but it comes with the limitations of complex immobilization processes and instabilities driven by physical conditions [32,33]. In enzymatic detection, the temperature and pH of the medium alter the sensing performance dramatically [34]. Furthermore, the high cost of enzymes is a limiting factor in the fabrication of an enzymatic biosensor and its wide applicability. In recent years, huge efforts have been made to overcome the limitations of enzymatic biosensors, and have led to a nonenzymatic or direct electrochemical sensing approach [10]. The nonenzymatic biosensors modified with suitable catalysts show excellent detection capabilities for different analytes or biomarkers [35]. A nonenzymatic biosensor offers ease of fabrication, is inexpensive and robust, and has a longer life [36]. These sensors have less impact of physical conditions on the sensing performance compared to enzymatic sensing. Furthermore, the nonenzymatic sensors show direct charge transfer and enhanced surface renewability.
In electrochemical sensing, catalysts significantly influence overall sensing performance. Therefore, a variety of nanostructured materials, including metal oxides, metal nanoparticles (NPs), 2D transition-metal dichalcogenides (TMDs), and monoelemental nanomaterials, have been investigated for the nonenzymatic detection of H2O2.The use of nanomaterials offers a higher surface area with fast charge transfer to promote the reaction of analyte over the surface [37]. Hence, the controlled growth or synthesis of nanomaterials with lower dimensions can be a suitable approach to achieve improved sensing performance in electrochemical sensing.
Metal nanostructure-based nonenzymatic sensors show excellent detection and selectivity towards H2O2 [38]. Metal NPs also have been studied as composites with other nanomaterials like carbon nanotubes (CNT) for the efficient detection of H2O2 [39,40]. Except for metal NPs, metal oxide composites such as NiO NPs/CNT have been reported for the selective detection of H2O2 with a limit of detection (LOD) of 1 μM [41]. Recently, Fe2O3/Graphene nanocomposite has been reported with a low LOD of 4.79 μM and detectivity of 0.037 μA μM−1 cm−2 [42]. The TMDs-modified electrode, MoS2/graphene nanocomposite, demonstrated high sensitivity and selectivity towards H2O2 in the presence of interfering analytes with a wide linear response from 0.25 to 16 mM H2O2 [43]. Composites and metal NPs-modified catalysts have always been the prime choice for detection applications, but to reduce the complexity and improve the scalability, other approaches like doping have also been explored for sensitive and selective electrochemical detection. Nitrogen doping in carbon nanofibers has been demonstrated for the selective detection of H2O2 with a sensitivity of 357 µA μM−1 cm−2 [44].
Te is a p-type semiconductor having a band gap of ~0.32 eV with excellent physical and chemical characteristics [45,46]. Te nanostructures have been reported for optical, piezoelectric, thermoelectric, electrochemical, and sensing properties [47,48,49,50]. The synthesis of Te nanostructures has been reported and optimized over the years using different synthesis methods with controlled dimensionalities [46,47,51]. Nanostructured Te has been reported for its good catalytic and storage properties. The application of Te nanoparticles and nanowires for the nonenzymatic detection of H2O2 has been investigated by various research groups [45,50,51,52,53,54,55]. As previously discussed, the sensing performance is notably influenced by nanostructure dimensions [52]. To attain superior H2O2 detection performance, this study introduces the use of 2D Te nanosheets for nonenzymatic electrochemical detection. The low-cost synthesis approach of 2D Te nanosheets makes it suitable over the other direct growth approaches.

2. Material and Methods

2.1. Materials and Reagents

Sodium tellurite pentahydrate (Na2TeO3·5H2O) from Tokyo Chemical Industries (Tokyo, Japan), hydrazine hydrate (N2H4·H2O, Hydrazine, 64%) from Thermo Scientific (Fair Lawn, NJ, USA), and ammonium hydroxide solution (NH4OH) from Fisher Scientific (Fair Lawn, NJ, USA) and polyvinylpyrrolidone (PVP, K85-95, MW 13,000,000) were purchased and used in the synthesis reaction without further purification. De-ionized water (DI water, <18 Ω) was used for synthesis, cleaning, and solution preparation. H2O2 (30%, Fisher, Fair Lawn, NJ, USA), dopamine hydrochloride (C8H11NO2·HCl, 99%, Alfa Aesar, Ward Hill, MA, USA), ascorbic acid (C6H8O6, Ward’s Science, Rochester, NY, USA), uric acid (99%, Alfa Aesar, Ward Hill, MA, USA), and sodium chloride (NaCl, Fisher Scientific, Fair Lawn, NJ, USA) were procured and used as analytes for sensing without further purification. Phosphate-buffered saline (PBS, pH 7.4, 1X molarity) was used as an electrolyte medium.

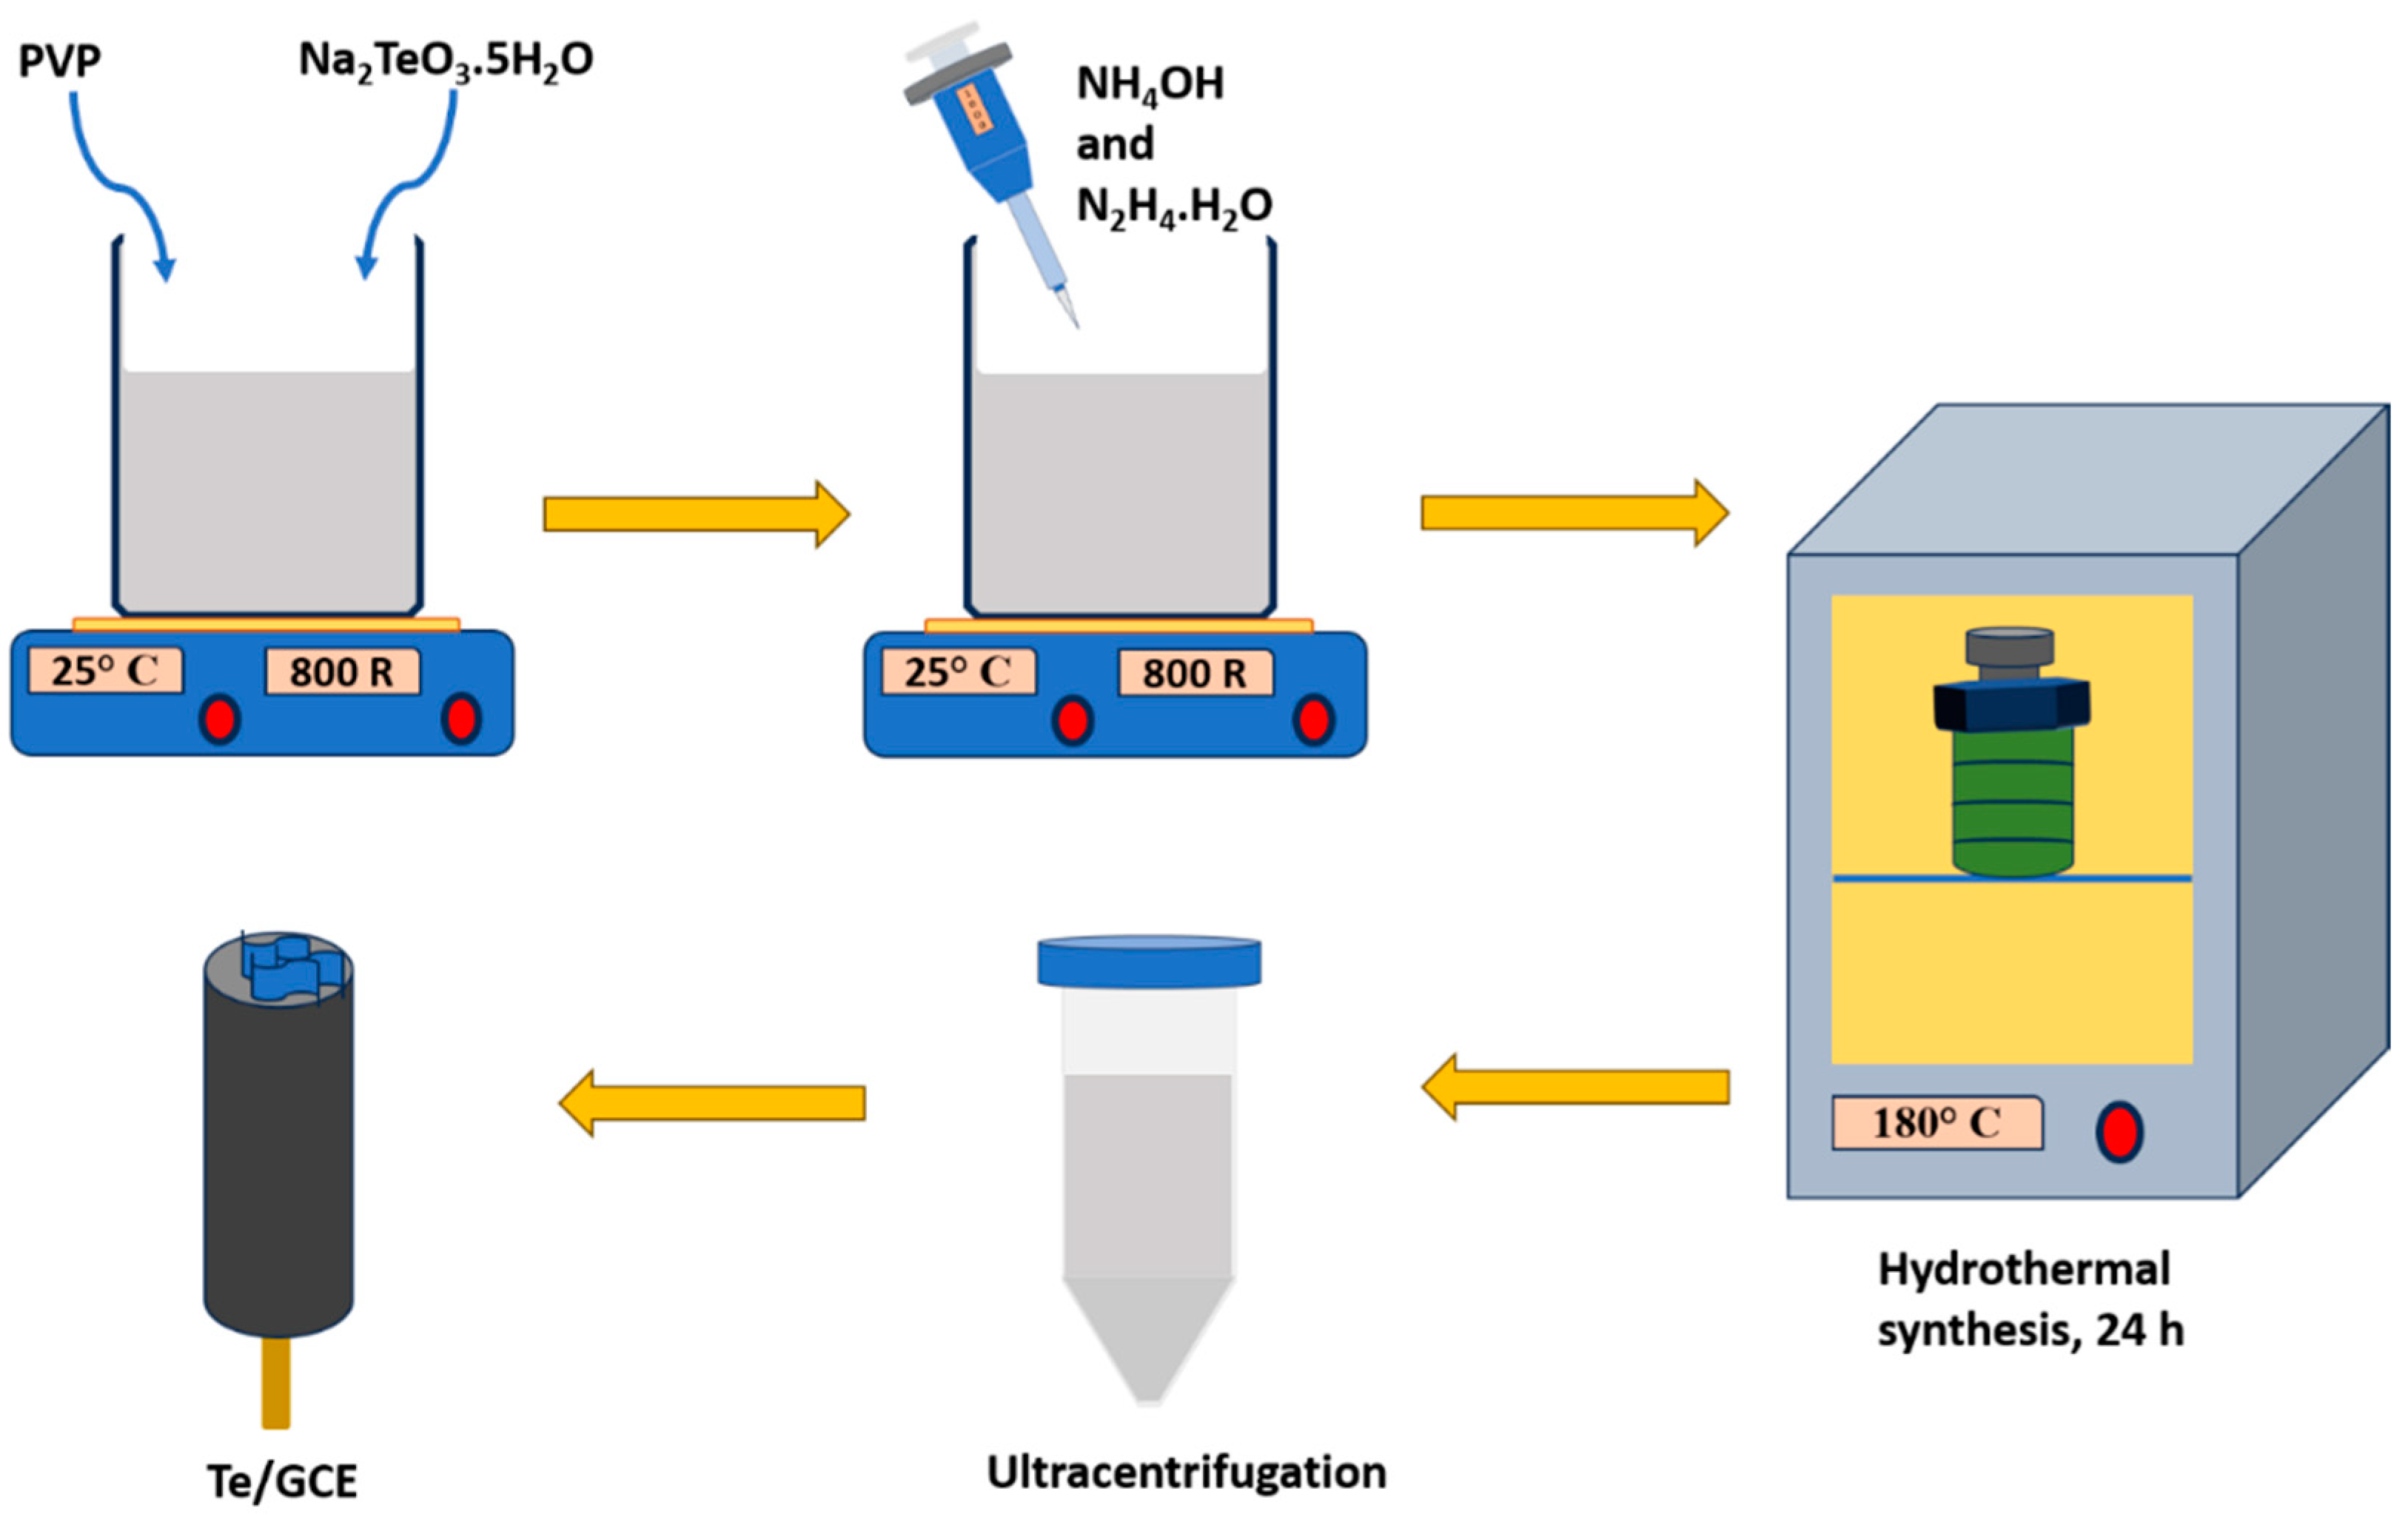
2.2. Synthesis of Te Nanosheets

Te nanosheets were synthesized by a conventional hydrothermal route, as shown in Figure 1. Initially, 3 g of PVP was dissolved in 30 mL of DI water under continuous stirring until a clear solution was obtained. Further, 10 mM of Na2TeO3·5H2O was added to the PVP solution and stirred for 4 hrs. Afterward, 3.2 mL of NH4OH and 1.7 mL of N2H4·H2O were added to the above solution and stirred for 1 h. The final solution was then transferred to the Teflon-lined autoclave and heated at 180 °C for 24 h. After 24 h, the autoclave was taken out for natural cooling and the collection of the final product. The collected solution was washed with water and purified by centrifugation at 5000 rpm for three cycles. After cleaning, the Te nanosheets solution appears in a silver gray color. The final product shows the formation of a few Te nanowires along with Te nanosheets.

2.3. Material Characterizations

A high-resolution optical microscope (Olympus BX61, Olympus, Tokyo, Japan) was used to capture the optical images of the obtained Te nanosheets. The topography, morphology, and thickness profile of the Te nanosheets were recorded using AIST-NT Smart SPM integrated with a RAMAN microscope (Horiba semiconductor, Piscataway, NY, USA). The Horiba LabRAM Evolution RAMAN microscope was used to obtain the Raman spectra of the Te nanosheets.

2.4. Electrode Modification and Sensing Characterization

The glassy carbon electrode (GCE) from BAS Inc. with a 3 mm inner diameter was used for sensing characterizations. Before use, the GCE was polished using the alumina slurry of different particle sizes followed by ultrasonication in DI water for 5 min. Finally, the GCE was rinsed with ethanol and DI water and dried in the oven.
Then, 1 mg/mL of chitosan solution was prepared in diluted acetic acid (1% aqueous) solution by sonication for 30 min. Sonicated Te nanosheets suspension (150 μL) was mixed with 1 mL of the chitosan solution, drop cast on GCE, and dried at 60 °C for 30 min. A total volume of 5 μL of the mixture was dropped on GCE for the modified electrode.
The electrochemical sensing characterization of the Te nanosheets/GC-modified electrodes (Te-GC) was carried out using the Voltammetric Analyzer (CV-50W, Bioanalytical Systems, Inc., West Lafayette, IN, USA). The sensitivity of the instrument was set at 100 µA/V for all measurements. The sensing measurements were recorded using the conventional three-electrode configuration with platinum (Pt) as the counter electrode and Ag/AgCl (3.5 M KCl) as the reference electrode. Three-electrode assembly was connected to the cell stand (C3, BAS Inc., West Lafayette, IN, USA) with controlled stirring and gas purging. Cyclic voltammetry (CV), differential pulse voltammetry (DPV), and chronoamperometry (CA) signals were recorded to examine the sensing performance towards H2O2 and other analytes (uric acid, NaCl, dopamine, and ascorbic acid). For the electrochemical measurements, 15 mL of PBS was taken in the voltammetric cell and purged with nitrogen for 30 min, with stirring at 400 rpm. Once the electrodes were connected, the stirring and purging was momentarily stopped to record the CV and DPV scans. The initial CV and DPV scans of the electrode, in blank electrolyte, i.e., without H2O2 addition, were performed. Subsequently, 150 µL of H2O2 from 20 µM stock solution was added. The effective concentration of H2O2 in the electrolyte was 100 times lower. Purging and stirring were continued for 5 min with each addition of H2O2. For the chronoamperometry tests, analytes of 1 M concentrations were prepared. Since uric acid has negligible solubility in water, a 0.39 M solution of this analyte was prepared. 150 µL of these analyte stock solutions was periodically added at 100 s time intervals. The concentration of the interferant analytes (uric acid, NaCl, dopamine, and ascorbic acid) was purposefully kept high to study the efficacy of the Te sample towards H2O2 detection. The chronoamperometry test was also conducted with a 2 µM concentration of the interferants, which is within the normal range in human specimens.

3. Results and Discussion

3.1. Microscopic and Spectroscopic Characterization of Te Nanosheets

Optical microscopy is a widely accepted way to confirm the formation of large area 2D nanosheets. Initially, the formation of Te nanosheets was confirmed using a high-resolution optical microscope. We also observed the formation of a few nanowires along with nanosheets. Figure 2a illustrates a typical optical image of the sample. The reaction yields a higher number of nanosheets compared to nanowires, approximately in an 80% to 20% ratio, and we found that the length of nanosheets was >20 μm and width >5 μm, as shown in Figure 2b.
Atomic force microscopy (AFM) serves as an invaluable tool for characterizing nanomaterials due to its high-resolution imaging capabilities and precise topographical analysis. Tellurium, a semiconductor material, when synthesized into nanosheets, exhibits unique properties that can be elucidated through AFM. By utilizing a sharp probe that scans the surface of the nanosheets, AFM generates topographic maps revealing the morphology, thickness, and surface roughness at the atomic or near-atomic scale. This comprehensive analysis through AFM plays a pivotal role in advancing the understanding and potential applications of Te nanosheets in various fields, including electronics, optoelectronics, and energy storage. We transferred the Te nanosheets to the SiO2 substrate to examine the morphological and thickness profile. A 10 μm × 10 μm area containing Te nanosheets was selected to obtain the surface morphology imaging (Figure 2c) and height profile data (Figure 2d). A silicon (Si) tip with a length 225 μm and a tip radius < 40 nm was used for scanning. We scanned the sample with a scan rate of 0.3 Hz in the noncontact mode. The average surface roughness on the Te nanosheets was 0.3 nm and the height profile showed a thickness of ~80 nm.
Raman spectroscopy serves as a powerful tool in characterizing the structural and vibrational properties of Te nanosheets. These two-dimensional materials exhibit a unique electronic and optical behavior due to their ultrathin nature and quantum confinement effects. The Raman spectra of Te nanosheets unveil invaluable insights into their phonon modes, stacking configurations, and layer thickness. The distinct peaks observed in the spectra correspond to the vibrational modes associated with the lattice vibrations and provide crucial information about the crystalline quality and structural integrity of the nanosheets. Additionally, Raman spectroscopy aids in identifying any potential doping, defects, or strain present in these nanomaterials, contributing significantly to their characterization and potential applications in various fields, including electronics, optoelectronics, and sensing technologies. The Raman spectrum for Te nanosheets was recorded using 532 nm laser excitation. Te nanosheets exhibit characteristic Raman peaks related to their crystal structure.
The Raman peaks observed in Te nanosheets at 92.05, 123.47, and 143.56 cm−1 related to E1-To, A1g, and E phonon mode vibrations, as shown in Figure 2e. Te nanosheets show different Raman-active phonon vibration modes due to their high atomic number and the existence of electronic polarizability. The Te unit cell contains three atoms, and it leads to an infinite chain parallel to the c-axis. The most intense peak at 123.47 cm−1 for the A1 mode is due to symmetric intrachain stretching, compression, and bending in the basal plane [52,53]. The second strong peak at 92 cm−1 is due to the chain orientation along the a- and b-axis named the E1 mode. The peak at 143.56 cm−1 for Te nanosheets is assigned to the E2 mode and it usually arises due to asymmetric expansion along the c-axis. The Raman spectrum for Te nanosheets shows good agreement with the existing literature with slight shifting in the peaks [52]. Raman spectra confirm the crystalline and phase pure nature of the synthesized Te nanosheets.
The photoluminescence (PL) spectra for Te nanosheets were recorded using a 473 nm laser excitation to examine optical properties. The PL spectrum of bulk Te does not exhibit any PL emission due to the small bandgap (~0.32 eV) in the far infrared (IR) range [54]. In contrast, recently Nyugen et al. found that the PL spectrum of the Te nanocrystals shows a broad PL peak in the visible range owing to the quantum confinement of excitons [55]. The PL spectra (Figure 2f) of our synthesized Te nanosheets also show a broad peak in the visible range and can similarly originate from the quantum confinement of excitons. During relaxation, these electrons recombine with holes in the valence band and emit light in the visible range due to the alteration of the density of state near the edges.

3.2. Electrochemical Sensing Performance

The fabrication process of the sensor and the suggested mechanism for H2O2 sensing based on Te nanosheets are illustrated in Figure S1 (Supporting Information). The CV and DPV scans were measured simultaneously at a particular concentration in the potential range of 600 to −900 mV with respect to the Ag/AgCl reference electrode. The scans were carried out at a scan rate of 10 mV/s in a negative polarity setting from the high potential to low potential region. The CV scans are plotted (according to the US convention) in Figure 3a,b. The CV scans of blank GC, Te-GC without H2O2, and Te-GC with 0.2 µM H2O2 are plotted in Figure 3a. The CV signal for Te-GC shows the distinct redox peaks. The concentrations of H2O2 tested were in the range of 0.2–5 µM, which is the normal range found in human blood plasma [13]. We observe two prominent peaks at 235 and −405 mV, which can be assigned to oxidation and reduction reactions, respectively. This indicates that these peaks originate from an irreversible conversion of Te to TeO2 and vice versa. It is well established that metallic nanostructures develop a thin oxidized layer on their surface when processed in ambient conditions. Considering the centrifugation, storage, and electrode preparation in an aqueous environment, the partial surface oxidation of the metallic Te nanosheets is inevitable. The reduction peak could be attributed to the reduction of TeO2 to metallic Te. In the reverse CV scan, Te metal converts back to TeO2. The redox reactions can be represented by the following equations [56]:
Te   + 2 H 2 O TeO 2 + 4 H + + 4 e   ( oxidation )
TeO 2 + 4 H + + 4 e     Te   + 2 H 2 O   ( reduction )
In the presence of H2O2, the oxidation of Te to TeO2 becomes more prominent. The oxidizing environment provided by H2O2 is expected to inhibit the reduction of TeO2 to Te, leading to a decrease in signal (at negative potential) in both CV and DPV with higher H2O2 concentrations. The concentrations of H2O2 tested were in the range of 0.2–5 µM, which is the normal range found in human blood plasma [13].
As can be observed in Figure 3b,c, the peak current of both the redox peaks decreases with increasing H2O2 concentration. Manikandan et al. [56] also observed the decreasing trend in peak current intensity with increasing H2O2 concentration using Te nanoparticles, although no possible reason was mentioned by them. This observation of decreasing intensity also aligns with the findings of Teodoro et al. [57], who used UV Vis spectroscopy to detect H2O2 with Ag nanoparticles. They observed the decrease in spectral intensity with increasing H2O2 concentration, which was ascribed to the degradation on the Ag nanoparticles at higher concentrations of H2O2. Since the H2O2 can undergo a disproportionation reaction to form H2O (reduction) and O2 (oxidation), it is possible that the metal nanoparticle catalyst can get oxidized at higher concentrations. However, this may not be the only plausible reason. The saturation of active sites (i.e., passivation at high analyte concentration) on the metal catalyst can also lead to decreased sensitivity, which is observed in our study as a saturation stage in the CV and DPV profiles.
The DPV results also show a similar trend to the CV scans (Figure 3c). Since the sensitivity of the DPV technique is higher as compared to CV [57], the analysis of the LOD and sensitivity (S) were performed using the DPV data. DPV eliminates the capacitive contribution of the current response and thus, it shows lower values than the CV scans in our case. The LOD and sensitivity (S) can be obtained from the plot of the peak current with respect to the concentration of the analyte [58,59], as per the equations below.
LOD = 3.3 ( σ k )
S = k A
where, σ is the standard deviation of the response, k is the slope of the calibration curve, and A is the area of the working electrode in cm2.
As can be observed from Figure 3d, the plot of the peak current vs. the concentration of H2O2 has two distinct linear regimes: one below the concentration of 1 µM and another in the range of 1–5 µM. The LOD and S evaluated in the lower concentration range were found to be 0.47 µM and 27.2 µA µM−1 cm−2, respectively. The LOD and S in the higher concentration range were evaluated as 0.19 µM and 2.2 µA µM−1 cm−2, respectively. It is understandable that Te nanosheets are more suitable for H2O2 detection at the low concentrations. At high concentrations, the saturation of active sites and the reduction of TeO2 to metallic Te are inhibited, resulting in a decrease in sensitivity. Consequently, two linear ranges are observed. Two sets of DPV experiment results (Figure S2, Supporting information) showcase the reproducibility of H2O2 sensing. The lower potential range demonstrates superior sensitivity and less inhibition, as depicted in Figure S2 of the Supporting Information. Table 1 presents a comparative analysis of various Te-based sensors for H2O2 detection.
The chronoamperometry tests were conducted with a fresh working electrode. The Te-GC electrode showed no response for uric acid and NaCl (Figure 4a,b). However, positive and negative current responses were observed for dopamine and ascorbic acid, respectively. Tsai et al. utilized Te nanowires for the detection of dopamine [60], so our results are in line with their observation. Ascorbic acid, being a reducing agent, should show an opposite response compared to H2O2. The chronoamperometric response for low concentrations of H2O2 is very weak in the presence of highly concentrated interferants. A positive response was visible only beyond 1 mM H2O2 concentrations, which is effectively 1/10th times the interferant concentration. In the presence of interferants at concentrations of 0.2 µM (within the normal range in humans), the signals from dopamine and ascorbic acid were too faint to distinguish from the background. Interestingly, in this scenario, the signal from 100 µM H2O2 is still clearly visible. The chronoamperometric response at different concentrations of H2O2 in PBS solution without the interferants notably showed a detectable signal for a 10 µM concentration (see Figure 4b,c). However, a clear signal is observed for a concentration of 100 µM.
Table 1. Comparison of the figure of merits of some reported nanostructures for H2O2 sensing. # Unit reported in μA µM−1.
Sensing MaterialSensitivity
(μA µM−1 cm−2)
LOD
(μM)
Detection Range (μM)pHRef.
CuO@Cu2O-NWs/PVA/GCE2.793 #0.351–30007[61]
Te Microtube/Pt2.00.0010.5–1007[62]
TeO2 NWs/Pt130.60.62–16,0007[63]
Te NPs/Nafion/GCE0.830.30.67–8.047[56]
Te NWs/ITO0.181---200–17507.4[47]
Te NSs/Chitosan/GC27.20.470.2–57.4This Work

3.3. Analysis of Real Samples

To assess the practical applicability of our sensor, DPV measurements were conducted on urine samples from two individuals (Figure 5). The urine samples needed to be diluted to observe a signal within the potential window of 600 to −900 mV. When using very high amounts of urine in the test solution, the signal was faint (Figure 5c). The analysis indicates that for this Te nanosheets-based sensor, the optimal amount of testing analyte should be in the range of 100–500 µL (in 15 mL of PBS). This corresponds to an H2O2 amount in the range of 0.5–4 µM/mL of urine.

4. Conclusions

The synthesis of Te nanosheets was successfully achieved through a facile, one-pot hydrothermal method, resulting in nanosheets with an approximate thickness of 80 nm. The crystallinity and purity of the Te nanosheets were verified through the analysis of the Raman spectrum. Subsequently, the nonenzymatic detection capabilities of a GCE modified with Te nanosheets were systematically investigated. The Te nanosheets-modified electrode underwent characterization through CV and DPV, revealing exceptional sensitivity and selectivity towards H2O2. The electrode exhibited a LOD of 0.47 µM and a sensitivity of 27.2 µA µM−1 cm−2. These findings underscore the efficacy of Te nanosheets in facilitating the detection of H2O2. Importantly, the results suggest the practical application of Te nanosheets in detecting H2O2 within human body fluids. This holds significant promise for diagnostic and monitoring purposes in healthcare. Furthermore, the two-dimensional nature of these nanosheets opens avenues for their potential use in the development of flexible and wearable biosensors. In conclusion, the successful synthesis of Te nanosheets, their effective modification of electrodes, and the promising electrochemical performance indicate the feasibility of incorporating these nanomaterials into practical applications, especially in the realm of biosensing. The versatility demonstrated in this study not only enhances our understanding of Te nanosheets, but also paves the way for innovative advancements in the field of nanotechnology and sensor development.

Supplementary Materials

The following supporting information can be downloaded at: https://www.mdpi.com/article/10.3390/chemosensors12020017/s1, Figure S1: Top: Illustration depicting the sensor fabrication process. Bottom: Proposed mechanism for H2O2 sensing utilizing Te nanosheets. Figure S2: Two sets of DPV experiment results demonstrate the reproducibility of H2O2 sensing. The lower potential window exhibits superior sensitivity and less inhibition.

Author Contributions

Conceptualization, F.Y.; Data curation, A.K.S., R.K. and N.F.D.; Funding acquisition, F.Y.; Investigation, A.K.S., R.K. and N.F.D.; Methodology, A.K.S., R.K. and N.F.D.; Project administration, F.Y.; Resources, F.Y.; Supervision, F.Y.; Validation, A.K.S. and R.K.; Writing—original draft, A.K.S. and R.K.; Writing—review and editing, F.Y. All authors have read and agreed to the published version of the manuscript.

Funding

The authors acknowledge the financial support of the U.S. National Science Foundation (Award #2122044) for this project. This research was partially sponsored by the Army Research Office and was accomplished under Grant W911NF2210109.

Institutional Review Board Statement

Not applicable.

Informed Consent Statement

Not applicable.

Data Availability Statement

The data reported in this paper are available from the corresponding author upon request.

Acknowledgments

The views and conclusions contained in this document are those of the authors and should not be interpreted as representing the official policies, either expressed or implied, of the Army Research Office or the U.S. Government. The U.S. Government is authorized to reproduce and distribute reprints for Government purposes notwithstanding any copyright notation herein. The authors thank Basant Chitara and Martha Garcia Cervantes for technical assistance in the initial stages of this work.

Conflicts of Interest

The authors declare no conflicts of interest.

References

  1. Li, Y.; Huan, K.; Deng, D.; Tang, L.; Wang, J.; Luo, L. Facile Synthesis of ZnMn2O4@rGO Microspheres for Ultrasensitive Electrochemical Detection of Hydrogen Peroxide from Human Breast Cancer Cells. ACS Appl. Mater. Interfaces 2020, 12, 3430–3437. [Google Scholar] [CrossRef]
  2. Hsu, C.L.; Chang, K.S.; Kuo, J.C. Determination of Hydrogen Peroxide Residues in Aseptically Packaged Beverages Using an Amperometric Sensor Based on a Palladium Electrode. Food Control 2008, 19, 223–230. [Google Scholar] [CrossRef]
  3. Bai, J.; Jiang, X. A Facile One-Pot Synthesis of Copper Sulfide-Decorated Reduced Graphene Oxide Composites for Enhanced Detecting of H2O2 in Biological Environments. Anal. Chem. 2013, 85, 8095–8101. [Google Scholar] [CrossRef]
  4. Yao, S.; Xu, J.; Wang, Y.; Chen, X.; Xu, Y.; Hu, S. A Highly Sensitive Hydrogen Peroxide Amperometric Sensor Based on MnO2 Nanoparticles and Dihexadecyl Hydrogen Phosphate Composite Film. Anal. Chim. Acta 2006, 557, 78–84. [Google Scholar] [CrossRef]
  5. Woo, Y.A.; Lim, H.R.; Kim, H.J.; Chung, H. Determination of Hydrogen Peroxide Concentration in Antiseptic Solutions Using Portable Near-Infrared System. J. Pharm. Biomed. Anal. 2003, 33, 1049–1057. [Google Scholar] [CrossRef]
  6. Ksibi, M. Chemical Oxidation with Hydrogen Peroxide for Domestic Wastewater Treatment. Chem. Eng. J. 2006, 119, 161–165. [Google Scholar] [CrossRef]
  7. Silva, R.A.B.; Montes, R.H.O.; Richter, E.M.; Munoz, R.A.A. Rapid and Selective Determination of Hydrogen Peroxide Residues in Milk by Batch Injection Analysis with Amperometric Detection. Food Chem. 2012, 133, 200–204. [Google Scholar] [CrossRef]
  8. King, D.W.; Cooper, W.J.; Rusak, S.A.; Peake, B.M.; Kiddle, J.J.; O’Sullivan, D.W.; Melamed, M.L.; Morgan, C.R.; Theberge, S.M. Flow Injection Analysis of H2O2 in Natural Waters Using Acridinium Ester Chemiluminescence: Method Development and Optimization Using a Kinetic Model. Anal. Chem. 2007, 79, 4169–4176. [Google Scholar] [CrossRef]
  9. Huang, X.; Nan, Z. Porous 2D FeS2 Nanosheets as a Peroxidase Mimic for Rapid Determination of H2O2. Talanta 2020, 216, 120995. [Google Scholar] [CrossRef]
  10. Dhara, K.; Mahapatra, D.R. Recent Advances in Electrochemical Nonenzymatic Hydrogen Peroxide Sensors Based on Nanomaterials: A Review. J. Mater. Sci. 2019, 54, 12319–12357. [Google Scholar] [CrossRef]
  11. Stone, J.R.; Yang, S.; Cadenas, E.; Keller, J.; Sen, C.K.; Yodoi, J. Hydrogen Peroxide: A Signaling Messenger. Antioxid. Redox Signal. 2006, 8, 243–270. [Google Scholar] [CrossRef] [PubMed]
  12. Spear, R.C.; Selvin, S. OSHA’s Permissible Exposure Limits: Regulatory Compliance Versus Health Risk. Risk Anal. 1989, 9, 579–586. [Google Scholar] [CrossRef] [PubMed]
  13. Forman, H.J.; Bernardo, A.; Davies, K.J.A. What Is the Concentration of Hydrogen Peroxide in Blood and Plasma? Arch. Biochem. Biophys. 2016, 603, 48–53. [Google Scholar] [CrossRef] [PubMed]
  14. Lyublinskaya, O.; Antunes, F. Measuring Intracellular Concentration of Hydrogen Peroxide with the Use of Genetically Encoded H2O2 Biosensor HyPer. Redox Biol. 2019, 24, 101200. [Google Scholar] [CrossRef] [PubMed]
  15. Sies, H. Hydrogen Peroxide as a Central Redox Signaling Molecule in Physiological Oxidative Stress: Oxidative Eustress. Redox Biol. 2017, 11, 613–619. [Google Scholar] [CrossRef]
  16. Varma, S.D.; Devamanoharan, P.S. Hydrogen Peroxide in Human Blood. Free Radic. Res. Commun. 1991, 14, 125–131. [Google Scholar] [CrossRef]
  17. Loukides, S.; Horvath, I.; Wodehouse, T.; Cole, P.J.; Barnes, P.J. Elevated Levels of Expired Breath Hydrogen Peroxide in Bronchiectasis. Am. J. Respir. Crit. Care Med. 1998, 158, 991–994. [Google Scholar] [CrossRef]
  18. Wierusz-Wysockaa, B.; Wysocki, H.; Byks, H.; Zozuliriska, D.; Wykrȩtowicz, A.; Kahnierczak, M. Metabolic Control Quality and Free Radical Activity in Diabetic Patients. Diabetes Res. Clin. Pract. 1995, 27, 193–197. [Google Scholar] [CrossRef]
  19. Nagaraja, C.; Shashibhushan, B.L.; Sagar; Asif, M.; Manjunath, P.H. Hydrogen Peroxide in Exhaled Breath Condensate: A Clinical Study. Lung India 2012, 29, 123–127. [Google Scholar] [CrossRef]
  20. Taher, M.M.; Lakshmaiah, N. Folic Acid Stability in Hydrogen Peroxide-Potassium Thiocyanate-Treated Milk. Food Chem. 1992, 44, 343–347. [Google Scholar] [CrossRef]
  21. Haddadin, M.S.; Ibrahim+, S.A.; Robinson, R.K. Preservation of Raw Milk by Activation of the Natural Lactoperoxidase Systems. Food Control 1996, 7, 149–152. [Google Scholar] [CrossRef]
  22. Bögner, D.; Bögner, M.; Schmachtl, F.; Bill, N.; Halfer, J.; Slater, M.J. Hydrogen Peroxide Oxygenation and Disinfection Capacity in Recirculating Aquaculture Systems. Aquac. Eng. 2021, 92, 102140. [Google Scholar] [CrossRef]
  23. Bopitiya, D.; Christensen, D.; Martin, M.; Zhang, J.; Bennett, L.E. Production of Hydrogen Peroxide in Formulated Beverages Is Associated with the Presence of Ascorbic Acid Combined with Selected Redox-Active Functional Ingredients. Food Chem. 2021, 338, 127947. [Google Scholar] [CrossRef] [PubMed]
  24. Giaretta, J.E.; Duan, H.; Oveissi, F.; Farajikhah, S.; Dehghani, F.; Naficy, S. Flexible Sensors for Hydrogen Peroxide Detection: A Critical Review. ACS Appl. Mater. Interfaces 2022, 14, 20491–20505. [Google Scholar] [CrossRef] [PubMed]
  25. Su, S.C.; Chou, S.S.; Chang, P.C.; Hwang, D.F. Identification of Hydrogen Peroxide as a Causative Agent in Noodles Implicated in Food Poisoning. J. Food Drug Anal. 2001, 9, 220–223. [Google Scholar] [CrossRef]
  26. Watt, B.E.; Proudfoot, A.T.; Vale, J.A. Hydrogen Peroxide Poisoning. Toxicol. Rev. 2004, 23, 51–57. [Google Scholar] [CrossRef] [PubMed]
  27. Gökçal, B.; Kip, Ç.; Şahinbaş, D.; Çelik, E.; Tuncel, A. Silica Microspheres Functionalized with the Iminodiacetic Acid/Copper(II) Complex as a Peroxidase Mimic for Use in Metal Affinity Chromatography-Based Colorimetric Determination of Histidine-Tagged Proteins. Microchim. Acta 2020, 187, 121. [Google Scholar] [CrossRef] [PubMed]
  28. Lu, J.; Zhang, H.; Li, S.; Guo, S.; Shen, L.; Zhou, T.; Zhong, H.; Wu, L.; Meng, Q.; Zhang, Y. Oxygen-Vacancy-Enhanced Peroxidase-like Activity of Reduced Co3O4 Nanocomposites for the Colorimetric Detection of H2O2 and Glucose. Inorg. Chem. 2020, 59, 3152–3159. [Google Scholar] [CrossRef]
  29. Ahammed, G.J.; Li, X.; Yang, Y.; Liu, C.; Zhou, G.; Wan, H.; Cheng, Y. Tomato WRKY81 Acts as a Negative Regulator for Drought Tolerance by Modulating Guard Cell H2O2–Mediated Stomatal Closure. Environ. Exp. Bot. 2020, 171, 103960. [Google Scholar] [CrossRef]
  30. Chen, M.; Liang, Z.; Zeng, G.; Wang, Y.; Mai, Z.; Chen, X.; Wu, G.; Chen, T. An ESIPT-Based NIR-Emitting Ratiometric Fluorescent Probe for Monitoring Hydrogen Peroxide in Living Cells and Zebrafish. Dye. Pigment. 2022, 198, 109995. [Google Scholar] [CrossRef]
  31. Ravanfar, R.; Abbaspourrad, A. Monitoring the Heme Iron State in Horseradish Peroxidase to Detect Ultratrace Amounts of Hydrogen Peroxide in Alcohols. RSC Adv. 2021, 11, 9901–9910. [Google Scholar] [CrossRef] [PubMed]
  32. Zhang, Y.; Bai, X.; Wang, X.; Shiu, K.K.; Zhu, Y.; Jiang, H. Highly Sensitive Graphene-Pt Nanocomposites Amperometric Biosensor and Its Application in Living Cell H2O2 Detection. Anal. Chem. 2014, 86, 9459–9465. [Google Scholar] [CrossRef]
  33. Yagati, A.K.; Choi, J.W. Protein Based Electrochemical Biosensors for H2O2 Detection Towards Clinical Diagnostics. Electroanalysis 2014, 26, 1259–1276. [Google Scholar] [CrossRef]
  34. Canbay, E.; Şahin, B.; Kiran, M.; Akyilmaz, E. MWCNT-Cysteamine-Nafion Modified Gold Electrode Based on Myoglobin for Determination of Hydrogen Peroxide and Nitrite. Bioelectrochemistry 2015, 101, 126–131. [Google Scholar] [CrossRef] [PubMed]
  35. Chen, A.; Chatterjee, S. Nanomaterials Based Electrochemical Sensors for Biomedical Applications. Chem. Soc. Rev. 2013, 42, 5425–5438. [Google Scholar] [CrossRef] [PubMed]
  36. Wang, Y.H.; Huang, K.J.; Wu, X. Recent Advances in Transition-Metal Dichalcogenides Based Electrochemical Biosensors: A Review. Biosens. Bioelectron. 2017, 97, 305–316. [Google Scholar] [CrossRef] [PubMed]
  37. Xiao, F.; Zhao, F.; Zhang, Y.; Guo, G.; Zeng, B. Ultrasonic Electrodeposition of Gold—Platinum Alloy Nanoparticles on Ionic Liquid—Chitosan Composite Film and Their Application in Fabricating Nonenzyme Hydrogen Peroxide Sensors. J. Phys. Chem. C 2009, 113, 849–855. [Google Scholar] [CrossRef]
  38. Zribi, R.; Ferlazzo, A.; Fazio, E.; Condorelli, M.; D’Urso, L.; Neri, G.; Corsaro, C.; Neri, F.; Compagnini, G.; Neri, G. Ag Nanoplates Modified-Screen Printed Carbon Electrode to Improve Electrochemical Performances Toward a Selective H2O2 Detection. IEEE Trans. Instrum. Meas. 2023, 72, 6002708. [Google Scholar] [CrossRef]
  39. Liu, J.; Yin, J.; Feng, B.; Xu, T.; Wang, F. Enhanced Electrocatalytic Activity and Stability toward the Oxygen Reduction Reaction with Unprotected Pt Nanoclusters. Nanomaterials 2018, 8, 955. [Google Scholar] [CrossRef]
  40. Yi, W.; Liu, J.; Chen, H.; Gao, Y.; Li, H. Copper/Nickel Nanoparticle Decorated Carbon Nanotubes for Nonenzymatic Glucose Biosensor. J. Solid State Electrochem. 2015, 19, 1511–1521. [Google Scholar] [CrossRef]
  41. Fernández, I.; Carinelli, S.; González-Mora, J.L.; Villalonga, R.; Salazar-Carballo, P.A. Nickel Oxide Nanoparticles/Carbon Nanotubes Nanocomposite for Non-Enzymatic Determination of Hydrogen Peroxide. Electroanalysis 2023, 35, e202200192. [Google Scholar] [CrossRef]
  42. Sobahi, N.; Imran, M.; Khan, M.E.; Mohammad, A.; Alam, M.M.; Yoon, T.; Mehedi, I.M.; Hussain, M.A.; Abdulaal, M.J.; Jiman, A.A. Electrochemical Sensing of H2O2 by Employing a Flexible Fe3O4/Graphene/Carbon Cloth as Working Electrode. Materials 2023, 16, 2770. [Google Scholar] [CrossRef] [PubMed]
  43. Xue, Y.; Maduraiveeran, G.; Wang, M.; Zheng, S.; Zhang, Y.; Jin, W. Hierarchical Oxygen-Implanted MoS2 Nanoparticle Decorated Graphene for the Non-Enzymatic Electrochemical Sensing of Hydrogen Peroxide in Alkaline Media. Talanta 2018, 176, 397–405. [Google Scholar] [CrossRef] [PubMed]
  44. Lyu, Y.P.; Wu, Y.S.; Wang, T.P.; Lee, C.L.; Chung, M.Y.; Lo, C.T. Hydrothermal and Plasma Nitrided Electrospun Carbon Nanofibers for Amperometric Sensing of Hydrogen Peroxide. Microchim. Acta 2018, 185, 371. [Google Scholar] [CrossRef] [PubMed]
  45. Qian, H.S.; Yu, S.H.; Gong, J.Y.; Luo, L.B.; Fei, L.F. High-Quality Luminescent Tellurium Nanowires of Several Nanometers in Diameter and High Aspect Ratio Synthesized by a Poly (Vinyl Pyrrolidone)—Assisted Hydrothermal Process. Langmuir 2006, 22, 3830–3835. [Google Scholar] [CrossRef] [PubMed]
  46. Lin, Z.H.; Yang, Z.; Chang, H.T. Preparation of Fluorescent Tellurium Nanowires at Room Temperature. Cryst. Growth Des. 2008, 8, 351–357. [Google Scholar] [CrossRef]
  47. Erande, M.B.; Late, D.J. Humidity and H2O2 Sensing Behavior of Te Nanowires. Adv. Device Mater. 2016, 2, 8–14. [Google Scholar] [CrossRef]
  48. Lee, T.I.; Lee, S.; Lee, E.; Sohn, S.; Lee, Y.; Lee, S.; Moon, G.; Kim, D.; Kim, Y.S.; Myoung, J.M.; et al. High-Power Density Piezoelectric Energy Harvesting Using Radially Strained Ultrathin Trigonal Tellurium Nanowire Assembly. Adv. Mater. 2013, 25, 2920–2925. [Google Scholar] [CrossRef]
  49. Liu, J.W.; Zhu, J.H.; Zhang, C.L.; Liang, H.W.; Yu, S.H. Mesostructured Assemblies of Ultrathin Superlong Tellurium Nanowires and Their Photoconductivity. J. Am. Chem. Soc. 2010, 132, 8945–8952. [Google Scholar] [CrossRef]
  50. Jin Bae, E.; Hun Kang, Y.; Jang, K.S.; Yun Cho, S. Enhancement of Thermoelectric Properties of PEDOT:PSS and Tellurium-PEDOT:PSS Hybrid Composites by Simple Chemical Treatment. Sci. Rep. 2016, 6, 18805. [Google Scholar] [CrossRef]
  51. Amani, M.; Tan, C.; Zhang, G.; Zhao, C.; Bullock, J.; Song, X.; Kim, H.; Shrestha, V.R.; Gao, Y.; Crozier, K.B.; et al. Solution-Synthesized High-Mobility Tellurium Nanoflakes for Short-Wave Infrared Photodetectors. ACS Nano 2018, 12, 7253–7263. [Google Scholar] [CrossRef] [PubMed]
  52. Shahzad, F.; Qamar, A.; Nabi, G. Self-Nucleated Tellurium Nanorods Patterned Growth: Their Applications for Excellent Field Emitters and Optical Devices. J. Lumin. 2023, 257, 119756. [Google Scholar] [CrossRef]
  53. Khatun, S.; Banerjee, A.; Pal, A.J. Nonlayered Tellurene as an Elemental 2D Topological Insulator: Experimental Evidence from Scanning Tunneling Spectroscopy. Nanoscale 2019, 11, 3591–3598. [Google Scholar] [CrossRef] [PubMed]
  54. Xie, Z.; Xing, C.; Huang, W.; Fan, T.; Li, Z.; Zhao, J.; Xiang, Y.; Guo, Z.; Li, J.; Yang, Z.; et al. Ultrathin 2D Nonlayered Tellurium Nanosheets: Facile Liquid-Phase Exfoliation, Characterization, and Photoresponse with High Performance and Enhanced Stability. Adv. Funct. Mater. 2018, 28, 1705833. [Google Scholar] [CrossRef]
  55. Nguyen, D.A.; Park, D.Y.; Jeong, B.G.; Tran, T.U.; Im, H.; Jeong, M.S. Facile and Controllable Preparation of Tellurium Nanocrystals by Laser Irradiation. Appl. Surf. Sci. 2022, 581, 152398. [Google Scholar] [CrossRef]
  56. Manikandan, M.; Dhanuskodi, S.; Maheswari, N.; Muralidharan, G.; Revathi, C.; Rajendra Kumar, R.T.; Mohan Rao, G. High Performance Supercapacitor and Non-Enzymatic Hydrogen Peroxide Sensor Based on Tellurium Nanoparticles. Sens. Biosens. Res. 2017, 13, 40–48. [Google Scholar] [CrossRef]
  57. Teodoro, K.B.R.; Migliorini, F.L.; Christinelli, W.A.; Correa, D.S. Detection of Hydrogen Peroxide (H2O2) Using a Colorimetric Sensor Based on Cellulose Nanowhiskers and Silver Nanoparticles. Carbohydr. Polym. 2019, 212, 235–241. [Google Scholar] [CrossRef]
  58. Baluta, S.; Meloni, F.; Halicka, K.; Szyszka, A.; Zucca, A.; Pilo, M.I.; Cabaj, J. Differential Pulse Voltammetry and Chronoamperometry as Analytical Tools for Epinephrine Detection Using a Tyrosinase-Based Electrochemical Biosensor. RSC Adv. 2022, 12, 25342–25353. [Google Scholar] [CrossRef]
  59. Sanjay Kanna Sharma, T.; Jana, J.; Bhamu, K.C.; Song, J.; Sivaselvam, S.; Van Tam, T.; Kang, S.G.; Chung, J.S.; Hur, S.H.; Choi, W.M. Rational Synthesis of Alkaline Earth Metal Vanadates: Structural Origin of MgVO3 Honeycomb Lattice System and Its Electrochemical Analysis for the Detection of Sulfadiazine. Chem. Eng. J. 2023, 464, 142673. [Google Scholar] [CrossRef]
  60. Tsai, H.Y.; Lin, Z.H.; Chang, H.T. Tellurium-Nanowire-Coated Glassy Carbon Electrodes for Selective and Sensitive Detection of Dopamine. Biosens. Bioelectron. 2012, 35, 479–483. [Google Scholar] [CrossRef]
  61. Chirizzi, D.; Guascito, M.R.; Filippo, E.; Malitesta, C.; Tepore, A. A Novel Nonenzymatic Amperometric Hydrogen Peroxide Sensor Based on CuO@Cu2O Nanowires Embedded into Poly(Vinyl Alcohol). Talanta 2016, 147, 124–131. [Google Scholar] [CrossRef] [PubMed]
  62. Guascito, M.R.; Chirizzi, D.; Malitesta, C.; Mazzotta, E.; Siciliano, M.; Siciliano, T.; Tepore, A.; Turco, A. Low-Potential Sensitive H2O2 Detection Based on Composite Micro Tubular Te Adsorbed on Platinum Electrode. Biosens. Bioelectron. 2011, 26, 3562–3569. [Google Scholar] [CrossRef] [PubMed]
  63. Guascito, M.R.; Chirizzi, D.; Malitesta, C.; Siciliano, T.; Tepore, A. Te Oxide Nanowires as Advanced Materials for Amperometric Nonenzymatic Hydrogen Peroxide Sensing. Talanta 2013, 115, 863–869. [Google Scholar] [CrossRef] [PubMed]
Figure 1. Schematic of the hydrothermal synthesis protocol for 2D Te nanosheets and electrode fabrication.
Chemosensors 12 00017 g001
Figure 2. Optical image from (a) optical microscope and, (b) Raman microscope. (c) AFM image, (d) height profile from AFM, (e) Raman spectrum, and (f) PL spectrum of Te nanosheets.
Chemosensors 12 00017 g002
Figure 3. (a) CV scans of blank GC, blank Te-GC, and Te-GC in the presence of 0.2 μM H2O2, (b) CV scans, and (c) DPV scans at different concentrations of H2O2 in 1X PBS solution. (d) Plot of the DPV peak current with respect to the H2O2 concentration. The red lines are the linear fits in the two different regions, while the black dots are the peak current values from the DPV measurements. Insets: values and standard deviations of the slope and the intercept at the y-axis.
Chemosensors 12 00017 g003
Figure 4. Chronoamperometric response of the electrode (a,b) in the presence of different interferants and (c) at different concentrations of H2O2 in PBS solution. The arrows indicate the successive addition of H2O2 of the indicated concentration.
Chemosensors 12 00017 g004
Figure 5. (ac) DPV measurements using urine samples diluted with PBS. (d) Evaluated amounts of H2O2 corresponding to DPV measurements (a,c) and correlated to the calibration plot in Figure 3d.
Chemosensors 12 00017 g005
Disclaimer/Publisher’s Note: The statements, opinions and data contained in all publications are solely those of the individual author(s) and contributor(s) and not of MDPI and/or the editor(s). MDPI and/or the editor(s) disclaim responsibility for any injury to people or property resulting from any ideas, methods, instructions or products referred to in the content.

